1 photo-induced phase transition in rbmnfe prussian blue analog
TRANSCRIPT

1
Photo-Induced Phase Transition in RbMnFePrussian Blue Analog-Based Magnet
H. Tokoro and S. Ohkoshi
1.1 Introduction
Studies that are related to temperature-induced phase transitions and photo-induced phase transitions are extensively investigated in solid-state chem-istry [1–4]. Temperature-induced phase transition phenomena are observed inspin crossover or intramolecular electron transfer. In a spin crossover com-plex, a transition metal ion can be in either the low-spin or the high-spinstate depending on the strength of the ligand field. When the thermal en-ergy is close to the exchange energy that corresponds to the crossover, aspin transition occurs between the two spin states. This phenomenon is ob-served in octahedral coordinate iron transition metal complexes [5–7]. Charge-transfer phase transitions have been observed in mixed-valence complexes[7–13], e.g., [MIII
2MIIO(O2C2H3)6L3] (M= Fe, Mn; L=H2O, pyridine) [12]and M(dta)4I(M= Ni, Pt; dta= dithioacetato) [13]. Charge-transfer phasetransitions that accompany spin crossovers have also been reported, e.g.,Co(py2X)(3, 6 − DBQ)2 (X= O, S, Se) [14] and Na0.4Co1.3[Fe(CN)6] · 4.9H2O[15]. A temperature-induced phase transition often accompanies a thermalhysteresis loop, which is related to the cooperativity of the correspondingsystem. The cooperativity in a metal complex assembly is due to the in-teraction between a metal ion and lattice strain, e.g., an electron-phononcoupling [16], a Jahn–Teller distortion [17], and an elastic interaction [18].Cyano-bridged metal assemblies such as hexacyanometalate- [4, 19–38] andoctacyanometalate-based magnets [39–44] are suitable for observing a ther-mal phase transition since they are mixed-valence compounds that have astrong cooperativity due to the CN ligand bridges.
To date, several types of photo-induced phase-transition phenomena havebeen reported, for example, a light-induced crystalline-amorphous transfor-mation in chalcogenide material [45–47], a light-induced spin-state changeon the transition metal ion of a metal complex [3, 48, 49], a light-inducedcharge transfer in donor-accepter stacked molecules [2, 50, 51], ferromagneticbimetallic assemblies [35–44], or perovskite manganite [52, 53]. Until now,

2 H. Tokoro and S. Ohkoshi
we have demonstrated photomagnetic effects such as photo-induced magne-tization and the photo-induced magnetic pole inversion with cyano-brigedbimetallic assemblies [4, 35, 38–44]. One possible method for achieving opti-cal control of magnetization is to change the electron spin state of a magneticmaterial. For example, if photo-irradiation varies the oxidation numbers oftransition metal ions within a magnetic material, its magnetization will becontrolled. The bistability of the electronic states is also indispensable for ob-serving photo-induced persistent magnetization since the energy barrier be-tween these bistable states can maintain the photo-produced state even afterphoto-irradiation is ceased.
From this viewpoint, Prussian blue analogs are an attractive system dueto their high Tc values [22]. In particular, Verdaguer et al. reported thatVII[CrIII(CN)]0.86 · 2.8H2O exhibits a Tc value of 315 K [24]. Successively,Girolami et al. and Miller et al. reported crystalline KIVII[CrIII(CN)6] withTc = 103◦C and amorphous KI
0.058VII/III[CrIII(CN)6]0.79(SO4)0.058 · 0.93H2O
with Tc = 99◦C powder, respectively [27, 28]. In multi-metal Prussianblue analogs, the rational design of magnets based on the molecular fieldtheory is possible for the following reasons: (1) metal substitutions in-duce only small changes in the lattice constant and (2) superexchangeinteractions are only essentially effective between the nearest neighbormetal ions [25]. For example, we have designed a novel type of mag-net that exhibits two compensation temperatures with the system of(NiII0.22MnII
0.60FeII0.18)1.5[CrIII(CN)6] · 7.5H2O i.e., the spontaneous magne-
tization changes sign twice as the temperature is varied [29]. In this study,we show the temperature-induced phase transition and photo-induced phasetransition of ferromagnetic RbxMn[Fe(CN)6](x+2)/3 · zH2O complex.
1.2 Synthesis of Rubidium Manganese Hexacyanoferrate
Preparing method of rubidium manganese hexacyanoferrate,RbxMn[Fe(CN)6](x+2)/3 · zH2O, is as follows: an aqueous solution (0.1 moldm−3) of MnIICl2 with a mixed aqueous solution of RbICl (1 mol dm−3)and K3[FeIII(CN)6] (0.1 mol dm−3) was reacted to yield a precipitate. Theprecipitate was filtered, dried, and yielded a powdered sample. The preparedcompound was a light brown and elemental analyses for Rb, Mn, and Feindicated that the obtained precipitate had a formula of RbMn[Fe(CN)6](x = 1, z = 0). The 1: 1: 1 ratio of Rb: Mn: Fe allowed the Mn i ons tocoordinate six cyanonitrogens. Consequently, the network does not containwater molecules. Scanning electron microscope (SEM) images showed thatthe obtained powdered sample was composed of cubic microcrystals thatwere 2.1 ± 1.1 m. For the sample of different x, the sample was preparedby reacting an aqueous solution (0.1 mol dm−3) of MnIICl2 with a mixedaqueous solution of RbIC (0.05–1 mod dm−3) and K3[FeIII(CN)6] (0.1 moldm−3). The schematic structure of RbxMn[Fe(CN)6](x+2)/3 · zH2O is shownin Fig. 1.1.

1 Photo-Induced Phase Transition 3
Fig. 1.1. Schematic structures of (a) RbIMnII[FeIII](CN)6 and (b) RbIxMnII
[FeIII(CN)6](x+2)/3 · zH2O. Large gray circle is RbI ion, middle black circle is MnII
ion, middle gray circle is FeIII ion, small gray circle is C atom, and small white cir-cle is N atom, respectively. Shadows indicate defects at the FeIII(CN)6 sites. Watermolecules are omitted for clarity
1.3 Crystal Structure of Rubidium ManganeseHexacyanoferrate
To study the crystal structure of rubidium manganese hexacyanoferrate, X-ray single crystal analysis was performed for Rb0.61Mn[Fe(CN)6]0.87 · 1.7H2O[54]. Crystal was obtained by the slow diffusion of MnCl2 (7 × 10⁻³ moldm−3) dissolved in ethanol into K3[Fe(CN)6] (3 × 10⁻³mol dm−3) and RbCl(1.4×10⁻² mol dm−3) dissolved in water for three month. The obtained singlecrystals measured approximately 0.1× 0.1× 0.05 mm3. Elemental analysis ofRb, Mn, and Fe of the single crystal was performed by microscopic fluores-cent X-ray analysis (micro-FXA) with an X-ray spot size of ϕ 10 μm. Theobserved ratio of metal ions was Rb:Mn:Fe = 0.58(± 0.04) : 1.00(± 0.03) :0.86(± 0.03). The density (d) measured by the flotation method (tetrabro-moethane and toluene) showed d = 1.84(3) g cm3. These results of micro-FXA and density measurements showed that the formula of the crystal wasRbI
0.61MnII[FeIII(CN)6]0.87 · 1.7H2O. Crystal data was collected on a RigakuRAXIS RAPID imaging plate area detector with graphite monochromatedMo-Ka radiation.
The present single crystal , Rb0.61Mn[Fe(CN)6]0.87 · 1.7H2O, contains anintermediate composition value of 0.61 for Rb+. This compound has vacanciesof 0.13 × [Fe(CN)6] in the cubic lattice to maintain charge neutrality . Itis expected that the Mn ion around the vacancy is coordinated to a watermolecule (so-called ligand water ) and the interstitial sites are occupied byRb ions or non-coordinated waters (so-called zeolitic water molecules).
X-ray crystallography shows that RbI0.61MnII[FeIII(CN)6]0.87 · 1.7H2O be-
longs to the face-centered cubic lattice Fm3m with lattice constants of
4 H. Tokoro and S. Ohkoshi
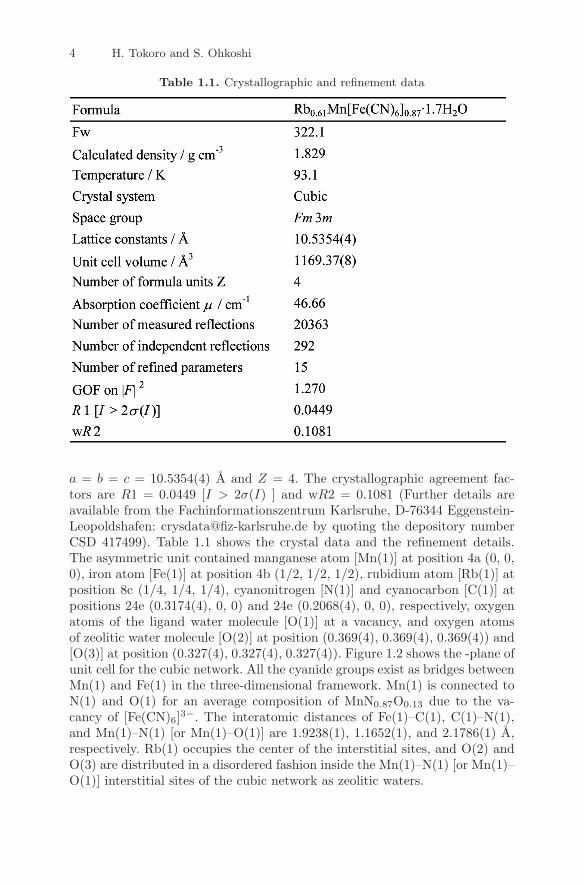
Table 1.1. Crystallographic and refinement data
a = b = c = 10.5354(4) A and Z = 4. The crystallographic agreement fac-tors are R1 = 0.0449 [I > 2σ(I) ] and wR2 = 0.1081 (Further details areavailable from the Fachinformationszentrum Karlsruhe, D-76344 Eggenstein-Leopoldshafen: [email protected] by quoting the depository numberCSD 417499). Table 1.1 shows the crystal data and the refinement details.The asymmetric unit contained manganese atom [Mn(1)] at position 4a (0, 0,0), iron atom [Fe(1)] at position 4b (1/2, 1/2, 1/2), rubidium atom [Rb(1)] atposition 8c (1/4, 1/4, 1/4), cyanonitrogen [N(1)] and cyanocarbon [C(1)] atpositions 24e (0.3174(4), 0, 0) and 24e (0.2068(4), 0, 0), respectively, oxygenatoms of the ligand water molecule [O(1)] at a vacancy, and oxygen atomsof zeolitic water molecule [O(2)] at position (0.369(4), 0.369(4), 0.369(4)) and[O(3)] at position (0.327(4), 0.327(4), 0.327(4)). Figure 1.2 shows the -plane ofunit cell for the cubic network. All the cyanide groups exist as bridges betweenMn(1) and Fe(1) in the three-dimensional framework. Mn(1) is connected toN(1) and O(1) for an average composition of MnN0.87O0.13 due to the va-cancy of [Fe(CN)6]3−. The interatomic distances of Fe(1)–C(1), C(1)–N(1),and Mn(1)–N(1) [or Mn(1)–O(1)] are 1.9238(1), 1.1652(1), and 2.1786(1) A,respectively. Rb(1) occupies the center of the interstitial sites, and O(2) andO(3) are distributed in a disordered fashion inside the Mn(1)–N(1) [or Mn(1)–O(1)] interstitial sites of the cubic network as zeolitic waters.

1 Photo-Induced Phase Transition 5
Fig. 1.2. Crystal structure for Rb0.61Mn[Fe(CN)6]0.87 · 1.7H2O. The projection inthe -plane (cubic,Fm3m). Spheres and ellipsoids are drawn at a 50% probabilitylevel. All H atoms are omitted for clarify. Occupancies are 0.305 for Rb(1), 1.00 forMn(1), 0.87 for Fe(1), 0.87 for C(1), 0.87 for N(1), 0.13 for O(1), 0.0528 for O(2),and 0.0624 for O(3), respectively
1.4 Temperature-Induced Phase Transition
1.4.1 Phase Transition Phenomenon in Magnetic Susceptibility
Figure 1.3 shows the product of the molar magnetic susceptibility (χM) andthe temperature (T ) vs. T plots of RbMn[Fe(CN)6]. The χMT value in thehigh-temperature (HT) phase is 4.67 cm3 K mol−1 at 330 K, but cooling thesample at a cooling rate of 0.5 K min−1 decreases the χMT value around235 K and at T = 180 K in the low-temperature (LT) phase reaches 3.19cm3 K mol−1. Conversely, as the sample in the LT phase is warmed at aheating rate of 0.5 K min−1, the χMT value suddenly increases near 285 Kand reaches the HT phase value at 325 K. The transition temperatures fromHT to LT (T1/2↓) and from LT to HT (T1/2↑) are 225 and 300 K, respectively,and the width of the thermal hysteresis loop (ΔT = T1/2↑ − T1/2↓) is 75 K.This temperature-induced phase transition is repeatedly observed [55, 56].
1.4.2 Change in Electronic State
X-ray photoelectron spectroscopy (XPS) spectra of KI3[FeIII(CN)6],
KI4[FeII(CN)6] and the HT and LT phases were measured. In the HT phase,
the Fe–2P3/2 and Mn–2P3/2 electron binding energies are 710.1 and 641.8 eV,respectively, and in the LT phase, the Fe–2P3/2 and Mn–2P3/2 electron bind-ing energies are 708.8 and 642.5 eV, respectively. The observed Fe–2P3/2
electron binding energy of 710.1 eV in the HT phase corresponds to that of

6 H. Tokoro and S. Ohkoshi
Fig. 1.3. The observed χMT − T plots under 5000Oe with the first measurement(black circles), second measurement (white circles), and third measurement (gay cir-cles). The down and up arrows indicate cooling and warming processes, respectively
Fig. 1.4. Temperature dependence of the CN stretching frequencies in the IR spec-tra with cooling process
710.0 eV for FeIII in KI3[FeIII(CN)6]. In contrast, Fe–2P3/2 binding energy of
708.8 eV in the LT phase is close to that of 709.1 eV for FeII in KI4[FeII(CN)6].
The shift of the Mn–2P3/2 binding energy from the HT to the LT phases sug-gests that the oxidation number of the Mn ion increases from II to III.
Between 300 and 10 K, the infrared (IR) spectra are recorded. Figure 1.4shows the CN− stretching frequencies at 300, 240, 220, 200, and 10 K. At300 K, a sharp CN− peak is observed at 2152 cm−1 (linewidth= 9 cm−1)and as the temperature decreases, the intensity of this peak decreases. Near220 K a new broad peak appears at 2095 cm−1 (linewidth= 65 cm−1). TheseIR changes are in the same temperature range of the phase transition in theχMT −T plots. The CN stretching peak at 2152 cm−1 in the HT phase is due

1 Photo-Induced Phase Transition 7
Fig. 1.5. Real (ε′) and imaginary (ε′′) parts of the dielectric constant (ε) spectra inthe (a) HT phase and (b) LT phase. Gray and black lines represent the and parts,respectively
to the CN ligand bridged to MnII and FeIII ions (MnII-NC-FeIII). In contrast,the broad CN stretching peak at 2095 cm−1 in the LT phase is assigned tothe CN ligand bridged to MnIII and FeII ions ( MnIII-NC-FeII).
These XPS and IR spectra show that valence states for Mn and Feions in the HT phase are MnII(d5) and FeIII(d5), respectively, and thosein the LT phase are MnIII(d4) and FeII(d6), respectively. The drop in theχMT value at T1/2↓ implies that the electronic states of the HT and LTphases are MnII(d5;S = 5/2)−NC − FeIII(d5;S = 1/2) and MnIII(d4;S =2)−NC − FeII(d6;S = 0), respectively. These assignments are confirmed byMn and Fe 3p-1s X-ray emission spectroscopy [57] and 1s X-ray absorptionspectroscopy [58].
Figure 1.5a shows the real (ε′) and imaginary (ε′′) parts of the dielectricconstant (ε)spectrum of the HT phase at 293 K, measured by spectroscopicellipsometry [59]. A dispersive-shaped line, which was centered at 410 nm, wasobserved. In the corresponding position, an absorption-shaped peak was ob-served in the ε′′ spectrum at 410 nm with ε′′ = 0.13. This peak is assignedto the ligand-to-metal charge transfer (LMCT) transition of [Fe(CN)6]3−
(2T2g →2 T1u,CN− → FeIII). Figure 1.5b shows the ε′ and ε′′ parts of theε spectrum in the LT phase. The LT phase was obtained by slowly coolingto 160 K using N2 vapor, and then measuring ε at 275 K. A large dispersive-shaped line, which was centered at 470 nm with a minimum value at 420 nmand a maximum at 540 nm, was observed in the ε′ spectrum. The correspond-ing position in the ε′′ spectrum showed a strong absorption-shaped peak ofε′′ = 0.68, which is assigned to the metal-to-metal charge transfer (MM’CT)band of FeII → MnIII (more accurately, CN2px,CN2py →Mn3dx2−y2 ,Mn3dz2).
1.4.3 Structural Change
Figure 1.6 shows the powder X-ray diffraction (XRD) patterns as the tem-perature decreased from 300, 240, 220 to 160 K. The diffraction pattern ofthe HT phase is consistent with a face-centered cubic (F43m) structure witha lattice constant of 10.533 A(at 300 K). As the sample is cooled, the XRD

8 H. Tokoro and S. Ohkoshi
Fig. 1.6. Temperature dependences of XRD spectra (* indicates Cu from the sampleholder)
Electron transfer+
Jahn-Teller distortion on Mn (III)
-NC-
S = 1/2S = 5/2
FeIIILSMnII HS
egt2g
eg
t2g- -
IIIII
egt2g
eg
t2g-NC-
S = 0S = 2
FeII LSMnIIIHSb1g
b2g
a1g
eg
a1g
eg
b1g
b2g
LT phase: Tetragonal HT phase: Cubic
Fig. 1.7. Electronic states of the LT and HT phases
peaks of the HT phase decrease and different peaks appear. The observedXRD pattern in the LT phase shows a tetragonal structure of I4m2 with a =b = 7.090 A and c = 10.520 A (at 160 K), which corresponds to a = b = 10.026A and c = 10.520 A in a cubic lattice. The unit cell volume of 1169 A3 inthe HT phase is reduced about 10% to 11,057 A3 in the LT phase and warm-ing caused the tetragonal structure to return to the cubic one. This structuralchange from cubic to tetragonal in the XRD measurement is understood by theMn
IIIJahn–Teller transformation of the tetragonally octahedral elongation-
type (B1g oscillator mode). Synchrotron radiation X-ray powder structuralanalysis was used to determine the precise bond lengths of the LT phase, i.e.,two-long and four-short Mn–N bond distances are 2.26(2) and 1.89(3) A, re-spectively, and the two-short and four-long Fe–C bond distances are 1.89(2)and 2.00(3), respectively [60]. Thus, the d -orbital symmetry of both metalions in the LT phase is D4th (a1g,b1g,b2g,and eg). Therefore, the precise elec-tronic state of LT phase is MnIII(eg
2b2g1a1g
1;S = 2)–NC–FeII(b2g2eg
4;S=0)(Fig. 1.7).

1 Photo-Induced Phase Transition 9
Fig. 1.8. The schematic free energy surfaces of this system in mixed-valence (blackcurve) and Jahn–Teller (gray curve) modes: (a) the ground state is MnIII − FeII andthe meta-stable state is MnII − FeIII at T = 0 K, (b) T = 263 K (=Ttrans), (c) theground state is MnII − FeIII and meta-stable state is MnIII − FeII at T = 400 K. Grayspheres indicate population
1.4.4 Mechanism
Prussian blue analogs belong to class II mixed-valence compounds. This sys-tem is described by two parabolic potential-energy curves due to valenceisomers in the nuclear coordinates of the coupled vibrational mode [8–11].When these two vibronic states interact, the ground state surface has twominima in the vibrational coordinates (Fig. 1.8). In the present system, theMnIII − FeII vibronic state is a ground state at T = 0 K in the vibrationalcoordinates (mixed-valency mode) (black curve in Fig. 1.8a). Moreover, inthis situation, MnIII causes Jahn–Teller distortion, and then the energy ofthe MnIII − FeII has two minima described in the configurational coordinates(Jahn–Teller mode) (gray curve in Fig. 1.8a). In the present system, MnIII ionshows an enlongation-type Jahn–Teller distortion. These potential surfaceschange as the temperature increases, which cause a phase transition.
1.5 Ferromagnetism of the Low-Temperature Phase
1.5.1 Magnetic Ordering and Heat Capacity
When the LT phase is cooled to a very low temperature under an externalmagnetic field of 10 Oe, it exhibits spontaneous magnetization with a Curietemperature (Tc) of 11.3 K (Fig. 1.9a). The magnetization as a function ofthe external magnetic field at 3 K indicates that the saturated magnetization(M s) value is 3.6 μB and the coercive field (Hc) value is 1050 G (Fig. 1.9b).The χM
−1 − T plots of the paramagnetic LT phase show positive Weiss tem-peratures (Θ) between 12 and 15 K, which are obtained by extrapolating the

10 H. Tokoro and S. Ohkoshi
Fig. 1.9. (a) Magnetization vs. temperature plots of the LT phase by SQUIDmeasurement: (•) Field-cooled magnetization (FCM) at 10Oe, and (◦) zero field-cooled magnetization (ZFCM) at 10Oe. (b) Magnetic hysteresis loop of the LTphase at 3K. (c) The observed χM − T plots. The data between 150 and 270 K isfitted to Curie-Weiss plots (–)
data in the temperature region of 150–270 K, respectively [61]. In low temper-ature region, the Cp value gradually increases with temperature and reachesa maximum, 27.1 J K−1 mol−1 at 11.0 K (denoted here as T p), as shown inFig. 1.10a. Then it drops suddenly to 17.5 J K−1 mol−1, and increases gradu-ally. The dependence of the Cp values on the external magnetic field is shownin Fig. 1.10b and c, where the T p peaks shift to a higher temperature as theexternal magnetic field increases: T p = 11.0 K (= 0 T ), 11.0 K (0.05 T ),11.2 K (0.10 T ), 11.3 K (0.20 T ), 11.4 K (0.30 T ), 11.5 K (0.50 T ), 11.9 K(1.00 T ), 13.8 K (2.00 T ), and 15.2 K (3.00 T ).
1.5.2 Entropy and Enthalpy of Magnetic Phase Transition
Because RbMn[Fe(CN)6] is an insulating magnetic system, the Cp value isdescribed as a sum of the contributions from lattice vibration, C lat, short-range magnetic ordering,Cshort, and long-range magnetic ordering, C long :
Cp = C lat + Cshort + C long. (1.1)
C lat is described by a polynomial function of temperature with odd powers[62],
C lat = aT 3 + bT 5 + cT 7 + dT 9 + eT 11 + · · · , (1.2)
and Cshort is described by AT−2 [63]. We fitted the Cp data in the re-gion between 15 K (= 1.4 × T c) and 30 K (= 2.7 × T c) by the con-tributions of C lat+Cshort, using analyses reported in other systems [64].The derived coefficients, including the estimated uncertainties (±7.4%) fromthe experiment (±7.0%) and curve fitting (±2.3%), are as follows: a =8.08×10⁻³J K−4 mol−1, b = −2.10×10⁻⁵J K−6 mol−1, c = 2.56×10⁻⁸J K−8
mol−1, d = −1.18 × 10⁻¹¹J K−10mol−1, and A = 1130J K mol−1. The

1 Photo-Induced Phase Transition 11
Fig. 1.10. (a) Plots of Cp vs. T in a zero external magnetic field: (•) experimentaland (–) derived C lat curve based on (1.3). (b) Plots of Cp vs. T in the presence ofan external magnetic field. (c) Enlarged plots of (b)
solid line in Fig. 1.10a shows the C lat curve. The magnetic heat capacity ,Cmag = Cshort + C long, is obtained by subtracting C lat from Cp, as shown inFig. 1.11. The magnetic transition entropy, ΔSmag, and enthalpy, ΔHmag,can be obtained from
ΔSmag =∫ T
0
CmagdlnT (1.3)
and
ΔHmag =∫ T
0
CmagdT. (1.4)
The estimated values of ΔSmag and ΔHmag for RbIMnIII[FeII(CN)6] are11.8 ± 0.9J K−1mol−1 and 125 ± 9 J mol−1, respectively.

12 H. Tokoro and S. Ohkoshi
Fig. 1.11. Plots of Cmag vs. log T
1.5.3 Long-Range Magnetic Ordering and Exchange Coupling
The T p value of 11.0 K agrees with the TC value of 11.3 K derived froma SQUID measurement, then, the anomalous peak at can be ascribed to amagnetic phase transition. The ΔSmag value of 11.8±0.9 J K−1mol−1 is closeto the value calculated for the ordering of magnetic spins on the MnIII(S = 2)sites for RbIMnIII[FeII(CN6)] given by Rln(2S+1)=13.4 J K−1mol−1, whereR is the gas constant. Thus, the origin of this magnetic phase transition isattributed to the long-range magnetic ordering of the MnIII sites.
The dimensionality of magnetic ordering, i.e., two- or three-dimensional (2-or 3-D) magnetic lattice, can be determined by the temperature dispersion ofΔSmag. When the value of ΔSmag is divided into two terms, such as the mag-netic entropy values below T p (ΔSmag−lower) and above T p (ΔSmag−upper),the ratio of ΔSmag−lower / ΔSmag for the magnetic lattices of the 3-D Ising,2-D Ising, and 3-D Heisenberg types are 81, 44, and 62%, respectively [65].The ratio of ΔSmag−lower / ΔSmag in the present system is 65(3)% (Fig. 1.11).Therefore, in this framework the magnetic ordering of the LT phase is mostlikely 3-D Heisenberg-type magnetic ordering.
To analyzing Cmag at very low temperatures using the spin-wave theorycan determine if the long-range magnetic ordering of a target material isferromagnetic or antiferromagnetic. The heat capacity due to the spin-waveexcitation,CSW, is expressed by [66]:
CSW = αTdn , (1.5)
where d stands for the dimensionality of the magnetic lattice and n is theexponent in the dispersion relationship: n = 1 for antiferromagnets and n =

1 Photo-Induced Phase Transition 13
Fig. 1.12. Experimental plots of Cmag (◦) and the CSW curve (–) calculated fromthe spin-wave theory for a 3-D ferromagnet using (1.6) with d/n = 1.51 and α =0.17J K−5/2mol−1
2 for ferromagnets. We fitted the Cmag values in the region between 2.8 and4.7 K to (1.5) (Fig. 1.12) and the estimated parameter of d/n is 1.51(11). Thisd/n value is consistent with that predicted for the magnetic ordering of theLT phase, i.e., the 3-D ferromagnet, where d = 3 and d = 2. The observedshifts in the T p values of the in-field Cp data, 11.0 K (0 T ) → 15.2 K (3.00T ) displayed in Fig. 1.10b and c, which also suggest ferromagnetic character.Since the shift in T p to higher temperatures is characteristic of ferromagnetictransitions [67], the trend of the in-field Cp values observed in the presentstudy gives direct evidence that the magnetic ordering of the LT phase isferromagnetic.
This system shows a 3-D Heisenberg-type ferromagnetic ordering, althoughdiamagnetic FeII is bridged to MnIII in an alternating fashion. The exchangecoupling constant, J , of this ferromagnet can be evaluated in the followingmanner. The α value derived from (1.5) is related to the J value. In CSW fora 3-D ferromagnet, the coefficient α is described by [68]:
α =1√2
5Rζ(5/2)Γ (5/2)16π2S3/2
(kB
J
)3/2
, (1.6)
where ζ is Riemann’s zeta function, Γ is Euler’s gamma function, and kB is theBoltzmann constant. Since the α value obtained from (1.5) is 0.17(1)J K−5/2
mol−1, the estimated J value based on (1.6) is +0.55(4) cm−1. ΔHmag is alsorelated to the J value in an extension of the molecular-field theory. In thistreatment, ΔHmag due to long-range magnetic ordering is expressed by
ΔHmag
R=
S2zJ
kB, (1.7)

14 H. Tokoro and S. Ohkoshi
where the number of neighboring magnetic sites, z, is 6 in the present sys-tem. The estimated J value from (1.7), using ΔHmag = 125 ±9 Jmol−1 is+0.44(3) cm−1.
1.5.4 Mechanism of Magnetic Ordering
Application of the superexchange interaction mechanism to the present fer-romagnetic ordering is difficult since the diamagnetic FeII sites are con-nected by paramagnetic MnIII sites. One plausible mechanism is the valencedelocalization mechanism, in which ferromagnetic coupling arises from thecharge-transfer configuration [69]. Day et al. explained the ferromagnetism ofFeIII[FeII(CN)6]0.75 · 3.5H2O by the ferromagnetic exchange interaction basedon a partial delocalization of the electrons that occupy the FeIIt2g orbitalsnext to the neighboring high-spin FeIII sites. Since FeIII in Prussian blue isreplaced with MnIII, the same mechanism is feasible in our system. In fact,an intense intervalence transfer (IT) band of the LT phase has been observedat 540 nm and in the IT band of Prussian blue. In the valence delocalizationmechanism, the T c value is related to the valence delocalization coefficient ofc as T c ∝ c4. The c value is given by second-order perturbation theory as
c =∑
i=2,3
(〈ψ0|H|ψi〉〈ψ1|H|ψi〉/(E1 − E0)(Ei − E0)) , (1.8)
where ψ0, ψ1, ψ2, and ψ3 are the ground (pure MnIII − FeII) state and thecharge-transfer configurations of FeII → MnIII, FeII → CN, and CN → MnIII,respectively, and E0 − E3 are their energies. Mixing these excited charge-transfer configurations with the ground state causes the ferromagnetic ex-change coupling. The J value of ≈+0.5 cm−1 in the present system is threetimes larger than that of +1.5 cm−1 in Prussian blue. This large J valuemeans that RbIMnIII[FeII(CN)6] has a large c value. Namely, the electrons onthe FeII site are delocalized to the MnIII site.
1.6 Control of Temperature-Induced Phase Transition
1.6.1 Huge Thermal Hysteresis Loop and a Hidden Stable Phase
Rb0.64Mn[Fe(CN)6]0.88 · 1.7H2Owas prepared by reacting an aqueous solution(0.1 mol dm−3) of MnCl2 with a mixed aqueous solution of RbCl (1.0 moldm−3) and K3[Fe(CN)6] (0.1 mol dm−3). The mixed solution was stirred for5 min and the precipitate was filtered, yielding a light brown powder. TheSEM image indicates that the precipitate is rectangular with the size of 0.3 ±0.1 μm. The IR peak is observed at 2153 cm−1 at 300 K, which is assigned tothe CN group of FeIII − NC − MnII, i.e., the electronic state of the preparedcompound is RbI
0.64MnII[FeII(CN)6]0.88 · 1.7H2O.

1 Photo-Induced Phase Transition 15
Fig. 1.13. The observed χMT vs. T plots for Rb0.64Mn[Fe(CN)6]0.88 · 1.7H2O under5000 Oe with cooling and warming by ± 0.5 K min−1
The magnetic properties were measured using a SQUID magnetometer.Figure 13 shows the product of the χMT vs. T plots. The χMT value decreasesaround 165 K (= T1/2↓) as the sample is cooled at a cooling rate of –0.5 Kmin−1. Conversely, as the sample is warmed at a warming rate of +0.5 Kmin−1, the χMT value increases around 303 K (= T1/2↑) and returns to theinitial value. The thermal hysteresis value (ΔT ≡ T1/2↑−T1/2↓) is surprisinglylarge, 138 K. In addition, the χM value of the rapidly cooled sample, i.e.,the sample placed directly into a sample chamber at 10 K, was measured.The rapidly cooled sample shows a high χMT value even at low temperature(hereafter called the hidden stable phase), which nearly corresponds to thevalue extrapolated from the HT phase, and then relaxes to the χMT value oflow-temperature (LT) phase around 114 K (= T SP↓) (Fig. 1.14a). Since theχM
−1 vs. T plots of the HT and LT phases are nearly linear as a function ofT , these plots are fitted by the Curie-Weiss law and the Weiss temperatures ofthe HT and LT phases, which are estimated to be –6 K and +7 K, respectively(Fig. 1.14b) [70].
To investigate the electronic state of the LT phase, the temperature de-pendence of the CN stretching frequencies in the IR spectrum was mea-sured. As the temperature decreases, the intensity of the MnII − NC − FeIII
peak at 2153 cm−1 decreases and a new broad peak appears between2080 and 2140 (peak top: 2108 cm−1), which is assigned to the CNgroup of MnIII − NC − FeII. From the analysis of the conversion in theIR spectra, the electronic state of the LT phase is determined tobe RbI
0.64MnII0.40MnIII
0.60[FeII(CN)6]0.60[FeIII(CN)6]0.28 · 1.7H2O. The XRD

16 H. Tokoro and S. Ohkoshi
Fig. 1.14. (a) The observed χMT vs. T plots for Rb0.64Mn[Fe(CN)6]0.88 · 1.7H2Ounder 5000 Oe with warming by +0.1 K min−1 after rapid-cooling. (b) The observedχM
−1 vs. T plots, and the χM−1 vs. T curves of the HT (black) and the LT (gray)
phases, fitted by Curie-Weiss law
pattern of the sample at 300 K shows a cubic crystal (Fm3m) with a latticeconstant of a = 10.535(6) A. As the temperature decreases, different XRDpatterns due to the LT phase appear near T1/2↓. The observed XRD patternin the LT phase is assigned to an orthorhombic crystal structure (F222) withlattice constants of a = 10.261(16), b = 10.044(10), and c = 10.567(16) A.This distorted crystal structure is ascribed to the Jahn–Teller effect on theproduced MnIII sites.
1.6.2 Thermodynamical Analysis of Thermal Hysteresis Loop
The fractions (α) of the temperature-induced phase transition of ΔT = 138 Kare estimated as shown in Fig. 1.15a using the extrapolation curves of vs. χM
−1
plots of the HT and LT phases. As a reference, χM−1 vs. T of RbMn[Fe(CN)6]
(T1/2↓ = 231 K, T1/2↑ = 304 K, and ΔT = 73 K) from our previous work[55] is also s hown in Fig. 1.15b. These thermal hysteresis loops are ana-lyzed based on SD model [71]. The Gibbs free energy G of the system isdescribed by G= αΔH + γα(1− α) + T{R[αlnα + (1− α)ln(1− α)]− αΔS},taking G of the LT phase as the origin of the energies, where α is the frac-tion of the HT phase, ΔH is the transition enthalpy, ΔS is the transitionentropy, R is the gas constant, and the γ is an interaction parameter as afunction of temperature, γ = γa + γbT [71, 72]. Experimental heat capac-ity measurements indicate that the ΔH and ΔS values of RbMn[Fe(CN)6]are ΔH = 1.7 KJ mol−1 and ΔS = 6.0 J K−1, respectively [55, 56]. Whenthese thermodynamic parameters are used, the thermal hysteresis loopsof Rb0.64Mn[Fe(CN)6]0.88 · 1.7H2O and RbMn[Fe(CN)6] are well reproducedwith the parameters of (ΔH, ΔS, γa, γb) = (1.24 kJ mol−1, 4.54 J K−1 mol−1,20.1 kJ mol−1, 12.0 J K−1 mol −1) and (ΔH, ΔS, γa, γb) = (1.68 kJ

1 Photo-Induced Phase Transition 17
Fig. 1.15. The observed α vs. T plots of (a1) Rb0.64Mn[Fe(CN)6]0.88 · 1.7H2Oand (b1) RbMn[Fe(CN)6] from [55] where the gray circles show the rapidly-cooled sample upon warming. Calculated thermal hysteresis loops of (a2)Rb0.64Mn[Fe(CN)6]0.88 · 1.7H2O and (b2) RbMn[Fe(CN)6]. Temperature depen-dence of calculated vs. curves between 80 and 330 K with 10 K interval for (a3)Rb0.64Mn[Fe(CN)6]0.88 · 1.7H2O and (b3) RbMn[Fe(CN)6]. The circles indicate thethermal populations. The black and gray circles indicate the temperature-inducedphase transition and the relaxation, respectively

18 H. Tokoro and S. Ohkoshi
mol−1, 6.0 J K−1 mol−1, 20.5 kJ mol−1, 11.9 J K−1 mol−1), respectively (Figs.1.15(a2),(a3), black lines). In addition, Rb0.64Mn[Fe(CN)6]0.88 · 1.7H2O showsthat a hidden stable phase exists at low temperature under thermal equilib-rium condition (Fig. 1.15(a2), gray line). In this low temperature region, alocal energy minimum exists at α = 0.85 – 0.9 and relaxes to LT phase at111 K (Fig. 1.15(a3), gray circles), which well reproduces the experimentaldata (Fig. 1.15(a1), gray circles). In contrast, both the calculated and ex-perimental data of RbMn[Fe(CN)6] indicate that this hidden stable phasedoes not exist (Fig. 1.15b). These results suggest that the observed phase inRb0.64Mn[Fe(CN)6]0.88 · 1.7H2O is a hidden stable state of HT phase underthermal equilibrium condition and is not a supercooled phase under nonequi-librium condition. Furthermore, we calculated the α vs. T plots with variousparameters, and thus, concluded that only the system showing a large thermalhysteresis loop produces the hidden stable phase under thermal equilibriumcondition.
1.7 Photo-Induced Phase Collapse
1.7.1 Non Phase Transition Material
Rb0.43Mn[Fe(CN)6]0.81 · 3H2O was prepared by reacting an aqueous solution(0.1 mol dm−3) of MnCl2 with a mixed aqueous solution of RbCl (0.05 moldm−3) and K3[Fe(CN)6] (0.1 mol dm−3). The temperature dependence of themagnetic susceptibility of the initial MnII − FeIII phase was measured using aSQUID magnetometer, and Fig. 1.16 plots the product of the χMT vs. T at avery slow cooling rate of –0.05 K min−1. In the χMT −T plots, χMT remainednearly constant, corresponding to the sum of MnII(S = 5/2) and FeIII(S = 1/2).Variable temperature IR spectra also showed that the CN streching frequencypeak due to MnII − NC − FeIII is maintained down to low temperature. The
Fig. 1.16. The observed χMT vs. T plots for Rb0.43Mn[Fe(CN)6]0.81 · 3H2O under5000 Oe

1 Photo-Induced Phase Transition 19
XRD pattern at 300 K confirmed that the crystal structure is face-centeredcubic (space group: Fm3m) with a lattice constant of a = 10.473(9)A. In thetemperature range between 300 and 20 K, the lattice constant was almost con-stant, i.e., a = 10.493(9) A at 20 K. These results indicate that a temperature-induced charge-transfer phase transition does not occur in the present material[73]. In spectroscopic ellipsometry , an optical resonance due to the ligand-to-metal charge transfer (LMCT) transition on [Fe(CN)6]
3− was observed at410 nm.
1.7.2 Photo-Induced Structural Transition
Since RbI0.43MnII[FeIII(CN)6]0.81 · 3H2O has absorption at 410 nm, we irradi-
ated the sample in XRD equipment with blue light (410±25 nm, 20 mW cm−2)using a filtered Xe lamp. Upon blue-light irradiation, the XRD peaks of theMnII − FeIII phase decreased, and new XRD peaks appeared as shown inFig. 1.17. The new XRD pattern of the PG phase was assigned to a face-centered cubic structure of Fm3m with a = 10.099(3)A. When the XRD pat-tern due to the PG phase was cooled to 20 K and then warmed above roomtemperature, it was maintained over a wide temperature range, but at 310 Kthe XRD pattern was perfectly restored to the original XRD pattern of the ini-tial MnII − FeIII phase (Fig. 1.18a). The photo-conversion efficiency dependedon the irradiation temperature as shown in Fig. 1.18b, i.e., 0% (20 K), 45%(100 K), 66% (140 K), 3% (180 K), 6% (220 K), and 0% (300 K) by blue light.To investigate the electronic state of the PG phase, the IR spectra after light
Fig. 1.17. Photo-induced phase collapse in Rb0.43Mn[Fe(CN)6]0.81 · 3H2O by blue-light irradiation. XRD patterns at 140 K before and after blue-light irradiation

20 H. Tokoro and S. Ohkoshi
Fig. 1.18. (a) Temperature dependence of the MnII − FeIII phase fraction before ir-radiation (open circles), during light irradiation at 140 K (dark gray circles), coolingprocess after irradiation (140 K→20 K) (black circles), and warming process (20 K→ 310 K) (gray circles). (b) Irradiation temperature dependence of the MnII − FeIII
phase fraction before (open circles) and after (black circles) light irradiation for 50 h(20 mW cm−2)
irradiation were measured at 140 K. Upon irradiation, the MnII − NC − FeIII
peak at 2153 cm−1 decreased and a broad peak appeared at 2095 cm−1, whichcorresponds to the CN streching frequency of MnIII − NC − FeII. Hence, theobserved photo-induced phase collapse is caused by the charge-transfer phasetransition from the MnII − FeIII phase to the MnIII − FeII phase.
1.7.3 Photo-Induced Phase Transition from a Metastable Phase toa Hidden Stable Phase
To understand the mechanism of the observed photo-induced phase tran-sition, we calculated the Gibbs free energy vs. the MnII − FeIII fractionfor Rb0.43Mn[Fe(CN)6]0.81 · 3H2O using the Slichter and Drickamer mean-field model [71], described by G= αΔH + γα(1 − α) + T{R[αlnα + (1 −α)ln(1 − α)] − αΔS}, mentioned in Sect. 1.6.2. The thermodynamical pa-rameters for the calculation were estimated by extrapolating our previousdata. In the entire temperature range, a free-energy barrier existed betweenthe mainly MnII − FeIII phase and the mainly MnIII − FeII phase, as shownin Fig. 1.19a. Since the material synthesis was carried out at room tem-perature and produced the MnII − FeIII phase, the MnII − FeIII phase is ex-pected to be maintained in the entire temperature range as shown in Fig.1.19a (dark gray circles). This calculation well explains the observed tem-perautre dependence in Rb0.43Mn[Fe(CN)6]0.81 · 3H2O, which does not ex-hibit a thermal phase transition. At the same time, this calculation predictsthe existence of a hidden stable phase, the MnIII − FeII phase (Fig. 1.19a,light gray circles). Its calculated temeperature dependence (Fig. 1.19b, lower,light gray curve) corresponds well to the observed temperature dependence inFig. 1.18a.

1 Photo-Induced Phase Transition 21
Fig. 1.19. Mechanism of the photo-induced phase collapse in Rb0.43Mn[Fe(CN)6]0.81 · 3H2O. (a) Temperature dependence of calculated Gibbs free energy vs.the MnII − FeIII fraction for Rb0.43Mn[Fe(CN)6]0.81 · 3H2O based on the Slichter andDrickamer model. Dark and light gray circles indicate the existing populations ofMnII − FeIII phase and MnIII − FeII phase, respectively. (b) Schematic picture of thepathway in the photo-induced phase collapse (upper). Temperature dependence ofcalculated fractions of MnII − FeIII mainly phase (dark gray curve) and MnIII − FeII
mainly phase (light gray curve) (lower)
We thus conclude that the present photo-induced phase collapse is causedby a phase transition from a thermodynamically metastable MnII − FeIII
phase to a MnIII − FeII true stable phase though the excited state of LMCT(CN− → FeIII), which is excited by blue-light irradiation (Fig. 1.19b,upper).
1.8 Photo-Induced Phase Transition at RoomTemperature
The photo-induced effect in the paramagnetic region was investigated withRb0.97Mn[Fe(CN)6]0.99 · 0.2H2O using IR spectroscopy [74, 75]. A pulsedNd3+ ; YAG laser (λ = 532 nm; pulse width: 6 ns) was used. The χMT − Tplots showed that Rb0.97Mn[Fe(CN)6]0.99 · 0.2H2O exhibited a temperature-induced phase transition (Fig. 1.20). The T1/2↓ and T1/2↑ were 220 and 314 K,respectively.

22 H. Tokoro and S. Ohkoshi
Fig. 1.20. The observed χMT − T plots for Rb0.97Mn[Fe(CN)6]0.99 · 0.2H2O in thecooling (↓) and warming (↑) processes under 5000Oe
Fig. 1.21. Change in the IR spectrum by a one-shot-laser-pulse irradiation of 532 nmwith 80 mJ cm−2 pulse−1 at 295 K for Rb0.97Mn[Fe(CN)6]0.99 · 0.2H2O. The spectrabefore and after irradiation are shown as dotted and solid lines, respectively
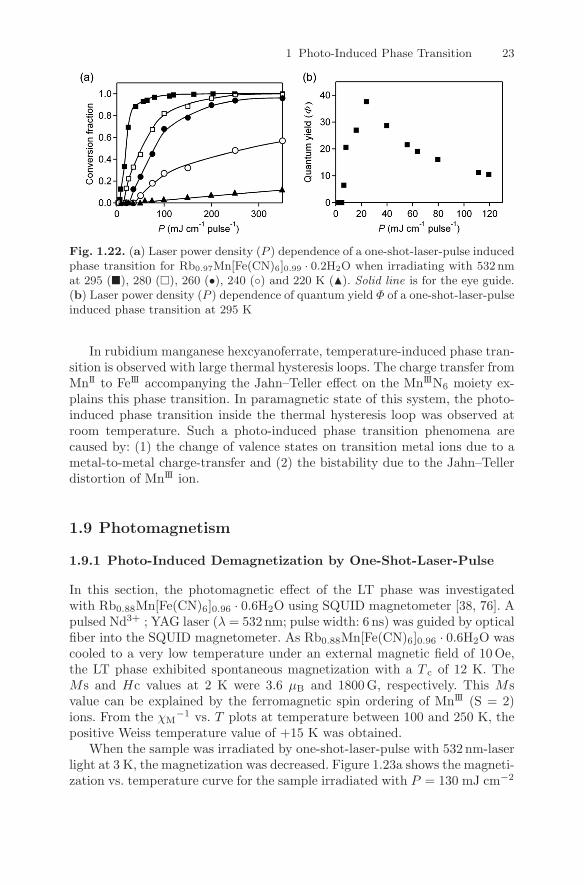
Figure 1.21 shows the changes in the IR spectra before and after a one-shot-laser-pulse irradiation at 295 K, which is a temperature inside the thermalhysteresis loop. A one-shot-laser-pulse irradiation changed the IR spectrumof the LT phase to that of the HT phase. The IR spectrum of the irradiatedsample returned to that of the initial LT phase by cooling (295 K → 77 K →295 K). Figure 1.22a shows the conversion fraction as a function of laser powerdensity at 295, 280, 260, 240 and 220 K. The conversion fraction depended onthe P value and temperature. A threshold in the laser power density (P th)was observed. At 295 K, when the P value was greater than 6 mJ cm−2
pulse−1, the LT phase was converted to HT phase. In contrast, in the caseof P < P th, photo-conversion did not occur even after irradiating more thanthousand shots. The existence of a threshold suggests that cooperative effectsexist in the present photo-induced phase transition and the maximum valueof quantum yield was Φ = 38 at P = 24 mJ cm−2 pulse−1 (Fig. 1.22b).
1 Photo-Induced Phase Transition 23
Fig. 1.22. (a) Laser power density (P ) dependence of a one-shot-laser-pulse inducedphase transition for Rb0.97Mn[Fe(CN)6]0.99 · 0.2H2O when irradiating with 532 nmat 295 (�), 280 (�), 260 (•), 240 (◦) and 220 K (�). Solid line is for the eye guide.(b) Laser power density (P ) dependence of quantum yield Φ of a one-shot-laser-pulseinduced phase transition at 295 K
In rubidium manganese hexcyanoferrate, temperature-induced phase tran-sition is observed with large thermal hysteresis loops. The charge transfer fromMnII to FeIII accompanying the Jahn–Teller effect on the MnIIIN6 moiety ex-plains this phase transition. In paramagnetic state of this system, the photo-induced phase transition inside the thermal hysteresis loop was observed atroom temperature. Such a photo-induced phase transition phenomena arecaused by: (1) the change of valence states on transition metal ions due to ametal-to-metal charge-transfer and (2) the bistability due to the Jahn–Tellerdistortion of MnIII ion.
1.9 Photomagnetism
1.9.1 Photo-Induced Demagnetization by One-Shot-Laser-Pulse
In this section, the photomagnetic effect of the LT phase was investigatedwith Rb0.88Mn[Fe(CN)6]0.96 · 0.6H2O using SQUID magnetometer [38, 76]. Apulsed Nd3+ ; YAG laser (λ = 532 nm; pulse width: 6 ns) was guided by opticalfiber into the SQUID magnetometer. As Rb0.88Mn[Fe(CN)6]0.96 · 0.6H2O wascooled to a very low temperature under an external magnetic field of 10 Oe,the LT phase exhibited spontaneous magnetization with a T c of 12 K. TheMs and Hc values at 2 K were 3.6 μB and 1800 G, respectively. This Msvalue can be explained by the ferromagnetic spin ordering of MnIII (S = 2)ions. From the χM
−1 vs. T plots at temperature between 100 and 250 K, thepositive Weiss temperature value of +15 K was obtained.
When the sample was irradiated by one-shot-laser-pulse with 532 nm-laserlight at 3 K, the magnetization was decreased. Figure 1.23a shows the magneti-zation vs. temperature curve for the sample irradiated with P = 130 mJ cm−2

24 H. Tokoro and S. Ohkoshi
Fig. 1.23. (a) Magnetization vs. temperature plots for Rb0.88Mn [Fe(CN)6]0.96·0.6H2O at 200 Oe before (◦) and after the one-shot-laser-pulse irradiation (�) andthermal treatment (�). (b) Laser power density (P ) dependences of the one-shot-laser-pulse induced photodemagnetization phenomenon. (c) Enlarged plots of (b)
pulse −1. The photo-conversion increased with increasing the laser power den-sity (P ) as shown in Fig. 1.23b and c. A threshold in the laser power density(P ′
th) was observed; when the P value was above 9.3 mJ cm−2 pulse −1, themagnetization value was decreased, however, in the case of P < P ′
th, themagnetization value did not change. The quantum yields (Φ) for the presentphotodemagnetization were above one, e.g., Φ = 4.5 (= 43 mJ cm−2 pulse −1).The irradiated sample returned to the LT phase by an annealing treatment(3 K → 150 K → 3 K) with a relaxation at 120 K. The IR spectra before andafter one-shot-laser-pulse irradiation (532 nm, P = 14 mJ cm−2 pulse −1) at8 K was obtained. After irradiation, the MnIII − NC − FeII peak at 2095 cm−1
disappears and a sharp peak due to the MnII − NC − FeIII peak at 2152 cm−1
appears. Note that, in the case of P < P ′th, the IR spectra were not changed
by irradiation of several tens shots. An annealing treatment (8 K → 150 K →8 K) returned the IR spectrum of the irradiated sample to the LT phase. From

1 Photo-Induced Phase Transition 25
Fig. 1.24. Schematic illustration of the one-shot-laser-pulse-induced phase transi-tion from the stable MnIII − NC − FeII phase to the hidden substable MnII − NC−FeIII phase
these results, we conclude that the present photo-demagnetization is causedby the photo-induced phase transition from the LT phase to the HT phase.
Temperature-induced phase transition between the LT and HT phases wasobserved in rubidium manganese hexacyanoferrate. In such a material with abistability, a ground state can be converted to a hidden metastable state bythe irradiation. Nasu et al. showed a simple scheme for a photo-induced phasetransition using the adiabatic potential energy vs. order parameter (Fig. 1.24)[2]. In this scheme, the ground state is excited to the Franck–Condon state byirradiation. This Franck–Condon state proceeds to a hidden substable statethrough a structural change state or relaxes to the ground state. In our case,irradiating with pulsed-laser light excites the LT phase to a mixed-valancestate between the MnIII − FeII and the MnII − NC − FeIII states. This mixed-valence state proceeds to the HT phase or relaxes to the initial LT phase. Theproduced HT phase can be maintained in the low temperature range sinceit is sufficiently separated from the LT phase by the thermal energy (ΔG).In addition, when the P value is larger than P th
′, the excited state proceedsto the photo-produced HT phase as shown by the solid arrow in Fig. 1.24.In contrast, when P < P th
′, the excited state relaxes to the ground state asshown by the dotted arrow.
1.9.2 Reversible Photomagnetic Effect
In previous section, we have reported that irradiating with 532 nm lightconverts the LT phase to the photo-induced (PI) phase, which decreases

26 H. Tokoro and S. Ohkoshi
its spontaneous magnetization. In this section, we have found that ir-radiating with a different wavelength of light recovers the PI phase inRb0.88Mn[Fe(CN)6]0.96 · 0.5H2O to the LT phase. Furthermore, neutron pow-der diffraction using an analog complex, Rb0.58Mn[Fe(CN)6]0.86 · 2.3H2O,has confirmed the magnetic ordering of the PI phase. Herein, we show thevisible-light reversible changes in the electronic and magnetic properties ofRb0.88Mn[Fe(CN)6]0.96 · 0.5H2O, the neutron powder diffraction pattern ofRb0.58Mn[Fe(CN)6]0.86 · 2.3H2O, and the mechanism of the observed photo-reversible photomagnetism [77].
Photo-Reversible Changes in the IR Spectra and SQUIDMeasurement
Because a metal-to-metal charge transfer (MM’CT) band was observed at420–540 nm in the ε spectrum of the LT phase (Fig. 1.5), the LT phase wasirradiated with a CW diode green laser (hν1; λ = 532 nm). Figure 1.25 showsthe IR spectra before and after the light irradiations at 3 K. Before irra-diating (Fig. 1.25a, black line), the LT phase possessed a broad peak dueto MnIII − NC − FeII around 2100 cm−1. Irradiating with hν1 reduced theMnIII − NC − FeII peak, and created a sharp peak at 2153 cm−1. The latterpeak is assigned to the MnII − NC − FeIII, which was also observed in the HTphase (2154 cm−1). It is concluded that the PI phase after hν1 irradiationhas a valence state similar to the HT phase. Based on the knowledge thatresonance due to the LMCT band was observed at 410 nm in the spec-trum of the HT phase, this PI phase was irradiated with blue light (hν2;
Fig. 1.25. Visible-light reversible change in the IR spectra of Rb0.88Mn[Fe(CN)6]0.96 · 0.5H2O. (a) Changes in the IR spectrum at 3 K by irradiating withhν1 (λ = 532 nm: black arrows) before irradiation (black line), after hν1 irradia-tion (dotted line), and hν2 irradiation (gray line). (b) Peak intensity at 2108 vs.irradiation-time upon irradiating with hν1 (black circles) and hν2 (gray circles)

1 Photo-Induced Phase Transition 27
λ = 410±30 nm) from a filtered Xe lamp in order to investigate the photo-reversibility. Consequently, the MnII − NC − FeIII peak decreased and theMnII − NC − FeIII peak increased as shown in Fig. 1.25a. Figure 1.25b plotsthe peak intensities of MnII − NC − FeIII vs. irradiation-time. This photo-reversibility was repeatedly observed.
Next, we measured the photo-reversible change in magnetization in situusing SQUID equipment. The field cooled magnetization curve under an ex-ternal magnetic field of 200 Oe showed that the LT phase is a ferromagnetwith a T c of 12 K (Fig. 1.26a, closed squares). Upon irradiating with hν1 at3 K, the magnetization value decreased from 5600 to 700 G cm3 mol−1 (Fig.1.26a, open circles).
Successively irradiating the PI phase with hν2 increased the magnetiza-tion, which reached 4700 G cm3 mol−1 (Fig. 1.26a, closed circles). The presentphoto-reversibility of the magnetization was repeatedly observed by alter-nately irradiating with hν1 and hν2 (Fig. 1.26b). The magnetization valueafter irradiating with hν2, which is shown as the closed circles in Fig. 1.26a,was smaller than that of initial value, suggesting that a photo-equilibriumstate persists. To confirm the photo-equilibrium behavior, we investigated thephoto-effect of the reverse process, that is, from the PI phase to the LT phase,using a different light (hν3 ; = 425±45 nm). Irradiating with hν3 increased themagnetization, which reached plateau- Maghν3 as shown in Fig. 1.27. Subse-quent irradiation with hν2 further increased the magnetization, which reachedplateau-Maghν2. This equilibrium behavior is due to a photo-stationary statebetween the photo-demagnetization (LT → PI phase) and the photo-inducedmagnetization (PI → LT phase).
Fig. 1.26. Visible-light reversible photomagnetism in Rb0.88Mn[Fe(CN)6]0.96·0.5H2O. (a) Magnetization vs. temperature curves at 200 Oe; before irradiating (�),after hν1 (λ = 532 nm, 30 mW cm−2) irradiation for 100 min (◦), after hν2 (λ =410 nm, 13mW cm−2) irradiation for 80 min (•), and after the thermal annealingtreatment of 180 K (�). (b) Magnetization vs. irradiation-time plot at 3 K by al-ternating with hν1 (◦) and hν1 (•) light irradiation, and the magnetization valueafter a thermal treatment of 180 K (�)

28 H. Tokoro and S. Ohkoshi
Fig. 1.27. Photo-stationary state between photodemagnetization and photo-induced magnetization. Magnetization vs. irradiation-time plot at 3 K upon irra-diating with hν3 (λ = 425 ±445 nm, 22 mW cm−2) (open triangle) and then hν2 (λ= 410± 30 nm, 13mW cm−2) (black circles)
Magnetic Ordering of the Photo-Induced Phase
To determine the magnetic ordering of the PI phase, we performed neutronpowder diffraction using an analog complex, Rb0.58Mn[Fe(CN)6]0.86 · 2.3H2O.A charge-transfer phase transition was not observed in the IR spectrum ofRb0.58Mn[Fe(CN)6]0.86 · 2.3H2O when the sample was cooled to 3 K at arate of –0.5 K (Fig. 1.28a). The χM
−1 − T plot showed a negative Weisstemperature of –16 K, which was obtained by the least-square fitting in thetemperature region of 150 - 320 K. The magnetization vs. temperature curveunder an external field of 10 Oe exhibited an antiferromagnetic behavior witha Neel temperature (TN) of 11.5 K. The magnetization vs. external magneticfield plots at 2 K showed a linear change (Fig. 1.28b). These magnetic datasuggest that in Rb0.58Mn[Fe(CN)6]0.86 · 2.3H2O, the HT phase is maintainedeven at low temperature and the HT phase shows antiferromagnetism. Figure1.28c shows the neutron powder pattern for Rb0.58Mn[Fe(CN)6]0.86 · 2.3H2Oat 30 K. Rietveld analysis showed that the crystal structure was tetragonal(P4/mmm) with lattice constants of a = b = 7.424(6) A and c = 10.51(1) A,which correspond to a′ = b′ = 10.499 A and c′ = 10.51(1) A in the frame of acubic lattice. The interatomic distances of Fe and C in the ab plane (Fe − Cab)and along the c axis (Fe − Cc) are 1.93(3) and 1.81(4) A, respectively. Thedistances of Mn − Nab and Mn − Nc are 2.18(2) and 2.18(4) A, respectively.
Figure 1.29a and b shows the neutron powder diffraction patterns at 2 and30 K, and the magnetic Bragg reflections as the difference in the patterns of2 and 30 K, respectively. Analysis of the magnetic Bragg reflections suggeststhat this system is a layered antiferromagnet in which the magnetic couplingbetween the layers is antiferromagnetic. The spin arrangement as shown in

1 Photo-Induced Phase Transition 29
Fig. 1.28. Electronic state, magnetic property, and neutron powder diffraction pat-tern of Rb0.58Mn[Fe(CN)6]0.86 · 2.3H2O. (a) IR spectra at 300 K (dotted line) and3 K (solid line). (b) Magnetization as a function of the external magnetic field at2 K. (c) Neutron powder diffraction pattern at 30 K. Gray dots, black pattern, andblack line are the observed plots, calculated pattern, and their difference, respec-tively. Bars represent the calculated positions of the Bragg reflections
Fig. 1.29d is a suitable configuration due to the following reason. The elec-tronic state of MnII is a 3d5 high-spin state and hence, all the 3d orbitalsare magnetic orbitals. In contrast, FeIII is a 3d5 low-spin state, and thus, onlyone of the t2g orbitals becomes a magnetic orbital. Rietveld analysis showedelongation of Fe(CN)6 in the ab-plane, indicating that the dyz and dzx orbitalsare more stabilized than the dxy orbital due to backbonding of the cyanideligand. Hence, the dxy becomes the magnetic orbital of FeIII. In this case, onlythe spin configuration shown in Fig. 1.29d is possible to be formed. The stickdiagram of Fig. 1.29c, which was calculated by the layered antiferromagnetmentioned above, reproduced the observed data. Because the magnetic order-ing of Rb0.58Mn[Fe(CN)6]0.86 · 2.3H2O is considered to be the same as thatof the PI phase in Rb0.88Mn[Fe(CN)6]0.96 · 0.5H2O, the PI phase should be alayered antiferromagnet .
Mechanism of Visible-Light Reversible Photomagnetism
The observed reversible photomagnetic e ffect can be explained by the schemeshown in Fig. 1.30. Irradiating with hν1 excites the MM’CT (FeII → MnIII)band, which then excites the LT phase to photoexcited state I. Photoexcited

30 H. Tokoro and S. Ohkoshi
Fig. 1.29. (a) Neutron powder diffraction patterns at 2 K (black line) and 30 K(gray line). (b) Magnetic Bragg reflections as the difference in the neutron powderdiffraction patterns at 2 and 30 K. (c) Calculated intensities of the magnetic Braggreflections with an antiferromagnetic spin ordering. (d) Schematic illustration ofthe spin ordering. Gray and Dark gray arrows indicate the spins on MnII and FeIII,respectively. From the view of the superexchange pathway, an antiferromagneticcoupling operates between Fe-dxy and Mn-dxy magnetic orbitals in the xy (ab) plane.In contrast, a ferromagnetic coupling operates between Fe-dxy and all the d orbitalsof Mn (here, Mn-dyz is depicted) along the z (c) axis
state I proceeds to the PI phase, which has the same valence state as theHT phase. Thermal energy then suppresses the relaxation of the metastablePI phase to the stable LT phase. In contrast, the excitation of the LMCT(CN− → FeIII) band of [Fe(CN)6]3− by irradiating with hν2 excites the PIphase to photoexcited state III, which then proceeds to the LT phase. TheLT phase is a ferromagnet due to the ferromagnetic coupling between theMnIII(S = 2) sites, but the PI phase is an antiferromagnet. Hence, the mag-netization value changes by optical switching between the LT phase and thePI phase.
A visible light-induced reversible photomagnetism between the ferromag-netic and antiferromagnetic phases is observed in a rubidium manganese hexa-cyanoferrate, Rb0.88Mn[Fe(CN)6]0.96 · 0.5H2O, by alternately irradiating with532 and 410 nm lights. Optical switching from the LT phase to the PI phaseoccurs through a FeII → MnIII MM’CT transition, causing photodemagnetiza-tion. In contrast, the reverse process is caused by an optical transition fromthe PI phase to the LT phase through a CN− → FeIII LMCT transition. The

1 Photo-Induced Phase Transition 31
Fig. 1.30. Schematic illustration of the visible-light reversible photomagnetic effectin rubidium manganese hexacyanoferrate. Scheme for reversible charge-transfer be-tween and (upper) and the spin ordering for the LT and PI phases (lower). LT phaseis a ferromagnet due to ferromagnetic coupling between the sites, whereas the PIphase is an antiferromagnet. Arrows on the LT phase represent the spins of. Largeand small arrows on the PI phase indicate the spins of and, respectively
existence of a photo-stationary state between the LT → PI phase and the PI →LT phase is also confirmed by the light source changing experiment. Althoughphotomagnetism has been observed in some compounds, this is the first ex-ample of optical switching between a ferromagnet and an antiferromagnet.
1.10 Summary
In conclusion, a temperature-induced phase transition between the high-temperature (HT) and low-temperature (LT) phases is observed with a ther-mal hysteresis loop of 75 K in RbMn[Fe(CN)6]. The charge transfer from MnII

32 H. Tokoro and S. Ohkoshi
to FeIII that accompanies the Jahn–Teller effect on the MnIIIN6 moiety explainsthis phase transition. By control the x of RbxMn[Fe(CN)6](x+2)/3 · zH2O, wefound that Rb0.64Mn[Fe(CN)6]0.88 · 1.7H2O exhibits a surprisingly large ther-mal hysteresis loop of 138 K. A hidden stable phase of HT phase, which isexperimentally observed in this system, is well explained by a SD model underthermal equilibrium condition. In addition, with non phase transition mate-rial of Rb0.43Mn[Fe(CN)6]0.81 · 3H2O, the light-induced phase collapse (LIPC)was realized. The LIPC is caused by blue-light irradiation inducing the transi-tion from a thermodynamically metastable phase to a hidden stable phase in amaterial that does not undergo a thermal phase transition. Since the presentphenomenon is driven only by the blue-light irradiation, it may provide agood strategy for the next generation of optical recording. As photo-inducedphase transition at room temperature, the photoconversion from the LT toHT phases is observed inside the thermal hysteresis loop with a large Φ valueof 38, by a one-shot-laser-pulse irradiation. This large yield and fast responsewill allow us to consider a new type of optical switching device. As photomag-netic effect at low temperature, the rapid- photodemagnetization has beenobserved by a one-shot-pulsed-laser light irradiation. With cw lights, a visiblelight-induced reversible ph otomagnetism between the ferromagnetic and an-tiferromagnetic phases is observed, by alternately irradiating with 532 nm and410 nm lights. These temperature- and photo-induced phase transition phe-nomena are caused by: (1) the change in valence states on transition metalions due to metal-to-metal charge-transfer and (2) the bistability due to theJahn–Teller distortion of MnIII ion.
Acknowledgements
The authors would like to thank Professor Yutaka Moritomo (University ofTsukuba) and Professor Kenji Ohoyama (Tohoku University) for the mea-surement of neutron powder diffraction . The present research is supported inpart by a Grant-in-Aid for Young Scientists (S) from JSPS, a Grant for theGCOE Program “Chemistry Innovation through Cooperation of Science andEngineering”, the photon Frontier Network Program from the MEXT, andPRESTO JST, Japan.
References
1. O. Kahn, Molecular Magnetism (VCH, New York, 1993)2. K. Nasu, Relaxations of Excited States and Photo-Induced Structual Phase Tran-
sitions (Springer-Verlag, Berlin, 1997)3. P. Gutlich, A. Hauser, H. Spiering, Angew. Chem. Int. Ed. Engl. 33, 2024 (1994)4. S. Ohkoshi, K. Hashimoto, J. Photochem. Photobio. C 2, 71 (2001)5. J.F. Letard, P. Guionneau, E. Codjovi, O. Lavastre, G. Bravic, D. Chasseau, O.
Kahn, J. Am. Chem. Soc. 119, 10861 (1997)

1 Photo-Induced Phase Transition 33
6. G.A. Renovitch, W.A. Baker, J. Am. Chem. Soc. 89, 6377 (1967)7. M. Sorai, Bull. Chem. Soc. Jpn. 74, 2223 (2001)8. K. Prassides, Mixed Valency Systems, Applications in Chemistry, Physics and
Biology (NATO ASI, Kluwer, Dordrecht, 1991)9. M.B. Robin, P. Day, Adv. Inorg. Chem. Radiochem. 10, 247 (1967)10. N.S. Hush, Prog. Inorg. Chem. 8, 391 (1967)11. S.B. Piepho, E.R. Krausz, P.N. Schatz, J. Am. Chem. Soc. 10, 2996 (1978)12. R.D. Cannon, L. Montri, D.B. Brown, K.M. Marshall, C.M. Elliot, J. Am. Chem.
Soc. 106, 2591 (1984)13. H. Kitagawa, T. Mitani, Coord. Chem. Rev. 190, 1169 (1999)14. O.S. Jung, D.H. Jo, Y.A. Lee, B.J. Conklin, C.G. Pierpont, Inorg. Chem. 36,
19 (1997)15. N. Shimamoto, S. Ohkoshi, O. Sato, K. Hashimoto, Inorg. Chem. 41, 678 (2002)16. R.J. Zimmermann, Phys. Chem. Solids. 44, 151 (1983)17. T.J. Kambara, Phys. Soc. Jpn. 49, 1806 (1980)18. S. Ohnishi, S. Sugano, J. Phys. C 14, 39 (1981)19. A. Ludi, H.U. Gudel, Struct. Bonding (Berlin) 14, 1 (1973)20. M. Verdaguer, T. Mallah, V. Gadet, I. Castro, C. Helary, S. Thiebaut, P. Veillet,
Conf. Coord. Chem. 14, 19 (1993)21. S. Ohkoshi, K. Hashimoto, Electrochem. Soc. Interface Fall 34, (2002)22. T. Mallah, S. Thiebaut, M. Verdaguer, P. Veillet, Science 262, 1554 (1993)23. W.R. Entley, G.S. Girolami, Science 268, 397 (1995)24. S. Ferlay, T. Mallah, R. Ouahes, P. Veillet, M. Verdaguer, Nature 378, 701
(1995)25. S. Ohkoshi, T. Iyoda. A. Fujishima, K. Hashimoto, Phys. Rev. B 56, 11642
(1997)26. S. Ohkoshi, A. Fujishima, K. Hashimoto, J. Am. Chem. Soc. 120, 5349 (1998)27. O. Hatlevik, W.E. Bushmann, J. Zhang, J.L. Manson, J.S. Miller, Adv. Mater.
11, 914 (1999)28. S.M. Holmes, G.S. Girolami, J. Am. Chem. Soc. 121, 5593 (1999)29. S. Ohkoshi, Y. Abe, A. Fujishima, K. Hashimoto, Phys. Rev. Lett. 82, 1285
(1999)30. S. Ohkoshi, K. Arai, Y. Sato, K. Hashimoto, Nat. Mater. 3, 857 (2004)31. S. Margadonna, K. Prassides, A.N. Fitch, J. Am. Chem. Soc. 126, 15390 (2004)32. S.S. Kaye, J.R. Long, J. Am. Chem. Soc. 127, 6506 (2005)33. A.L. Goodwin, K.W. Chapman, C.J. Kepert, J. Am. Chem. Soc. 127, 17980
(2005)34. S. Ohkoshi, H. Tokoro, T. Matsuda, H. Takahashi, H. Irie, K. Hashimoto,
Angew. Chem. Int. Ed. 3, 857 (2007)35. S. Ohkoshi, S. Yorozu, O. Sato, T. Iyoda, A. Fujishima, K. Hashimoto, Appl.
Phys. Lett. 70, 1040 (1997)36. A. Bleuzen, C. Lomenech, V. Escax, F. Villain, F. Varret, C.C.D. Moulin, M.
Verdaguer, J. Am. Chem. Soc. 122, 6648 (2000)37. O. Sato, S. Hayami, Y. Einaga, Z.Z. Gu, Bull. Chem. Soc. Jpn. 76, 443 (2003);
H. Tokoro, S. Ohkoshi, K. Hashimoto, Appl. Phys. Lett. 82, 1245 (2003)38. H. Tokoro, S. Ohkoshi, K. Hashimoto, Appl. Phys. Lett. 82, 1245 (2003)39. S. Ohkoshi, N. Machida, Z.J. Zhong, K. Hashimoto, Synth. Met. 122, 523 (2001)40. G. Rombaut, M. Verelst, S. Golhen, L. Ouahab, C. Mathoniere, O. Kahn, Inorg.
Chem. 40, 1151 (2001)
34 H. Tokoro and S. Ohkoshi
41. J.M. Herrera, V. Marvaud, M. Verdaguer, J. Marrot, M. Kalisz, C. Mathoniere,Angew. Chem. Int. Ed. 43, 5468 (2004)
42. S. Ohkoshi, H. Tokoro, T. Hozumi, Y. Zhang, K. Hashimoto, C. Mathoniere, I.Bord, G. Rombaut, M Verelst, C.C.D. Moulin, F. Villain, J. Am. Chem. Soc.128, 270 (2006)
43. S. Ohkoshi, S. Ikeda, T. Hozumi, T. Kashiwagi, K. Hashimoto, J. Am. Chem.Soc. 128, 5320 (2006)
44. S. Ohkoshi, Y. Hamada, T. Matsuda, Y. Tsunobuchi, H. Tokoro, Chem. Mater.20, 3048 (2008)
45. N. Yamada, E. Ohno, K. Nishiuchi, N. Akahira, M. Takao, J. Appl. Phys. 69,2849 (1991)
46. A.V. Kolobov, P. Fons, A.I. Frenkel, A.L. Ankudinov, J. Tominaga, T. Uruga,Nat. Mater. 3, 703 (2004)
47. M. Wuttig, N. Yamada, Nat. Mater. 6, 824 (2007)48. S. Decurtins, P. Gutlich, C.P. Kohler, H. Spiering, A. Hauser, Chem. Phys. Lett.
105, 1 (1984)49. J.F. Letard, J.A. Real, N. Moliner, A.B. Gaspar, L. Capes, O. Cadpr, O. Kahn,
J. Am. Chem. Soc. 121, 10630 (1999)50. S. Koshihara, Y. Tokura, T. Mikami, G. Saito, T. Koda, Phys. Rev. B 42, 6853
(1990)51. E. Collet, M.H. Lemee-Cailleau, M.B.L. Cointe, H. Cailleau, M. Wulff, T. Luty,
S. Koshihara, M. Meyer, L. Toupet, P. Rabiller, S. Techert, Science 300, 612(2003)
52. M. Fiebig, K. Miyano, Y. Tomioka. Y, Tokura, Science 280, 1925 (1998)53. N. Takubo, I. Onishi, K. Takubo, T. Mizokawa, K. Miyano, Phys. Rev. Lett.
101, 177403 (2008)54. H. Tokoro, M. Shiro, K. Hashimoto, S. Ohkoshi, Z. Anorg. Allg. Chem. 633,
1134 (2007)55. S. Ohkoshi, H. Tokoro, M. Utsunomiya, M. Mizuno, M. Abe, K. Hashimoto, J.
Phys. Chem. B 106, 2423 (2002)56. H. Tokoro, S. Ohkoshi, T. Matsuda, K. Hashimoto, Inorg. Chem. 43, 5231 (2004)57. H. Osawa, T. Iwazumi, H. Tokoro, S. Ohkoshi, K. Hashimoto, H. Shoji, E. Hirai,
T. Nakamura, S. Nanao, Y. Isozumi, Solid State Commun. 125, 237 (2003)58. T. Yokoyama, H. Tokoro, S. Ohkoshi, K. Hashimoto, K. Okamoto, T. Ohta,
Phys. Rev. B 66, 184111 (2002)59. S. Ohkoshi, T. Nuida, T. Matsuda, H. Tokoro, K. Hashimoto, J. Mater. Chem.
5, 3291 (2005)60. K. Kato, Y. Moritomo, M. Takata, M. Sakata, M. Umekawa, N. Hamada, S.
Ohkoshi, H. Tokoro, K. Hashimoto, Phys. Rev. Lett. 91, 255502 (2003)61. H. Tokoro, S. Ohkoshi, T. Matsuda, T. Hozumi, K. Hashimoto, Chem. Phys.
Lett. 388, 379 (2004).62. T. Nakamoto, Y. Miyazaki, M. Itoi, Y. Ono, N. Kojima, M. Sorai, Angew. Chem.
Int. Ed. 40, 4716 (2001)63. H.M.J. Blote, Physica B 79B, 427 (1975)64. T. Matsumoto, Y. Miyazaki, A.S. Albrecht, C.P. Landee, M.M. Turnbull, M.
Sorai, J. Phys. Chem. B 104, 9993 (2000).65. R.L. Carlin, Magnetochemistry (Springer, New York, 1986)66. L.J.D. Jongh, A.R. Miedema, Adv. Phys. 23, 1 (1974)

1 Photo-Induced Phase Transition 35
67. M.A. Subramanian, A.P. Ramirez, W.J. Marshall, Phys. Rev. Lett. 82, 1558(1999)
68. N. Ohmae, A. Kajiwara, Y. Miyazaki, M. Kamachi, M. Sorai, Thermochim.Acta 267, 435 (1995)
69. B. Mayoh, P. Day, J. Chem. Soc. Dalton. 15, 1483 (1976)70. H. Tokoro, S. Miyashita, K. Kazuhito, S. Ohkoshi, Phys. Rev. B 73, 172415
(2006)71. C.P. Slichter, H.G. Drickamer, J. Chem. Phys. 56, 2142 (1972)72. K.P. Purcell, M.P. Edwards, Inorg. Chem. 23, 2620 (1984)73. H. Tokoro, S. Ohkoshi, Appl. Phys. Lett. 93, 021906 (2008)74. H. Tokoro, T. Matsuda, K. Hashimoto, S. Ohkoshi, J. Appl. Phys. 97, 10M508
(2005)75. H. Tokoro, K. Hashimoto, S. Ohkoshi, J. Magn. Magn. Mater. 310, 1422 (2007)76. S. Ohkoshi, H. Tokoro, K. Hashimoto, Coord. Chem. Rev. 249, 1830 (2005)77. H. Tokoro, T. Matsuda, T. Nuida, Y. Moritomo, K. Ohoyama, E.D.L. Dangui,
K. Boukheddaden, S. Ohkoshi, Chem. Mater. 20, 423 (2008)

http://www.springer.com/978-3-642-03950-8