1 philanthropy and government funding. 2 outline fundraising facts the beneficiaries of giving...
Post on 21-Dec-2015
215 views
TRANSCRIPT

1
Philanthropy and Government Funding

2
Outline
• Fundraising facts• The beneficiaries of giving• Social enterprise marketing
basics

3
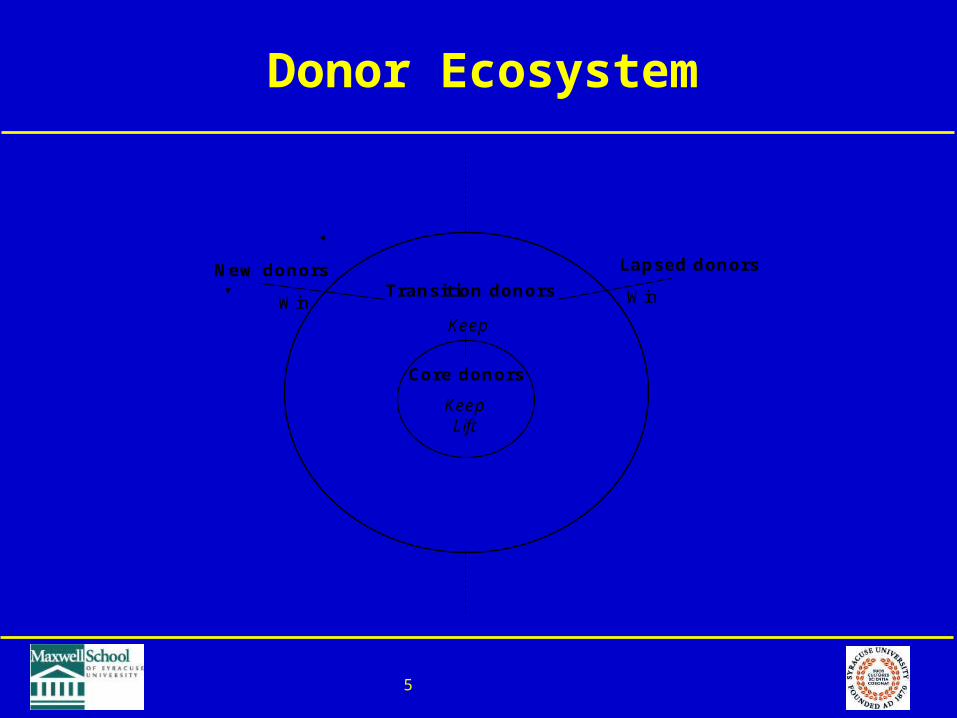
• Potential donors: prospects who have not given yet
• New donors: given for the first time.• Transition donors: given three or more
years in a row• Core donors: given three or more years
in a row.• Lapsed donors. After two years: “deeply
lapsed.”• Lapsed but reactivated donors
Not All Donors Are Alike

4
Strategies for different donors
WINKEEPLIFT
5
Donor Ecosystem
New donors Lapsed donors
Transition donors
Core donors
Win Win
Keep
KeepLift
6
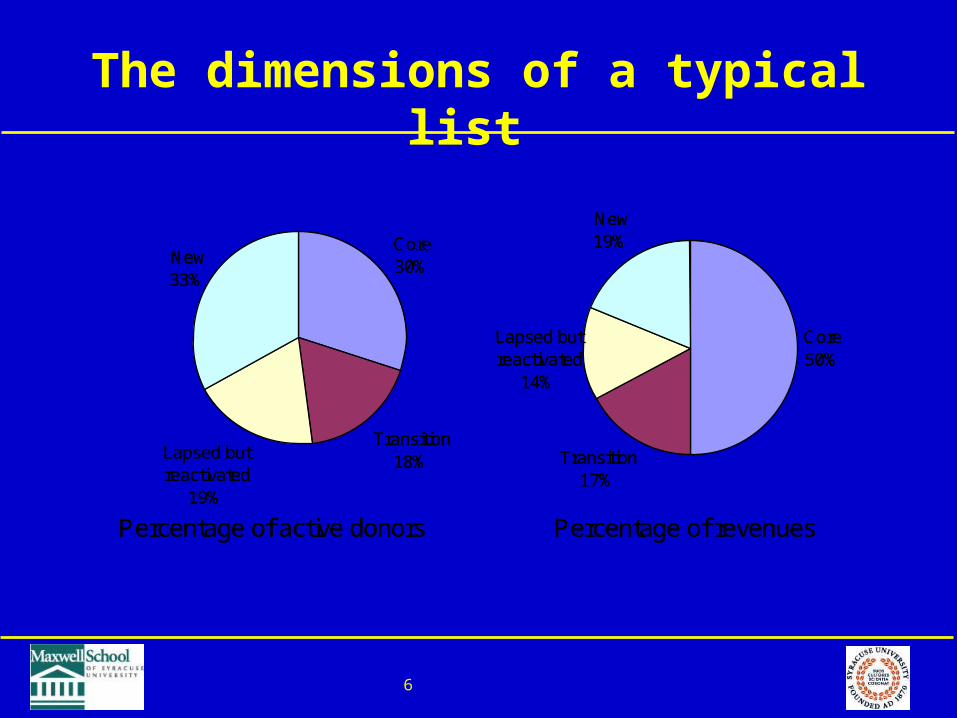
The dimensions of a typical list
Percentage of active donors Percentage of revenues
Core30%
Transition18%Lapsed but
reactivated19%
New33%
Core50%
Transition17%
Lapsed but reactivated
14%
New19%
Percentage of active donors Percentage of revenues
Core30%
Transition18%Lapsed but
reactivated19%
New33%
Core50%
Transition17%
Lapsed but reactivated
14%
New19%
7
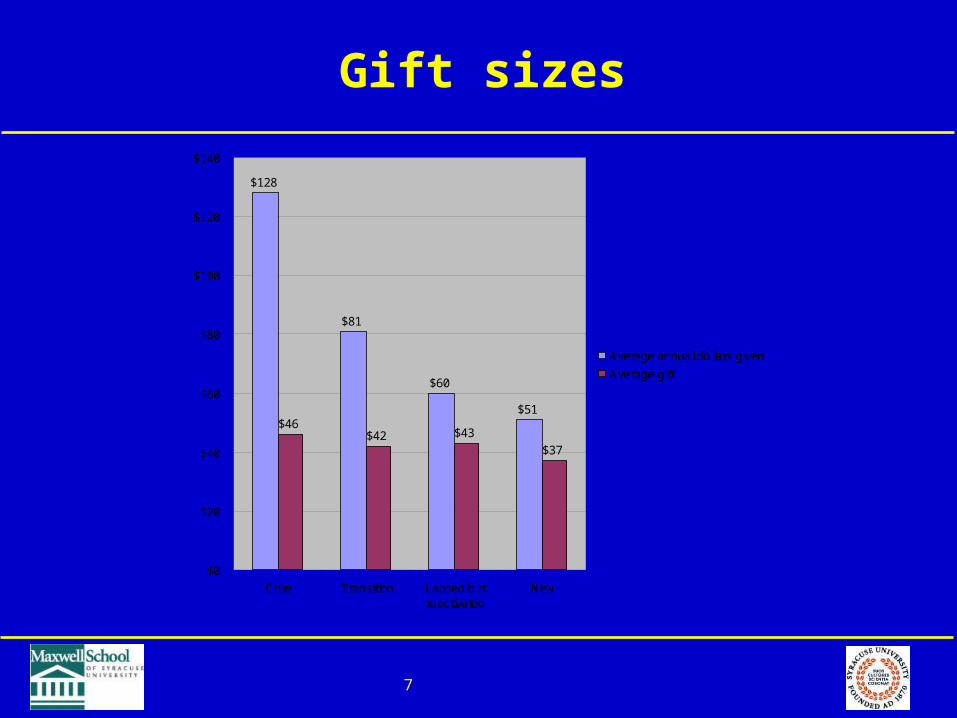
Gift sizes
$128
$81
$60
$51$46
$42 $43
$37
$0
$20
$40
$60
$80
$100
$120
$140
Core Transition Lapsed butreactivated
New
Average annual dollars given
Average gift
8
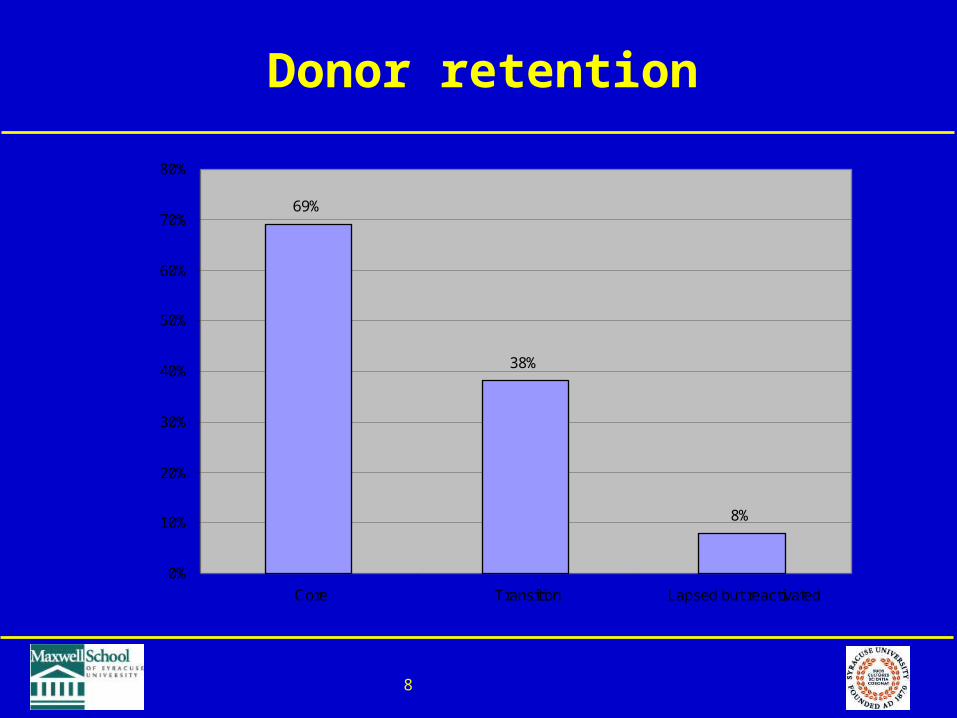
Donor retention
69%
38%
8%
0%
10%
20%
30%
40%
50%
60%
70%
80%
Core Transition Lapsed but reactivated

9
Average number of donations
2.8
1.9
1.4 1.4
0
0.5
1
1.5
2
2.5
3
Core Transition Lapsed butreactivated
New

10
Long Term Value Index
The LTV of donors can be accurately predicted by the amount of their first gifts.
10

11
Why Do Donors Defect?Survey of British Donors who Stopped Giving
• Other NPOs more deserving: 27%• Can’t afford: 22%• Don’t remember supporting: 11%• Didn’t like fundraising: 7%• Not re-asked to give: 3%• Bad service: 2%• Not enough information on uses: 2%• No thank-you: 2%• Felt not needed: 1%
Ref.: Sargeant 2001
12
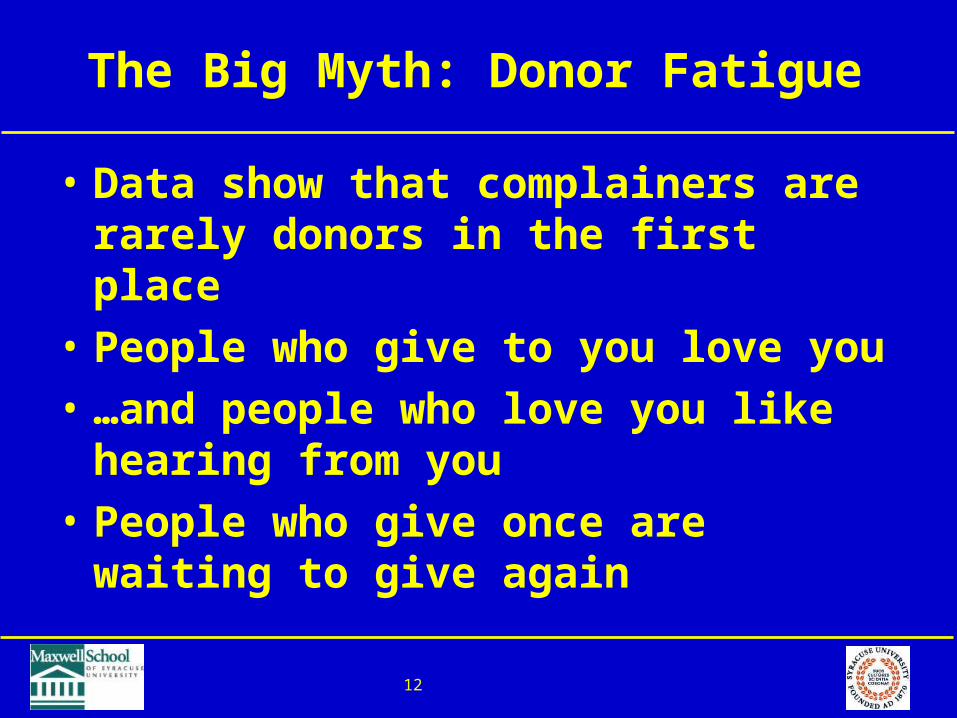
The Big Myth: Donor Fatigue
• Data show that complainers are rarely donors in the first place
• People who give to you love you• …and people who love you like
hearing from you• People who give once are
waiting to give again

13
The Best Donor Pool
• Volunteering and giving are complements, not substitutes
• Volunteering predicts money giving more strongly than income, age, religion, or education
• Don’t forget that donor fatigue doesn’t exist

14
Important Lessons
• Enterprises leave money on the table…– …if they don’t track donors– …if they treat all donors as the
same
• Focus on the core…– …but don’t neglect the others—they
are the future core

15
How to Fundraise
• Build a donor file• Organize it by type of donor• Design appeals appropriate to
donor type• Focus time and money on the
high-yield donors
16
Outline
• Fundraising facts• The beneficiaries of giving• Social enterprise marketing
basics
17
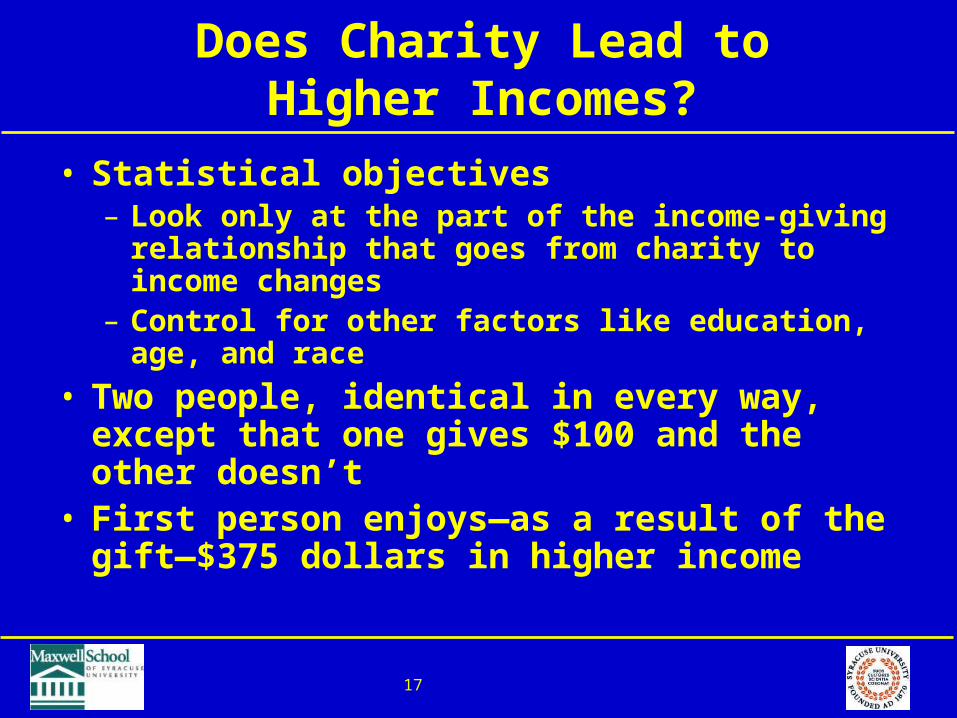
Does Charity Lead to Higher Incomes?
• Statistical objectives– Look only at the part of the income-giving
relationship that goes from charity to income changes
– Control for other factors like education, age, and race
• Two people, identical in every way, except that one gives $100 and the other doesn’t
• First person enjoys—as a result of the gift—$375 dollars in higher income
18
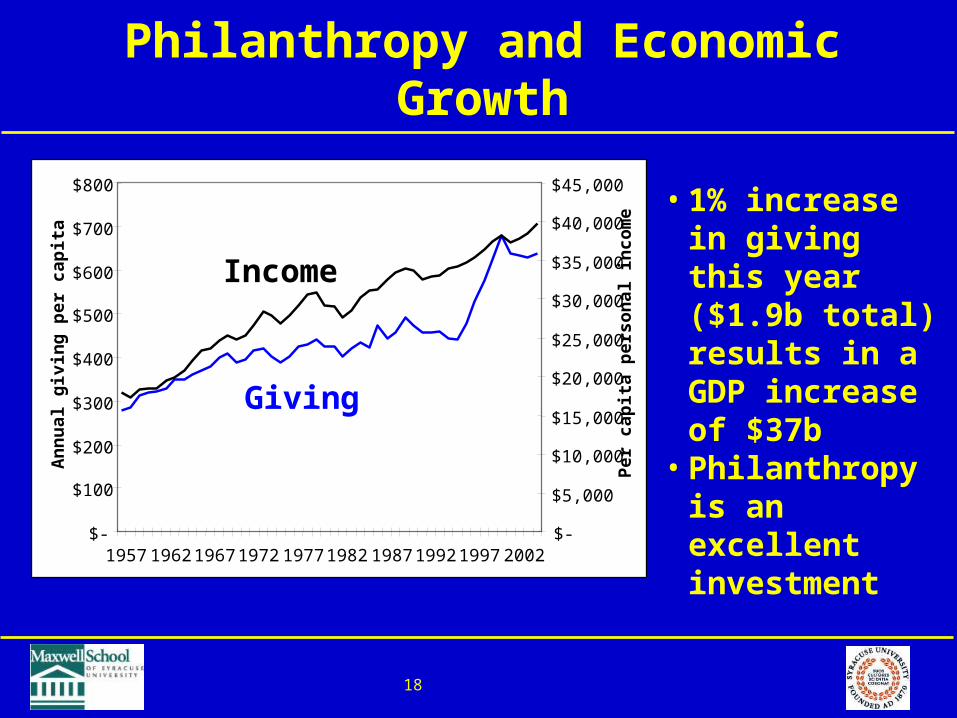
Philanthropy and Economic Growth
$-
$100
$200
$300
$400
$500
$600
$700
$800
1957 1962 1967 1972 1977 1982 1987 1992 1997 2002
An
nu
al g
ivin
g p
er c
apit
a
$-
$5,000
$10,000
$15,000
$20,000
$25,000
$30,000
$35,000
$40,000
$45,000
Per
cap
ita
per
son
al in
com
e
Giving
Income
• 1% increase in giving this year ($1.9b total) results in a GDP increase of $37b
• Philanthropy is an excellent investment

19
Givers are much happier than nongivers
• Why?– Our brains are wired to serve– Approval of our peers– Improved control– Better health– Better citizenship

20
Getting beyond the myths
• Myth #1: Giving makes us poorer• Myth #2: People are naturally
selfish• Myth #3: Giving is a luxury• Myth #4: An entrepreneurial
nation can afford to forgo service• Myth #5: Fundraising is a
necessary evil

21
Outline
• Fundraising facts• The beneficiaries of giving• Social enterprise marketing
basics
22
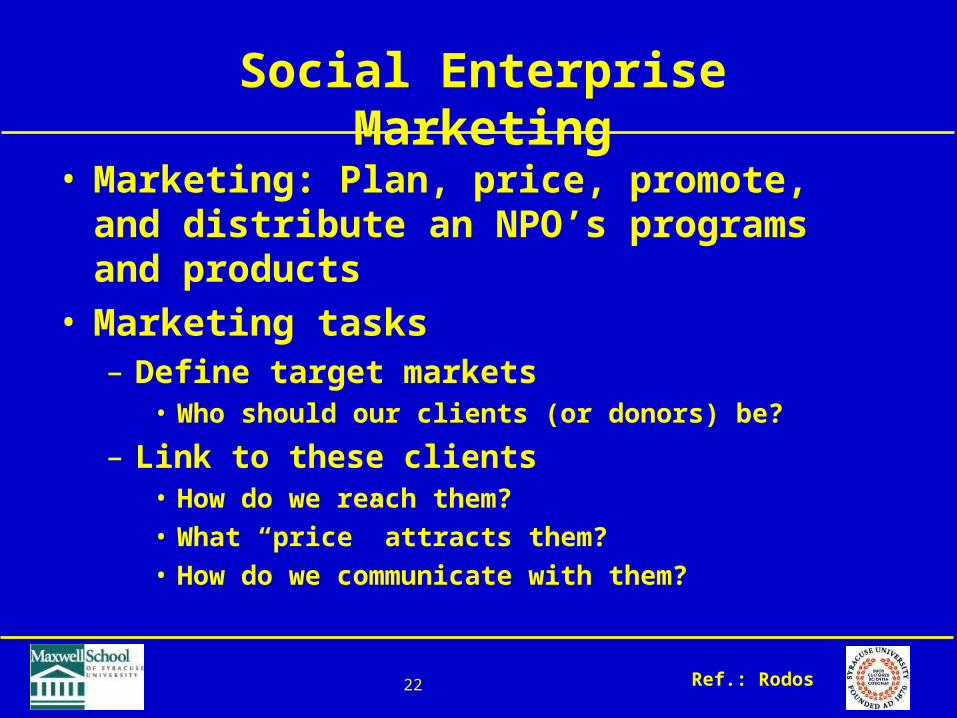
Social Enterprise Marketing
• Marketing: Plan, price, promote, and distribute an NPO’s programs and products
• Marketing tasks– Define target markets
• Who should our clients (or donors) be?
– Link to these clients• How do we reach them?• What “price” attracts them?• How do we communicate with them?
Ref.: Rodos
23
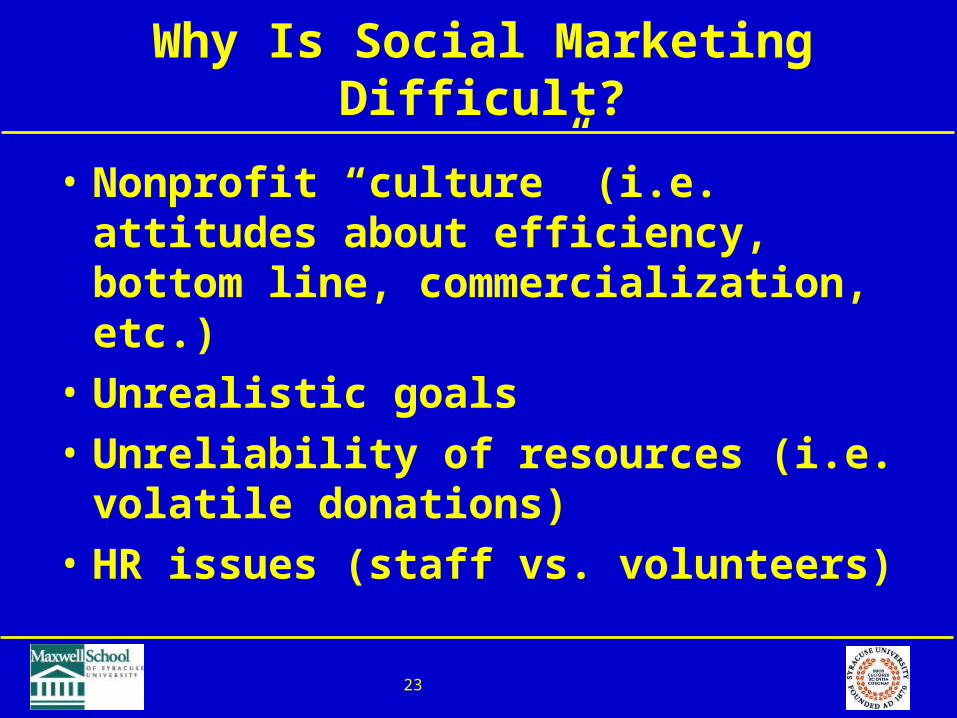
Why Is Social Marketing Difficult?
• Nonprofit “culture” (i.e. attitudes about efficiency, bottom line, commercialization, etc.)
• Unrealistic goals• Unreliability of resources (i.e.
volatile donations)• HR issues (staff vs. volunteers)

24
Steps in Building aMarketing Strategy
• External analysis– Who are my
constituents?– Who are my
competitors?– What is my industry?
• Internal analysis– What do constituents
think we do?– What do constituents
think we ought to do?
• Firm development– Market growth– Product growth
• Strategy selection and evaluation
• Communication
25
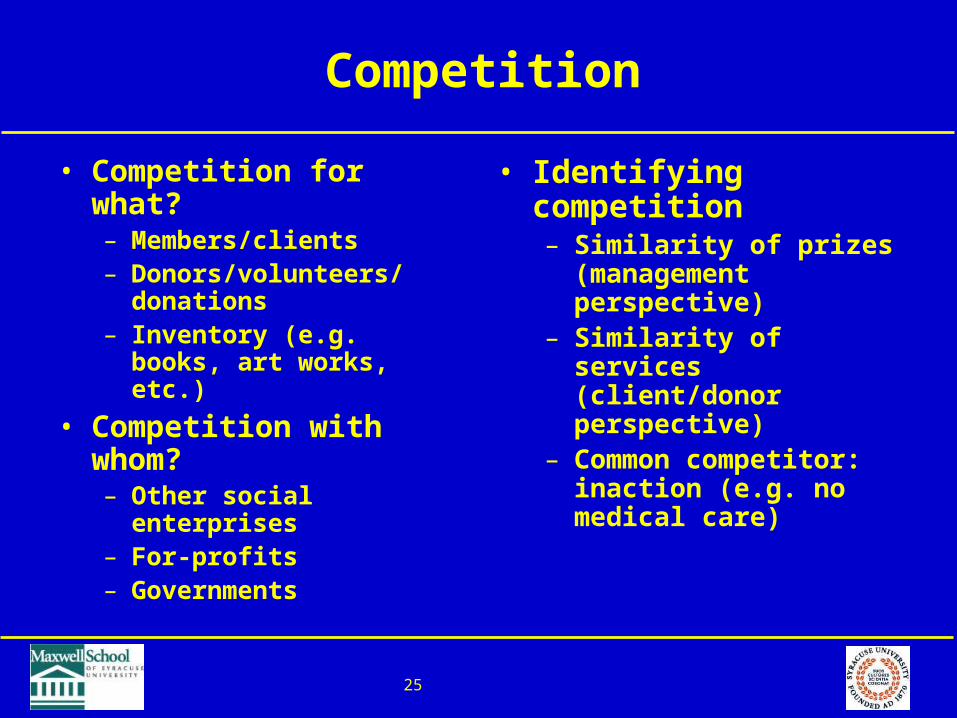
Competition
• Competition for what?– Members/clients– Donors/volunteers/
donations– Inventory (e.g. books,
art works, etc.)
• Competition with whom?– Other social
enterprises– For-profits– Governments
• Identifying competition– Similarity of prizes
(management perspective)
– Similarity of services (client/donor perspective)
– Common competitor: inaction (e.g. no medical care)

26
Firm Development
Existing markets
New markets
Existing products
Market penetration
Market expansion
New products
Product development
Diversification
Nonprofit example:University
Existing markets
New markets
Existing products
Recruit college-bound seniors
Recruit career-changers
New products
Create a new program for
undergraduates
Create an executive
education program
Ref.: Rodos

27
Communication Tools
• Explicit communications– Annual reports– Newsletters– Press releases– Brochures– Direct mail– Media advertising– Telemarketing– Special events
• Implicit communications– Pricing– Products– Distribution

28
Targeting Messages to Demographic Groups
Ref.: Van Slyke 2002
DEMOGRAPHICS TO TARGET
FUNDRAISING FOCUS
SENSE OF COM-MUNITY
CHARITIES ARE MORE EFFECTIVE THAN GOV’T
SENSE OF DUTY
HELPED YOU IN TIMES OF NEED
TAX BENEFITS
RELIGIOUS REASONS
LOW INCOME
X X
YOUNGER
X
PRACTICING FAITH
X X
MARRIED
X
SINGLE
NONWHITE
X X
WOMEN
X X X X
CONSERVATIVES
X
VOLUNTEER
X X X X X
29
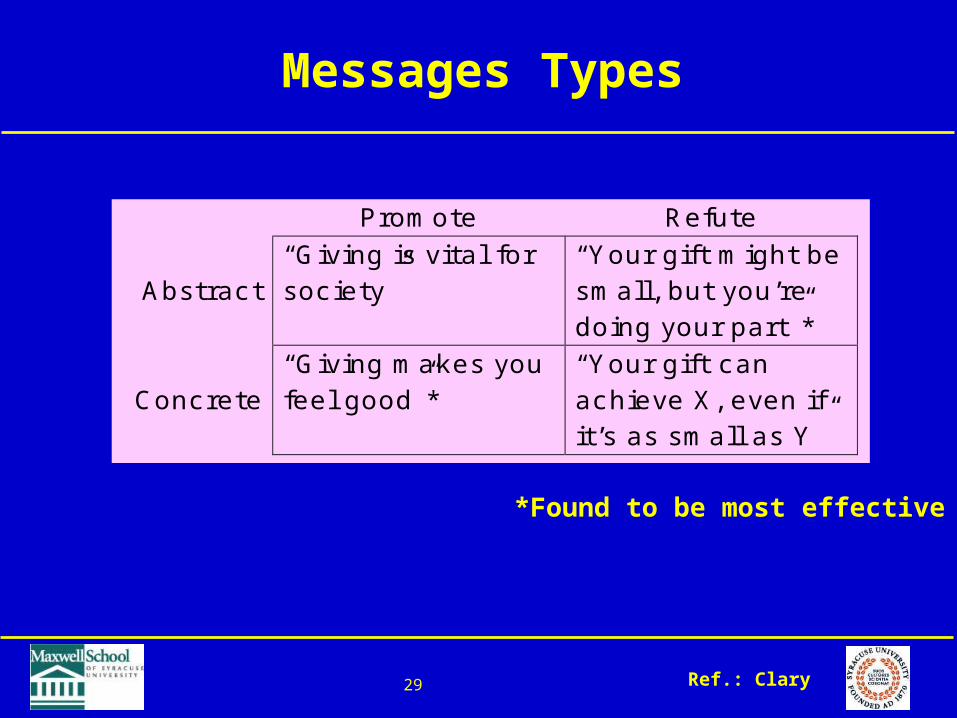
Messages Types
Promote Refute
Abstract “Giving is vital for society”
“Y our gift might be small, but you’re doing your part”*
Concrete
“Giving makes you feel good”*
“Y our gift can achieve X, even if it’s as small as Y ”
*Found to be most effective
Ref.: Clary