1 passive components and circuits - ccp lecture 4
TRANSCRIPT

1
Passive components and circuits - CCP
Lecture 4

/372
Content
Basics Circuit characteristics and parameters Logarithmical representation
Passive circuit elements Resistor
/373
Circuit characteristics
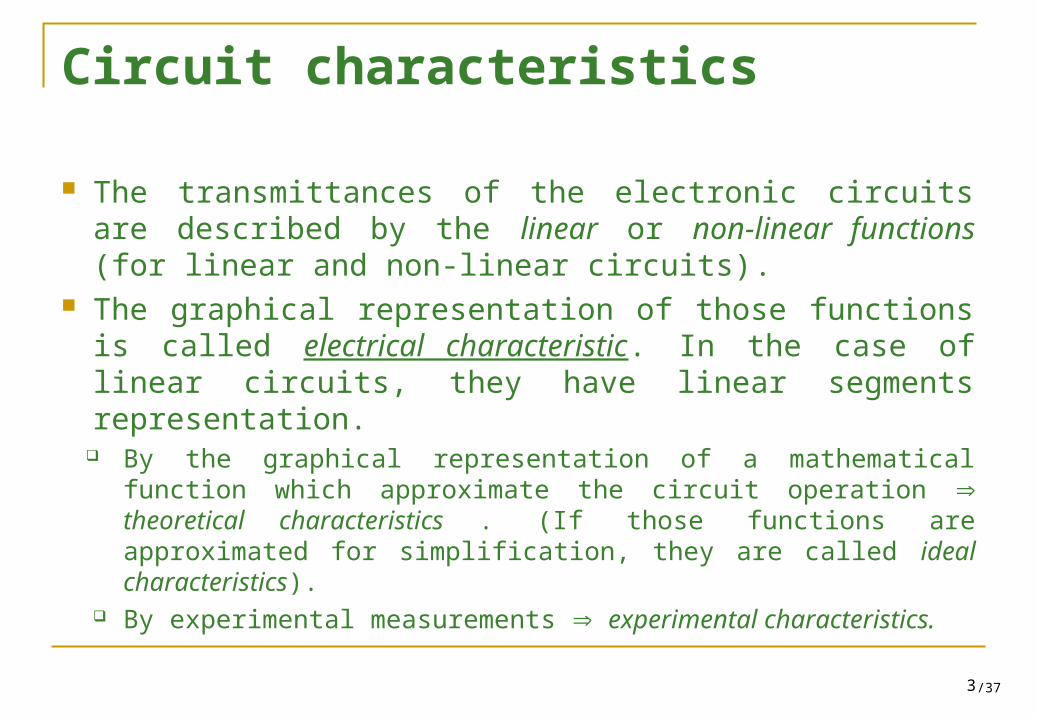
The transmittances of the electronic circuits are described by the linear or non-linear functions (for linear and non-linear circuits).
The graphical representation of those functions is called electrical characteristic. In the case of linear circuits, they have linear segments representation. By the graphical representation of a mathematical function which
approximate the circuit operation theoretical characteristics . (If those functions are approximated for simplification, they are called ideal characteristics).
By experimental measurements experimental characteristics.

/374
Errors in determination of electrical characteristics In the case of theoretical characteristics:
The incapacity of the mathematical model to consider all factors which act over the circuit (sometimes, a simple model is used).
Approximations in solving of mathematical model (sometimes, the mathematical model is too difficult to be solved).
In the case of experimental measurements: The incapacity of total separation of interested quantities from
others (noise). Errors introduced by the measurements instruments and
measurements method .

/375
Family of characteristics In most cases, an electric quantity is not dependent of a
single variable (electric or non-electric variable) . The dependency of a characteristic by the second (or even
third) variable is represented as a family of characteristics in plane (or in space) .
In electronics circuit behavior, one of most important non-electric variable is the temperature.
.
1, 2,...
( ) ( , )
( )
p cst
p p p
v v i one characteristicv v i p
v v i family of characteristics

/376
Family of characteristics - example
a) Family of linear characteristics b) Family of non-linear characteristics
/377
Circuit parameters
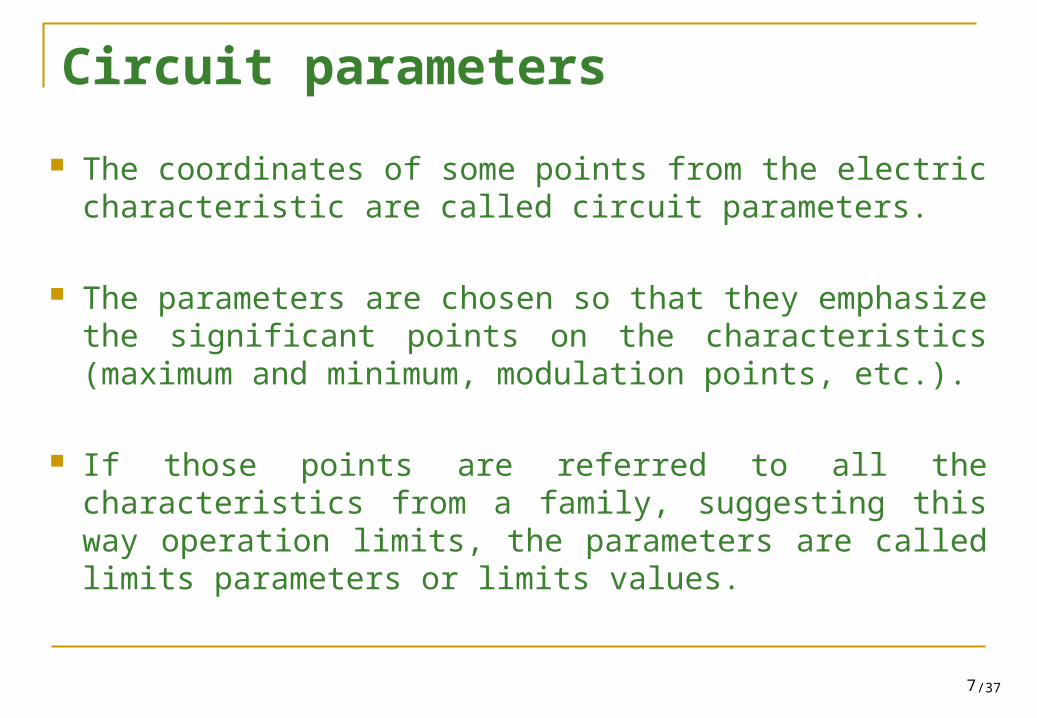
The coordinates of some points from the electric characteristic are called circuit parameters.
The parameters are chosen so that they emphasize the significant points on the characteristics (maximum and minimum, modulation points, etc.).
If those points are referred to all the characteristics from a family, suggesting this way operation limits, the parameters are called limits parameters or limits values.

/378
Electronics data books
They represent a collection of characteristics and parameters, made by the manufacturers, which describe the electronics components behavior.
Usually, the data book characteristics and parameters have standardized signification => the signification is the same for all manufacturers.
/379
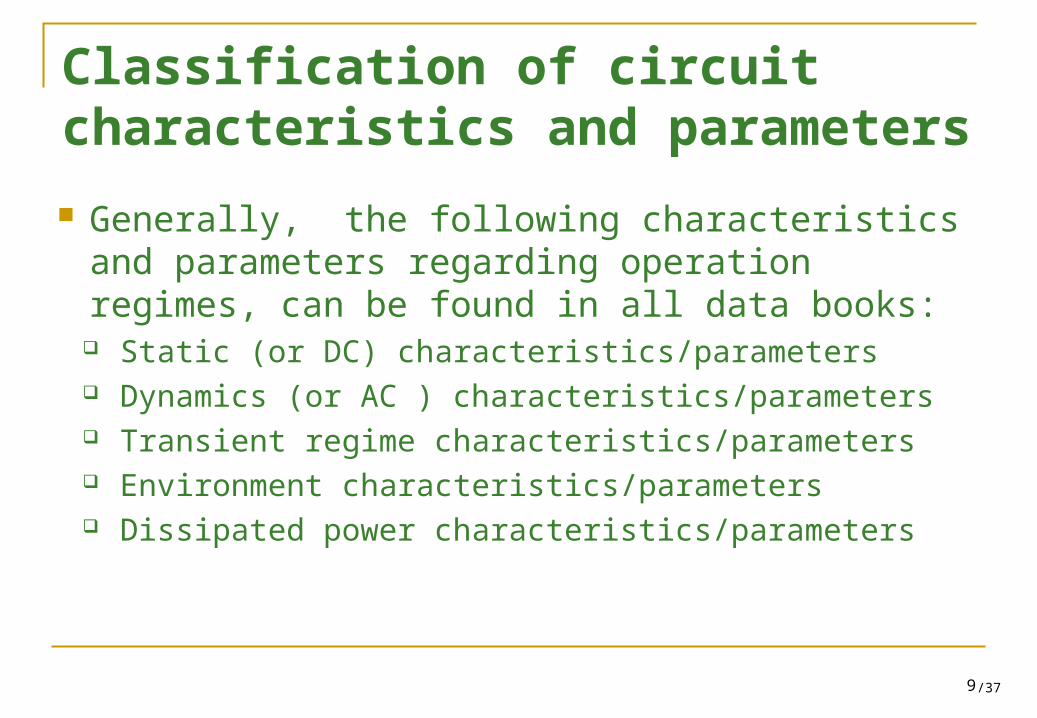
Classification of circuit characteristics and parameters
Generally, the following characteristics and parameters regarding operation regimes, can be found in all data books: Static (or DC) characteristics/parameters Dynamics (or AC ) characteristics/parameters Transient regime characteristics/parameters Environment characteristics/parameters Dissipated power characteristics/parameters

/3710
DC Operation Regime
In this operation regime, the electric quantities are not time dependent (during the observation period).
These parameters reflect significant points of the characteristics or absolute limit values that cannot be exceeded.

/3711
Alternating current (AC) operation regime • The electrical stimulus applied
to the circuit (component) are usually sinusoidal.
• In this case, the ratios (the transmittances) of output to input signals are called Gains (Amplifications) if they are greater than the unit value or Attenuations if they are smaller than the unit value.
• For an Amplifier Block the power amplification (power gain) Ap is defined as the ratio of output (load) power to input power. ldimensionanon:
]S[:
][:
ldimensionanon:
ldimensionanon:
/
/
I
Op
i
ovi
i
oiv
i
oi
i
ov
P
PA
v
iA
i
vA
i
iA
v
vA

/3712
AC operation – frequency representation In alternative current, the transmittances are dependant by the signal frequency f,
or the signal pulsation, =2f. The frequency dependency of transmittances is represented by the frequency
characteristics. For frequency representation, the sinusoidal quantities are described like vectors:
jtjeVjVtVtv )()cos(2)(
http://mathworld.wolfram.com/Phasor.html http://www.clarkson.edu/~svoboda/eta/phasors/MatchPhasors10.html http://www.physics.udel.edu/~watson/phys208/phasor-animation.html http://www-ccrma.stanford.edu/~jos/filters/Phasor_Notation.html http://www.usna.edu/MathDept/CDP/ComplexNum/Module_5/PhasorForm.htm

/3713
Transfer function The ratio between two electric quantities represented by
vectors is called transfer function. The transfer function is a complex quantity, characterized
by the modulus and phase. Consequently, the frequency representation has two components: Modulus-frequency characteristic (the amplitude ratio) Phase-frequency characteristic
)]j(Re[
)]j(Im[
)]j([Im)]j([Re)j(
)]j(jIm[)]j(Re[)j(
)j()j(
)j(
22
H
Harctg
HHH
HHv
vH
tH
i
o
/3714
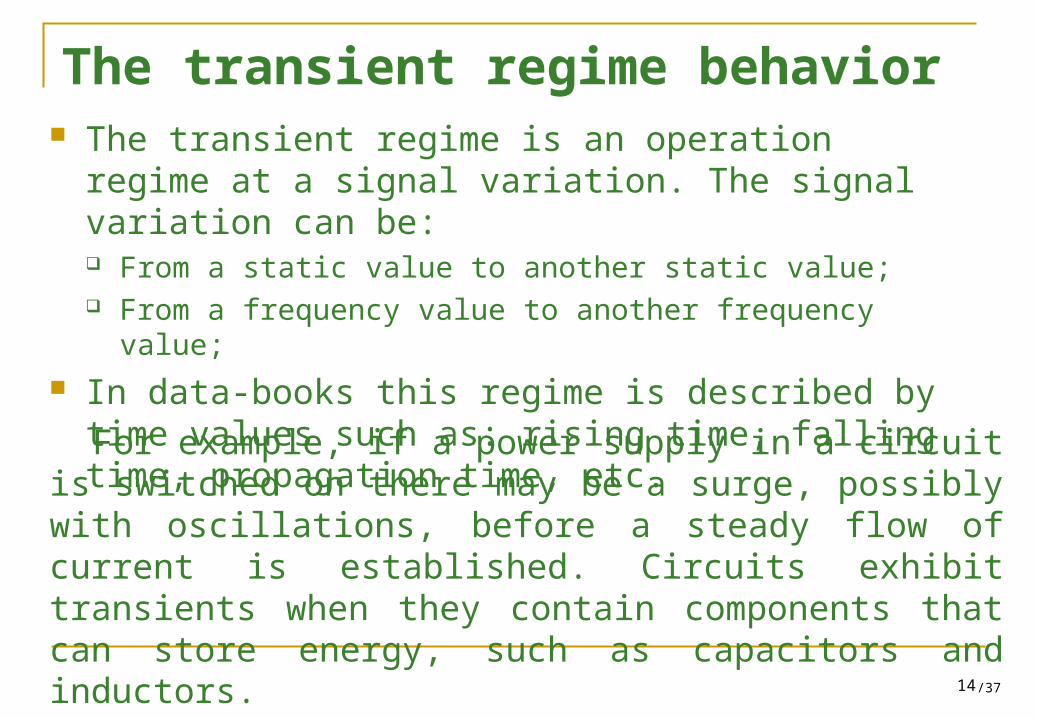
The transient regime behavior The transient regime is an operation regime at a signal
variation. The signal variation can be: From a static value to another static value; From a frequency value to another frequency value;
In data-books this regime is described by time values such as: rising time, falling time, propagation time, etc.
For example, if a power supply in a circuit is switched on there may be a surge, possibly with oscillations, before a steady flow of current is established. Circuits exhibit transients when they contain components that can store energy, such as capacitors and inductors.
/3715
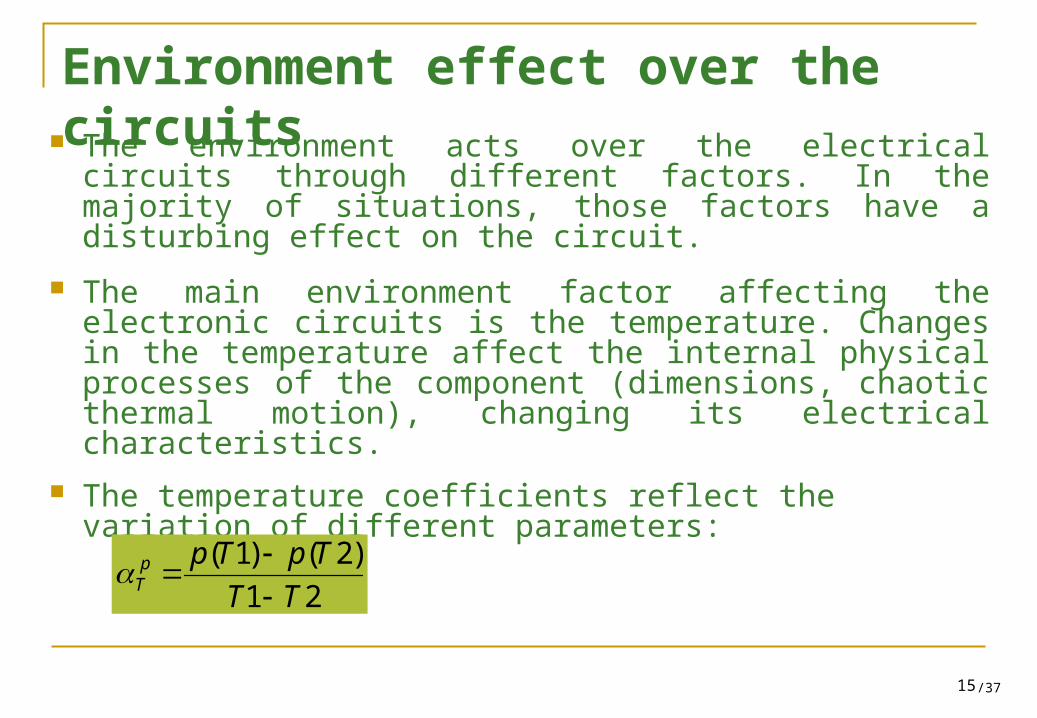
Environment effect over the circuits The environment acts over the electrical circuits through
different factors. In the majority of situations, those factors have a disturbing effect on the circuit.
The main environment factor affecting the electronic circuits is the temperature. Changes in the temperature affect the internal physical processes of the component (dimensions, chaotic thermal motion), changing its electrical characteristics.
The temperature coefficients reflect the variation of different parameters:
21
)2()1(
TT
TpTppT

/3716
The dissipated power The electrical phenomena taking place in electronic
devices and circuits are constantly affected by Joule effect (heat dissipation). The heat accumulation in the circuit structure will increase its temperature.
Therefore, in data books are presented parameters and characteristics that restrict the dissipated power in the circuit under particular environment conditions.
Not all the parameters specifying limit values are connected with the dissipated power; there are also other destructive phenomena.
/3717
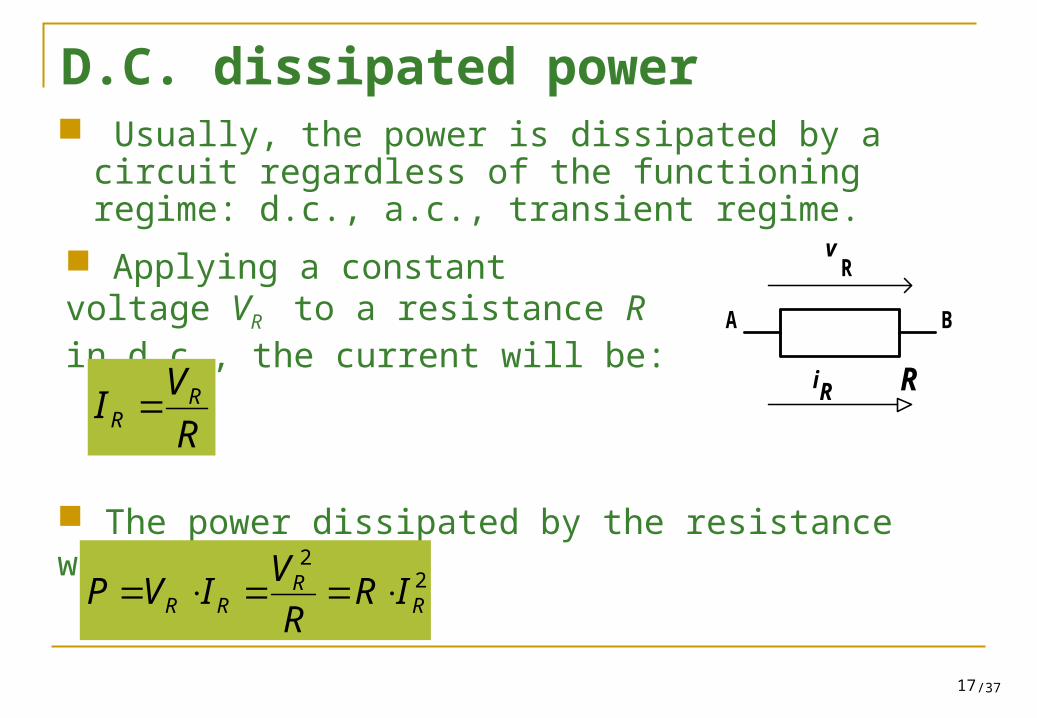
D.C. dissipated power Usually, the power is dissipated by a circuit
regardless of the functioning regime: d.c., a.c., transient regime.
R
A B
iR
vR Applying a constant voltage VR to a
resistance R in d.c., the current will be:
R
VI RR
The power dissipated by the resistance will be:
22
RR
RR IRR
VIVP

/3718
A.C. dissipated power Applying a sinusoidal voltage on a resistance:
R
A B
iR
vR
The current through the resistance will be:
)sin()(
)( max tR
V
R
tvti R
R
The instantaneous power dissipated by the resistance is:
)(sin)()()( 22
max tR
Vtitvtp RR
)sin()( max tVtvR
The average power dissipated:
22
0
22max
0
22
max
0
)(sin11
)(sin1
)(1
efef
TTT
med IRR
VdttV
TRdtt
R
V
Tdttp
TP

/3719
Tolerances of electrical parameters In data books, the parameters values indicated by the
manufacturers are target values (nominal values).
Due to a different number of factors (technological factors, reduced costs etc) the real values of the parameters are near to the rated (target) values. By the selective measurements, the manufacturers offers only those components which have the parameters in the some specific limits around the rated value.
The maximum accepted difference between real and rated values is called tolerance.

/3720
The tolerance expression The tolerance can be evaluate
as absolute tolerance, specifying the minimum and maximum values of a parameter.
The percentage tolerance reflects the maximum difference from a rated value.
Knowing the percentage tolerance makes it easy to determine the absolute tolerance.
min max[ , ]
max
[ (1 ), (1 )]
nom
nomp
nom
nom p nom p
p p p
p pt
p
p p t p t

/3721
Representation to a logarithmic scale By logarithmic scale representation, the x variable
representation is replaced by the lgx (or lnx) representation.
The logarithmic representation can be made only for positive values of a variable. In order to achieve this condition, the modulus representation of a variable is used. By logarithm, the 0 value of axes became -. The old smaller than unity values became negative, and
greater than unity values became positive.

/3722
Advantages of logarithmic technique Allows a compression of representation domain.
Allows the obtainment of a linear characteristic.
Convert the multiplying/dividing operations in added/subtracting operation these operations can be graphical performed.
)lg()lg(lg)(
)(lg edcba
ed
cba

/3723
Linear representation - example
The representation of the following complex functions.
Representation of a 100Hz-100MHz frequency domain.
6
6
6
10j1
10j2
10j1
11
f
fA
fA
v
v

/3724
Logarithmic representation- example The representation
of the same values

/3725
Characterization of electrical quantities by logarithmic ratio
The transfer ratio represents the logarithms of a non-dimensional ratio (regarding the input and output).
The transfer ratios are used to characterize the system transfer properties (ex: amplification, line attenuation etc).
pp
ii
vv
AA
AA
AA
lg10]dB[
lg20]dB[
lg20]dB[

/3726
The double logarithmic representation - example
The previous complex functions are used; The vertical axes is represented in dB (logarithmic scale); It can be observed the linear representation of these two functions.

/3727
Bode diagrams representation
The Bode diagram method assumes the replacement of the double logarithmic representation with asymptotes and tangents on the graphics.
We obtain a graphical representation only with straight lines.
This type of representation allows an easier additional graphical operation.

/3728
Bode diagrams representation - example In this figure we added the Bode diagrams for the previous two functions: Green for |A1v|; Red for |A2v|;

/3729
Additional operation for Bode diagrams - example
In the second figure we shown the amplification (with black- at the logarithmic scale, and with blue- by the Bode diagrams)
]dB[2]dB[1
2lg201lg20
21lg20]dB[
vv
vv
vvv
AA
AA
AAA

/3730
Example 1 – Using Bode diagrams
4
8
8
11
1 j 10
j 102
1 j 10
v
v
Af
fA
f

/3731
Example 2 – Using Bode diagrams
8
4
4
11
1 j 10
j 102
1 j 10
v
v
Af
fA
f

/3732
Signals levels
Absolute signal level report the system signal values to a fixed reference value.
The relative level signal report the analyzed signal to an unknown value signal.
]dB[lg20 μVdB 0VVxV
Voltage level-the reference value is V0=1V
]dB[lg20 μAdB 0II xI
Current level-the reference value is I0=1A
]dB[lg10 pWdB 0PPxP
Power level- the reference value is P0=1pW
/3733
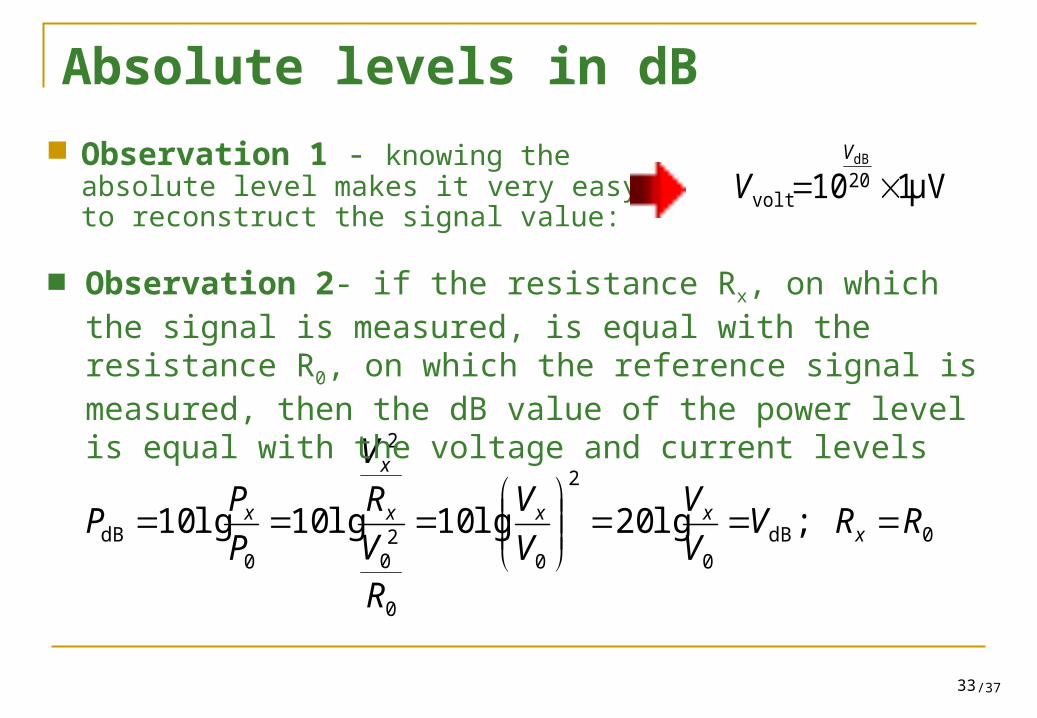
Absolute levels in dB
Observation 1 - knowing the absolute level makes it very easy to reconstruct the signal value:
μV110 20volt
dB
V
V
0dB0
2
0
0
20
2
0dB ;lg20lg10lg10lg10 RRV
V
V
V
V
R
V
R
V
P
PP x
xxx
x
x
Observation 2- if the resistance Rx, on which the signal is measured, is equal with the resistance R0, on which the reference signal is measured, then the dB value of the power level is equal with the voltage and current levels

/3734
Absolute levels in dB Observation 3 – if the power level in dB and the
resistance value are known, the absolute voltage and current levels can be calculated in the following way:
3dB21/2 6dB2; 20dB10; 120dB106
Example – the following levels in dB have the corresponding values on linear scale:
dB dB 10lg( /1 )V P R respectively
dB dB 10lg( /1 )I P R

/3735
Absolute levels in Np
If the decimal logarithms used for dB representation are replaced by natural logarithm, the levels will be evaluated in Nepers (Np).
The relation between Np and dB and vice-versa are: 1Np8,686dB, 1dB0.115Np
]Np[ln
]Np[ln
0Np
0Np
I
II
V
VV
x
x
]Np[ln2
1
0Np P
PP x
/3736
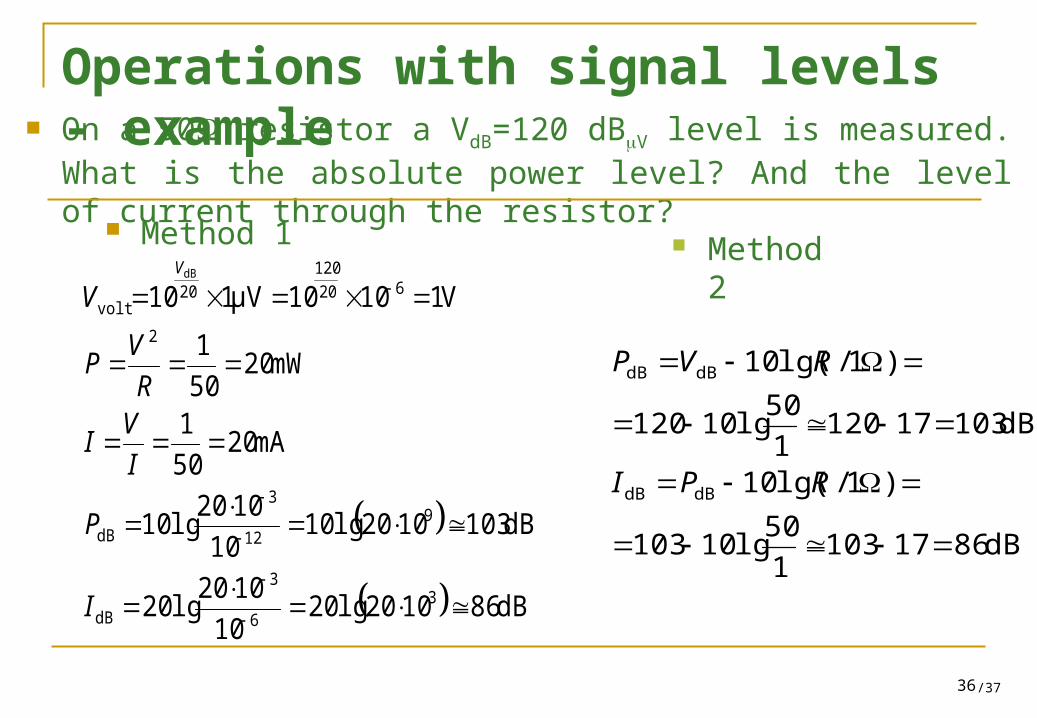
Operations with signal levels - example On a 50 resistor a VdB=120 dBV level is measured. What is the absolute power level? And the level of current through the resistor?
Method 1
dB861020lg2010
1020lg20
dB1031020lg1010
1020lg10
mA2050
1
mW2050
1
V11010μV110
36
3
dB
912
3
dB
2
620
120
20volt
dB
I
P
I
VI
R
VP
VV
Method 2
dB86171031
50lg10103
)1/lg(10
dB103171201
50lg10120
)1/lg(10
dBdB
dBdB
RPI
RVP

/3737
Passive circuits elements
Resistance as circuit element – Homework Ohm’s Law Power dissipated on a resistor
In direct current In alternative current
Series and parallel connections How resistance can limit the current? How resistance can limit the voltage?