1 page mortice limited annual report & accounts 2009 · 2017-07-14 · 6 | page mortice limited...
TRANSCRIPT


1 | P a g e M o r t i c e L i m i t e d A n n u a l R e p o r t & A c c o u n t s 2 0 0 9
Contents 02 Chairman’s statement
05 Chief Executive’s statement
10 Year in review:
Tenon Property Services
13 Peregrine Guarding
16 Tenon Project Services
18 Financial review
21 General information
23 Board of Directors
26 Financial contents
27 Directors’ report
32 Corporate governance report
35 Statement by Directors
36 Independent auditors’ report
38 Financial Statements
45 Notes to Financial Statements

2 | P a g e M o r t i c e L i m i t e d A n n u a l R e p o r t & A c c o u n t s 2 0 0 9
Chairman’s Statement Manjit Rajain
Expanding our Horizons
The ‘India Story’ is well‐known. Over recent years, off‐
shoring and outsourcing have helped to fuel the Indian
economy and the facilities management and security
industries have benefited and grown in parallel. Watching
how these industries have developed in mature markets has
helped us to see the immense opportunity for Mortice
Limited ('Mortice' or the 'Company') in India today. With
increasing privatisation and a rapidly growing public private
partnership initiative programme, we remain confident that
the market for our Facilities Management ('FM') and security
services will grow beyond any published market projection.
In a year of increased extremist activity, Government, industry and the population at large have become
more security conscious. In turn, the demand for security services has not dropped as much during the
economic downturn as has been witnessed in many other industries. As reported in the Company's trading
update on 8 June 2009, various factors have adversely impacted the Company and its subsidiaries (together
the 'Group') financial performance during the year. Despite the impact that the downturn has had on
business generally, the Group revenues for the year have still grown by 15.3% since the close of financial
year 2007‐08, which we believe is a creditable performance.
Apart from reducing our ability to achieve our projected sales, the Company had also announced on 24
December 2008, that the Board had decided not to pursue the general contracting business as it was highly
likely to face a negative impact as a result of the economic slowdown and its direct impact on the real
estate and infrastructure sectors, which would have resulted in lower margins and also had a high working
capital requirement.
As announced in the Company's trading update on 8 June 2009, the overall impact of the global economic
slowdown including the weakening of the Indian Rupee against the US dollar, the charging of expenses
associated with the Company's listing process, the cost of establishing our new FM business, and
preliminary Mergers & Acquisitions (‘M&A’) activity and overseas market opportunity research, Mortice’s
first full year results reflect our investment in the business. Like many other businesses, we have reduced
our cost base wherever we can do so without negatively impacting our plans for growth and we are
extremely confident that the foundations we have laid will enable the Group to demonstrate superior
growth during financial year 2009‐10.

3 | P a g e M o r t i c e L i m i t e d A n n u a l R e p o r t & A c c o u n t s 2 0 0 9
In a year in which the global economy took a severe downturn and many countries moved into recession,
India achieved a GDP of 7.1%. Post economic downturn, India originally projected GDP would fall to 5.7%
for FY2009‐10 but has now revised its GDP projections to 6.5% with the services sector expected to grow by
8.2 per cent1 and we are already seeing an increase in new business inquiries and new wins. Our model for
self‐performing our facilities management services has attracted new customers during the recession as
businesses have sought ways of reducing their costs. The track record we have now established has given
Tenon brand recognition within the marketplace a result of which we are seeing a growing number of new
business enquiries.
1 Centre for Monitoring Indian Economy (CMIE) – June 2009
Figure 1: 15 May 2008 ‐ Mortice Lists on AIM
4 | P a g e M o r t i c e L i m i t e d A n n u a l R e p o r t & A c c o u n t s 2 0 0 9
With the establishment of a pan‐India footprint for Tenon Property Services Limited ('Tenon') to match that
of Peregrine Guarding Limited ('Peregrine'), we have achieved one of our key strategic objectives to fill a
gap in the market by developing a service delivery platform to service customers with large, dispersed
operations. In parallel, our team has developed a sophisticated technology platform to be able to monitor
and manage these operations for our customers providing superior management information enabling
timely, quality management decisions. This key achievement has given us the opportunity to bid for large
pan‐India contracts that will enable a step change in our revenue generation capability.
Many services businesses say that “People are their only asset.” As a self‐performing service provider, this is
particularly the case with Mortice. The platform that we have now established is the result of a huge team
effort during our first year of operation under very challenging market conditions and I thank them all.
We now, confidently, expect to see our investment come to fruition as we continue to expand our horizons.
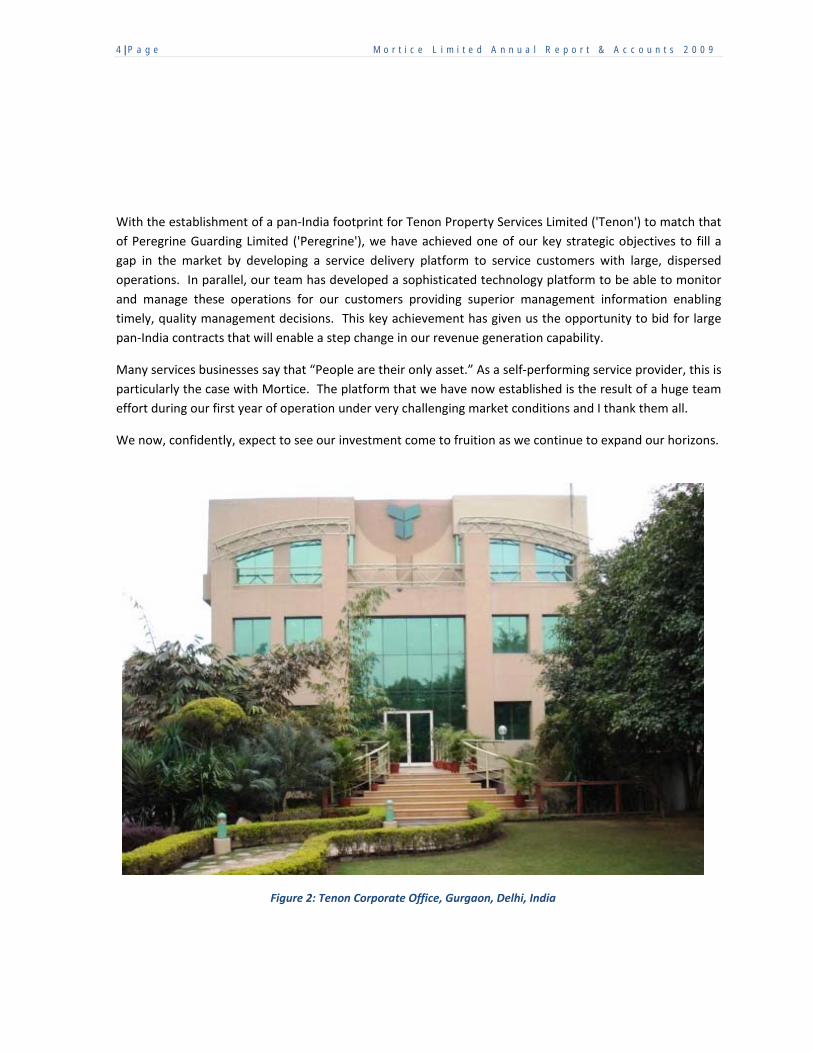
Figure 2: Tenon Corporate Office, Gurgaon, Delhi, India

5 | P a g e M o r t i c e L i m i t e d A n n u a l R e p o r t & A c c o u n t s 2 0 0 9
Chief Executive’s Statement Andrew Barker
EXPANDING OUR BUSINESS
The Company set out with certain primary objectives at the
start of the financial year, predominant amongst them to
establish a differentiated outsourced facilities services
corporation. This we aimed to do through the following five
key initiatives:
Expanding our services ‐ Establishing a platform for the
delivery of integrated facilities services through a model of
“self‐performance” by harnessing the spread and strength
of the pan‐India infrastructure of Peregrine Guarding to
offer superior service standards across the country
Expanding our markets ‐ Extending the reach of professional facilities services to address “non‐
traditional” sectors which have historically performed facilities services through own staff (“in‐
sourced”) or local sub‐contractor vendor bases (“out‐tasked”)
Expanding our talent base ‐ Developing top talent with expertise in the various diverse facets of FM
and guarding including engineering services and critical infrastructure management, soft services
delivery, quality, technology support and finance amongst others.
Expanding our Knowledge Base ‐ Developing a superior, customer focused, technology platform to
provide a single client view for all facilities‐related management information requirements to enable
our customers to make informed, timely, quality decisions.
Expanding our Geographies ‐ Developing a pan‐India capability for the delivery of our FM services.
We have made considerable progress during the year towards the achievement of these strategic
objectives. Leading Indian and multinational corporations have bought our services and our track record to
date has now established the Tenon brand as a quality, preferred alternative to the traditional facilities
management sub‐contracting model.
In anticipation of consolidation within the FM and security marketplace in India, considerable effort was
also spent in reviewing the existing facilities services supplier base in India to identify suitable, potential
acquisition targets. Surprisingly, we identified nearly 150 service providers covering every conceivable facet
of the facilities management product. Many of these are small to medium size, local companies. Not
surprisingly, industry consolidation has already started.

6 | P a g e M o r t i c e L i m i t e d A n n u a l R e p o r t & A c c o u n t s 2 0 0 9
Since the close of the reporting period, Mortice has acquired Rotopower Projects Private Limited
('Rotopower'), a medium‐sized pan‐India Mechanical & Electrical (‘M&E’) turned facilities management
service provider, which has given us strength and depth in this field and helped us to expand our geographic
footprint into East India and strengthened our position in North India.
We are very excited about the acquisition of Rotopower as there are significant synergies across the Group
most notably in cross‐sales opportunities. In the short time since the acquisition took place, we have seen a
number of new sales leads passing between the Group companies. Our expanded infrastructure has also
given us the capacity to be able to manage a significantly larger business with a reduced incremental
overhead. We are now also bidding into new geographies without the need to establish new offices in
those areas where Rotopower already have a presence. The acquisition also provides us with an entry
strategy for those Indian corporate who may not yet be ready for a full FM service but are used to
outsourcing their M&E, housekeeping and security services. Once again, this underlines Tenon’s strategy of
providing “Services That Fit”.
At a strategic level, the acquisition also helps us to adapt as a Group to the changing strategies of our
different customer market sectors. In the interests of generating productivity, we have various customers
who have been moving from discrete services such as manned guarding, M&E and housekeeping to a
“caretaker model” with multi‐tasked employees. In the fast‐growing telecommunications market in India,
Rotopower is currently providing both discrete M&E services and “caretaker” services. Peregrine also has a
significant presence in this market providing security services. As the market matures and we see more
customers seeking similar cost‐efficiency, the combined Tenon and Rotopower platform will enable us to
respond to these changing demands.
Figure 3: Tenon acquisition of
Rotopower ‐ 30th June 2009

7 | P a g e M o r t i c e L i m i t e d A n n u a l R e p o r t & A c c o u n t s 2 0 0 9
A significant feature of our growing success has been the development of 'TeNet', a single client view, web‐
based suite of applications that support our service delivery and provide our clients and our management
team with transparent, in depth management information. Our technology platform combined with our
ability to deliver mandates in hinterland markets has opened up a much wider potential customer base for
the many companies that have large, dispersed retail portfolios.
During the year, we have continued to attract top industry talent in all our subsidiaries. Our key resources
come with many years of industry experience and qualifications in specialist facilities and security services
fields. This has provided us with the ability to offer enhanced service standards and helped us to gain
recognition for a refreshing and innovative approach to the delivery of our services.
WHY INDIA NEEDS MORTICE?
Over the past 10 years since the recognition of FM services in India, the evolving industry has polarised into
2 distinct sets of service providers; international real estate ('RE') service providers and local vendors.
Whereas the RE service providers are offering higher value solutions, the cost of the service is prohibitive
for many companies in India. By contrast, the low‐cost, local vendor base does not provide the
sophistication or quality of the RE service providers. Tenon was established to provide higher quality FM
services at a cost that is attractive to a much wider customer base.
‘Higher value at lower cost’ ‐ Tenon’s vertically integrated service delivery model unlocks value lost in the RE
service provider model where service delivery is sub‐contracted.
8 | P a g e M o r t i c e L i m i t e d A n n u a l R e p o r t & A c c o u n t s 2 0 0 9
Going forward, the Company’s focus is to develop Tenon into a truly integrated outsourced management
services corporation and to ensure that Peregrine continues its strong growth by offering a high‐end,
differentiated security product to support our customers’ security needs in the face of increased extremist
activity.
The Public Private Partnership ('PPP') space in India is rapidly gathering momentum. India’s 11th plan has
projected an investment of nearly US$ 500 billion in infrastructure, of which 30% is expected to come from
private investment2. Recognizing the significant fillip that the Private Finance Initiative (‘PFI’) and then PPP
has given to the FM and security industries in other developed economies; we are seeking to establish
ourselves as a credible operating partner for PPP projects.
KEY INITIATIVES
PAN‐INDIA FM MANDATES
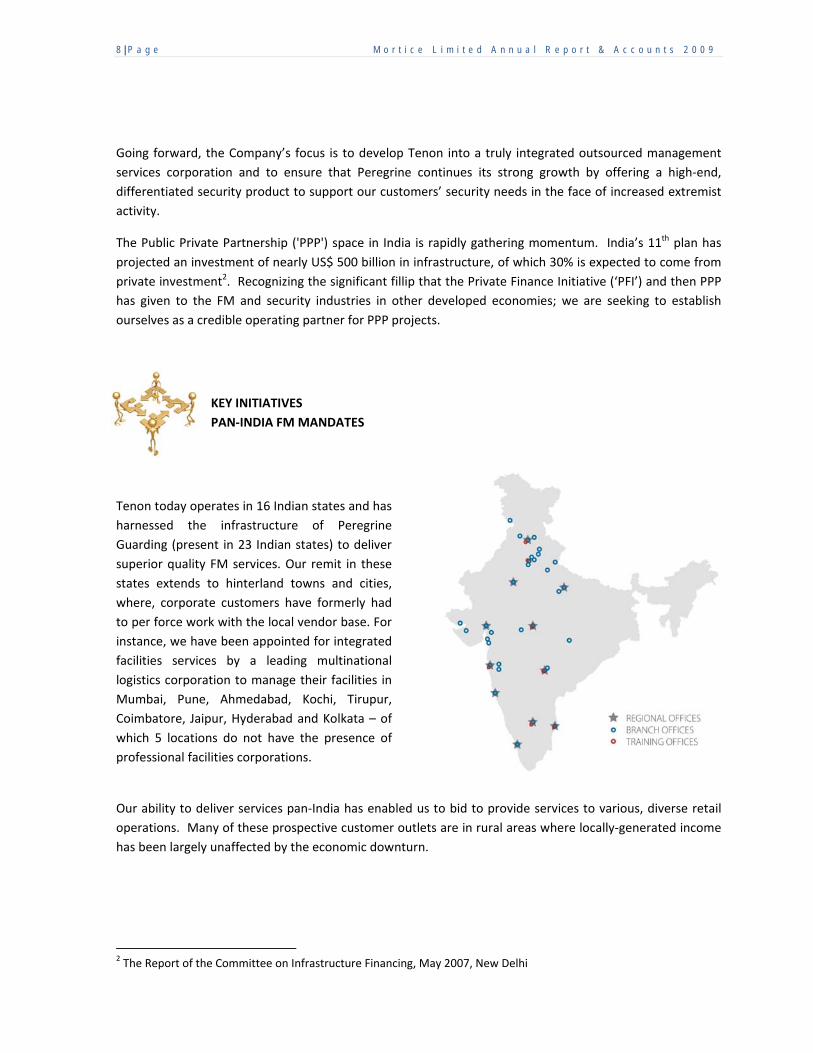
Tenon today operates in 16 Indian states and has
harnessed the infrastructure of Peregrine
Guarding (present in 23 Indian states) to deliver
superior quality FM services. Our remit in these
states extends to hinterland towns and cities,
where, corporate customers have formerly had
to per force work with the local vendor base. For
instance, we have been appointed for integrated
facilities services by a leading multinational
logistics corporation to manage their facilities in
Mumbai, Pune, Ahmedabad, Kochi, Tirupur,
Coimbatore, Jaipur, Hyderabad and Kolkata – of
which 5 locations do not have the presence of
professional facilities corporations.
Our ability to deliver services pan‐India has enabled us to bid to provide services to various, diverse retail
operations. Many of these prospective customer outlets are in rural areas where locally‐generated income
has been largely unaffected by the economic downturn.
2 The Report of the Committee on Infrastructure Financing, May 2007, New Delhi

9 | P a g e M o r t i c e L i m i t e d A n n u a l R e p o r t & A c c o u n t s 2 0 0 9
KEY INITIATIVE
NON‐TRADITIONAL SECTORS
Our innovative approach to FM services has resulted in our acceptance by corporations in sectors such as
education and logistics, which have traditionally ‘in‐sourced’ or ‘out‐tasked’ FM services. We have also
designed and implemented innovative programs for sectors such as retail inducing efficiency and
professionalism into the management of logistics, personnel and monitoring compliance. Peregrine has
significantly enhanced its presence in the sectors which have found our services to be of high value – these
sectors include IT/ITeS, Telecom, Financial Services, Manufacturing, Retail and similar sectors where
guarding acts as a key enabler of business safety, security and continuity.
KEY INITIATIVE
PEOPLE
We are a solely, facilities‐focused Company and can
therefore offer exciting career paths and
opportunities for employees to grow within the
facilities management industry. This helps us
attract top industry talent. Examples of our ability
to draw such talent are visible across our
organization including in our support services
where we have been able to recruit seasoned
practice experts for functions such as finance &
accounting, corporate strategy, technology and HR.
These key appointments have helped us to
strengthen our position in the facilities
management and security services market.
Figure 4: "We are a solely, facilities‐focused Company..."

10 | P a g e M o r t i c e L i m i t e d A n n u a l R e p o r t & A c c o u n t s 2 0 0 9
YEAR IN REVIEW
TENON ‐ EXPANDING OUR SERVICES
Vijayendra Babji – Group Chief Operating Officer
Integrated Facilities Management Services was launched as a
business line under the Tenon brand in January 2008 and
began contract operations in April 2008. The concept was to
introduce a superior service in the market – one that offered
global standards of service delivery in a locally relevant
manner. We have achieved this through our self‐
performance service delivery combined with the strength of
our senior management team.
Over the past year, we believe Tenon has exceeded its
objectives as we have established our pan‐India client base
winning many prestigious appointments with both
multinational and local corporations.
We have also developed customer‐specific, unique service delivery models in keeping with Tenon’s
strapline: “Services that Fit”
Figure 5: “Services That Fit” ‐ The advantages of Tenon's vertically integrated service delivery model

11 | P a g e M o r t i c e L i m i t e d A n n u a l R e p o r t & A c c o u n t s 2 0 0 9
At the end of the reporting period, Tenon was managing a customer portfolio of over 5 million square feet.
Since this portfolio has been built in 18 months from the commencement of FM operations the Directors
believe it is a notable achievement and that it has surpassed the speed of growth of all other competitors in
the FM market in India to date. Our customer base comprises leading corporations from sectors such as IT /
ITeS / BPO, logistics, financial services, manufacturing, education, residential, real estate developers and
telecommunications. Several of our appointments are for pan‐India portfolios. Based on the level of new
business enquiries and order book the Board remains optimistic about its continued growth over the next
year with along with the expectations of improved market conditions in India.
Having built our base and infrastructure for service delivery, and a reputation for very high standards of
service, Tenon today stands well‐poised to add significant value to all stakeholders – customers and
investors alike.
IFM ADVANTAGE SHOWCASE
TENET – TENON’S SERVICE DELIVERY TECHNOLOGY PLATFORM
Technology is an essential element of our
ability to enhance service delivery
standards. TeNet is Tenon’s technology
platform comprising proprietary, highly‐
specialised, service delivery applications.
This suite of applications resides on ‘single
client view’ client‐specific extranet sites.
Our standard service delivery suite includes
tools for: facilities management and budget
planning, planning and tracking preventive
maintenance schedules, helpdesk
management, transport routing and
monitoring, inventory management,
training, management reporting and asset
management.
We also develop customized tools to meet client and industry‐specific needs; an example is SLATE, our
Satellite Location Activity Tracker, which enables us to monitor and manage service delivery achievement
across geographically dispersed portfolios and provides our customers with transparency and control.
Figure 6: TeNet ‐ Tenon's ‘single client view’ Technology Platform

12 | P a g e M o r t i c e L i m i t e d A n n u a l R e p o r t & A c c o u n t s 2 0 0 9
TOTAL PRODUCTIVE MAINTENANCE
Tenon has adopted an industry‐leading
engineering practice called Total Productive
Maintenance ('TPM'). Originally a concept
employed in manufacturing, TPM
significantly enhances the quality of on‐
ground engineering service delivery through
a maintenance philosophy that logically
incorporates a combination of preventive,
predictive, and corrective maintenance
practices into a single, comprehensive
program. We are able to enhance the
effectiveness of TPM as a result of our
model of self performance, giving us the
control to train, develop and nurture
technical talent with a clear career path for
employees.
COMMUNICATIONS
Tenon today employs over 20,300 people across the sub‐
continent. The majority of these employees are located at
customer premises. Our ability to keep them informed
about the Company’s developments is essential. Where
our employees have access to e‐mail we send regular
updates on business related subjects and activities;
however, not all of our employees have access to
technology. With this in mind, this year also saw the
launch of “tenoCity”, our internal newsletter. This
magazine is also sent to customers to keep them in touch
with how we are developing our services to enhance our
support to them.
A well‐defined programme of senior management visits
also ensures that our site employees have the opportunity
to meet with senior representatives of the business on a
regular basis.
Figure 7: Total Productive Maintenance. Tenon's Technical
Advisory Group management inspecting our technician's
work at a customer site
Figure 8: tenoCity ‐ Tenon's internal
communication to employees and customers

13 | P a g e M o r t i c e L i m i t e d A n n u a l R e p o r t & A c c o u n t s 2 0 0 9
PEREGRINE – EXPANDING OUR MARKETS
Rakesh Choudhary – Chief Operating Officer
Peregrine Guarding has been amongst the leaders in the field of
professional guarding services since we first established our
services in India in 1995. Today, Peregrine continues to be the
mainstay of the Group.
This year we have reinforced our position as one of the leading
security and guarding organizations in India and we have
continued to build our reputation as a committed and expert
services partner.
During the year, the heightened extremist activity in India and
many other countries has caused our customers to focus on how
they can enhance their security service within the cost
constraints of an economic downturn.
Despite this challenging backdrop, Peregrine has managed to grow its revenue by marginally over 40%
during the reporting period. Peregrine’s differentiators; a robust national service delivery platform, quality
of manpower, training regime and innovative solutions, are all cited as contributors towards our continued
success. In addition to enhancing its position in traditional market sectors such as financial services, IT /
ITeS, corporate offices and manufacturing, we also continued to strengthen our position in emerging
sectors including retail and telecommunications.
The business continues to focus on training
to respond to the changing needs of the
current security environment in India and
has recently opened a Training Institute to
provide a wide range of training courses to
help to develop the specialist skills that our
employees require and enhance their career
prospects. We have also continued to
attract top industry talent. Many of our
senior management today come from elite
backgrounds in the services industry and the
greater proportion of them having qualified
in business management from leading
business schools.
Figure 9: Training for Front of House Security Staff

14 | P a g e M o r t i c e L i m i t e d A n n u a l R e p o r t & A c c o u n t s 2 0 0 9
SECURITY ADVANTAGE SHOWCASE
NATIONAL CUSTOMER RESPONSE CENTRE
Peregrine has established an initiative
unique to the security industry to
enhance its ability to collect direct
customer feedback which enhances
our responsiveness to customer
requests; and act as a strong
mechanism for quality and continuous
improvement initiatives. Our National
Customer Response Centre is a central
call centre manned by expert
customer response professionals who
have implemented a proven helpdesk
workflow methodology to log
requests, assign responsibilities and
track them to closure.
NEWS ALERTS
A service initiated by Peregrine in the previous year which has
earned significant popularity with customers is our news alerts
service. Twice a day at minimum, and immediately in the
event of a major development, our customers are sent alerts
on developments which have the potential to impact their
security situation. These alerts are sent through multiple
media such as SMS and emails; and are designed to help
customers stay in touch with latest developments and plan
mitigation programs proactively.
Figure 10: "Our National Customer Response Centre is a central
call centre manned by expert customer response professionals."
Figure 11: Peregrine's "Breaking News" and
"Headlines" Services help customers stay in
touch with latest security‐related
developments

15 | P a g e M o r t i c e L i m i t e d A n n u a l R e p o r t & A c c o u n t s 2 0 0 9
RESEARCH SERVICE
During the year, we have also launched a research
service, published under the heading
“SecurCounsel”. These have included facts, advice
and guidance on counter‐terrorist measures and,
more recently facts and precautions in the face of
the H1N1 “swine flu” threat.
SCOPE OF SERVICE
Over the past year, we have recruited several new
senior managers to strengthen our service
delivery capability. We have also introduced
enhanced customer and business‐focused
management process and quality techniques.
Today, whatever our customers’
safety and security requirement,
Peregrine has a suite of services to
meet their needs. From a range
from standard services such as static
and mobile guarding to specialist
services such as event security,
executive protection, emergency
response planning, canine squads
and background investigations, we
are able to tailor our solutions to
meet our customer’s unique
requirements
Figure 13: Peregrine – Tailored solutions to meet customers’ needs
Figure 12: 'SecurCounsel ' ‐ Peregrine's research provides advice to customers on topical subjects

16 | P a g e M o r t i c e L i m i t e d A n n u a l R e p o r t & A c c o u n t s 2 0 0 9
TENON PROJECT SERVICES – EXPANDING OUR PRODUCTS
Hemant Verma – Head Tenon Project Services
The physical security systems market in India is expected to
grow to at least $1.3 B by 2011, growing at a Compound
Annual Growth Rate (‘CAGR’) of 30% against an average 10%
growth rate in developed markets. IT/ITES companies, who
spend 30% on their security budgets, are currently the
biggest spenders on the installation of security devices,
followed by commercial institutions at 20% and the
hospitality industry at 15%. Retail and aviation sectors are
also expected to continue to be major contributors to
growth. PPP projects, such as airports and metro railways
are also expected to contribute to the growth of this
market3.
Against this backdrop, we have continued to develop Tenon
Project Services, our projects business line for the
installation and integration of security and safety systems.
Tenon Project Services offers consulting, design engineering, procurement, implementation and
maintenance services for a diverse range of the latest, state of the art safety and security systems including:
Intelligent and addressable fire detection and alarm
systems
Biometric/smart card/proximity technology based
access control systems
Analogue and IP technology based CCTV Systems
Analogue and digital technology based public address
and sound reinforcement systems
Water and gas based fire‐fighting systems
Equipment and building Integration systems.
3 Bostonanalytics report on Indian Security Systems Market dated December 2008.

17 | P a g e M o r t i c e L i m i t e d A n n u a l R e p o r t & A c c o u n t s 2 0 0 9
During this financial year, Tenon Project Services,
a divison of Tenon has enhanced its customer
base by approximately 20%. Tenon Project
Services has also significantly increased its service
and product offering and implemented several
initiatives including the introduction of product‐
specific experts to help customers to assess their
needs and guide them by designing and
implementing customized and value added
solutions.
We are focused on continuously upgrading our
services by keeping abreast of the latest
technological advancements in the field of safety
and security equipments. Our team members’
skills are also regularly updated through internal
training sessions, on the job training modules,
and sessions and seminars conducted by our
strategic partners.
We have created strategic alliances with some of the
World’s most respected, established top of the line
equipment brands. Our key strategic partners include
Honeywell, Bosch, Rafiki, Pelco, Computar, Auric, HID,
Bioscript, Apollo, Kirloskar and Ingersoll Rand amongst
others.
The Directors believe that Tenon Project Services will become a significant contributor to the overall
revenues of the Group over the next two to three years.
Figure 14: Intelligent and addressable fire detection
and alarm systems
Figure 16: Home automation systems

18 | P a g e M o r t i c e L i m i t e d A n n u a l R e p o r t & A c c o u n t s 2 0 0 9
Financial Review S. Krishnaswamy – Chief Financial Officer
The financial year 2008‐20094 was both a successful
and challenging period for the team. Mortice
engaged in various transactions during the year as a
part of it expansion plans, the most significant of
which was listing the Company on the Alternate
Investment Market of the London Stock Exchange.
We also significantly expanded both our customer
base and our geographic spread in India.
Significant investment has been made in the
development of our FM business and the Group
supporting management structure. This investment
is reflected in our results but, we are highly
confident, will yield significant returns over the
coming years.
Income statement
The Group revenue grew by 15.3 % Y‐O‐Y on an annualized basis after adjusting for extraordinary income in
the last year. The increase in both revenue and costs are due to an increase in the level of operations over
those in 2008.
Abridged Group consolidated Income statement for the year ended (in US$ M)
31 March 2009 31 March 2008 **
Revenue 23.46 4.04Cost of Sales -19.18 -2.71Operating expenses -6.95 -0.73EBITDA -2.67 0.60Depreciation & Finance costs -0.57 -0.08Profit/ (loss) before tax -3.24 0.52Tax 0.31 0.11Profit/ (loss) after tax -2.93 0.63Loss per share basic & diluted -0.06 0.07
** two months results.
4 Financial Year: 1 April 2008 to 31 March 2009.

19 | P a g e M o r t i c e L i m i t e d A n n u a l R e p o r t & A c c o u n t s 2 0 0 9
The Group reported a US$ 2.9 m loss for the year. This included loss from certain non–recurring expenses
including IPO listing expenses of US$ 1.43 m and the loss incurred through closing down the general
contracting business little over US$ 0.1 m. The remaining loss was incurred through the investment in the
set‐up of the FM business, the establishment of the Group management structure, pre‐acquisition activity
and write offs/provisioning from the existing guarding business. It is important to note that for comparative
purposes the functional currency (Indian rupee) depreciation against the United States dollars also
contributes to about 12.5 % deflation in the reported results. Basic earnings per share reported a negative
US$ 0.06 per share, attributable to the loss for the year.
Balance sheet (in US$ M)
Abridged consolidated balance sheet position
Group Company
2009 2008 2009 2008
Tangible Assets 0.68 0.61 - -Interest in Subsidiaries - - 6.85 0.39Other non-current assets 0.82 0.62 - -Current assets 9.57 4.93 1.30 0.56Total assets 11.07 6.16 8.15 0.95Current liabilities 4.53 4.71 0.39 0.57Non-current liabilities 0.35 0.43 - -Net assets 6.19 1.02 7.76 0.38
The Group balance sheet strengthened with the infusion of fresh shareholder’s funds of US$ 9.15 m.
Correspondingly, the net assets of the Group increased to US$ 6.19 m (31 Mar 2008: US$ 1.02 m). Long
term borrowings and lease obligations were reduced and stood at US$ 0.23 m (31 Mar 2008: US$ 0.34 m).
The current assets ratio improved to 2.11 (31 Mar 2008: 1.05) showing marked improvement in the
performance in the management of this area. The ratio of net assets to total assets improved (31 Mar
2008: 0.17) to 0.56 in 2009. Reduction in Tangible assets is represented partly by realization of security
deposits and partly by movement into current assets as per required disclosures. Other non‐current assets
represent a deferred tax asset created in anticipation of the growth prospects of the business over the
coming years for adjustment against future Tenon business profits.

20 | P a g e M o r t i c e L i m i t e d A n n u a l R e p o r t & A c c o u n t s 2 0 0 9
Equity
During the year, Mortice issued 7,700,000 ordinary shares to the public through IPO as a part of its initial
fund raising (Note 18 to the consolidated financial statements). The Company raised US$ 9.15 m, net of
issue costs. Total equity attributable to equity shareholders of the Company was US$ 7.77m (31 Mar 2008:
US$ 0.38 m).
Cash Flow (in US$ M)
Abridged Group cash flow (in US$ M) for the year ended
31 March 2009 31 March 2008
Net cash absorbed by operating activities
-5.47 -0.23Net cash (absorbed by)/generated from investing activities -0.34 0.06Net cash generated from financing activities 8.65 0.37Net increase in cash and cash equivalents 2.83 0.20Cash and cash equivalents at beginning of year 0.19 -Unrealised exchange differences -1.00 -0.01Cash and cash equivalents at end of year 2.01 0.19
Cash generation during the year has been negative as a result of the significant investments in setting up
the FM business with the deficit being made up from the freshly raised equity funds. Net cash absorbed by
operating activities (before taxation and interest) was –US$ 4.46 m (2008‐09: ‐US$ 0.17 m). During the year,
working capital utilized increased by US$ 1.9 m largely attributable to organic growth and the impact of the
recession year on speed of collections. Long term borrowings paid off amounted to US$ 0.19 m.
Post balance sheet events
The details of the Group’s material post balance sheet events are provided in note 36 to the consolidated
financial statements. The Group’s operating subsidiary Tenon acquired a 100% equity interest in Rotopower
Projects on 30 June 2009 for a cash consideration of INR 100 million (US$ 1.9m). As a direct result of this
transaction, the Group’s interest in the FM business has substantially increased and indirectly the Group’s
market presence has also increased in the FM segment.
Comparatives
The financial statements presented here for the year ended 31 March 2009 and 31 March 2008 are not
comparable as 2008‐09 represents 12 months of full operation and 2007‐08 covers the financial period of 9
January 2008 to 31 March 2008. The figures have been reclassified where necessary to be compatible with
current year’s financial statements.

21 | P a g e M o r t i c e L i m i t e d A n n u a l R e p o r t & A c c o u n t s 2 0 0 9
General Information
Directors
Manjit Rajain – Executive Chairman
Andrew Michael Barker – Chief Executive Officer
Dr. Keith Hellawell QPM – Non‐executive Director
Arun Duggal – Non‐executive Director
Company Secretaries
Chia Luang Chew Hazel
Lim Keng San Shirley
KCS Corporate Services Pte Ltd
36 Robinson Road, #17‐01 City House
Singapore 068877
Registered Office
36 Robinson Road,
#17‐01 City House
Singapore 068877
Independent Auditors
Shanker Iyer & Co.
3 Phillip Street
#18‐00 Commerce Point
Singapore 048693
Nominated Adviser
Grant Thornton Corporate Finance
30 Finsbury Square
London EC2P 2YU
United Kingdom

22 | P a g e M o r t i c e L i m i t e d A n n u a l R e p o r t & A c c o u n t s 2 0 0 9
AIM Broker
Jermyn Capital Partners Plc
Redwolf House, Ground Floor
5‐10 Bolton Street, Mayfair
London W1J 8BA
United Kingdom
Registrar
Computershare Investor Services (Channel Islands) Ltd
PO Box 83, Ordnance House
31 Pier Road, St. Helier
Jersey JE4 8PW
Channel Islands
Depositary
Computershare Investor Services PLC
PO Box 82, The Pavilions
Bridgwater Road, Bristol BS13 8AE
United Kingdom
ISIN Number : SG9999005326
SEDOL Number : B2NHWN8
AIM Symbol : MORT
Website : www.morticeGroup.com
Principal Banker
Standard Chartered Bank PLC
Jeewan Deep Building
10 Sansad Marg
New Delhi 110001
India

23 | P a g e M o r t i c e L i m i t e d A n n u a l R e p o r t & A c c o u n t s 2 0 0 9
Board of Directors
Executive Directors
Manjit Rajain, aged 46, Executive Chairman
Major Manjit Rajain founded the Peregrine Group and through Mancom is the major shareholder of Mortice.
Major Rajain was commissioned in the Indian Army’s 11th Armoured Regiment in 1984. During his 7 years of
service, Major Rajain saw active service in Rajasthan and Jammu & Kashmir. Following his release from the
army, Major Rajain served in the police force where he attained the position of assistant commissioner stationed
in Jammu and Kashmir Using the security experience gained from his career in the military and the police force,
Major Rajain demonstrated his entrepreneurial capability to establish Peregrine which he has developed over the
last 13 years to become one of the top 4 security service providers across the sub continent of India. Following
the successful establishment of a transport management business to support the fast developing IT/ITeS sector,
Major Rajain seeded further facilities related companies to provide the foundation for Mortice with the vision of
creating the platform for Mortice.
On 14 October 2008, Major Rajain was recognized as ‘Entrepreneur of the Year’ at an awards function as part of
CAPSI’s 3rd National Conference, held in Bangalore in recognition of his proven skills as a business leader and
as a committed member of the security industry. Major Rajain is also an active member of Rotary
International.
Andrew Barker, aged 54, Executive Director
Mr. Barker has experience of delivering property and facilities management services across 27 countries whilst
working for and establishing many of the industry’s FM arms around the world. He has spent the last twelve
years working in Asia, six of which have been in India, during which time he has established three successful
property and facilities management companies. He was instrumental in developing MacLellan, the first FM
Company in India in 1998. Working in partnership with Ford India he led the MacLellan India team to win the UK
Premises and Facilities Management Partnership Award in 1999. He has been referred to within the FM industry
as ‘The Father of FM in India’ Mr. Barker was a founder member of the industry in the UK, where he worked
with Johnson Controls and MacLellan International. He is a Fellow of the British Institute of Facilities
Management and is an active Member of CoreNet Global as Vice Chair Learning on the Asia Regional Council. He
was formerly a member of the UK Competing for Quality and PFI Advisory Committees. He has a MSc in
facilities management and an MBA from Cranfield University. He has held board positions as sales & marketing
Director for MacLellan International in the UK and as operations Director for Serco Middle East in Dubai. He has
also held responsibility as vice president operations and general manager for MacLellan India and general
manager for Serco Gulf a joint venture with Dubai World’s Istithmar in Dubai. His other appointments have
included regional Director for asset services for Cushman & Wakefield Asia Pacific, national Director for
corporate property services for Jones Lang LaSalle for regional accounts in Asia Pacific and regional head of
property and facilities management services for ABN AMRO in Asia Pacific and the Middle East.

24 | P a g e M o r t i c e L i m i t e d A n n u a l R e p o r t & A c c o u n t s 2 0 0 9
Non‐Executive Directors Arun Duggal, aged 63, Non-executive Director
Mr. Arun Duggal is a Senior Advisor to TPG Capital, a major Private Equity firm headquartered in San Francisco.
He is an experienced international Banker and has advised companies and financial institutions on Financial
Strategy, M&A and Capital Raising. He is Chairman of Board of Directors of Shriram Transport Finance
Company, Shriram Properties Pvt. Ltd, Shriram City Union Finance Ltd., and Shriram EPC Limited. He is the Vice
Chairman of International Asset Reconstruction Company.
He is on the Board of Directors of Jubilant Energy Ltd., Patni Computers (Chairman, Audit Committee), Fidelity
Fund Management, Manipal Acunova Limited, Zuari Industries, Info Edge (India), Dish TV India Ltd., Mundra
Port & SEZ Ltd., and IMA (formerly Economist Intelligence Unit, India), Hertz (India) and Mortice Limited
(Singapore). He is a member of the Investment Committee of Axis Private Equity.
He is Vice Chairman of Indian Venture Capital Association. He is a Board Member and erstwhile Chairman of the
American Chamber of Commerce, India He was on the Board of Governors of the National Institute of Bank
Management. Mr. Duggal is involved in several initiatives in social sector.
He is a founder Director of Bellwether Microfinance Fund which provides equity capital to promising Micro
Finance organizations and helps them in capacity building. He is a Trustee of Centre for Civil Society, New Delhi,
which focuses on improving the quality and access of education to students especially for the poor. He is Senior
Advisor (Asia Pacific) to Transparency International Berlin. Mr. Duggal had a 26 years career with Bank of
America, mostly in the U.S., Hong Kong and Japan. His last assignment was as Chief Executive of Bank of
America in India from 1998 to 2001.
He spent ten years (1981-1990) with the New York Corporate Office of Bank of America handling multinational
relationships. From 1991-’94 as Chief Executive of BA Asia Limited, Hong Kong he looked after Investment
Banking activities for the Bank in Asia. In 1995, he moved to Tokyo as the Regional Executive, managing Bank
of America’s business in Japan, Australia and Korea. From 2001 to 2003 he was Chief Financial Officer of HCL
Technologies, India.
A Mechanical Engineer from the prestigious Indian Institute of Technology, Delhi, Mr. Duggal holds an MBA from
the Indian Institute of Management, Ahmedabad. He teaches a course on Venture Capital & Private Equity at
the Indian Institute of Management, Ahmedabad as a visiting Professor.

25 | P a g e M o r t i c e L i m i t e d A n n u a l R e p o r t & A c c o u n t s 2 0 0 9
Dr. Keith Hellawell QPM, aged 65, Non-executive Director
Dr. Keith Hellawell QPM is a highly renowned expert in the fields of security and facilities management and
brings significant professional experience and academic credentials with him. As a highly decorated police
officer, Dr. Hellawell has served as Chief Constable for the West Yorkshire Police and Cleveland Police; and has
advised senior government bodies and officials, including the Home Secretary and Prime Minister of the UK, the
European Union, former Soviet Bloc countries, Los Angeles Police Department, Government of Cyprus and the
FBI on diverse issues relating to combating crime.
In his professional capacity, Dr. Hellawell has served as a Director of Homework, a UK-based corporation
involved in manufacturing and installing security alarms. He has, and continues, to lend his professional advice
to several leading corporations as a Non-Executive Director – significantly, in the context of Mortice plc, to
Dalkia plc, a leading Facilities Management services provider.
Dr. Hellawell holds an LLB from London University and gained his MSc from Cranfield University. He has also
been awarded Honorary Doctorates from the Leeds/Bradford and Huddersfield Universities.
He has won several professional awards including “Communicator of the Year” (voted by PR industry), Top 50
most powerful men in Britain in a national newspaper survey and “Businessman of the Year” for the Yorkshire
and Humber Region.
Figure 17: Members of the Board of Mortice on the occasion of listing the Company on AIM – 15 May 2008
From the left: Dr. Keith Hellawell, Non‐Executive Director; Major Manjit Rajain, Chairman; Mr. Andrew Barker, CEO

26 | P a g e M o r t i c e L i m i t e d A n n u a l R e p o r t & A c c o u n t s 2 0 0 9
Financial Contents
27 Directors’ report
32 Corporate governance report
35 Statement by Directors
36 Independent auditors’ report
38 Balance Sheets
39 Income Statement
40 Changes in Equity
42 Consolidated Cash Flow
45 Notes to the Financial Statements

27 | P a g e M o r t i c e L i m i t e d A n n u a l R e p o r t & A c c o u n t s 2 0 0 9
Directors’ Report
For the year ended 31 March 2009
The Directors present their report to the members together with the audited financial statements of the Company and of the Group for the financial year ended 31 March 2009.
Principal activities of the business
Mortice is a diversified services Group that through its subsidiaries provides and delivers managed services
relating to guarding, facilities and property management and the execution of safety and security systems
project works.
A more detailed overview of the Group’s business during the year and indication of further development
may be found in the Chairman’s statement and CEO’s statement.
Going Concern
The Directors are confident that sufficient funding and adequate resources are available to enable the
Group to continue to meet its present obligations as they fall due for at least the next twelve months.
Accordingly, the Directors continue to adopt the going concern basis in preparing the financial statements.
Result and Dividend
The summary of results of the Group for the year ended 31 March 2009 are set out on pages 18 to 20 and
further details are presented in the appended financial statements. The Directors do not recommend
payment of a dividend for the year.
Directors
The names of individuals who served as Directors of the Company from the beginning of the year are as
follows:
Manjit Rajain Andrew Michael Barker Dr. Keith Hellawell QPM Arun Duggal
Brief biographies of each of the Directors are set out on pages 23 to 25.
Arrangements to enable Directors to acquire shares and debentures
Neither at the end of nor at any time during the financial year was the Company a party to any arrangement whose object is to enable the Directors of the Company to acquire benefits by means of the acquisition of shares in, or debentures of, the Company or any other body corporate. Directors’ contractual benefits

28 | P a g e M o r t i c e L i m i t e d A n n u a l R e p o r t & A c c o u n t s 2 0 0 9
Since the end of the previous financial period, no Director has received or become entitled to receive a benefit by reason of a contract made by the Company or a related corporation with the Director or with a firm of which the Director is a member, or with a Company in which the Director has a substantial financial interest, except as disclosed in the financial statements.
Directors’ interests in shares and debentures
According to the register of Directors’ shareholdings kept by the Company for the purpose of Section 164 of
the Singapore Companies Act, Cap 50, none of the Directors holding office at the end of the financial period
had interest in shares of the Company and its related corporation except as follows:
Holdings registered in the
name of Director
Holdings in which a Director is deemed to have an interest
As at
1.4.2008
As at
31.3.2009
As at
1.4.2008
As at
31.3.2009
Mortice Limited
Ordinary shares
Manjit Rajain 1 1
‐ ‐
Mancom Holdings
Limited
Ordinary shares
Manjit Rajain
‐
‐
40,000,000
40,000,000
Tenon Property
Services Private Limited
Ordinary shares
Manjit Rajain
5,000
5,000
‐
‐
Directors’ remuneration
For the year ended 31 March 2009, the annual salary of each of the Directors was as follows: Director Annual salaries Manjit Rajain US$ 386,912 Andrew Barker US$ 305,718 Dr. Keith Hellawell QPM US$ 22,341 Arun Duggal US$ 22,363
29 | P a g e M o r t i c e L i m i t e d A n n u a l R e p o r t & A c c o u n t s 2 0 0 9
Directors' Indemnities
The Company maintains Directors' and officers' liability insurance which gives adequate cover for legal
action brought against its Directors.
Related Party transactions
Details of related party transactions are contained in note 31 to the consolidated financial statements.
Credit payment policy
The Company has no formal code or standard which deals specifically with the payment of suppliers. It is
the Company's policy to settle the terms of payment with suppliers when agreeing the terms of the
transaction so as to ensure that suppliers and the Company are aware of those terms and abide by them;
however, the Company’s policy on the payment of all creditors is to ensure that the terms of payment, as
specified and agreed with the supplier, are not exceeded unreasonably. Our standard term of credit for
trade purchases is 30 days.
Principal risks and uncertainties
The activities of the Group are subject to a number of risks. If any of these risks were to materialise the
Group’s business, financial condition and results of future operations could be materially adversely affected
by, among other things, delays, increased costs and/or reduced revenues. The principal risks are detailed in
the Group’s admission document of 15 May 2008 and include risks relating to the proposed business model,
competitive risk, funding risk, dependence on key executives, political, regulatory and economic
uncertainty, and general risks such as general economic conditions.
Share Capital
On 15 May 2008, Mortice announced the successful placing of 7.7 million ordinary shares with institutional
investors, raising US$ 9.73 m before fees and expenses. Additional detail is provided in note 18 to the
consolidated financial statements.
Share Options There were no share options granted during the financial year to subscribe for unissued shares of the Company or its subsidiary companies. No shares have been issued during the financial year by virtue of the exercise of options to take up unissued shares of the Company or its subsidiary companies. There were no unissued shares of the Company or its subsidiary companies under option at the end of the financial year. The Board of Directors of the Company resolved on 14 July 2009 to cancel the share options scheme with retrospective effect.

30 | P a g e M o r t i c e L i m i t e d A n n u a l R e p o r t & A c c o u n t s 2 0 0 9
Corporate Governance
A report on Corporate Governance is set out on pages 32 to 34.
Environmental Responsibility
The Company recognises that the nature of the Group's service delivery activities require it to have regard
to the potential impact that it and its subsidiary companies may have on the environment. The Company
has adopted an Environmental Policy for the Group and, wherever possible, the Company ensures that all
related companies are encouraged to comply with the local regulatory requirements with regard to the
environment.
Charitable and political donations
No charitable or political donations were made during the year.
Post balance sheet events
On 22 June 2009, Mortice announced the acquisition of Rotopower further details of which are set out in
note 36 to the consolidated financial statements.
Annual General Meeting
The Company will distribute a notice of Annual General Meeting to be held on 11 September 2009 to lay the
annual accounts before the shareholders and to deal with any other business for the consideration of the
shareholders. The notice of Annual General Meeting will be distributed with this Annual Report.
Disclosure of information to auditors
So far as each Director at the date of approval of this report is aware, there is no relevant audit information
of which the Company’s auditors are unaware and each Director has taken all steps that he ought to have
taken to make himself aware of any relevant audit information and to establish that the auditors are aware
of that information.
Independent auditors
The independent auditors, Messrs Shanker Iyer & Co., Certified Public Accountants, Singapore, have
expressed their willingness to accept re‐appointment and a resolution to re‐appoint them will be proposed
at the forthcoming Annual General Meeting.
31 | P a g e M o r t i c e L i m i t e d A n n u a l R e p o r t & A c c o u n t s 2 0 0 9
Recommendation
The Board considers that the resolutions to be proposed at the Annual General Meeting are in the best
interests of the Company and it is their unanimous recommendation that shareholders support them.
On behalf of the Board Manjit Rajain Director Arun Duggal Director 25 August 2009

32 | P a g e M o r t i c e L i m i t e d A n n u a l R e p o r t & A c c o u n t s 2 0 0 9
Corporate Governance Report
INTRODUCTION
The Board of Mortice Limited is committed to and is responsible for achieving high standards of corporate
governance, integrity and business ethics for all of its activities. Whilst the Group is not required under the
AIM Rules for Companies to comply with the Combined Code on Corporate Governance 2006 (the
Combined Code), the Board recognises the value of the Combined Code and has chosen to provide selected
disclosures which it believes are necessary or valuable to readers.
DIRECTORS
The Group Board has committed to meet not less than six times throughout the year and consists of an
Executive Chairman, one Executive Director and two Non‐Executive Directors. Details of the Board are set
out on pages 23‐25. The Board considers that both our Non‐Executive Directors are independent of the
Executive Directors and are free from any business or other relationships that might materially interfere
with their exercise of independent judgment. The Chairman and Directors bring experience at a senior level
of business operations and strategy and an expanse of knowledge and expertise gained from other areas of
business and public life. The Board has a schedule of matters reserved for its approval which includes Group
strategy, acquisitions and disposals of any subsidiary undertaking, review of any significant risks facing the
Group, appointment of key advisers, the consideration of major capital projects and significant financing
matters. The Board also reviews the strategic direction of each of the Group’s subsidiary operating divisions,
their annual budgets and progress towards the achievement of those budgets.
The Board has delegated authority to Audit and Remuneration Committees whose duties are summarised
below. Each Committee is chaired by one of our Non‐Executive Directors.
AUDIT COMMITTEE
The Audit Committee is chaired by Mr. Arun Duggal and its other member is our other Non‐Executive
Director, Dr. Keith Hellawell QMP.
The Committee met twice during the past financial year on 23 September 2008 and 23 December 2008. The
Committee operates within agreed terms of reference which include reviewing the effectiveness of financial
reporting and internal control procedures, monitoring the integrity of the financial statements of the Group
and any significant financial reporting judgments contained therein and reviewing the fees, independence
and objectivity of the external auditors.

33 | P a g e M o r t i c e L i m i t e d A n n u a l R e p o r t & A c c o u n t s 2 0 0 9
The Group’s external auditors have unrestricted access to the Audit Committee and attended all Audit
Committee meetings held during the year. The Audit Committee has discussed matters with the external
auditors outside those meetings. The Executive Directors attend Audit Committee meetings through
invitation.
REMUNERATION COMMITTEE
The Remuneration Committee is chaired by Dr. Keith Hellawell QMP and its other member is our other Non‐
Executive Director, Mr. Arun Duggal. The Directors’ Remuneration is set out in the Directors’ Report at page
28.
MAIN BOARD MEETINGS AND ATTENDANCE
Directors are encouraged to attend all Board meetings and meetings of Committees of which they are
members. The Chairman and the CFO plan the programme for the meetings including attendance by senior
executives from within the Group. Detailed Board packs including financial results, operational issues and
notes on other matters reserved for the Board. The Company continues to maintain Directors’ and Officers’
liability insurance.
INTERNAL CONTROL
The Board has overall responsibility for the Group’s system of internal financial and operational controls
and the ongoing review of their effectiveness. These controls are design to safeguard the Group’s assets
and the investment of shareholders; however, any system of internal control can only manage rather than
eliminate risks and consequently such controls do not provide absolute assurance against misstatement or
loss. The main features of the Group’s internal systems include:
Allocation of responsibilities
The Board has considered and set terms of reference for its Chief Executive which includes the day
to day responsibility for the management and operations of the business. In addition, the Group has
clearly defined delegation of authority and authorization limits to Executive management. This is
clearly communicated to the employees of the business by the Executive Directors.

34 | P a g e M o r t i c e L i m i t e d A n n u a l R e p o r t & A c c o u n t s 2 0 0 9
Risk identification
The Board is responsible for identifying the main business risks faced by the Group and for
determining the appropriate actions necessary to manage those risks.
Financial reporting and control
The Group has a comprehensive system for reporting financial results to the Board. Each subsidiary
prepares monthly management information which includes comparison against budget, forecast
and prior year. These results are considered by the management teams of each operating division.
Both operating and financial reports are prepared for the Group Board and actions arising from the
review of these reports are attributed as appropriate.
Investment appraisal
Capital expenditure is regulated by authorization limits. The acquisition of any business is subject to
appropriate due diligence being undertaken and conditional upon receiving Board approval.
Disaster recovery
The Group has established procedures over the security of data held on IT systems and has put in
place disaster recovery arrangements.
Internal audit
The Group does not currently have an internal audit function. However, the Board, and in particular
the Audit Committee, will continue to review the need to put in place and internal audit function
taking into account the size and nature of the Group.
INVESTOR RELATIONS
The Board places significant importance on maintaining good communication with shareholders. The
Chairman and Chief Executive Officer are available to meet with institutional shareholders and analysts
after the announcement of both the interim and final results and will undertake such meetings, whenever
reasonably requested by shareholders and analysts at other points during the course of the year. The
Annual Report is sent to all shareholders and all shareholders are invited to attend the Company’s Annual
General Meeting. The Group’s investor relations section on the corporate website contains information on
current activities (www.morticegroup.com).

35 | P a g e M o r t i c e L i m i t e d A n n u a l R e p o r t & A c c o u n t s 2 0 0 9
STATEMENT BY DIRECTORS
In the opinion of the directors of MORTICE LIMITED,
(a) the accompanying balance sheets, income statements, statements of changes in equity and consolidated cash flow statement together with the notes thereto are drawn up so as to give a true and fair view of the state of affairs of the Company and of the Group as at 31 March 2009 and of the results, changes in equity of the Company and of the Group and cash flows of the Group for the financial year ended on that date; and
(b) at the date of this statement there are reasonable grounds to believe that the Company will be able to pay its debts as and when they fall due.
The board of directors authorised these financial statements for issue on 25 August 2009.
On behalf of the Board
Manjit Rajain
Director
Arun Duggal
Director
25 August 2009
36 | P a g e M o r t i c e L i m i t e d A n n u a l R e p o r t & A c c o u n t s 2 0 0 9
INDEPENDENT AUDITORS’ REPORT TO THE MEMBERS OF
MORTICE LIMITED
(Incorporated in Singapore)
We have audited the accompanying financial statements of MORTICE LIMITED (the company) and its
subsidiaries (the group) as set out on pages 38 to 82, which comprise the balance sheets of the group and of
the company as at 31 March 2009, the income statements, statements of changes in equity of the group and
of the company and cash flow statement of the group for the year then ended, and a summary of significant
accounting policies and other explanatory notes.
Management’s Responsibility for the Financial Statements
Management is responsible for the preparation and fair presentation of these financial statements in
accordance with the provisions of the Singapore Companies Act, Cap. 50 (the “Act”) and International
Financial Reporting Standards. This responsibility includes:
(a) devising and maintaining a system of internal accounting controls sufficient to provide a reasonable assurance that assets are safeguarded against loss from unauthorised use or disposition; and transactions are properly authorised and that they are recorded as necessary to permit the preparation of true and fair income statements and balance sheets and to maintain accountability of assets; (b) selecting and applying appropriate accounting policies; and (c) making accounting estimates that are reasonable in the circumstances. Auditors’ Responsibility
Our responsibility is to express an opinion on these financial statements based on our audit.
We conducted our audit in accordance with International Standards on Auditing. Those standards require
that we comply with ethical requirements and plan and perform the audit to obtain reasonable assurance
whether the financial statements are free from material misstatement.
An audit involves performing procedures to obtain evidence about the amounts and disclosures in the
financial statements. The procedures selected depend on the auditors’ judgement, including the
assessment of the risks of material misstatement of the financial statements, whether due to fraud or error.
In making those risk assessments, the auditor considers internal control relevant to the entity’s preparation
and fair presentation of the financial statements in order to design audit procedures that are appropriate in
the circumstances, but not for the purpose of expressing an opinion on the effectiveness of the entity’s
internal control. An audit also includes evaluating the appropriateness of accounting policies used and the
reasonableness of accounting estimates made by management, as well as evaluating the overall
presentation of the financial statements.
We believe that the audit evidence we have obtained is sufficient and appropriate to provide a basis for our
audit opinion.

37 | P a g e M o r t i c e L i m i t e d A n n u a l R e p o r t & A c c o u n t s 2 0 0 9
INDEPENDENT AUDITORS’ REPORT TO THE MEMBERS OF
MORTICE LIMITED (…CONT’D)
(Incorporated in Singapore)
Opinion
In our opinion,
(a) the consolidated financial statements of the Group and the financial statements of the Company are properly drawn up in accordance with the provisions of the Singapore Companies Act, Cap. 50 (the “Act”) and International Financial Reporting Standards so as to give a true and fair view of the state of affairs of the Group and of the Company as at 31 March 2009 and of the results and changes in equity of the Group and of the Company and cash flows of the Group for the financial year then ended on that date; and
(b) the accounting and other records required by the Act to be kept by the Company have been properly
kept in accordance with the provisions of the Act.
SHANKER IYER & CO PUBLIC ACCOUNTANTS AND CERTIFIED PUBLIC ACCOUNTANTS
Singapore
25 August 2009

38 | P a g e M o r t i c e L i m i t e d A n n u a l R e p o r t & A c c o u n t s 2 0 0 9
BALANCE SHEETS AS AT 31 MARCH 2009
Group
Company
Note 2009 2008 2009 2008
US$ US$ US$ US$
NON‐CURRENT ASSETS
Plant and equipment 4 677,163 609,147 ‐ ‐
Investment in subsidiary 5 ‐ ‐ 6,849,675 394,675
Deferred tax asset 6 618,853 165,870 ‐ ‐
Fixed deposits 7 111,933 14,589 ‐ ‐
Security deposits 8 88,897 439,329 ‐ ‐
1,496,846 1,228,935 6,849,675 394,675
CURRENT ASSETS
Cash and cash equivalents 9 3,253,140 390,420 1,294,212 5,028
Trade receivables 10 4,630,997 3,690,329 ‐ ‐
Other receivables 11 1,617,526 829,989 8,532 551,215
Inventories, at cost 12 67,262 20,481 ‐ ‐
9,568,925 4,931,219 1,302,744 556,243
CURRENT LIABILITIES
Trade payables 13 399,627 1,390,460 ‐ ‐
Other payables 14 2,733,403 2,709,298 386,965 568,542
Bank overdraft 9 1,241,451 200,389 ‐ ‐
Finance lease 15 60,760 43,029 ‐ ‐
Borrowings 16 90,218 369,052 ‐ ‐
4,525,459 4,712,228 386,965 568,542
NET CURRENT ASSETS/(LIABILITIES) 5,043,466 218,991 915,779 (12,299)
NON‐CURRENT LIABILITIES
Finance lease 15 (78,812) (97,271) ‐ ‐
Borrowings 16 (151,820) (237,883) ‐ ‐
Retirement benefit obligations 17 (124,958) (92,916) ‐ ‐
NET ASSETS 6,184,722 1,019,856 7,765,454 382,376
SHAREHOLDERS’ EQUITY
Share capital 18 9,555,312 400,001 9,555,312 400,001
Reserves 19 (3,370,590) 617,361 (1,789,858) (17,625)
6,184,722 1,017,362 7,765,454 382,376
Minority interest 20 ‐ 2,494 ‐ ‐
TOTAL EQUITY 6,184,722 1,019,856 7,765,454 382,376
The annexed notes form an integral part of and should be read in conjunction with these financial statements.

39 | P a g e M o r t i c e L i m i t e d A n n u a l R e p o r t & A c c o u n t s 2 0 0 9
INCOME STATEMENTS FOR THE YEAR ENDED 31 MARCH 2009
Group Company
Note 2009 09.01.2008
To
31.03.2008
2009 09.01.2008
To
31.03.2008
US$ US$ US$ US$
REVENUE
Services income 23,156,372 3,390,490 ‐ ‐
Other income 21 300,747 1,569 166,454 ‐
Negative goodwill written back 22 ‐ 651,478 ‐ ‐
Total revenue 23,457,119 4,043,537 166,454 ‐
COSTS AND EXPENSES
Services consumed 23 19,184,679 2,713,594 ‐ ‐
Depreciation of plant and equipment 4 161,653 20,401 ‐ ‐
Staff and related costs 2,860,657 471,020 306,762 ‐
Operating expenses 24 2,649,858 259,460 195,672 17,625
Initial Public Offering expenses 1,436,253 ‐ 1,436,253 ‐
Finance costs 25 407,880 60,333 ‐ ‐
Total costs and expenses 26,700,980 3,524,808 1,938,687 17,625
(LOSS)/PROFIT BEFORE TAXATION 26 (3,243,861) 518,729 (1,772,233) (17,625)
TAXATION 27 314,384 113,905 ‐ ‐
(LOSS)/PROFIT FOR THE YEAR/PERIOD (2,929,477) 632,634 (1,772,233) (17,625)
Attributable to:
Equity holders of the Company (2,926,983) 632,642
Minority interest (2,494) (8)
(2,929,477) 632,634
(Losses)/Earnings per share
‐ Basic and diluted 28 (0.06) 0.07
The annexed notes form an integral part of and should be read in conjunction with these financial statements.

40 | P a g e M o r t i c e L i m i t e d A n n u a l R e p o r t & A c c o u n t s 2 0 0 9
STATEMENTS OF CHANGES IN EQUITY FOR THE YEAR ENDED 31 MARCH 2009
Attributable to equity holders of the group
Share
capital
(Accumulated losses)/Retained
profits
Currency translation reserve
Total Minority interest
Total
US$ US$ US$ US$ US$ US$
Group
2009
Balance as at 1 April 2008 400,001 632,642 (15,281) 1,017,362 2,494 1,019,856
Issuance of ordinary shares (Note 18) 9,730,120 ‐ ‐ 9,730,120 ‐ 9,730,120
Share issue expenses (Note 18) (574,809) ‐ ‐ (574,809) ‐ (574,809)
Loss for the year ‐ (2,926,983) ‐ (2,926,983) (2,494) (2,929,477)
Translation difference on consolidation ‐ ‐ (1,060,968) (1,060,968) ‐ (1,060,968)
Balance as at 31 March 2009 9,555,312 (2,294,341) (1,076,249) 6,184,722 ‐ 6,184,722
2008
Issuance of subscriber’s share 1 ‐ ‐ 1 ‐ 1
Issuance of ordinary shares (Note 18) 400,000 ‐ ‐ 400,000 ‐ 400,000
Acquisition of subsidiaries ‐ ‐ ‐ ‐ 2,502 2,502
Profit for the period ‐ 632,642 ‐ 632,642 (8) 632,634
Translation difference on consolidation ‐ ‐ (15,281) (15,281) ‐ (15,281)
Balance as at 31 March 2008 400,001 632,642 (15,281) 1,017,362 2,494 1,019,856
The annexed notes form an integral part of and should be read in conjunction with these financial statements.

41 | P a g e M o r t i c e L i m i t e d A n n u a l R e p o r t & A c c o u n t s 2 0 0 9
STATEMENTS OF CHANGES IN EQUITY (…CONT’D) FOR THE YEAR ENDED 31 MARCH 2009
Attributable to equity holders of the group
Share
capital
(Accumulated
losses)/Retained
profits
Currency
translation
reserve
Total
Minority
interest
Total
US$ US$ US$ US$ US$ US$
Company
2009
Balance as at 1 April 2008 400,001 (17,625) ‐ 382,376 ‐ 382,376
Issuance of ordinary shares (Note 18) 9,730,120 ‐ ‐ 9,730,120 ‐ 9,730,120
Share issue expenses (Note 18) (574,809) ‐ ‐ (574,809) ‐ (574,809)
Loss for the year ‐ (1,772,233) ‐ (1,772,233) ‐ (1,772,233)
Balance as at 31 March 2009 9,555,312 (1,789,858) ‐ 7,765,454 ‐ 7,765,454
2008
Issuance of subscriber’s share (Note 18) 1 ‐ ‐ 1 ‐ 1
Issuance of ordinary shares 400,000 ‐ ‐ 400,000 ‐ 400,000
Loss for the period ‐ (17,625) ‐ (17,625) ‐ (17,625)
Balance as at 31 March 2008 400,001 (17,625) ‐ 382,376 ‐ 382,376
The annexed notes form an integral part of and should be read in conjunction with these financial statements

42 | P a g e M o r t i c e L i m i t e d A n n u a l R e p o r t & A c c o u n t s 2 0 0 9
CONSOLIDATED CASH FLOW STATEMENT FOR THE YEAR ENDED 31 MARCH 2009
2009
09.01.2008to
31.03.2008
Note US$ US$
Cash Flows From Operating Activities
(Loss)/profit before taxation (3,243,861) 518,729
Adjustments for:
Depreciation of plant and equipment 4 161,653 20,401
Negative goodwill written back ‐ (651,478)
Bad debt written off 26 134,684 ‐
Interest expense 25 407,880 60,333
Interest income 21 (94,160) ‐
Provision for doubtful debts 24 199,023 ‐
Cash flows from operations before changes in working capital (2,434,781) (52,015)
Working capital changes, excluding changes relating to cash:
Trade receivables (1,254,696) (212,659)
Other receivables 241,954 87,136
Inventories, at cost (46,781) (20,481)
Trade payables (990,833) 80,885
Other payables 61,005 (67,573)
Retirement benefit obligations (32,042) 14,346
Cash absorbed by operations (4,456,174) (170,361)
Income tax paid (668,180) ‐
Interest paid (408,355) (60,333)
Interest received 66,733 ‐
Net cash absorbed by operating activities (5,465,976) (230,694)
Cash Flows From Investing Activities
Acquisition of plant and equipment 4 (372,169) (98,022)
Net cash outflow on acquisition of subsidiaries ‐ (394,675)
Proceeds from disposal of plant and equipment 27,203 557,562
Net cash (absorbed by)/generated from investing activities (344,966) 64,865

43 | P a g e M o r t i c e L i m i t e d A n n u a l R e p o r t & A c c o u n t s 2 0 0 9
CONSOLIDATED CASH FLOW STATEMENT (…CONT’D) FOR THE YEAR ENDED 31 MARCH 2009
Cash Flows From Financing Activities
2009
US$
09.01.2008 to
31.03.2008
US$
Issuance of share capital 18 9,730,120 400,001
Payment for share issue expenses 18 (574,809) ‐
Proceeds from finance lease 72,463 140,300
Proceeds from borrowings ‐ 344,108
Advances to related parties (605,082) (62,070)
Repayment of finance lease obligation (36,273) ‐
Repayment of borrowings (192,771) ‐
Withdrawal/(placement) of security deposit 350,432 (439,329)
Placement of pledged fixed deposit (97,344) (14,589)
Net cash generated from financing activities 8,646,736 368,421
Net increase in cash and cash equivalents 2,835,794 202,592
Unrealised exchange difference (1,014,136) (12,561)
Cash and cash equivalents at the beginning of the year/period 190,031 ‐
Cash and cash equivalents at the end of the year/period 9 2,011,689 190,031

44 | P a g e M o r t i c e L i m i t e d A n n u a l R e p o r t & A c c o u n t s 2 0 0 9
CONSOLIDATED CASH FLOW STATEMENT (…CONT’D) FOR THE YEAR ENDED 31 MARCH 2009 Note: In the previous financial period, the Company acquired a subsidiary Company. The effect of the above acquisition on the cash flows of the Group was as follows:
2008
US$
Summary of the effect of acquisition of a subsidiary
Cash and cash equivalents 557,562
Trade receivables 3,477,670
Other receivables 881,167
Deferred tax asset 2,499
Plant and equipment 539,352
Trade payables (1,309,575)
Retirement benefit obligations (78,570)
Other payables (2,758,686)
Long term borrowings (262,827)
Minority shareholders interest (2,539)
Currency translation adjustment 100
Net assets acquired 1,046,153
Negative goodwill on consolidation (651,478)
Amount paid in consideration of acquisition 394,675
Cash and cash equivalents of acquired entity 557,562
The annexed notes form an integral part of and should be read in conjunction with these financial statements

45 | P a g e M o r t i c e L i m i t e d A n n u a l R e p o r t & A c c o u n t s 2 0 0 9
NOTES TO THE FINANCIAL STATEMENTS
FOR THE FINANCIAL YEAR ENDED 31 MARCH 2009
1. CORPORATE INFORMATION
Mortice Limited (Company Registration No: 200800770W) is a public limited Company, domiciled in
Singapore. The Company’s registered office is at 36 Robinson Road, #17‐01 City House, Singapore
068877.
The Company was listed on Alternate Investment Market (AIM) of London Stock Exchange in United
Kingdom on 15 May 2008, issuing 7,700,000 ordinary shares with proceeds amounting to
US$9,730,120.
The principal activities of the Group are to provide guarding services, facilities management services,
property management, fleet management and sale of safety equipment and their installation. There
have been no significant changes in the nature of these activities during the financial year.
The financial statements of the Group and of the Company as at 31 March 2009 and for the year then
ended were authorised and approved by the Board of Directors for issuance on 25 August 2009.
2. SIGNIFICANT ACCOUNTING POLICIES
a) Basis of preparation
The consolidated financial statements are prepared in accordance with the provision of
Singapore Companies Act, Cap. 50 and International Financial Reporting Standards (“IFRS”).
The consolidated financial statements, which are expressed in United States dollars are prepared
in accordance with the historical cost convention, except as disclosed in the accounting policies.
The following standards, interpretations or amendments have been issued till the date of
approval of these consolidated financial statements but are not yet effective. These have not
been adopted early by the Group and accordingly have not been considered in the preparation
of the consolidated financial statements of the Group.

46 | P a g e M o r t i c e L i m i t e d A n n u a l R e p o r t & A c c o u n t s 2 0 0 9
NOTES TO THE FINANCIAL STATEMENTS FOR THE FINANCIAL YEAR ENDED 31 MARCH 2009 (…CONT’D)
2. SIGNIFICANT ACCOUNTING POLICIES (…CONT’D)
a) Basis of preparation (…Cont’d)
Standard or Interpretation Effective dates
IAS 1: Presentation of Financial Statements: A
Revised Presentation (Issued September 2007)
Annual periods beginning on or after
1 January 2009
IAS 23: Borrowing costs (Revised) Annual periods beginning on or after
1 January 2009
IAS 27: Consolidated and Separate Financial
Statements (Amendment January 2008)
Annual periods beginning on or after
1 July 2009
IAS 32 Financial Instruments: Presentation‐ and IAS 1 Presentation of Financial Statements: Puttable Financial Instruments and Obligations Arising on Liquidation Amendment (Issued 14 February 2008)
Annual periods beginning on or after
1 January 2009
IFRS 1 First Time Adoption of IFRS Revised (Issued 27 November 2008)
Periods beginning on or after 1 January
2009
IFRS 2: Share‐ based Payment (Amendment‐ January
2008)
Annual periods beginning on or after
1 January 2009
IFRS 3: Business Combinations (January 2008) For acquisition dated on or after the
beginning of the first annual reporting
period beginning on or after 1 July 2009
IFRS 8: Operating Segments Annual periods beginning on or after 1
January 2009
IFRIC 13: Customer Loyalty Programmes Annual periods beginning on or after
1 July 2008
IFRIC 15: Agreements for the Construction of Real
Estate
Annual periods commencing on or after 1
January 2009

47 | P a g e M o r t i c e L i m i t e d A n n u a l R e p o r t & A c c o u n t s 2 0 0 9
NOTES TO THE FINANCIAL STATEMENTS FOR THE FINANCIAL YEAR ENDED 31 MARCH 2009 (…CONT’D)
2. SIGNIFICANT ACCOUNTING POLICIES (…CONT’D)
a) Basis of preparation (…cont’d)
Standard or Interpretation Effective dates
IFRIC 16: Hedges of a Net Investment in a Foreign
Operation issued
Annual periods commencing on or after 1
October 2008
IFRIC 17: Distributions of Non‐cash Assets to Owners
Annual periods beginning on or after 1 July
2009
IFRIC 18: Transfers of Assets from Customers Annual periods beginning on or after 1 July
2009
Improvements to IFRS (Issued 22 May 2008) Annual periods beginning on or after 1
January 2009
Amendments to IFRS 1 and IAS 27 Cost of an
Investment in a subsidiary, jointly‐controlled entity
or associate (Issued May 2008)
Annual periods beginning on or after 1
January 2009
Improvements to IFRS (Issued 16 April 2009) Various, earliest starting effective is for
annual periods beginning on or after 1 July
2009
Amendment to IAS 39 Financial Instruments:
Recognition and Measurement: Eligible Hedged
Items (Issued July 2008)
Annual periods beginning on or after
1 July 2009
Amendment to IAS 39 Reclassification of Financial
Assets: Effective Date and Transition (Issued
November 2008)
Annual periods beginning on or after
1 July 2008
Amendment to IFRS 7 Improving Disclosures about
Financial Instruments (Issued March 2009)
Annual periods beginning on or after
1 January 2009
Amendments to IFRIC 9 and IAS 39 Embedded
Derivatives (Issued March 2009)
Annual periods beginning on or after
30 June 2009

48 | P a g e M o r t i c e L i m i t e d A n n u a l R e p o r t & A c c o u n t s 2 0 0 9
NOTES TO THE FINANCIAL STATEMENTS FOR THE FINANCIAL YEAR ENDED 31 MARCH 2009 (…CONT’D)
2. SIGNIFICANT ACCOUNTING POLICIES (…CONT’D)
a) Basis of preparation (…cont’d)
The management anticipates that all of the above pronouncements will be adopted by the
Group in the first accounting period beginning after the effective date of each of the
pronouncements. Based on the Group’s current business model and accounting policies,
management does not expect material changes to the recognition and measurement principles
on Group’s financial statements when these Standards/ Interpretations become effective.
However, the directors are aware that the application of the above standards and
interpretations will require certain additional disclosures to be included in the Group’s
subsequent financial statements.
b) Basis of consolidation
The consolidated financial statements incorporate the financial statements of the Company and
its subsidiaries. Control is achieved where the Company has the power to govern the financial
and operating policies of an entity so as to obtain benefits from its activities. Acquisition of
subsidiaries is accounted using the purchase method of accounting. The results of the
subsidiaries’ operations have been included in the consolidated financial statements from the
effective date of acquisition or up to the effective date of disposal, as appropriate. All inter‐
Company transactions and balances are eliminated on consolidation and the consolidated
financial statements reflect external transactions only. The accounting periods of the
subsidiaries are coterminous with that of the Company. Negative goodwill represents the excess
of the fair value of the subsidiary’s net identifiable assets over the cost of acquisition at the date
of acquisition. Negative goodwill is recognised immediately in the income statement.
In the Company’s financial statements, investment in subsidiaries is carried at cost less any
impairment in net recoverable value which has been recognised in the income statement.
c) Foreign currency translation
Items included in the financial statements of each entity in the Group are measured using the
currency of the primary economic environment in which the entity operates (“functional
currency”). The functional currency of the Group is Indian rupee and the financial statements
are presented in United States dollar, which is the presentation currency.
The United States dollar is the presentation currency of the Group as the same is a widely
accepted currency and reflects better the financial results to the market and the investors.

49 | P a g e M o r t i c e L i m i t e d A n n u a l R e p o r t & A c c o u n t s 2 0 0 9
NOTES TO THE FINANCIAL STATEMENTS FOR THE FINANCIAL YEAR ENDED 31 MARCH 2009 (…CONT’D)
2. SIGNIFICANT ACCOUNTING POLICIES (…CONT’D)
c) Foreign currency translation (…cont’d)
In presenting the financial statements of the individual entity, monetary assets and liabilities in
foreign currencies are translated into United States dollar at rates of exchange closely
approximate to those ruling at the balance sheet date and transactions in foreign currencies
during the financial period are translated at rates ruling on transaction dates. Non‐monetary
items carried at fair values that are denominated in foreign currencies are retranslated at the
rates prevailing on the date when the fair values were determined. Non‐monetary items that are
measured in terms of historical cost in a foreign currency are not retranslated.
Exchange differences arising on the settlement of monetary items, and on retranslation of
monetary items are included in the income statement. Exchange differences arising on the
retranslation of non‐monetary items carried at fair values are included in the income statement
for the year except for differences arising on the retranslation of other non‐monetary items in
respect of which gains and losses are recognised directly in equity. For such non‐monetary
items, any exchange component of that gain or loss is also recognised directly in equity.
For consolidation purposes, the assets and liabilities of the foreign subsidiary Company are
translated at the rate of exchange ruling at the balance sheet date and income statement items
are translated at the average rate. The effects of translation are taken directly to foreign
currency translation reserves within equity. Such translation differences are recognised in
income statement in the period in which the subsidiary is disposed of.
d) Plant and equipment
Plant and equipment are stated at cost less accumulated depreciation and accumulated
impairment loss. The cost of an asset comprises its purchase price and any directly attributable
costs of bringing the asset to working condition for its intended use. Expenditure for additions,
improvements and renewals are capitalised and expenditure for maintenance and repairs are
charged to the income statement. If plant and equipment are sold or retired, their cost and
accumulated depreciation and accumulated impairment losses (if any), are removed from the
consolidated financial statements and any gain or loss resulting from their disposal is included in
the income statement.
Advances paid for the acquisition or construction of property, plant and equipment under
construction which are outstanding at the balance sheet date and the cost of property, plant
and equipment under construction before such date are disclosed as “Construction in Progress”.
No depreciation is provided on construction in progress.

50 | P a g e M o r t i c e L i m i t e d A n n u a l R e p o r t & A c c o u n t s 2 0 0 9
NOTES TO THE FINANCIAL STATEMENTS FOR THE FINANCIAL YEAR ENDED 31 MARCH 2009 (…CONT’D)
2. SIGNIFICANT ACCOUNTING POLICIES (…CONT’D)
e) Depreciation of plant and equipment
Depreciation is calculated to write off the cost of plant and equipment by the straight‐line
method over their estimated useful lives. The estimated useful lives are as follows:
Computers 3 years
Office equipment 5 years
Leasehold improvements 5 years
Machinery 5 years
Furniture and fittings 5 years
Motor vehicles 5 years
Assets held under finance leases are depreciated over their expected useful lives on the same
basis as owned assets or, where shorter, the term of the relevant lease.
The residual values and useful lives of plant and equipment are reviewed, and adjusted as
appropriate, at each balance sheet date. Fully depreciated plant and equipment are retained in
the financial statements until they are no longer in use.
f) Investment in subsidiaries
Unquoted equity investments in subsidiaries are stated at cost less accumulated impairment
losses. On disposal of investment in subsidiary, the difference between the net disposal
proceeds and the carrying amount of the investment is taken to the income statement.
g) Cash and cash equivalents
Cash and cash equivalents consist of unsecured cash and bank balances, short‐term and long‐
term fixed deposits, and bank overdraft.
h) Effective interest rate method
The effective interest rate method is a method of calculating the amortised cost of a financial
instrument and of allocating interest income or expense over the relevant period. The effective
interest rate is the rate that discounts estimated future cash receipts or payments through the
expected life of the financial instrument, or where appropriate, a shorter period. Income is
recognised on an effective interest rate basis for debt instruments.

51 | P a g e M o r t i c e L i m i t e d A n n u a l R e p o r t & A c c o u n t s 2 0 0 9
NOTES TO THE FINANCIAL STATEMENTS FOR THE FINANCIAL YEAR ENDED 31 MARCH 2009 (…CONT’D)
2. SIGNIFICANT ACCOUNTING POLICIES (…CONT’D)
i) Trade and other receivables
Trade and other receivables are recognised initially at fair value and subsequently measured at
amortised cost using the effective interest rate method less allowance for impairment. An
allowance for impairment of receivables is established when there is objective evidence that the
Group will not be able to collect all amounts due according to the original terms of receivables.
The amount of the allowance is the difference between the asset’s carrying amount and
estimated future cash flows. The amount of the allowance is recognised in the income
statement.
j) Inventories
Inventories are stated at the lower of cost and net realisable value. In general, cost is determined
on a first in first out basis. Cost includes all cost of purchase and other costs incurred in bringing
the inventories to their present location and condition. Net realisable value is the price at which
the inventories can be realised in the normal course of business after allowing for the costs of
realisation. Work in progress represents material and equipment under installation which are
stated at cost. Cost includes all direct expenditure and all appropriate overheads.
k) Trade and other payables
Financial liabilities are recognised on the Group’s balance sheet when the Group becomes a
party to the contractual provisions of the instrument.
Trade and other payables are initially measured at fair value, and subsequently measured at
amortised cost, using the effective interest rate method.
The Group derecognises financial liabilities when, and only when, the Group’s obligations are
discharged, cancelled or expired.
l) Equity instruments
Equity instruments issued by the Group are recorded at the proceeds received, net of direct
issue costs.
m) Revenue recognition
Revenue is measured at the fair value of the consideration received or receivable and represents
amounts receivable for services provided in the normal course of business, net of discounts and
sales related taxes. The following specific recognition criteria must also be met before revenue
is recognised:
(i) Income from services is recognised upon rendering of services.
(ii) Interest income is recognised on a time apportioned basis.

52 | P a g e M o r t i c e L i m i t e d A n n u a l R e p o r t & A c c o u n t s 2 0 0 9
NOTES TO THE FINANCIAL STATEMENTS FOR THE FINANCIAL YEAR ENDED 31 MARCH 2009 (…CONT’D)
2. SIGNIFICANT ACCOUNTING POLICIES (…CONT’D)
n) Income tax
Income tax expense is calculated on the basis of tax effect accounting, using the liability method
and is applied to all significant temporary differences.
Income tax on the profit or loss for the year comprises current and deferred tax. Income tax is
recognised in the income statement except to the extent that it relates to items recognised
directly to equity, in which case it is recognised in equity.
Current tax is the expected tax payable on the taxable income for the period using tax rates
enacted or substantially enacted at the balance sheet date.
Deferred income tax is provided, using the liability method, on all temporary differences at the
balance sheet date between the tax bases of assets and liabilities and their carrying amounts for
financial reporting purposes.
Deferred tax liabilities are recognised for all taxable temporary differences.
Deferred tax assets are recognised for all deductible temporary differences, carry‐forward of
unabsorbed capital allowances and unused tax losses, to the extent that it is probable that
taxable profit will be available against which the deductible temporary differences, carry‐
forward of unused tax credits and unused tax losses can be utilised.
At each balance sheet date, the Group re‐assesses unrecognised deferred tax assets and the
carrying amount of deferred tax assets. The Group recognises a previously unrecognised
deferred tax asset to the extent that it has become probable that future taxable profit will allow
the deferred tax asset to be recovered. The Group conversely reduces the carrying amount of a
deferred tax asset to the extent that it is no longer probable that sufficient taxable profit will be
available to allow the benefit of part or all of the deferred tax asset to be utilised.
Deferred tax assets and liabilities are measured at the tax rates that are expected to apply to
the period when the asset is realised or the liability is settled, based on tax rates (and tax laws)
that have been enacted at the balance sheet date.
o) Impairment of assets
i. Non‐financial assets
The carrying amounts of the Group’s assets are reviewed at each balance sheet date to
determine whether there is any indication of impairment. If any such indication exists, the
asset’s recoverable amounts are estimated in order to determine the extent of the
impairment loss (if any). An impairment loss is recognised whenever the carrying amount of
an asset exceeds its recoverable amount. The impairment loss is charged to the income
statement unless it reverses a previous revaluation, credited to equity, in which case it is
charged to equity.

53 | P a g e M o r t i c e L i m i t e d A n n u a l R e p o r t & A c c o u n t s 2 0 0 9
NOTES TO THE FINANCIAL STATEMENTS FOR THE FINANCIAL YEAR ENDED 31 MARCH 2009 (…CONT’D)
2. SIGNIFICANT ACCOUNTING POLICIES (…CONT’D)
o) Impairment of assets (…Cont’d)
i. Non‐financial assets (…Cont’d)
Where an impairment loss subsequently reverses, the carrying amount of the asset is
increased to the revised estimate of its recoverable amount, provided the increased carrying
amount does not exceed the carrying amount that would have been determined had no
impairment loss been recognised for the asset in prior years. A reversal of an impairment
loss is recognised immediately in the income statement, unless the relevant asset is carried
at a revalued amount, in which case the reversal of the impairment loss is treated as a
revaluation increase.
ii. Financial assets
The carrying amount of these assets is reduced through the use of an impairment allowance
account which is calculated as the difference between the carrying amount and the present
value of estimated future cash flows, discounted at the original effective interest rate. When
the asset becomes uncollectible, it is written off against the allowance account. Subsequent
recoveries of amounts previously written off are recognised against the same line item in the
income statement.
The allowance for impairment loss account is reduced through the income statement in a
subsequent period when the amount of impairment loss decreases and the related decrease
can be objectively measured.
p) Provisions
Provisions are recognised when the Group has a present obligation (legal or constructive) as a
result of a past event and it is probable that an outflow of resources embodying economic
benefits will be required to settle the obligation, and a reliable estimate can be made of the
amount of the obligation.

54 | P a g e M o r t i c e L i m i t e d A n n u a l R e p o r t & A c c o u n t s 2 0 0 9
NOTES TO THE FINANCIAL STATEMENTS FOR THE FINANCIAL YEAR ENDED 31 MARCH 2009 (…CONT’D)
2. SIGNIFICANT ACCOUNTING POLICIES (…CONT’D)
q) Leases
Finance lease
Lease of assets where the Group assumes substantially the risks and rewards of ownership are
classified as finance leases.
Assets held under finance leases are recognised as assets of the Group at their fair values at the
inception of the lease or, if lower, at the present values of the minimum lease payments. The
corresponding liability to the lessor (net of finance charges) is included in the balance sheet as a
finance lease obligation. Lease payments are apportioned between finance charges and
reduction of the lease obligation so as to achieve a constant rate of interest on the remaining
balance of the liability. Finance charges are charged directly to the income statement over the
lease period so as to produce a constant periodic rate of interest on the remaining balance of
the liability for each period.
Gains arising from the sale and finance leaseback of plant and equipment are determined based
on fair values. Sale proceeds in excess of fair values are deferred and amortised over the
minimum lease terms.
Operating lease
Lease of assets in which a significant portion of the risks and rewards of ownership are retained
by the lessor are classified as operating leases.
Rental payables under operating leases are charged to income statement on a straight line basis
over the terms of the relevant lease.
r) Employee benefits
Defined contribution plan
As required by law, the Company and its subsidiary make pension contributions to Provident
Funds. Contributions are recognised as an expense in the income statements in the same period
as the employment which gives rise to the contributions.

55 | P a g e M o r t i c e L i m i t e d A n n u a l R e p o r t & A c c o u n t s 2 0 0 9
NOTES TO THE FINANCIAL STATEMENTS FOR THE FINANCIAL YEAR ENDED 31 MARCH 2009 (…CONT’D)
2. SIGNIFICANT ACCOUNTING POLICIES (…CONT’D)
r) Employee benefits (…cont’d)
Employee leave entitlement
The subsidiaries provide for encashment of leave entitlement as at year end for all the
employees. Hence, liabilities arising from employee entitlements to annual leave are recognised
when due.
Employee Gratuity
Employees are entitled to gratuity based on the years of service provided they serve on a
continuous basis for a period of 5 years. The liability for the same is calculated annually and
recognised on the basis of actuarial valuation by an independent actuary using the projected
unit credit method. Under this method, the projected accrued benefit is calculated at the
beginning of the year and again at the end of the year for each benefit that will accrue for all
active members of the plan.
s) Segment reporting
A business segment is a distinguishable component of the Group engaged in providing services
that are subject to risks and returns that are different from those of other business segments. A
geographical segment is a distinguishable component of the Group engaged in providing
services within a particular economic environment that is subject to risks and returns that are
different from those of segments operating in an other economic environment.
3. CRITICAL ACCOUNTING JUDGEMENT AND KEY SOURCES OF ESTIMATION UNCERTAINTY
In the process of applying the Group’s accounting policies, as described in note 2, management has
made the following judgements and estimations that have the most significant effect on the amounts
recognised in the financial statements:
(a) Plant and equipment
Management determines the estimated useful lives and residual values for the Group’s plant and
equipment. Management will revise the depreciation charge where useful lives and residual
values are different to previously estimated, or it will write off or write down technically obsolete
or non‐strategic assets that have been abandoned or sold.

56 | P a g e M o r t i c e L i m i t e d A n n u a l R e p o r t & A c c o u n t s 2 0 0 9
NOTES TO THE FINANCIAL STATEMENTS FOR THE FINANCIAL YEAR ENDED 31 MARCH 2009 (…CONT’D)
3. CRITICAL ACCOUNTING JUDGEMENT AND KEY SOURCES OF ESTIMATION UNCERTAINTY (…CONT’D)
(b) Income taxes
The Group and the Company have exposure to income taxes in countries where it operates.
Significant judgement is involved in determining the Group’s and the Company’s provision for
income taxes. The Group and the Company recognise liabilities for expected tax issues based on
estimates of whether additional taxes will be due. Where the final tax outcome of these matters
is different from the amounts that were initially recognised, such differences will impact the
income tax and deferred tax provision in the financial year in which such determination is made.
At 31 March 2009, the carrying amounts of the Group’s current income tax payable and deferred
tax assets are disclosed in the balance sheets.
(c) Retirement benefit obligations
Management determines the assumptions used by an independent actuary to calculate the
Group’s retirement benefit obligations.

57 | P a g e M o r t i c e L i m i t e d A n n u a l R e p o r t & A c c o u n t s 2 0 0 9
NOTES TO THE FINANCIAL STATEMENTS FOR THE FINANCIAL YEAR ENDED 31 MARCH 2009 (…CONT’D)
4. PLANT AND EQUIPMENT
Computers
Office
equipment Machinery
Furniture &
Fittings
Leasehold
Improvements
Motor
Vehicles
Construction
in Progress
Total
US$ US$ US$ US$ US$ US$ US$ US$
Group
2009
Cost
As 1 April 2008 56,560 18,849 44,759 327,188 ‐ 193,860 15,996 657,212
Additions 101,014 18,864 80,021 23,951 16,199 124,433 7,687 372,169
Disposals (510) (377) ‐ ‐ ‐ (26,316) ‐ (27,203)
Transfer ‐ ‐ ‐ ‐ 15,996 ‐ (15,996) ‐
Currency translation difference (12,169) (4,062) (9,646) (70,510) ‐ (41,778) (3,448) (141,613)
At 31 March 2009 144,895 33,274 115,134 280,629 32,195 250,199 4,239 860,565
Accumulated depreciation
As 1 April 2008 10,616 3,523 6,888 20,458 ‐ 6,580 ‐ 48,065
Charge for the year 34,062 5,290 16,691 59,455 1,421 44,734 ‐ 161,653
Currency translation difference (5,634) (1,283) (3,133) (10,286) (140) (5,840) ‐ (26,316)
At 31 March 2009 39,044 7,530 20,446 69,627 1,281 45,474 ‐ 183,402
Net book value
At 31 March 2009 105,851 25,744 94,688 211,002 30,914 204,725 4,239 677,163

58 | P a g e M o r t i c e L i m i t e d A n n u a l R e p o r t & A c c o u n t s 2 0 0 9
NOTES TO THE FINANCIAL STATEMENTS FOR THE FINANCIAL YEAR ENDED 31 MARCH 2009 (…CONT’D)
4. PLANT AND EQUIPMENT (…CONT’D)
Computers
Office
equipment Machinery
Furniture &
Fittings Motor Vehicles
Construction
in Progress Total
US$ US$ US$ US$ US$ US$ US$
Group
2008
Cost
Additions on acquisition of
subsidiaries 41,660 18,454 42,481 330,885 117,712 16,232 567,424
Additions 15,505 663 2,894 1,104 77,856 ‐ 98,022
Currency translation difference (605) (268) (616) (4,801) (1,708) (236) (8,234)
At 31 March 2008 56,560 18,849 44,759 327,188 193,860 15,996 657,212
Accumulated depreciation
Additions on acquisition of
subsidiaries 8,383 2,798 5,437 9,973 1,482 ‐ 28,073
Charge for the period 2,355 766 1,530 10,630 5,120 ‐ 20,401
Currency translation difference (122) (41) (79) (145) (22) ‐ (409)
At 31 March 2008 10,616 3,523 6,888 20,458 6,580 ‐ 48,065
Net book value
At 31 March 2008 45,944 15,326 37,871 306,730 187,280 15,996 609,147

59 | P a g e M o r t i c e L i m i t e d A n n u a l R e p o r t & A c c o u n t s 2 0 0 9
NOTES TO THE FINANCIAL STATEMENTS FOR THE FINANCIAL YEAR ENDED 31 MARCH 2009 (…CONT’D)
4. PLANT AND EQUIPMENT (…CONT’D)
The Group’s plant and equipment as at 31 March 2009 include assets under finance lease disclosed under
Note 15 with net book value of US$241,027 (2008: US$187,280).
The Group’s plant and equipment as at 31 March 2009 include computers and motor vehicles of US$59,593
(2008: Nil) which have been pledged as security for borrowings as disclosed under Note 16.
5. INVESTMENT IN SUBSIDIARY
Company
2009 2008
US$ US$
Unquoted equity investment, at cost
At beginning of the year/period 394,675 ‐
Additions during the year/period 6,455,000 394,675
At end of the year/period 6,849,675 394,675
The details of the subsidiaries are as follows:
Name of Company
Country of
incorporation
Principal
activities
Financial
Year End
Percentage of
equity held by
the
company
Cost of
Investment
2009 2008 2009 2008
US$ US$
Direct subsidiary Company
held by the Company
Tenon Property Services Pvt
Ltd **
India Facilities &
Property
Management
and Fleet
Management
Services
31 March 99.48% 99.36% 6,849,675 394,675

60 | P a g e M o r t i c e L i m i t e d A n n u a l R e p o r t & A c c o u n t s 2 0 0 9
NOTES TO THE FINANCIAL STATEMENTS FOR THE FINANCIAL YEAR ENDED 31 MARCH 2009 (…CONT’D)
5. INVESTMENT IN SUBSIDIARY (…CONT’D)
Name of Company
Country of
incorporation
Principal
activities
Financial
Year End
Percentage of
equity held by
the
company
Cost of
Investment
2009 2008 2009 2008
US$ US$
Sub‐subsidiary Company
Held by subsidiary Company
Peregrine Guarding Pvt Ltd
(Subsidiary of Tenon Property
Services Pvt Ltd)**
India Guarding,
Safety and
Security
Services
31
March
100% 100% 377,783 377,783
Tenon Support Services Pvt
Ltd
(Subsidiary of Tenon Property
Services Pvt Ltd)**
India Guarding,
Safety and
Security
Services
31
March
100% ‐ 2,010 ‐
Tenon Project Services Pvt Ltd
(Subsidiary of Tenon Property
Services Pvt Ltd)**
India Guarding,
Safety and
Security
Services
31
March
100% ‐ 2,010 ‐
Peregrine Protection Services
Pvt Ltd
(Subsidiary of Peregrine
Guarding Pvt Ltd)**
India Guarding,
Safety and
Security
Services
31
March
100% ‐ 1,918 ‐
**Financial statements of the subsidiaries for the year ended 31 March 2009 were audited by Walker
Chandiok & Co, Chartered Accountants, India.

61 | P a g e M o r t i c e L i m i t e d A n n u a l R e p o r t & A c c o u n t s 2 0 0 9
NOTES TO THE FINANCIAL STATEMENTS FOR THE FINANCIAL YEAR ENDED 31 MARCH 2009 (…CONT’D)
6. DEFERRED TAX ASSET
Group
2009 2008
US$ US$
At the beginning of the period 165,870 ‐
Transfer from income statement (Note 27) 549,157 165,870
Currency translation difference (96,174) ‐
At the end of the period 618,853 165,870
The following are the deferred tax liabilities and assets recognised by the Group and movements thereon:
At 1 April
2008
Movement
during the
year
At 31 March
2009
US$ US$ US$
Accelerated tax depreciation 3,684 420 4,104
Gratuity (31,582) (25,009) (56,591)
Others (8,892) (16,077) (24,969)
Tax losses carried forward (79,281) (460,478) (539,759)
Unabsorbed capital allowances (49,799) 48,161 (1,638)
(165,870) (452,983) (618,853)
One of the subsidiary companies has unabsorbed tax losses and capital allowances amounting to
approximately US$1,794,000 and US$29,000 (2008: US$233,000 and US$146,000), respectively available for
offsetting against future taxable income of the subsidiaries for the next seven assessment years subject to
conditions imposed by Indian Income Tax Act.

62 | P a g e M o r t i c e L i m i t e d A n n u a l R e p o r t & A c c o u n t s 2 0 0 9
NOTES TO THE FINANCIAL STATEMENTS FOR THE FINANCIAL YEAR ENDED 31 MARCH 2009 (…CONT’D)
7. FIXED DEPOSITS
The Company has pledged its fixed deposits as security for a bank guarantees obtained as disclosed in Note 30 to the financial statements.
8. SECURITY DEPOSITS
Security deposits are interest free and have maturity periods ranging between 1 to 2 years.
The security deposits are considered to approximate their fair values and are denominated in Indian rupees.
9. CASH AND CASH EQUIVALENTS
Group Company
2009 2008 2009 2008
US$ US$ US$ US$
Cash at bank 1,956,318 191,193 1,294,212 5,028
Cash on hand 132,936 186,233 ‐ ‐
Fixed deposits 1,163,886 12,994 ‐ ‐
3,253,140 390,420 1,294,212 5,028
The carrying amounts of cash and cash equivalents approximate their fair values and are denominated in
the following currencies:
Group Company
2009 2008 2009 2008
US$ US$ US$ US$
Indian rupees 1,958,928 385,392 ‐ ‐
United States dollars 1,294,212 5,028 1,294,212 5,028
3,253,140 390,420 1,294,212 5,028

63 | P a g e M o r t i c e L i m i t e d A n n u a l R e p o r t & A c c o u n t s 2 0 0 9
NOTES TO THE FINANCIAL STATEMENTS FOR THE FINANCIAL YEAR ENDED 31 MARCH 2009 (…CONT’D)
9. CASH AND CASH EQUIVALENTS (…CONT’D)
For the purpose of the consolidated cash flow statement, the year end cash and cash equivalents comprised the following:
Group
2009 2008
US$ US$
Cash at bank 1,956,318 191,193
Cash on hand 132,936 186,233
Fixed deposits (current) 1,163,886 12,994
3,253,140 390,420
Less: Bank overdraft (1,241,451) (200,389)
2,011,689 190,031
The bank overdraft bears interest of 12% per annum (2008: interest range from 11% to 13%) per annum. The
bank overdraft is secured by a pledge of trade receivables (Note 10).
10. TRADE RECEIVABLES
Group Company
2009 2008 2009 2008
US$ US$ US$ US$
Third parties 4,810,341 3,704,615 ‐ ‐
Less : Allowance for doubtful debts (179,344) (14,286) ‐ ‐
4,630,997 3,690,329 ‐ ‐
The Group’s trade receivables are denominated in Indian rupees.

64 | P a g e M o r t i c e L i m i t e d A n n u a l R e p o r t & A c c o u n t s 2 0 0 9
NOTES TO THE FINANCIAL STATEMENTS FOR THE FINANCIAL YEAR ENDED 31 MARCH 2009 (…CONT’D)
10. TRADE RECEIVABLES (…CONT’D)
Trade receivables are recognised at their original invoiced amounts which represent their fair values on initial
recognition. Trade receivables are non‐interest bearing and are due for settlement within 90 days credit
terms. The trade receivables are considered to be of short duration and are not discounted and the carrying
values are assumed to approximate their fair values.
Trade receivables of one of the subsidiaries are under floating charge security for bank overdraft (Note 9).
11. OTHER RECEIVABLES
Group Company
2009 2008 2009 2008
US$ US$ US$ US$
Deposits 229,531 98,661 5,685 ‐
Employee advances 91,715 50,692 ‐ ‐
Prepayments 72,591 567,359 2,451 551,215
Advances – third parties 48,901 33,512 ‐ ‐
Tax recoverable 357,819 ‐ ‐ ‐
Advances – related parties 667,152 62,070 ‐ ‐
Interest receivable 27,713 365 ‐ ‐
Unbilled revenue 65,678 ‐ ‐ ‐
Other debtors – third parties 56,426 17,330 396 ‐
1,617,526 829,989 8,532 551,215
Advances to related parties are unsecured, interest‐free and repayable on demand.

65 | P a g e M o r t i c e L i m i t e d A n n u a l R e p o r t & A c c o u n t s 2 0 0 9
NOTES TO THE FINANCIAL STATEMENTS FOR THE FINANCIAL YEAR ENDED 31 MARCH 2009 (…CONT’D)
11. OTHER RECEIVABLES (…CONT’D)
The carrying amounts of other receivables approximate their fair values. The Group’s and Company’s other
receivables are denominated in the following currencies:
Group Company
2009 2008 2009 2008
US$ US$ US$ US$
Indian rupees 1,608,994 278,774 ‐ ‐
Pound sterling 8,532 ‐ 8,532 ‐
United States dollars ‐ 551,215 ‐ 551,215
1,617,526 829,989 8,532 551,215
12. INVENTORIES, AT COST
Group Company
2009 2008 2009 2008
US$ US$ US$ US$
Finished Goods 54,125 2,290 ‐ ‐
Work in Progress 13,137 18,191 ‐ ‐
67,262 20,481 ‐ ‐
Work in progress represents material and equipment under installation at customer sites.
13. TRADE PAYABLES
The Group’s trade payables are denominated in Indian rupees.
Trade payables are recognised at their original invoiced amounts which represent their fair values on initial
recognition. Trade payables are considered to be of short duration and are not discounted and the carrying
values are assumed to approximate their fair values.

66 | P a g e M o r t i c e L i m i t e d A n n u a l R e p o r t & A c c o u n t s 2 0 0 9
NOTES TO THE FINANCIAL STATEMENTS FOR THE FINANCIAL YEAR ENDED 31 MARCH 2009 (…CONT’D)
14. OTHER PAYABLES
Group Company
2009 2008 2009 2008
US$ US$ US$ US$
Accruals for operating expenses 32,890 17,327 32,890 17,327
Advances – third parties 27,357 ‐ ‐ ‐
Salaries and wages payable 1,262,466 790,534 ‐ ‐
Dues and taxes payable 1,345,132 1,505,861 ‐ ‐
Provision for taxation ‐ 36,425 ‐ ‐
Other payables – third parties 14,114 ‐ 14,114 ‐
Other payables – related parties 51,444 359,151 10,471 359,151
Other payables – subsidiaries ‐ ‐ 329,490 192,064
2,733,403 2,709,298 386,965 568,542
Other payables are unsecured, interest‐free and repayable within the next twelve months.
The carrying amounts of other payables approximate their fair values and are denominated in the following
currencies:
Group Company
2009 2008 2009 2008
US$ US$ US$ US$
Indian rupees 2,686,399 2,691,971 339,961 551,215
Pound sterling 3,772 ‐ 3,772 ‐
Singapore dollars 40,406 ‐ 40,406 ‐
United States dollars 2,826 17,327 2,826 17,327
2,733,403 2,709,298 386,965 568,542

67 | P a g e M o r t i c e L i m i t e d A n n u a l R e p o r t & A c c o u n t s 2 0 0 9
NOTES TO THE FINANCIAL STATEMENTS FOR THE FINANCIAL YEAR ENDED 31 MARCH 2009 (…CONT’D)
15. FINANCE LEASE
Group
2009 2008
US$ US$
Due within one year 76,233 59,106
Due within two to five years 86,330 110,346
162,563 169,452
Finance charge allocated to future periods (22,991) (29,152)
139,572 140,300
Representing finance lease liabilities:
Current 60,760 43,029
Non‐current 78,812 97,271
139,572 140,300
The carrying amounts of the non‐current portion of finance lease obligations approximate their fair values.
The finance lease obligations are denominated in Indian rupees. The average floating rate is at 13.33% (2008:
13.28%) per annum.
The Group’s obligations under finance leases are secured by the lessors’ title to the leased assets (Note 4).
16. BORROWINGS
Group
2009 2008
US$ US$
Within one year 90,218 369,052
Within two to five years 151,820 237,883
242,038 606,935
The Group’s borrowings are denominated in Indian rupees.
The carrying amounts of borrowings approximate their fair values. The borrowings are secured against plant
and equipment (Note 4) and subject to interest at rates ranging from 13.25% to 18.35% (2008: 12.00% to
21.00%) per annum.
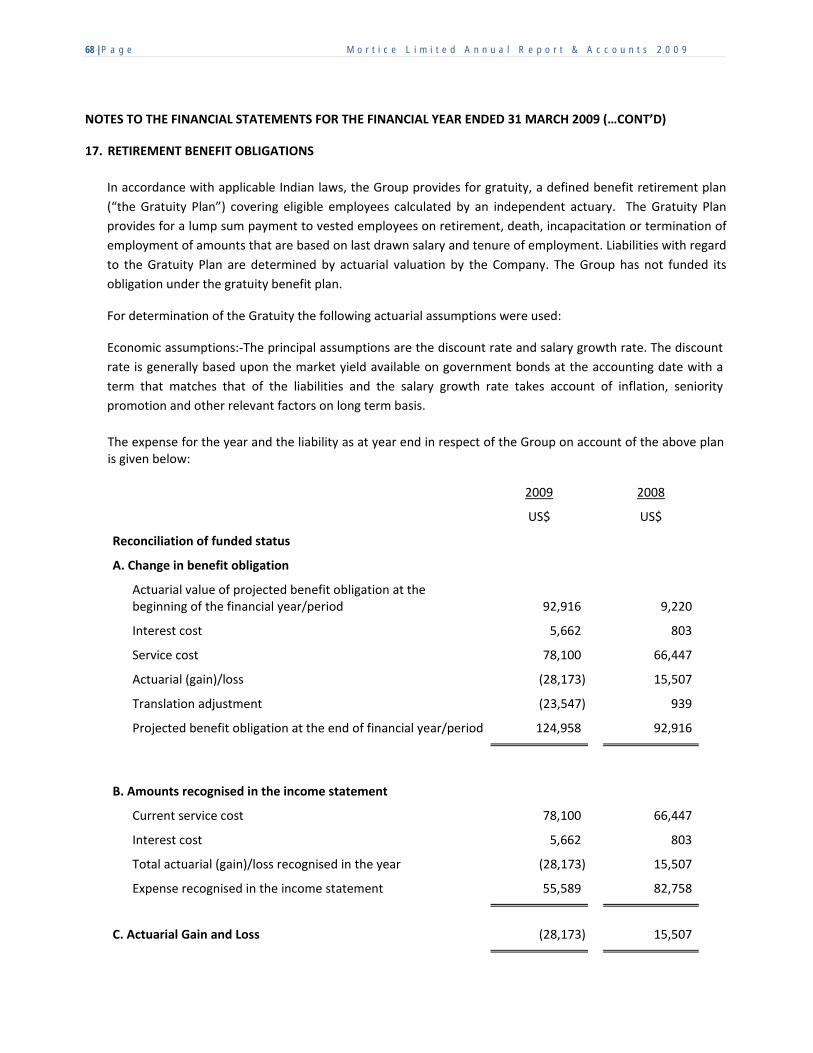
68 | P a g e M o r t i c e L i m i t e d A n n u a l R e p o r t & A c c o u n t s 2 0 0 9
NOTES TO THE FINANCIAL STATEMENTS FOR THE FINANCIAL YEAR ENDED 31 MARCH 2009 (…CONT’D)
17. RETIREMENT BENEFIT OBLIGATIONS
In accordance with applicable Indian laws, the Group provides for gratuity, a defined benefit retirement plan
(“the Gratuity Plan”) covering eligible employees calculated by an independent actuary. The Gratuity Plan
provides for a lump sum payment to vested employees on retirement, death, incapacitation or termination of
employment of amounts that are based on last drawn salary and tenure of employment. Liabilities with regard
to the Gratuity Plan are determined by actuarial valuation by the Company. The Group has not funded its
obligation under the gratuity benefit plan.
For determination of the Gratuity the following actuarial assumptions were used:
Economic assumptions:‐The principal assumptions are the discount rate and salary growth rate. The discount
rate is generally based upon the market yield available on government bonds at the accounting date with a
term that matches that of the liabilities and the salary growth rate takes account of inflation, seniority
promotion and other relevant factors on long term basis.
The expense for the year and the liability as at year end in respect of the Group on account of the above plan is given below: 2009 2008
US$ US$
Reconciliation of funded status
A. Change in benefit obligation
Actuarial value of projected benefit obligation at the beginning of the financial year/period 92,916
9,220
Interest cost 5,662 803
Service cost 78,100 66,447
Actuarial (gain)/loss (28,173) 15,507
Translation adjustment (23,547) 939
Projected benefit obligation at the end of financial year/period 124,958 92,916
B. Amounts recognised in the income statement
Current service cost 78,100 66,447
Interest cost 5,662 803
Total actuarial (gain)/loss recognised in the year (28,173) 15,507
Expense recognised in the income statement 55,589 82,758
C. Actuarial Gain and Loss (28,173) 15,507

69 | P a g e M o r t i c e L i m i t e d A n n u a l R e p o r t & A c c o u n t s 2 0 0 9
NOTES TO THE FINANCIAL STATEMENTS FOR THE FINANCIAL YEAR ENDED 31 MARCH 2009 (…CONT’D)
17. RETIREMENT BENEFIT OBLIGATIONS (…CONT’D)
For determination of the gratuity liability, the following actuarial assumptions were used:
Group
2009 2008
Retirement age 58 years 58 years
Mortality table LIC (94‐96) duly
modified
LIC (94‐96) duly
modified
Attrition rate per annum 53% 55%
Discount rate per annum 7% 8%
Rate of increase in compensation levels 8% 5%
18. SHARE CAPITAL
Company
2009 2008 2009 2008
Number of ordinary shares US$ US$
Issued ordinary shares
At the beginning of the year/period 40,000,001 ‐ 400,001 ‐
Issued for subscriber’s share ‐ 1 ‐ 1
Issued for cash consideration 7,700,000 40,000,000 9,730,120 400,000
Share issue expenses ‐ ‐ (574,809) ‐
At the end of the year/period 47,700,001 40,000,001 9,555,312 400,001
All issued ordinary shares are fully paid. There is no par value for these ordinary shares.
On 15 May 2008, the Company was listed on Alternate Investment Market (AIM) of London Stock Exchange in
United Kingdoms and issued 7,700,000 ordinary shares at a price of £0.65, which included a premium of £0.64.

70 | P a g e M o r t i c e L i m i t e d A n n u a l R e p o r t & A c c o u n t s 2 0 0 9
NOTES TO THE FINANCIAL STATEMENTS FOR THE FINANCIAL YEAR ENDED 31 MARCH 2009 (…CONT’D)
18. SHARE CAPITAL (…CONT’D)
The holders of ordinary shares are entitled to receive dividends as declared from time to time and are entitled
to one vote per share at meeting of the Company. All shares rank equally with regard to the Company’s
residual assets.
Share issue expenses directly incurred in relation to issue of new shares which are classified as equity are
treated as a reduction of the proceeds. Common costs relating to issue of new equity and listing of the
Company’s shares are allocated on a proportionate basis.
19. RESERVES
Group Company
2009 2008 2009 2008
US$ US$ US$ US$
Currency translation reserve
Balance at the beginning of the year/period (15,281) ‐ ‐ ‐
Exchange differences on consolidation (1,060,968) (15,281) ‐ ‐
Balance at the end of the year/period (1,076,249) (15,281) ‐ ‐
Retained profits
Balance at the beginning of the year/period 632,642 ‐ (17,625) ‐
(Loss)/Profit for the year/period (2,926,983) 632,642 (1,772,233) (17,625)
Balance at the end of the year/period (2,294,341) 632,642 (1,789,858) (17,625)
Total reserves (3,370,590) 617,361 (1,789,858) (17,625)

71 | P a g e M o r t i c e L i m i t e d A n n u a l R e p o r t & A c c o u n t s 2 0 0 9
NOTES TO THE FINANCIAL STATEMENTS FOR THE FINANCIAL YEAR ENDED 31 MARCH 2009 (…CONT’D)
20. MINORITY INTEREST
Group
2009 2008
US$ US$
Balance at the beginning of the year/period 2,494 ‐
Cost of investment ‐ 2,502
Loss for the year/period (2,494) (8)
Balance at the end of the year/period ‐ 2,494
The loss absorbed by the equity holders of the Company is US$3,524 (2008: US$Nil).
21. OTHER INCOME
Group Company
2009 09.01.2008to
31.03.208
2009 09.01.2008to
31.03.2009
US$ US$ US$ US$
Foreign exchange gain 199,662 ‐ 140,946 ‐
Interest income 94,160 ‐ 25,508 ‐
Others 6,925 1,569 ‐ ‐
300,747 1,569 166,454 ‐
22. NEGATIVE GOODWILL WRITTEN BACK
In the previous period, negative goodwill written back represented the excess of the fair value of the
subsidiaries net identifiable assets over the cost of acquisition at the date of acquisition as the result of a
bargain purchase.
NOTES TO THE FINANCIAL STATEMENTS FOR THE FINANCIAL YEAR ENDED 31 MARCH 2009 (…CONT’D)

72 | P a g e M o r t i c e L i m i t e d A n n u a l R e p o r t & A c c o u n t s 2 0 0 9
23. SERVICES CONSUMED
Group
2009
09.01.2008to
31.03.2008
US$ US$
Purchases consumed 262,057 15,759
Facility management expenses 679,887 ‐
Bonuses and wages 16,049,971 2,382,398
Contribution to provident funds 1,162,052 176,759
Others 1,030,712 138,678
19,184,679 2,713,594
24. OPERATING EXPENSES
Group Company
2009
09.01.2008to
31.03.2008 2009
09.01.2008to
31.03.2008
US$ US$ US$ US$
Advertisement 11,706 5,172 ‐ ‐
Bad debt written off 134,684 ‐ ‐ ‐
Business promotion and marketing 78,098 ‐ 41,296 ‐
Entertainment 45,315 ‐ ‐ ‐
Fringe benefit expenses 56,384 18,240 ‐ ‐
Insurance 45,886 ‐ 13,954 ‐
Legal and professional fees 376,115 9,443 94,186 2,827
Postage 13,047 ‐ ‐ ‐
Printing and stationery 36,199 7,846 ‐ ‐
Provision for doubtful debts 199,023 14,268 ‐ ‐
Rental 397,490 60,211 ‐ ‐
Repair and maintenance 363,644 27,846 ‐ ‐
Telephone and fax 124,636 14,372 455 ‐
Travelling 508,417 55,605 3,306 ‐
Utilities 26,539 ‐ ‐ ‐
Others 232,675 46,457 42,475 14,798
2,649,858 259,460 195,672 17,625
NOTES TO THE FINANCIAL STATEMENTS FOR THE FINANCIAL YEAR ENDED 31 MARCH 2009 (…CONT’D)

73 | P a g e M o r t i c e L i m i t e d A n n u a l R e p o r t & A c c o u n t s 2 0 0 9
25. FINANCE COSTS
Group
2009
09.01.2008to
31.03.2008
US$ US$
Interest on bank overdraft 13,872 50,970
Interest on term loan 47,562 3,737
Interest on finance lease 20,216 3,423
Interest allocated from a related party 247,829 ‐
Others 78,401 2,203
407,880 60,333
26. (LOSS)/PROFIT BEFORE TAXATION
(Loss)/profit before taxation is arrived at after charging:
Group Company
2009
09.01.2008 to
31.03.2008 2009
09.01.2008to
31.03.2008
US$ US$ US$ US$
Bad debts written off 134,684 ‐ ‐ ‐
Staff Contribution to provident funds 1,162,052 176,579 ‐ ‐
Directors’ remuneration 874,038 156,254 260,668 ‐
Director CPF contributions 1,390 ‐ 1,390 ‐
Director fees 44,704 ‐ 44,704 ‐
Accommodation and office rental 397,456 60,210 ‐ ‐
Rental of office equipment 9,563 3,760 ‐ ‐
27. TAXATION
Group Company
2009
09.01.2008 to
31.03.2008
2009
09.01.2008 to
31.03.2008
US$ US$ US$ US$
Current year taxation:
‐ Singapore taxation ‐ ‐ ‐ ‐
‐ India taxation 234,773 51,965 ‐ ‐
Deferred tax benefit (Note 6) (549,157) (165,870) ‐ ‐
(314,384) (113,905) ‐ ‐

74 | P a g e M o r t i c e L i m i t e d A n n u a l R e p o r t & A c c o u n t s 2 0 0 9
NOTES TO THE FINANCIAL STATEMENTS FOR THE FINANCIAL YEAR ENDED 31 MARCH 2009 (…CONT’D)
27. TAXATION (…CONT’D)
The current year’s income tax benefit varied from the amount of income tax (benefit)/expense determined by
applying the applicable Singapore statutory income tax rate of 17% (2008: 18%) to the (loss)/profit before
income tax as a result of the following differences:
Group Company
2009
09.01.2008 to
31.03.2008
2009
09.01.2008 to
31.03.2008
US$ US$ US$ US$
Accounting (loss)/profit (3,243,861) 518,729 (1,772,233) (17,625)
Income tax (benefit)/expense at applicable rate
(551,456) 93,371
(301,280) (3,173)
Non taxable income ‐ (135,516) ‐ ‐
Non allowable expenses 834,566 11,165 301,280 3,173
Difference in tax rate (584,015) 4,889 ‐ ‐
Accelerated tax depreciation 4,662 1,950 ‐ ‐
Gratuity ‐ (16,720) ‐ ‐
Tax losses carried forward ‐ (41,972) ‐ ‐
Unabsorbed capital allowances ‐ (26,364) ‐ ‐
Others (18,141) (4,708) ‐ ‐
(314,384) (113,905) ‐ ‐
One of the subsidiary companies has unabsorbed tax losses and capital allowances amounting to
approximately US$1,794,000 and US$29,000 (2008: US$233,000 and US$146,000), respectively available for
offsetting against future taxable income of the subsidiaries for the next seven assessment years subject to
conditions imposed by the Indian Income Tax Act.
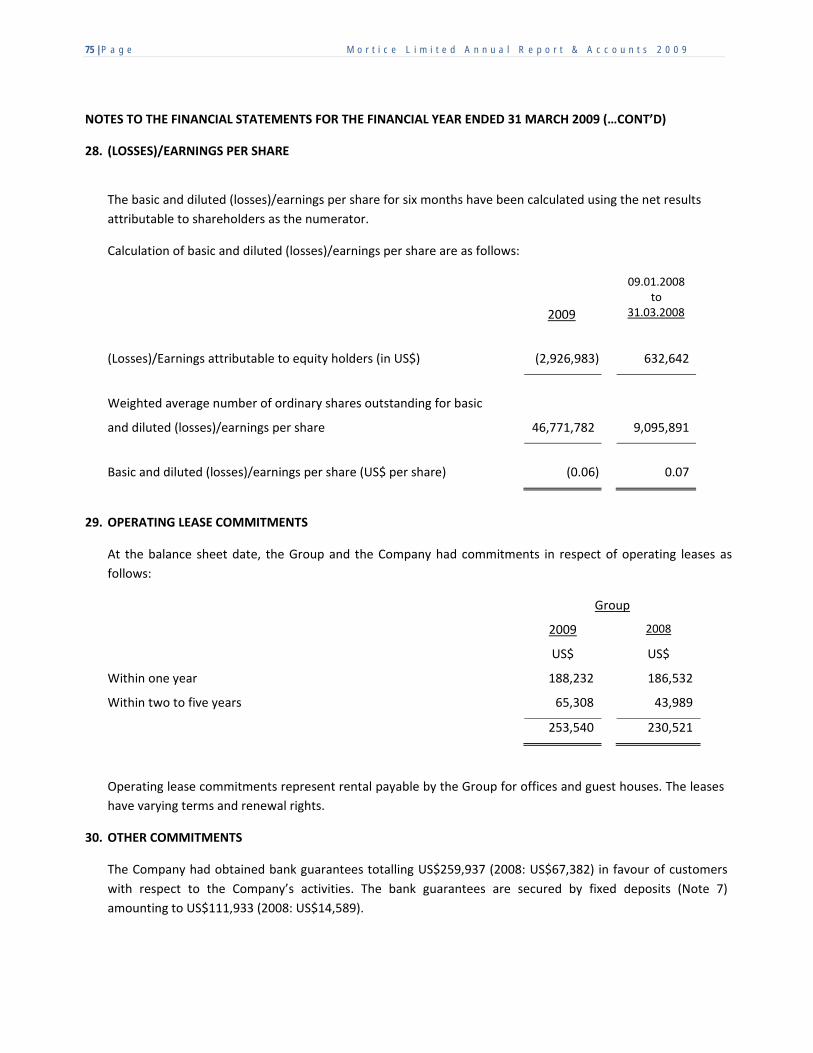
75 | P a g e M o r t i c e L i m i t e d A n n u a l R e p o r t & A c c o u n t s 2 0 0 9
NOTES TO THE FINANCIAL STATEMENTS FOR THE FINANCIAL YEAR ENDED 31 MARCH 2009 (…CONT’D)
28. (LOSSES)/EARNINGS PER SHARE
The basic and diluted (losses)/earnings per share for six months have been calculated using the net results
attributable to shareholders as the numerator.
Calculation of basic and diluted (losses)/earnings per share are as follows:
2009
09.01.2008to
31.03.2008
(Losses)/Earnings attributable to equity holders (in US$) (2,926,983) 632,642
Weighted average number of ordinary shares outstanding for basic
and diluted (losses)/earnings per share
46,771,782
9,095,891
Basic and diluted (losses)/earnings per share (US$ per share) (0.06) 0.07
29. OPERATING LEASE COMMITMENTS
At the balance sheet date, the Group and the Company had commitments in respect of operating leases as
follows:
Group
2009 2008
US$ US$
Within one year 188,232 186,532
Within two to five years 65,308 43,989
253,540 230,521
Operating lease commitments represent rental payable by the Group for offices and guest houses. The leases
have varying terms and renewal rights.
30. OTHER COMMITMENTS
The Company had obtained bank guarantees totalling US$259,937 (2008: US$67,382) in favour of customers
with respect to the Company’s activities. The bank guarantees are secured by fixed deposits (Note 7)
amounting to US$111,933 (2008: US$14,589).

76 | P a g e M o r t i c e L i m i t e d A n n u a l R e p o r t & A c c o u n t s 2 0 0 9
NOTES TO THE FINANCIAL STATEMENTS FOR THE FINANCIAL YEAR ENDED 31 MARCH 2009 (…CONT’D)
31. RELATED PARTY TRANSACTIONS
An entity or individual is considered a related party of the Group for the purpose of the financial statements if:
(i) it possesses the ability (directly or indirectly) to control or exercise significant influence over the
financial and operating decisions of the Group or vice versa; or
(ii) it is subject to common control or common significant influence.
In addition to the information disclosed elsewhere in the financial statements, related party transactions
between the Group and Company and its related parties, the following transactions are the significant related
party transactions entered into by the Company and the Group on terms agreed between the parties:
Group
2009
09.01.2008to
31.03.2008
US$ US$
Rent paid to related party 200,110 ‐
Repayments of loan from related parties 1,166,040 ‐
Receipts of loan to related parties 53,961 1,063,489
Advances from related parties 40,973 ‐
Advances to related parties 666,687 54,426
Assets purchased from a shareholder ‐ 5,629
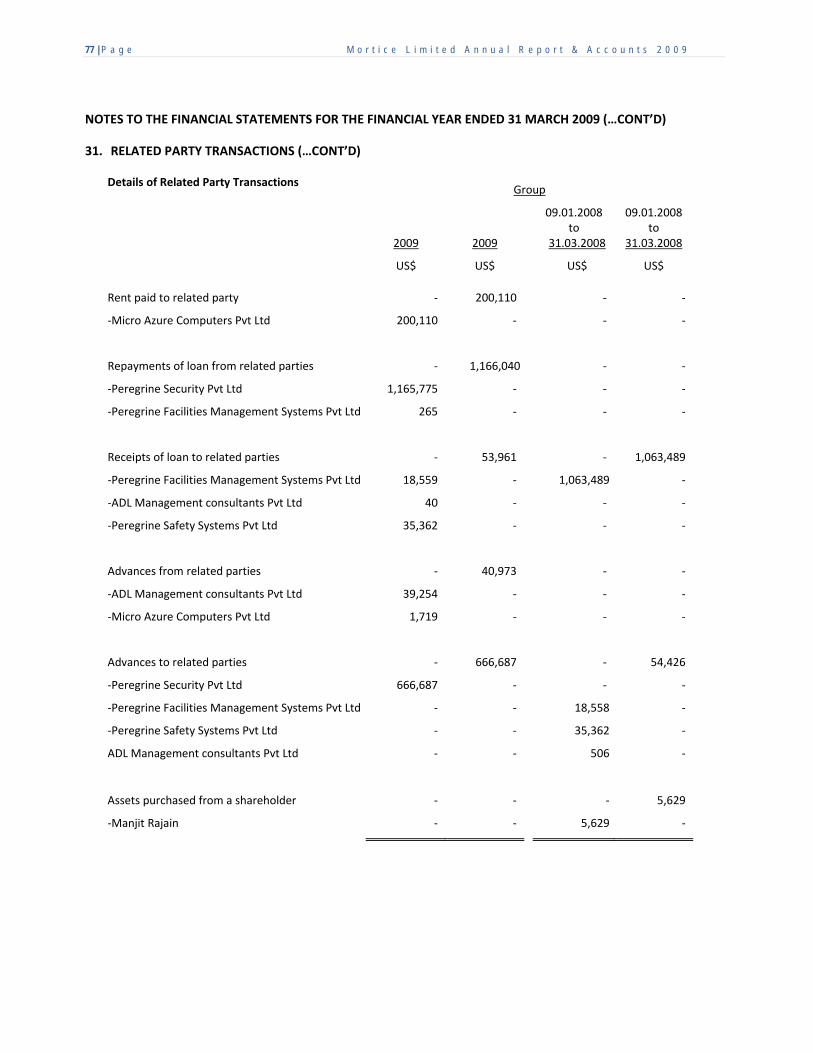
77 | P a g e M o r t i c e L i m i t e d A n n u a l R e p o r t & A c c o u n t s 2 0 0 9
NOTES TO THE FINANCIAL STATEMENTS FOR THE FINANCIAL YEAR ENDED 31 MARCH 2009 (…CONT’D)
31. RELATED PARTY TRANSACTIONS (…CONT’D)
Details of Related Party Transactions Group
2009
2009
09.01.2008 to
31.03.2008
09.01.2008to
31.03.2008
US$ US$ US$ US$
Rent paid to related party ‐ 200,110 ‐ ‐
‐Micro Azure Computers Pvt Ltd 200,110 ‐ ‐ ‐
Repayments of loan from related parties ‐ 1,166,040 ‐ ‐
‐Peregrine Security Pvt Ltd 1,165,775 ‐ ‐ ‐
‐Peregrine Facilities Management Systems Pvt Ltd 265 ‐ ‐ ‐
Receipts of loan to related parties ‐ 53,961 ‐ 1,063,489
‐Peregrine Facilities Management Systems Pvt Ltd 18,559 ‐ 1,063,489 ‐
‐ADL Management consultants Pvt Ltd 40 ‐ ‐ ‐
‐Peregrine Safety Systems Pvt Ltd 35,362 ‐ ‐ ‐
Advances from related parties ‐ 40,973 ‐ ‐
‐ADL Management consultants Pvt Ltd 39,254 ‐ ‐ ‐
‐Micro Azure Computers Pvt Ltd 1,719 ‐ ‐ ‐
Advances to related parties ‐ 666,687 ‐ 54,426
‐Peregrine Security Pvt Ltd 666,687 ‐ ‐ ‐
‐Peregrine Facilities Management Systems Pvt Ltd ‐ ‐ 18,558 ‐
‐Peregrine Safety Systems Pvt Ltd ‐ ‐ 35,362 ‐
ADL Management consultants Pvt Ltd ‐ ‐ 506 ‐
Assets purchased from a shareholder ‐ ‐ ‐ 5,629
‐Manjit Rajain ‐ ‐ 5,629 ‐

78 | P a g e M o r t i c e L i m i t e d A n n u a l R e p o r t & A c c o u n t s 2 0 0 9
NOTES TO THE FINANCIAL STATEMENTS FOR THE FINANCIAL YEAR ENDED 31 MARCH 2009 (…CONT’D)
31. RELATED PARTY TRANSACTIONS (…CONT’D)
Compensation of directors and key management personnel
The remuneration of directors and other members of key management of the Group during the financial
year/period are as follows:
Group
2009
09.01.2008to
31.03.2008
US$ US$
Short‐term benefits 874,038 156,254
32. IMMEDIATE AND ULTIMATE HOLDING COMPANY
The Company’s immediate and ultimate holding Company is Mancom Holdings Limited, a Company
incorporated in the British Virgin Islands.
33. FINANCIAL RISK AND CAPITAL RISK MANAGEMENT
a) Liquidity risk
Prudent liquidity risk management implies maintaining sufficient cash and marketable securities, the
availability of funding through an adequate amount of committed credit facilities. Due to the dynamic
nature of the underlying businesses, the Group aims to maintain flexibility in funding by keeping
committed credit lines available. Group’s financial liabilities which give rise to liquidity risk have been
summarised below:
Due within 6 months
Due in 6 to 12 months
Due in
1 to 5 years
US$ US$ US$
2009
Trade payables 399,627 ‐ ‐
Other payables 2,733,403 ‐ ‐
Borrowings 42,102 48,116 151,820
Finance lease 29,348 31,412 78,812
3,204,480 79,528 230,632
2008
Trade payables 1,357,639 32,821 ‐
Other payables 2,672,873 ‐ ‐
Borrowings 322,367 46,685 237,883
Finance lease 20,804 22,225 97,271
4,373,683 101,731 335,154

79 | P a g e M o r t i c e L i m i t e d A n n u a l R e p o r t & A c c o u n t s 2 0 0 9
NOTES TO THE FINANCIAL STATEMENTS FOR THE FINANCIAL YEAR ENDED 31 MARCH 2009 (…CONT’D)
33. FINANCIAL RISK AND CAPITAL RISK MANAGEMENT (…CONT’D)
b) Foreign currency risk
The Group is not exposed to currency translation risk as almost all of its transactions are denominated
in Indian rupees except for certain transactions in United States dollars and Pound Sterling.
c) Credit risk
Credit risk is managed through adopting the policy of dealing only with customers having an
appropriate credit history and the application of monitoring procedures. The carrying amount of each
financial asset in the balance sheet represents the Group’s maximum exposure to credit risk. The
Company has no significant concentrations of credit risk with any single customer.
The credit risk for trade receivables is mainly concentrated in India and the ageing analysis for the trade receivables of the Group and the Company as at year end are as follows:
Group
2009 2008
US$ US$
Due less than 3 months 3,893,786 3,032,059
Due between 3 – 6 months 339,952 200,551
Due between 6 – 12 months 208,759 351,921
Due more than 12 monhts 188,500 105,798
4,630,997 3,690,329
d) Interest rate risk
The Group’s exposure to market risk for changes in interest rates is disclosed in notes 9, 15 and 16 to
the financial statements.
e) Fair values
The carrying amounts of cash and cash equivalents, trade and other receivables, related party balances,
trade and other payables, current portion of finance lease and borrowings approximate their fair values
due to their short‐term nature.

80 | P a g e M o r t i c e L i m i t e d A n n u a l R e p o r t & A c c o u n t s 2 0 0 9
NOTES TO THE FINANCIAL STATEMENTS FOR THE FINANCIAL YEAR ENDED 31 MARCH 2009 (…CONT’D)
33. FINANCIAL RISK AND CAPITAL RISK MANAGEMENT (…CONT’D)
f) Capital risk
The Group’s objectives when managing capital are: to safeguard the Group and the Company’s ability
to continue as a going concern, so that it can continue to provide returns for shareholders and benefits
for other stakeholders, and to provide an adequate return to shareholders by pricing products and
services commensurately with the level of risk. The management sets the amount of capital in
proportion to risk. The management manages the capital structure and makes adjustments to it in the
light of changes in economic conditions and the risk characteristics of the underlying assets. The board
of directors monitors the Group’s capital based on net debt and total capital. Net debt is calculated as
trade payables, other payables, finance lease, bank overdraft, retirement benefit obligations and
borrowings less cash and bank balances. Total capital is calculated as equity plus net debt.
Group Company
2009 2008 2009 2008
US$ US$ US$ US$
Net debt 1,627,909 4,713,453 (907,247) 563,514
Total equity 6,184,722 1,019,856 7,765,454 382,376
Total capital 7,812,631 5,733,309 6,858,207 945,890
The Company is not subject to externally imposed capital requirements.
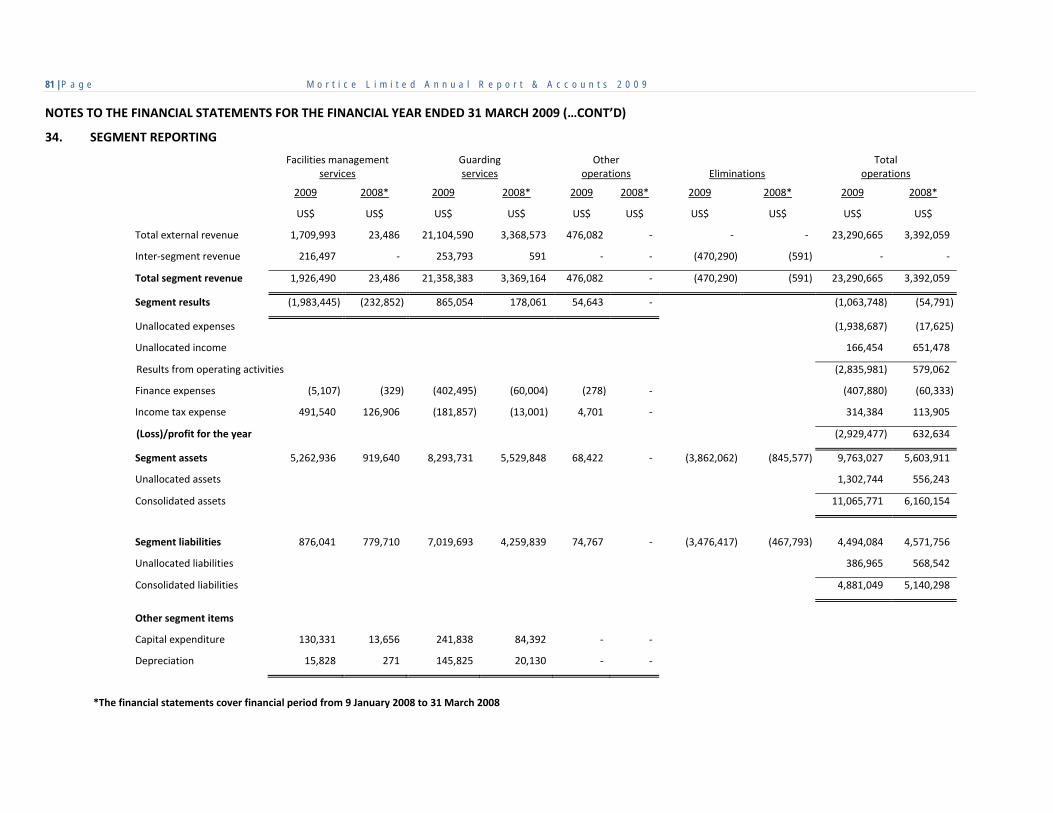
81 | P a g e M o r t i c e L i m i t e d A n n u a l R e p o r t & A c c o u n t s 2 0 0 9 NOTES TO THE FINANCIAL STATEMENTS FOR THE FINANCIAL YEAR ENDED 31 MARCH 2009 (…CONT’D)
34. SEGMENT REPORTING
Facilities management services
Guardingservices
Other operations Eliminations
Totaloperations
2009 2008* 2009 2008* 2009 2008* 2009 2008* 2009 2008*
US$ US$ US$ US$ US$ US$ US$ US$ US$ US$
Total external revenue 1,709,993 23,486 21,104,590 3,368,573 476,082 ‐ ‐ ‐ 23,290,665 3,392,059
Inter‐segment revenue 216,497 ‐ 253,793 591 ‐ ‐ (470,290) (591) ‐ ‐
Total segment revenue 1,926,490 23,486 21,358,383 3,369,164 476,082 ‐ (470,290) (591) 23,290,665 3,392,059
Segment results (1,983,445) (232,852) 865,054 178,061 54,643 ‐ (1,063,748) (54,791)
Unallocated expenses (1,938,687) (17,625)
Unallocated income 166,454 651,478
Results from operating activities (2,835,981) 579,062
Finance expenses (5,107) (329) (402,495) (60,004) (278) ‐ (407,880) (60,333)
Income tax expense 491,540 126,906 (181,857) (13,001) 4,701 ‐ 314,384 113,905
(Loss)/profit for the year (2,929,477) 632,634
Segment assets 5,262,936 919,640 8,293,731 5,529,848 68,422 ‐ (3,862,062) (845,577) 9,763,027 5,603,911
Unallocated assets 1,302,744 556,243
Consolidated assets 11,065,771 6,160,154
Segment liabilities 876,041 779,710 7,019,693 4,259,839 74,767 ‐ (3,476,417) (467,793) 4,494,084 4,571,756
Unallocated liabilities 386,965 568,542
Consolidated liabilities 4,881,049 5,140,298
Other segment items
Capital expenditure 130,331 13,656 241,838 84,392 ‐ ‐
Depreciation 15,828 271 145,825 20,130 ‐ ‐
*The financial statements cover financial period from 9 January 2008 to 31 March 2008

82 | P a g e M o r t i c e L i m i t e d A n n u a l R e p o r t & A c c o u n t s 2 0 0 9
NOTES TO THE FINANCIAL STATEMENTS FOR THE FINANCIAL YEAR ENDED 31 MARCH 2009 (…CONT’D)
35. SHARE BASED EMPLOYEE REMUNERATION
The Board of Directors of the Company resolved on 14 July 2009 to cancel the share options
scheme with retrospective effect.
36. SUBSEQUENT EVENTS
On 22 June 2009, Tenon Property Services Pvt Ltd acquired 100% shares in Rotopower Project Pvt
Ltd (Rotopower), a Company incorporated in India. Rotopower Project Pvt Ltd is engaged in the
business of mechanical and engineering maintenance, housekeeping and also providing services to
telecom tower companies at the tower sites for the maintenance and running of the electrical
equipments etc.
Tenon Property Services Pvt Ltd acquired 21,500 shares of Rotopower for a consideration of INR
100 million (US$1.9 million). The acquisition was made by Tenon Property Services Pvt Ltd out of
the funds raised from the listing on AIM. In settlement for the acquisition, the Tenon Property
Services Pvt Ltd made an upfront payment of INR 85 million (US$1.6 million). Further, as a part of
deal structure, the Company is entitled to be indemnified by the selling shareholders (Indemnifier)
towards contingencies and representations and warranties listed in the Share purchase agreement.
The balance purchase consideration of INR 15 million (US$0.3 million) will be paid after 2 years
from the date of closing.
37. COMPARATIVE FIGURES
The financial statements for the year ended 31 March 2009 cover the financial period from 1 April
2008 to 31 March 2009 while the previous financial statements cover the financial period from 9
January 2008 to 31 March 2008. Hence, the income statement, changes in equity, cash flows and
related notes are not comparable.


Mortice Limited 36 Robinson Road #10‐01 City House Singapore 068877 www.morticegroup.com
Tenon Property Services Private Limited 101‐201, Santa Monica 2/C & 2/C‐1, Hayes Road Bangalore – 560025 Karnatka, India Tenon Support Services Private Limited Plot Number 13, Sector 18, Electronic City, Gurgaon – 122015 Haryana, India Tenon Project Services Private Limited Plot Number 13, Sector 18, Electronic City, Gurgaon – 122015 Haryana, India
www.tenonservices.com
Peregrine Guarding Private Limited RZ – 1B, Kapashera Crossing, New Delhi – 110037 India www.peregrineguarding.com
Roto Power Projects Private Limited C‐46, Sector 2, NOIDA India
www.rotopower.in