1 north central river forecast center: an overview of operations and mission wisconsin river...
TRANSCRIPT

1
North Central North Central River Forecast Center:River Forecast Center:
An Overview of Operations and An Overview of Operations and MissionMission
Wisconsin River Post-Flood Meeting
November 16, 2010

OutlineOutline
• NCRFC Mission and Products
• Forecast process– Meteorological driving data– Hydrologic model
• Daily Analysis• Calibration
• September 2010 Forecasts
• NWS Products
2
3
NOAA Integrated Water NOAA Integrated Water Resource ServicesResource Services
This initiative will develop and deliver valued water resources forecasts to
save lives and properties, manage water resources, and enhance America’s
economy. Some of the benefits will apply to:
•Irrigation
•Power Generation
•River Commerce
•Protection of threatened and endangered species
•Enhanced aquatic habitats
•Balanced terrestrial/aquatic watershed management
4
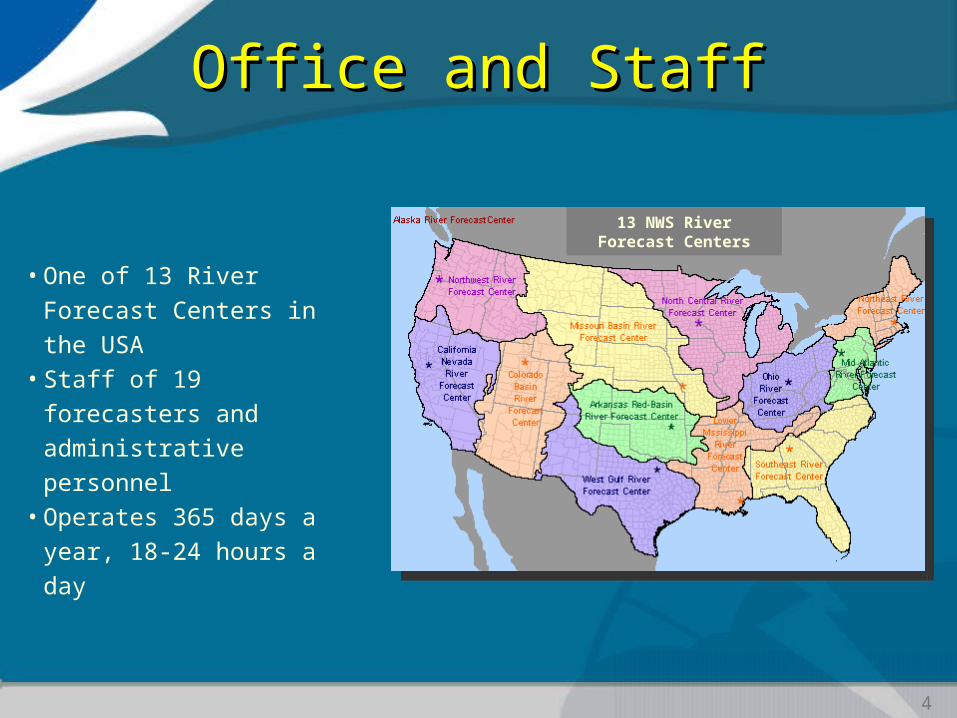
Office and StaffOffice and Staff
13 NWS River Forecast Centers
•One of 13 River Forecast Centers in the USA
•Staff of 19 forecasters and administrative personnel
•Operates 365 days a year, 18-24 hours a day

5
Area of ResponsibilityArea of Responsibility
•1117 sub-watersheds (155 in Wisconsin)
•33 forecast groups•3 Major Basins
•Mississippi River•Great Lakes•Hudson Bay

6
Forecast ServicesForecast Services
Water Quality Support

7
Flash Flood GuidanceFlash Flood Guidance

8
Forecast HydrographForecast Hydrograph

9
Long Range Probabilistic ProductsLong Range Probabilistic Products

OutlineOutline
• NCRFC Mission and Products
• Forecast process– Meteorological dataMeteorological data– Hydrologic model
• Daily Analysis• Calibration
• Ideas for Runoff Risk Mapping Project
10

PrecipitationPrecipitationSurface observationsSurface observations
12
• Hourly to daily accumulationsHourly to daily accumulations• Manual and automated observersManual and automated observers• Quality controlledQuality controlled
Point precipitation Mean areal precipitation
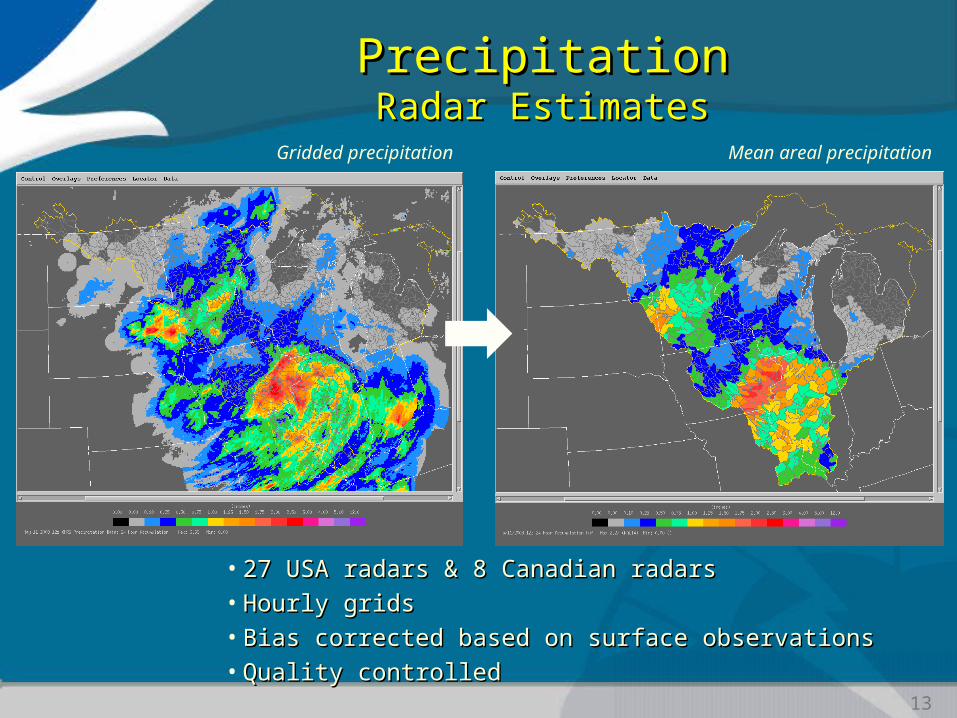
PrecipitationPrecipitationRadar EstimatesRadar Estimates
13
Gridded precipitation Mean areal precipitation
• 27 USA radars & 8 Canadian radars27 USA radars & 8 Canadian radars• Hourly gridsHourly grids• Bias corrected based on surface observationsBias corrected based on surface observations• Quality controlledQuality controlled

PrecipitationPrecipitationForecastForecast
14
• GriddedGridded• 6-hour accumulation6-hour accumulation• 5 days available5 days available

Air TemperatureAir TemperatureObserved & ForecastObserved & Forecast
15
• Daily max/minDaily max/min• 7 days available7 days available• Soon will be griddedSoon will be gridded

OutlineOutline
• NCRFC Mission and Products
• Forecast process– Meteorological data– Hydrologic model Hydrologic model
• Daily Analysis• Calibration
• Ideas for Runoff Risk Mapping Project
16

17
Hydrologic ModelHydrologic Model
• NWSRFS – National NWSRFS – National Weather Service River Weather Service River Forecast SystemForecast System
• Several models are run Several models are run for each sub-watershedfor each sub-watershed– Snow accumulation & Snow accumulation &
meltmelt– Soil moisture & runoffSoil moisture & runoff– River routingRiver routing– ReservoirsReservoirs

Model SchematicsModel Schematics
18
Snow Model
Soil Moisture/Runoff Model
19
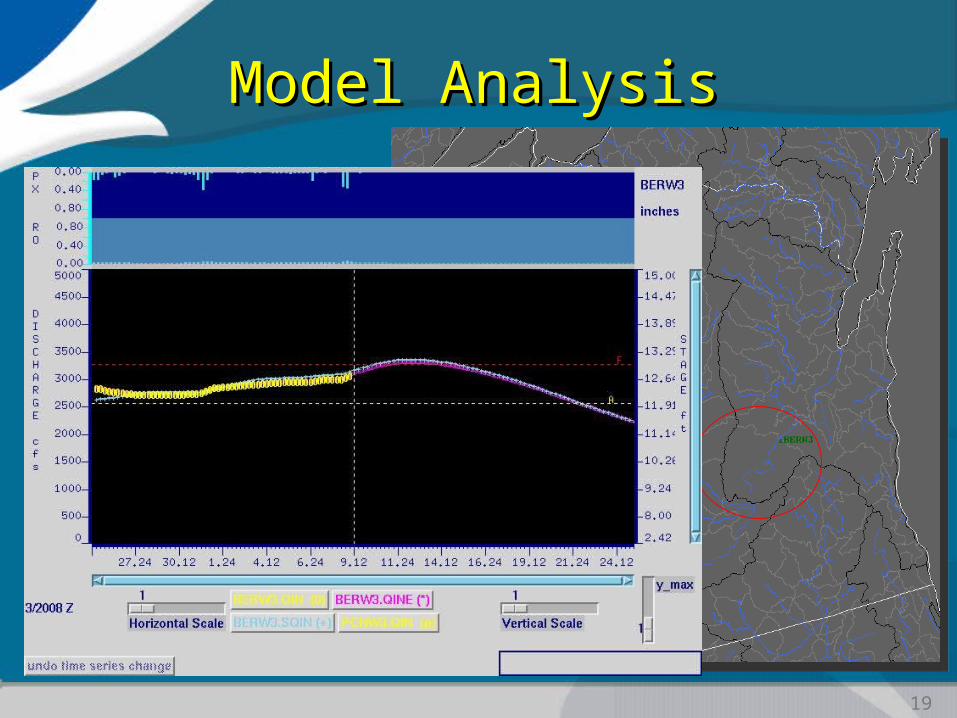
Model AnalysisModel Analysis

20
Model AnalysisModel Analysis
• Forecaster can modifyForecaster can modify– Precipitation typePrecipitation type– Amount and areal extent of Amount and areal extent of
snow coversnow cover– Melt rateMelt rate

21
Model AnalysisModel Analysis
• Forecaster can modifyForecaster can modify– Amount of water in any of Amount of water in any of
the conceptual storagesthe conceptual storages– Frost indexFrost index– Amount of rain/meltAmount of rain/melt– Amount of runoffAmount of runoff

Model AnalysisModel Analysis
• Models are analyzed and adjusted on a daily basis.
• Goal: to accurately simulate streamflow while maintaining reasonable model states.
• Only make adjustments when necessary and justified.
22
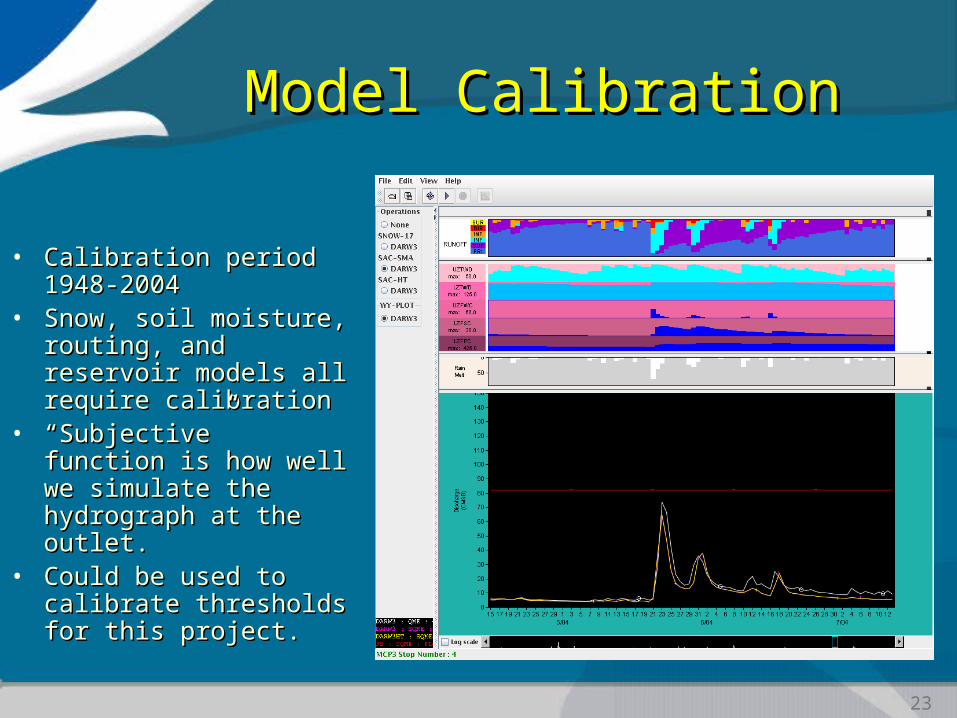
Model CalibrationModel Calibration
23
• Calibration period Calibration period 1948-20041948-2004
• Snow, soil moisture, Snow, soil moisture, routing, and reservoir routing, and reservoir models all require models all require calibrationcalibration
• ““Subjective” function Subjective” function is how well we is how well we simulate the simulate the hydrograph at the hydrograph at the outlet.outlet.
• Could be used to Could be used to calibrate thresholds calibrate thresholds for this project.for this project.

24
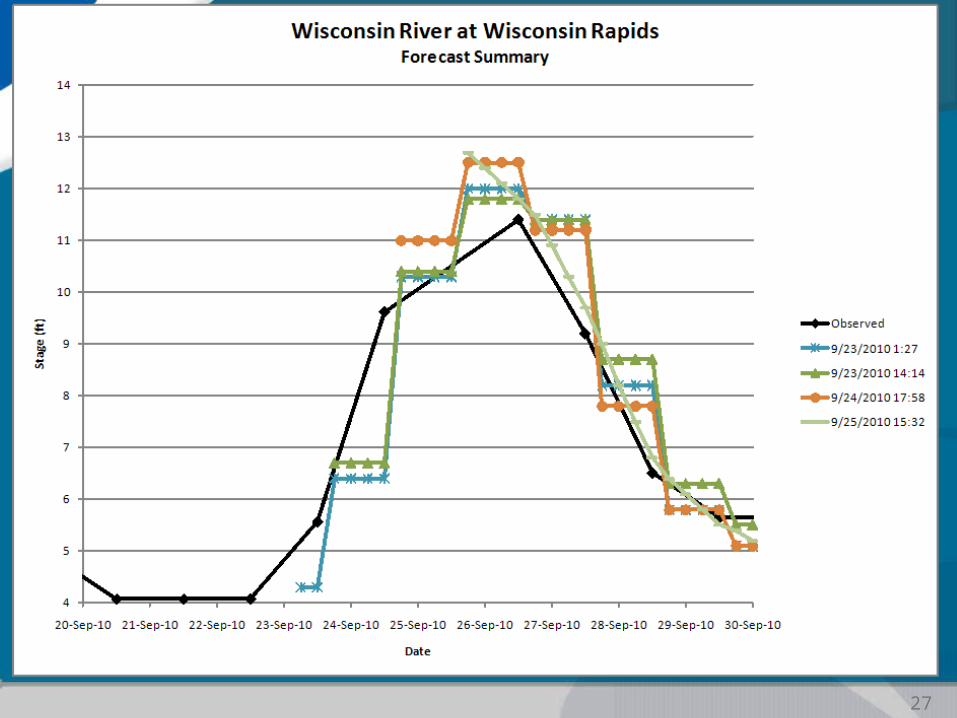
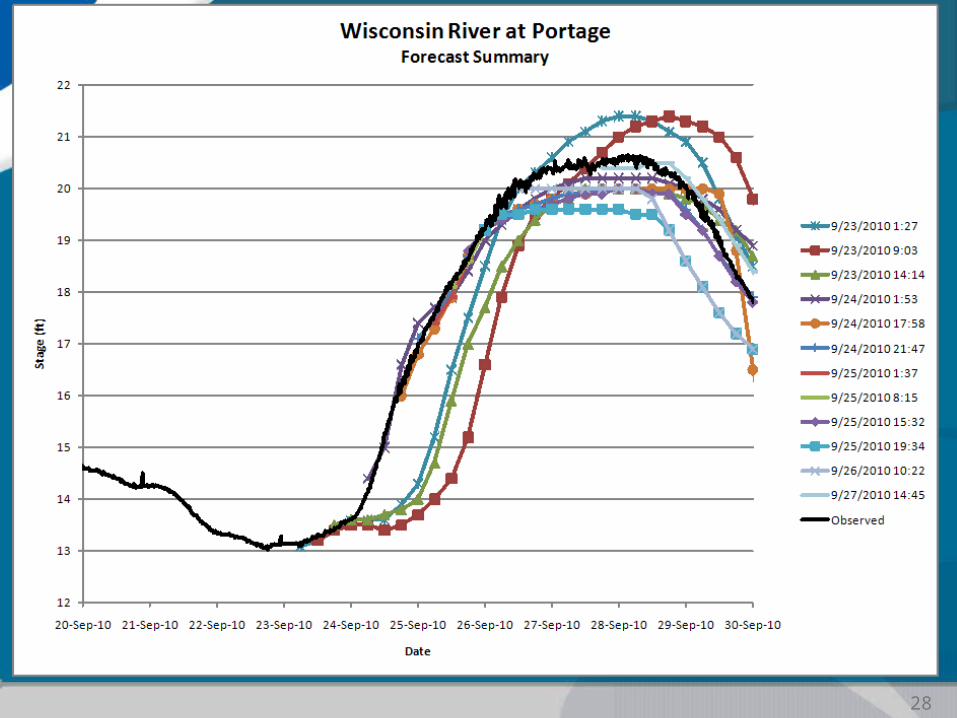
How did we do last How did we do last September?September?
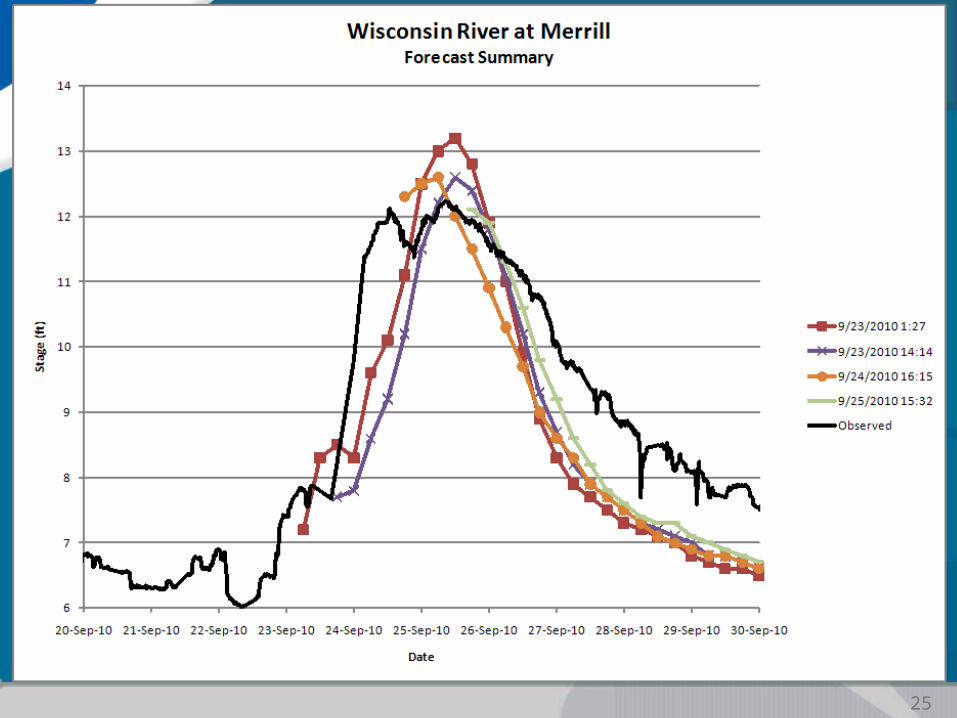
25

26
27
28

29

How will I know when high How will I know when high water is coming?water is coming?
30
http://water.weather.gov/ahps/

Long Range OutlooksLong Range Outlooks
31
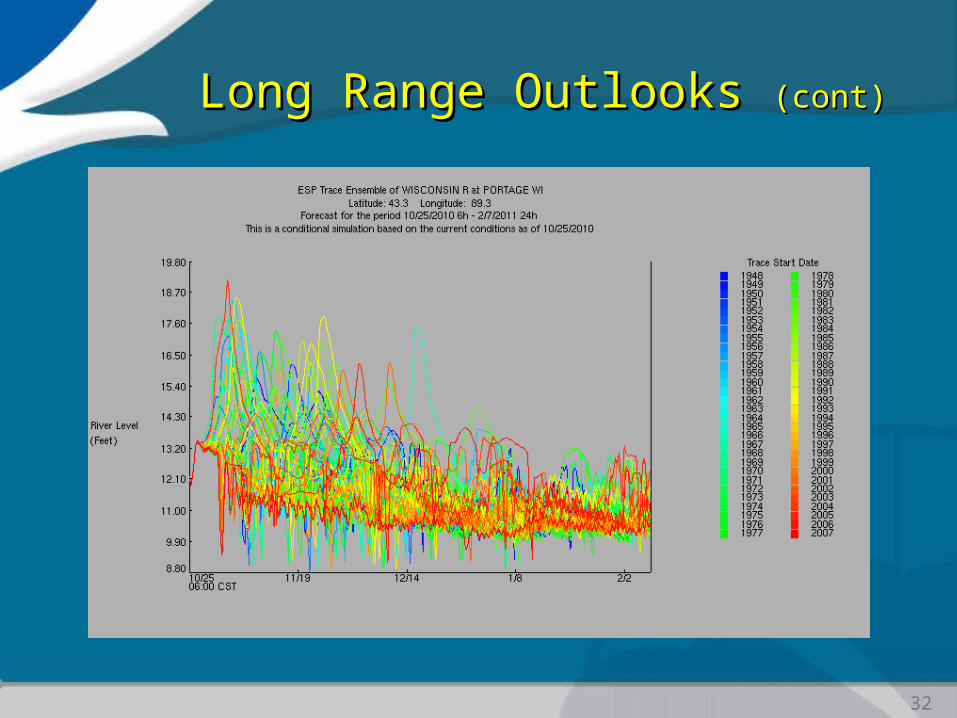
Long Range Outlooks Long Range Outlooks (cont)(cont)
32
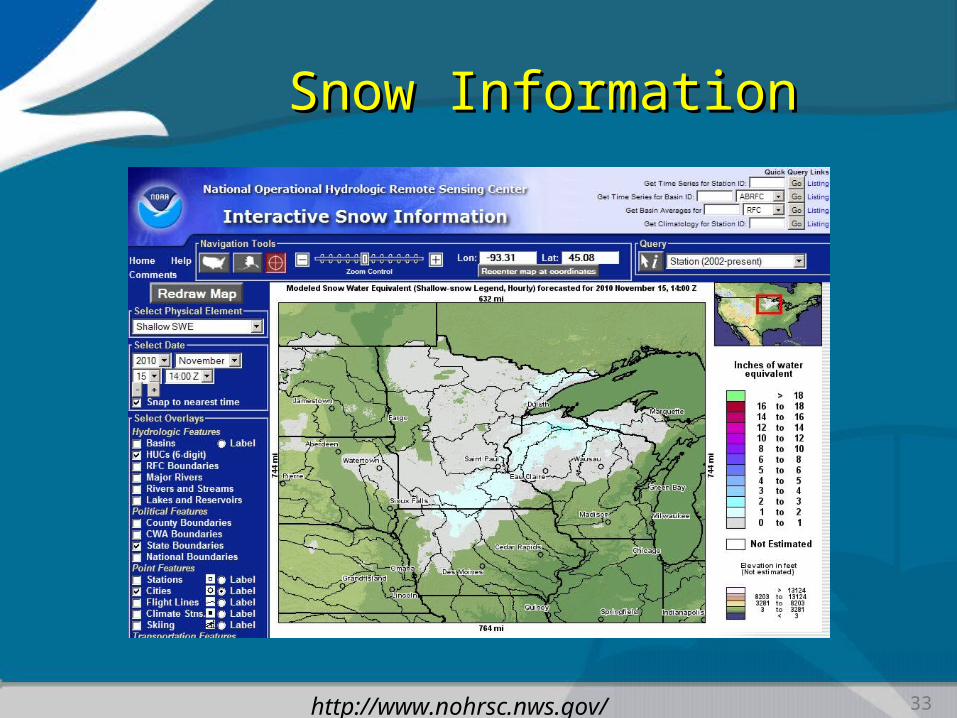
Snow InformationSnow Information
33http://www.nohrsc.nws.gov/
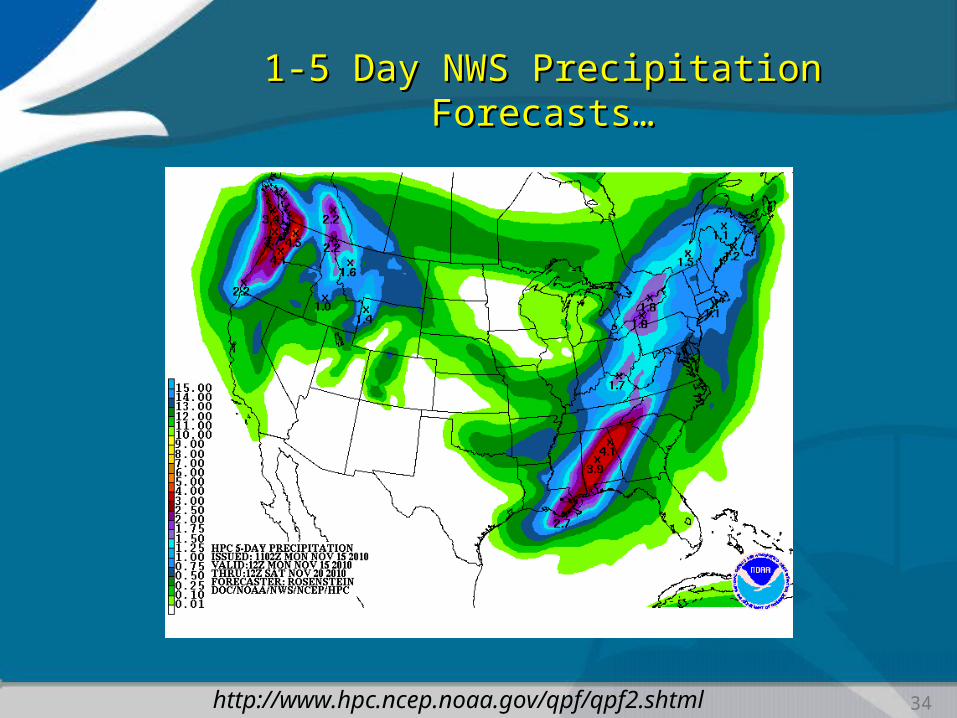
1-5 Day NWS Precipitation Forecasts…1-5 Day NWS Precipitation Forecasts…
34http://www.hpc.ncep.noaa.gov/qpf/qpf2.shtml

River ForecastsRiver Forecasts
35http://water.weather.gov/ahps/

http://www.crh.noaa.gov/ncrfc/content/water/fop.phphttp://www.crh.noaa.gov/ncrfc/content/water/fop.php
36

Specialized Products…Specialized Products…QPF EnsemblesQPF Ensembles
37

Specialized Products…Specialized Products…Flow ForecastsFlow Forecasts
: This product contains preliminary data that may be subject to revision.: Refer to your local WFO for the latest official river forecast.:: North Central River Forecast Center, Chanhassen, MN:: Mon Nov 15 15:41:00 2010:: Wolf R New London Adj Flood Stage ft.E NEWW3 1114 Z DH18/DC1115/QRIP/DIH06 : 6-Hour Observed Flows (Kcfs).E1 2.025/ 2.015/ 2.000/ 2.010/.E NEWW3 1115 Z DH18/DC1115/QRICB/DIH06 : 6-Hour Forecast Flows (Kcfs).E1 2.029/ 2.061/ 2.116/ 2.196/ 2.275/ 2.338/ 2.397/ 2.452/.E1 2.494/ 2.529/ 2.558/ 2.580/ 2.597/ 2.611/ 2.622/ 2.629/.E1 2.633/ 2.628/ 2.610/ 2.584/ 2.555/ 2.524/ 2.493/ 2.461/.E1 2.430/ 2.400/ 2.371/ 2.343/:: Little Wolf R Royalton Adj Flood Stage ft.E ROYW3 1114 Z DH18/DC1115/QRIP/DIH06 : 6-Hour Observed Flows (Kcfs).E1 0.485/ 0.485/ 0.572/ 0.606/.E ROYW3 1115 Z DH18/DC1115/QRICB/DIH06 : 6-Hour Forecast Flows (Kcfs).E1 0.640/ 0.666/ 0.684/ 0.692/ 0.693/ 0.686/ 0.672/ 0.653/.E1 0.630/ 0.603/ 0.573/ 0.541/ 0.512/ 0.483/ 0.456/ 0.432/.E1 0.413/ 0.398/ 0.386/ 0.376/ 0.367/ 0.360/ 0.354/ 0.348/.E1 0.343/ 0.338/ 0.334/ 0.330/
38

Specialized Products…Specialized Products…Objective ProductsObjective Products
39

Specialized Products…Specialized Products…Inundation MappingInundation Mapping
40

Questions?Questions?
NWS/North Central River Forecast Center
952-368-2540
952-368-2545
41