1 new methodology for estimating pcu on …docs.trb.org/prp/17-03248.pdf1 new methodology for...
TRANSCRIPT

NEW METHODOLOGY FOR ESTIMATING PCU ON MULTI LANE URBAN ROADS 1
UNDER MIXED TRAFFIC SCENARIO BASED ON AREA OCCUPANCY 2
3
4
Pallav Kumar 5
Research Scholar 6
Transportation Engineering and Planning Section, 7
Civil Engineering Department, 8
Sardar Vallabhbhai National Institute of Technology (SVNIT), 9
Surat, Gujrat-395007 10
Email id: [email protected] 11
12
Shriniwas S. Arkatkar* 13
Assistant Professor, 14
Transportation Engineering and Planning Section, 15
Civil Engineering Department, 16
SVNIT-Surat, Gujrat-395007 17
Email: [email protected] 18
19
Gaurang J. Joshi 20
Associate Professor, 21
Transportation Engineering and Planning Section, 22
Civil Engineering Department, 23
SVNIT-Surat, Gujrat-395007 24
Email id: [email protected] 25
26
Ashish Dhamaniya 27
Assistant Professor, 28
Transportation Engineering and Planning Section, 29
Civil Engineering Department, 30
SVNIT-Surat, Gujrat-395007 31
Email:[email protected] 32
33
34
No of words: Text: 4858 words + (11 TABLES /FIGURES) = 7608words 35
36
37
Submission Date: 15th November 2016 38
39
40
*Corresponding Author 41
42
43
44
45
46
47
48

Kumar, Arkatkar, Joshi, Dhamaniya 2
NEW METHODOLOGY FOR ESTIMATING PCU ON MULTI LANE URBAN ROADS 1
UNDER MIXED TRAFFIC SCENARIO BASED ON AREA OCCUPANCY 2
3
ABSTRACT 4
This research presents a new methodology of PCU estimation using area occupancy as measure, 5
particulary for heterogeneous and non-lane based traffic prevailing on multilane urban roads, 6
especially under Asian specific conditions. The methodology presented here can also be applied to 7
lane based traffic using time occupancy as measure of PCU estimation. In view of studying PCU 8
values for non-lane based heterogeneous traffic scenario, two mid-block study sections on multi-9
lane urban roads in Indian city: Delhi (eight-lane divided carriageway) and Mumbai (ten-lane 10
divided carriageway) were identified. A novel approach of matrix-solution to area-occupancy 11
based simultaneous equations provides simplified but yet unique/optimized PCU values for 12
different vehicle classes considering prevailing roadway and traffic conditions. It is found that 13
increase in number of lanes or carriageway width has significant increasing effect on PCU values 14
of vehicle categories. Further, the mixed-traffic flow expressed in PCU/hour/direction is validated 15
with base-traffic flow under varying traffic-flow conditions. Mean Absolute Percentage Error 16
(MAPE) after comparison was found to be 8 % and 9% for Delhi and Mumbai road sections, 17
respectively, thereby indicating the robustness of the developed concept. For examining the 18
accuracy of the proposed method at, speed-flow relationships are developed and compared on 19
same set of axes using: (i) proposed unique (or optimized) PCU; (ii) dynamic PCU values (using 20
most accepted speed-area ratio concept) and; (iii) PCU values from IRC-106, at 5-minute interval 21
aggregation level. The comparison shows the difference of 2.0% and 1.3% at capacity level for 22
Delhi and Mumbai sections, respectively for optimized and dynamic PCU concept. This further 23
validates the reliability of proposed simplified yet vigorous methodology of PCU estimation as 24
well as unique set of PCU values in comparison to other established method. PCU values in IRC-25
106 resulted in underestimation of capacity for ten-lane divided section but were consistent for 26
eight lane divided section. This is due to the fact that same set of PCU values given in the IRC 27
guideline, irrespective of carriageway width may not provide the accurate results. 28
29
Keywords: PCU, Multi-lane Urban Road, Heterogeneous Traffic, Matrix Solution 30
31
Kumar, Arkatkar, Joshi, Dhamaniya 3
INTRODUCTION 1
Traffic flow on multi-lane urban roads in India are designed for high-speed movement, but, 2
heterogeneity in traffic, non-lane based movement and frequent access provided from service-lane, 3
result in reduction of speed of vehicles and hence, also in traffic-stream speed on such roadway 4
facilities. Dominance of car traffic, with grade separators at the location of intersection coupled 5
with higher design speeds makes it (multilane-urban roads) significantly different from the urban 6
arterial roads. This study is focused on PCU estimation on multilane urban road particularly under 7
heterogeneous traffic conditions prevailing in Asian countries like India. PCU is a metric unit of 8
conversion used to translate traffic flow in terms of vehicles/hour to equivalent passenger cars/hour. 9
The concept of “Passenger car equivalent” has its inception since development of HCM 1965 (1). 10
The HCM defines the concept as “the number of passenger cars displaced in the traffic flow by a 11
truck or a bus, under the prevailing roadway and traffic conditions”. Previously, Highway Capacity 12
Manual HCM, 1950 (2) suggested a factor of 2.0 to incorporate the impact of heavy vehicles on 13
traffic stream on multi-lane highways before HCM 1965 manual (2). In the recent versions of 14
HCM (2000, 2010), PCE factors are used in the determination of heavy vehicle adjustment factors. 15
However, HCM derived PCU values are based on relatively homogeneous traffic in US where 16
traffic comprises mostly passenger cars with a small portion of heavy vehicles, and traffic in each 17
lane behaves in fairly similar ways due to heavy vehicles being evenly spread across the lanes. 18
Such traffic conditions cannot be assumed in most Asian countries where traffic is much more 19
heterogeneous. Hence, location-specific PCE factors should be established to suit local 20
applications. In this context, the present study is focused on deriving PCU values for the non-lane 21
based heterogeneous traffic condition prevailing on multilane urban roadways in Asian specific 22
conditions. 23
Since the year 1965 onwards, a number of studies have been conducted on various 24
approaches for estimating PCU values. These methods used a number of performance measures 25
for PCU estimation. The measure of performance used for PCU estimation in past studies are as 26
follows: (i) Headway (Werner and Morrall, 1976 (3), Seguin et al. 1982 (4),Cunagin and Chang, 27
1982 (5)) (ii) Delay(Craus et al., 1980 (6), Cunagin and Messer, 1983 (7), Zhao, 1998(8)) (iii) 28
Platoon Formation (Aerde and Yagar, 1983) (9) (iv) Travel time (Keller and Saklas, 1984) (10) 29
(v) Speed (Van Aerde and Yagar, 1983 (9), Elefteriadou,1997 (11), Chandra and Sikdar, 2000 30
(12), Rahman and Nakamura, 2005 (13), Arasan and Arkatkar, 2010 (14) (vi) Vehicle hours 31
(Sunner et. al., 1984) (15) (vii) Density (John and Glauz, 1976) (16) (viii) Queue Discharge Flow 32
(Al-Kaisy et. al (2002,2005) (17, 18). (ix) HCM Method (Benekohal and Zhao, 2006) (19). 33
Moreover, some of the studies conducted very recently on PCU follows. Skabardonis et al. (20) 34
derived a methodology to determine improved PCE factors for trucks at signalized intersections 35
using field data and simulation. It is suggested from the study that PCE is very sensitive to the 36
proportion of truck, truck type and intersection approach grade and hence a single value of PCE 37
suggested by HCM (21) need to be modified with new combined heavy vehicle and grade 38
adjustment factors. Dhamaniya and Chandra (2015) (22) studied PCU on urban arterial. In this 39
study, simultaneous equations were developed to determine speed of a vehicle type from 40
information of traffic volume and traffic composition. These equations are used to depict variation 41
in PCU with traffic volume and its composition on a road. Preethi and Ashalata (2016) (23) 42
estimated dynamic PCU using area occupancy concept at signalized intersection. The study 43
facilitated easy and quick estimation of dynamic PCU values, based on mathematical models 44
incorporating the effect of traffic composition and saturation flow. Ozkul and Washburn (2013) 45
(24) aslo studied effect of heavy vehicles on freeways and multilane highways extensively. 46
However, Krammes and Crowley (1986) (25) suggested that the measure for estimation 47

Kumar, Arkatkar, Joshi, Dhamaniya 4
of PCE values should be same as that used to define level of service. The reason for this could be 1
that the measure, which determines the operational performance of a facility are the one which 2
could express the impedance due to presence of other vehicle categories in the traffic stream. 3
According to HCM (2010), (21) density is considered as measure of effectiveness for multi-lane 4
highways as well as freeways. However, density, expressed as number of vehicles per unit length 5
of roadway, is valid only under lane based traffic prevailing in developed countries like USA, 6
where the difference in individual vehicle speeds and their dimensions using same lane are not 7
significant. In practice, however, under heterogeneous traffic conditions in countries like India, 8
there are significant differences in speed and dimensions of different vehicles using same lane or 9
same road space for that matter. In view of this, studies conducted by Chari and Badarinath (1983) 10
(26), Chandra and Verma (1995) (27) Khan and Maini (1999) (28), suggested that the measure of 11
concentration for heterogeneous traffic should consider the vehicle area in its calculation. 12
Moreover, the concept of Area-occupancy proposed by Mallikarjuna and Rao (2006), (29) could 13
be a more appropriate, as it considers the horizontal projected area of the vehicle without any 14
restriction on trap length and width of road (Arasan and Dhivya 2008) (30). Further, Arasan and 15
Dhivya (2010) (31) validated the logical correctness of the area-occupancy concept by comparing 16
area occupancy with the flow and speed under replicated homogeneous as well as heterogeneous 17
traffic scenario using simulation. The study found that area occupancy can accurately determine 18
the road space usage by vehicles and it gives consistent values even if there is a change in traffic 19
composition and roadway conditions. Also, from the simulated model, they observed that the 20
measure of area-occupancy could satisfactorily explain the concentration of homogeneous as well 21
as heterogeneous traffic flow. The relationships of area occupancy with speed and flow using the 22
simulation model, they arrived at similar trends hence indicating that the concept is appropriate 23
enough as an alternate to density measurement particularly under heterogeneous traffic 24
environment. In light of above, this study is focused on investigating the appropriateness of area-25
occupancy (used as a substitute measure of traffic-concentration) for PCU estimation for varying 26
roadway and traffic conditions on urban multilane roads for the first time. 27
PCU values provided by code of practice in India (IRC 106:1990) (32), provides static 28
PCU values for urban roads in India. However, it would be unfair to use these values in the field 29
without conducting any analysis based on real field traffic data. In response to this, Chandra and 30
Sikdar (2000) (22) and other researchers (Arasan and Arkatkar, 2010) (33) proposed dynamic PCU 31
concept for characterizing heterogeneous traffic under varying roadway and traffic conditions. 32
Although, the method of Speed-Area ratio proposed by Chandra and Sikdar (2000) is widely 33
accepted for PCU estimation in India, but difficulty lies in explaining variation of PCU values 34
based on selected time-interval under consideration. Also, the usage of static areas of different 35
vehicle categories makes it quasi-dynamic. Moreover, data collection and extraction is also an 36
added difficulty for this methodology. The objective of this study is to propose simplified but 37
unique set of PCU values for different vehicle categories on multi-lane urban roads in India using 38
area occupancy as measure. The purpose of using area occupancy as measure is its consistency 39
with variation in roadway and traffic composition. This study suggests a methodology for finding 40
optimized PCU values of different vehicle categories in the traffic stream applicable to different 41
traffic-flow conditions. The obtained simplified single set of PCU values of different vehicle 42
categories in this study are suggested for eight-lane and ten-lane divided multi-lane urban road. 43
The study also examines the accuracy of optimized PCU values over different range of flow. It 44
also compares the effectiveness of optimized PCU values by comparing with dynamic PCU 45
concept and PCU values from IRC-106 (existing code of practice for India). The applicability of 46
this methodology is also under progress for expressways and other roadway categories in India. 47
Kumar, Arkatkar, Joshi, Dhamaniya 5
These values can be practically more acceptable for the motive of simplicity in field applications. 1
The paper is organized in total six-sections, including this section. Data collection, 2
extraction procedure is explained in the section-two. Section three presents traffic characteristics 3
such as traffic flow, composition and speed characteristics. Section four describes detailed 4
methodology of PCU estimation using area-occupancy. It is divided further into four-subsections. 5
First subsection includes area-occupancy calculation methodology. Second subsection develops 6
relationship between flow and area-occupancy for base traffic (nearly car-only traffic composition) 7
and mixed traffic. Third subsection develops simultaneous equations using area occupancy as 8
measure of performance. Fourth subsection describes matrix-solution of simultaneous equations 9
for estimating unique or optimized PCU estimation. Section five includes the validation as well as 10
check for accuracy of optimized PCU values. Finally, section six gives the conclusions of the 11
present study. 12
13
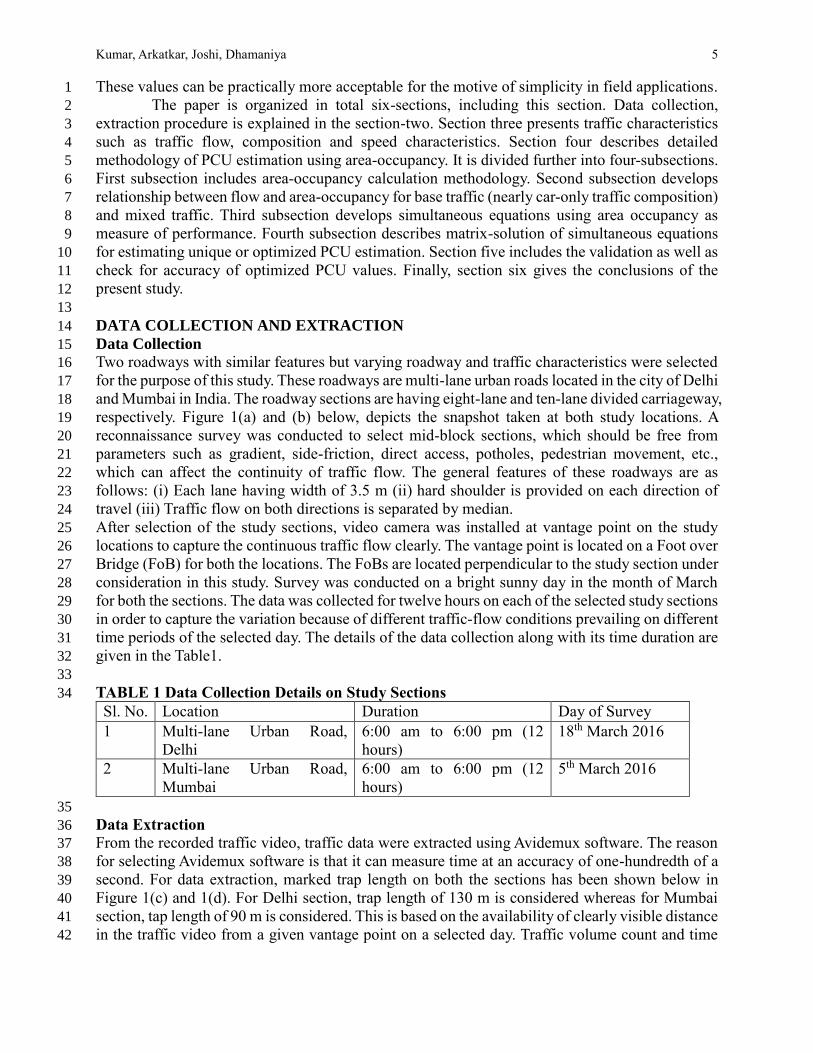
DATA COLLECTION AND EXTRACTION 14
Data Collection 15
Two roadways with similar features but varying roadway and traffic characteristics were selected 16
for the purpose of this study. These roadways are multi-lane urban roads located in the city of Delhi 17
and Mumbai in India. The roadway sections are having eight-lane and ten-lane divided carriageway, 18
respectively. Figure 1(a) and (b) below, depicts the snapshot taken at both study locations. A 19
reconnaissance survey was conducted to select mid-block sections, which should be free from 20
parameters such as gradient, side-friction, direct access, potholes, pedestrian movement, etc., 21
which can affect the continuity of traffic flow. The general features of these roadways are as 22
follows: (i) Each lane having width of 3.5 m (ii) hard shoulder is provided on each direction of 23
travel (iii) Traffic flow on both directions is separated by median. 24
After selection of the study sections, video camera was installed at vantage point on the study 25
locations to capture the continuous traffic flow clearly. The vantage point is located on a Foot over 26
Bridge (FoB) for both the locations. The FoBs are located perpendicular to the study section under 27
consideration in this study. Survey was conducted on a bright sunny day in the month of March 28
for both the sections. The data was collected for twelve hours on each of the selected study sections 29
in order to capture the variation because of different traffic-flow conditions prevailing on different 30
time periods of the selected day. The details of the data collection along with its time duration are 31
given in the Table1. 32
33
TABLE 1 Data Collection Details on Study Sections 34
Sl. No. Location Duration Day of Survey
1 Multi-lane Urban Road,
Delhi
6:00 am to 6:00 pm (12
hours)
18th March 2016
2 Multi-lane Urban Road,
Mumbai
6:00 am to 6:00 pm (12
hours)
5th March 2016
35
Data Extraction 36
From the recorded traffic video, traffic data were extracted using Avidemux software. The reason 37
for selecting Avidemux software is that it can measure time at an accuracy of one-hundredth of a 38
second. For data extraction, marked trap length on both the sections has been shown below in 39
Figure 1(c) and 1(d). For Delhi section, trap length of 130 m is considered whereas for Mumbai 40
section, tap length of 90 m is considered. This is based on the availability of clearly visible distance 41
in the traffic video from a given vantage point on a selected day. Traffic volume count and time 42

Kumar, Arkatkar, Joshi, Dhamaniya 6
stamp at entry and exit of vehicles in the study section were entered in Microsoft excel sheet 1
manually for each and every vehicle in the traffic stream. This was used for calculation of speed 2
of individual vehicles in the traffic stream varying from low to higher flow levels. Moreover, based 3
on the available dataset, speed, flow and area occupancy can be aggregated at intervals such as 1-4
minute, 5-minute or 15-minute from the extracted data. However, in this study, only 1-minute and 5
5-minute data aggregation is used. Data aggregation at 1-minute interval is done for PCU 6
estimation; however, for development of speed-flow relationship, data is aggregated at 5-minute 7
time interval. For PCU estimation, 1-minute time interval was preferred for capturing maximum 8
variation in traffic flow characteristics whereas 5-minute time interval is found to be most 9
appropriate for developing speed-flow-area occupancy relationships. 10
11
12 (a) (b) 13
14 (c) (d) 15
FIGURE 1 Snapshot of Study Location on: (a) Delhi Section (b) Mumbai Section; and data 16
extraction in Avidemux software on: (a) Delhi Section (b) Mumbai Section 17
18
TRAFFIC CHARACTERISTICS 19
Traffic flow Characteristics 20
In order to show the variation in traffic volume over both the section, two hours and three hours 21
of data were selected for Delhi and Mumbai Section respectively. The duration was decided based 22
on the observation from twelve hours of data which contains maximum variation in traffic flow. 23
The same can be observed from the Figure 2(a) and 2(b). This dataset was used for PCU analysis. 24
However, rest 10 hours and 9 hours of data on Delhi and Mumbai sections are used for 25
development of macroscopic speed-flow relationship. 26

Kumar, Arkatkar, Joshi, Dhamaniya 7
Traffic Composition 1
The observed traffic composition on the selected study sections is shown below in Figure 2(c) and 2
2(d) for a quick comparison. Both the sections have Car traffic in higher proportion. Moreever, 3
traffic composition shows more heterogeneity in case of multi-lane highway in Mumbai with a 4
significant proportion of motorized two-wheelers (2W) and motorized three wheelers (3W) as well 5
as heavy vehicles (7%) which include bus and truck. Delhi, multilane highways have higher 6
proportion of Cars (84%), when compared to Mumbai, multi-lane road with 47% car traffic. 7
However, vehicle category such as Light Commercial Vehicle (LCV) and 3W were not observed 8
on Delhi, multilane roads for the duration of data collection. 9
10
11 (a) 12 13
14 (b) 15
16 (c) (d) 17
FIGURE 2 Flow variation on: (a) Delhi Section (b) Mumbai Section; and Traffic 18
Composition on: (c) Delhi Section (d) Mumbai Section 19
CAR
84%
Bus
2%
Truck
3%
2W
11%
MULTILANE URBAN ROAD,
DELHI
CAR
47%
LCV
6%
Bus
2%
Truck
5%
2W
24%
3W
16%
MULTILANE URBAN ROAD,
MUMBAI

Kumar, Arkatkar, Joshi, Dhamaniya 8
Speed Characteristics 1
Speed is a fundamental measurement of performance of a given roadway facility. The free-flow 2
speed measured at any section is a function of number of factors such as road geometry, road 3
surface conditions, vehicular characteristics, individual driver behaviour and other factors such as 4
road-side environment, weather and time of the day. While selecting free speed of vehicle 5
categories, vehicles with headway of 8 or more seconds were selected as suggested by HCM (2010) 6
(21). Figures 3 (a) through 3(f) show the comparison of free-speed distribution plots for both 7
Multi-lane roads, for different vehicle categories on same set of axes. 8 9
10 (a) (b) 11
12
13 (c) (d) 14 15
16 (e) (f) 17
FIGURE 3 Vehicle category-wise Speed Characteristics on Study Sections 18

Kumar, Arkatkar, Joshi, Dhamaniya 9
It may be noted from Figures that 3W and LCV were not found on Delhi Multi-lane road, 1
when data was collected. The paired t-test for no-difference in mean was conducted for all vehicle 2
categories. The results indicate that there is no significant difference in mean speeds for each of 3
the vehicle categories at 5% level of significance. 4
5
PCU ESTIMATION METHODOLOGY 6
The conceptual framework for PCU estimation is depicted in Figure 4, in the form of flow chart. 7
The first step starts with selection of level of aggregation for developing fundamental flow-area 8
occupancy relationship using 1-minute interval data. The second step includes development of 9
flow-area occupancy relationship using real base-traffic scenario (nearly 100% cars-only traffic) 10
1-minute interval data points. The third step is to overlay data scatter (involving flow and area 11
occupancy data points) evolved from the real traffic data under mixed traffic (involving different 12
vehicle categories for which PCU is to be estimated) over the fundamental relationship from step-13
2. Further in step-4, flow for mixed traffic and base traffic scenario is equated for same area 14
occupancy values, involving PCU equivalent for different vehicle categories. The premise of this 15
developed methodology is to equate flows under two different scenarios: (1) cars-only traffic and 16
(2) mixed-traffic involving different vehicle classes, for same values of measure of performance 17
(area occupancy) to estimate PCU of different vehicle classes involved in mixed traffic. In other 18
words, the logic behind this step is to equate real mixed and cars-only traffic flows at same level 19
of vehicular interactions or impedance under particular traffic conditions. Conceptually, the left 20
side of the equation is the sum of the product of equivalent flows generated due to interactions of 21
different vehicle categories. Whereas, the right-hand side of the equation would be the actual 22
number of cars at same level of area occupancy. Several simultaneous equations were developed 23
on that basis. The details of these equations are given in the next sub-section. Finally, solution of 24
simultaneous equation gives PCU values of vehicle categories in the traffic stream. 25
26
27 28
FIGURE 4 Flow Chart for PCU Estimation 29
30

Kumar, Arkatkar, Joshi, Dhamaniya 10
The credibility or robustness of this developed methodology is that all the above 1
mentioned steps lead to incorporate maximum possible variation in traffic flow as well as 2
composition towards estimation of single set of optimized PCU values for a given roadway 3
condition. Hence, this approach presents more acceptable solution in terms of developing PCU 4
related guidelines for Asian countries having similar traffic conditions. Moreover, the proposed 5
methodology can also work well for developed countries like USA, where traffic condition is lane-6
based in nature. There, in place of area occupancy, time occupancy may be used as measure for 7
PCU estimation. Set of unique or optimized PCU values can be obtained for their condition as well. 8
In the subsequent sections below, the procedure of PCU estimation is explained in detail coupled 9
with field observed illustrations for better understanding. 10
11
Area Occupancy Calculation 12
Area occupancy concept was first proposed for heterogeneous traffic by Mallikarjuna and Rao 13
(2006) (29). This concept was also advocated by Arasan and Dhivya, (2008, 2010) (30) (31). Hence, 14
formulation in Equation 1 was used for the purpose of estimating a surrogate measure, namely, 15
area occupancy (𝜌𝐴). 16
17
𝜌𝐴=
∑ 𝑎𝑗𝑛𝑗=1 ∑ 𝑡𝑗𝑖𝐴𝑂𝑖
𝐴𝑇 (1) 18
Where, 𝜌𝐴 = area occupancy measured over space and time 19
j = vehicle category; 20
i = subject vehicle within category j; 21
aj = horizontal projected area of the vehicle of category j falling on the detection zone. The 22
horizontal projected area of the vehicle category is considered from Arasan and Dhivya (2010) 23
(30); 24
T = observation period; 25
A = area of the detection zone; 26
n = total number of vehicle categories in the heterogeneous traffic. 27
tjiAO = time during which the detection zone is occupied by vehicle i in sec. and the subscript, AO 28
stands for area-occupancy. 29
For detailed explanation of concept, interested readers may go through this research study 30
(Arasan and Dhivya 2008, 29). While using the concept, the trap-area (trap-length*width of 31
roadway) is considered as virtual area of detection zone. Observation period is fixed as 1-minute 32
interval as discussed in previous sections. The reason for selecting 1-minute interval is that concept 33
presented in this study for PCU estimation requires cars-only traffic flow condition. While, 34
selecting one-minute interval, likelihood of getting cars-only scenario increases. The entry and exit 35
time stamp of the vehicle through the trap length is time during which detection zone is occupied 36
by that vehicle, thereby indicating its travel time. The area of different vehicle categories adopted 37
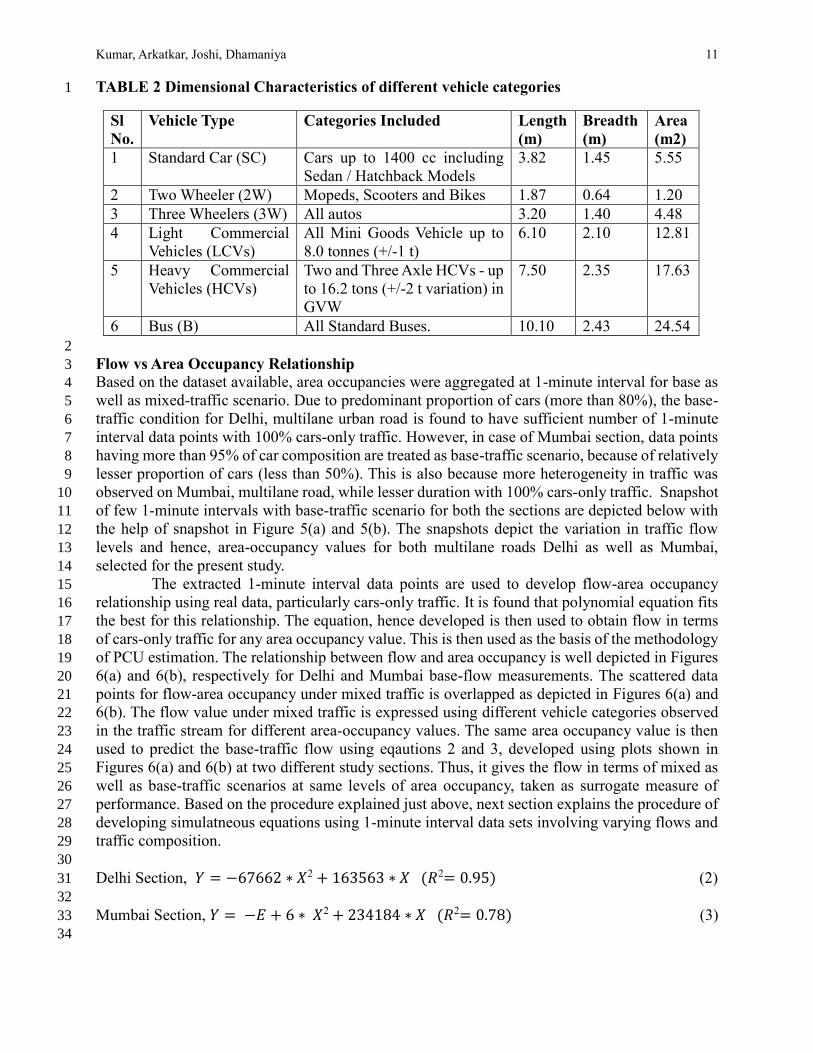
for the purpose of area-occupancy calculation, is shown in Table 2. The areas shown in the table 38
are taken from draft guidelines of Indian Highway Capacity Manual. Equation-1 is used for 39
calculation of area-occupancy values for both scenarios, mixed as well as car-only traffic 40
conditions. The area-occupancy values, hence estimated then form basis for determining PCU 41
estimates for different vehicle classes using solution to simultaneous equations by means of matrix 42
method. 43
44
45
46
47
Kumar, Arkatkar, Joshi, Dhamaniya 11
TABLE 2 Dimensional Characteristics of different vehicle categories 1
2
Flow vs Area Occupancy Relationship 3
Based on the dataset available, area occupancies were aggregated at 1-minute interval for base as 4
well as mixed-traffic scenario. Due to predominant proportion of cars (more than 80%), the base-5
traffic condition for Delhi, multilane urban road is found to have sufficient number of 1-minute 6
interval data points with 100% cars-only traffic. However, in case of Mumbai section, data points 7
having more than 95% of car composition are treated as base-traffic scenario, because of relatively 8
lesser proportion of cars (less than 50%). This is also because more heterogeneity in traffic was 9
observed on Mumbai, multilane road, while lesser duration with 100% cars-only traffic. Snapshot 10
of few 1-minute intervals with base-traffic scenario for both the sections are depicted below with 11
the help of snapshot in Figure 5(a) and 5(b). The snapshots depict the variation in traffic flow 12
levels and hence, area-occupancy values for both multilane roads Delhi as well as Mumbai, 13
selected for the present study. 14
The extracted 1-minute interval data points are used to develop flow-area occupancy 15
relationship using real data, particularly cars-only traffic. It is found that polynomial equation fits 16
the best for this relationship. The equation, hence developed is then used to obtain flow in terms 17
of cars-only traffic for any area occupancy value. This is then used as the basis of the methodology 18
of PCU estimation. The relationship between flow and area occupancy is well depicted in Figures 19
6(a) and 6(b), respectively for Delhi and Mumbai base-flow measurements. The scattered data 20
points for flow-area occupancy under mixed traffic is overlapped as depicted in Figures 6(a) and 21
6(b). The flow value under mixed traffic is expressed using different vehicle categories observed 22
in the traffic stream for different area-occupancy values. The same area occupancy value is then 23
used to predict the base-traffic flow using eqautions 2 and 3, developed using plots shown in 24
Figures 6(a) and 6(b) at two different study sections. Thus, it gives the flow in terms of mixed as 25
well as base-traffic scenarios at same levels of area occupancy, taken as surrogate measure of 26
performance. Based on the procedure explained just above, next section explains the procedure of 27
developing simulatneous equations using 1-minute interval data sets involving varying flows and 28
traffic composition. 29
30
Delhi Section, 𝑌 = −67662 ∗ 𝑋2 + 163563 ∗ 𝑋 (𝑅2= 0.95) (2) 31
32
Mumbai Section, 𝑌 = −𝐸 + 6 ∗ 𝑋2 + 234184 ∗ 𝑋 (𝑅2= 0.78) (3) 33
34
Sl
No.
Vehicle Type Categories Included Length
(m)
Breadth
(m)
Area
(m2)
1 Standard Car (SC) Cars up to 1400 cc including
Sedan / Hatchback Models
3.82 1.45 5.55
2 Two Wheeler (2W) Mopeds, Scooters and Bikes 1.87 0.64 1.20
3 Three Wheelers (3W) All autos 3.20 1.40 4.48
4 Light Commercial
Vehicles (LCVs)
All Mini Goods Vehicle up to
8.0 tonnes (+/-1 t)
6.10 2.10 12.81
5 Heavy Commercial
Vehicles (HCVs)
Two and Three Axle HCVs - up
to 16.2 tons (+/-2 t variation) in
GVW
7.50 2.35 17.63
6 Bus (B) All Standard Buses. 10.10 2.43 24.54

Kumar, Arkatkar, Joshi, Dhamaniya 12
Where, 𝑌 = Base Traffic Flow 1
𝑋 = Area Occupancy 2
3
4
5 (a) 6
7
8 (b) 9
10
FIGURE 5 Base Traffic Scenarios at (a) Delhi, Eight-lane divided Urban Road (b) Mumbai, 11
Ten-lane divided multilane Urban Road 12
13
The effect of heterogeneity is clearly visible from Figures 6(a) and 6(b). As anticipated 14
the scatter of data points pertaining to mixed traffic conditions is more or less overlapping on the 15
trend line generated based on cars-only traffic (Figure 6a). This may be attributed to the presence 16
of predominant proportion of cars (more than 80%) in the mixed traffic stream on Delhi Multilane 17
road. Whereas, in case of Mumbai (Figure 6b), the scatter points are shifted to right away from the 18
trend line, indicating effect of heterogeneity and higher level vehicular interactions due to presence 19
of different vehicle classes (other than cars traffic). 20

Kumar, Arkatkar, Joshi, Dhamaniya 13
1 (a) 2
3 (b) 4
FIGURE 6 Flow vs Area Occupancy Relationship for Base Traffic Stream and Mixed Traffic 5
Flow Data Scatter on (a) Delhi, Eight-lane divided Section (b) Mumbai, Ten-lane divided 6
Section 7
8
Development of simultaneous equations using Area Occupancy as MoE 9
A methodology is proposed to estimate PCU values based on cars-only traffic and mixed traffic 10
flow levels, for same measure of performance (Huber ,1982) (34). Same concept is extended here 11
for development of simultaneous equations at given area-occupancy value. Using this 12
methodology, a flow rate Q𝑏 of base stream (containing cars-only traffic) and a flow rate Q𝑚of 13
mixed stream, containing a proportion of cars Pc , proportion of light commercial vehicle Plcv , 14
proportion of bus Pbus, proportion of truck Ptruck, proportion of motorized two-wheeler Pmtw and 15
proportion of motorized three-wheeler Pmthw, using same performance measure (in this case area 16
occupancy) can be equated as: 17
18
Q𝑏 = Pc ∗ Q𝑚 ∗ 1 + Plcv ∗ Q𝑚 ∗ PCUlcv + Plcv ∗ Q𝑚 ∗ PCUlcv + Pbus ∗ Q𝑚 ∗ PCUbus +19
Ptruck ∗ Q𝑚 ∗ PCUtruck + Pmtw ∗ Q𝑚 ∗ PCUmtw + Pmthw ∗ Q𝑚 ∗ PCUmthw (4) 20
21
Where, Pi ∗ Q𝑚= fi , Flow of respective vehicle category during the selected 1-mininterval with 22
mixed traffic flow,Q𝑚. 23

Kumar, Arkatkar, Joshi, Dhamaniya 14
1
PCUlcv, PCUbus, PCUtruck, PCUmtw, PCUmthw are PCU values for light commercial vehicle, bus, 2
truck, multi-axle truck, motorized two-wheeler and motorized three-wheelers, respectively. 3
4
Further, the equation can also be written as for any 1-minute interval 5
6
flcv ∗ PCUlcv + fbus ∗ PCUbus + ftruck *PCUtruck + fmatruck *PCUmatruck + fmtw ∗ PCUmtw +7
fmthw ∗ PCUmthw =Q𝑏- fc (5) 8
9
Therefore, out of 12 hours of traffic data on Delhi and Mumbai section, about 2 and 3-10
hours of mixed traffic flow data was selected respectively for both the sections. The scatter of data 11
points (orange in color), for which are shown in Figures 6 (a) and 6 (b). Thus, about 120 and 180 12
simultaneous equations are developed using mixed-traffic real observed scenarios. For this 13
purpose, 1-minute time interval data points (involving flow and area occupancy values) both for 14
Delhi as well as Mumbai multi-lane roads, are considered. The simultaneous equations, hence 15
developed, can be solved using matrix solution. This matrix solution is proposed to be adopted in 16
the present study for PCU estimation of different vehicle categories in the traffic stream. The 17
remaining 10 and 9 hours of traffic data from Delhi and Mumbai is further used for development 18
of speed-flow relationships in last section of this study, as a part of accuracy check for estimated 19
PCU values. 20
21
Proposed Matrix Solution for PCU estimation 22
Based on the Equation 5, given above, several simultaneous equations are developed using cars-23
only and mixed traffic stream flow levels at same performance level of area-occupancy. This study 24
proposes matrix solution for PCU estimation under mixed-traffic conditions. The simultaneous 25
equations developed for both the sections using Equation (5) can be written in the matrix form as 26
shown in Equation (6). The motivation behind using matrix solution is that, it is said about matrix 27
solution, that for any A*X=B, there exists a unique solution, where X= A-1*B. These are also 28
known as optimized values of X, which can be applicable for all the simultaneous equations. This 29
unique solution can work well for all the simultaneous equations developed at different flow 30
volumes involving different vehicle classes. The generic form of simultaneous equation in matrix 31
form is given below in Equation 6. Here, for PCU value estimation, different matrix shown in 32
Equation 6 can be represented as [A], [PCU] and [B] as shown below. [A] is a 5*n matrix, [PCU] 33
is a column matrix with 1*5 elements and [B] is also a column matrix with 1*n elements. Then, 34
elements of matrix [A] and [B] are already known. [A] matrix contains flow of different vehicle 35
categories except car in each row for 1-minute interval. The number of rows suggests number of 36
1-minute interval selected in calculation. 37
38
39

Kumar, Arkatkar, Joshi, Dhamaniya 15
[ 𝑓𝑙𝑐𝑣1
𝑓𝑏𝑢𝑠1𝑓𝑡𝑟𝑢𝑐𝑘1
𝑓2𝑤1𝑓3𝑤1
𝑓𝑙𝑐𝑣2𝑓𝑏𝑢𝑠2
𝑓𝑡𝑟𝑢𝑐𝑘2𝑓2𝑤2
𝑓3𝑤2
𝑓𝑙𝑐𝑣3𝑓𝑏𝑢𝑠3
𝑓𝑡𝑟𝑢𝑐𝑘3𝑓2𝑤3
𝑓3𝑤3
𝑓𝑙𝑐𝑣4𝑓𝑏𝑢𝑠4
𝑓𝑡𝑟𝑢𝑐𝑘4𝑓2𝑤4
𝑓3𝑤4
𝑓𝑙𝑐𝑣5𝑓𝑏𝑢𝑠5
𝑓𝑡𝑟𝑢𝑐𝑘5𝑓2𝑤5
𝑓3𝑤5
𝑓𝑙𝑐𝑣6𝑓𝑏𝑢𝑠6
𝑓𝑡𝑟𝑢𝑐𝑘6𝑓2𝑤6
𝑓3𝑤6
. . . . . . . . . .
. . . . . . . . . .
. . . . . . . . . .𝑓𝑙𝑐𝑣1
𝑓𝑏𝑢𝑠𝑛𝑓𝑡𝑟𝑢𝑐𝑘𝑛
𝑓2𝑤𝑛𝑓3𝑤𝑛]
*
[
𝑃𝐶𝑈𝑙𝑐𝑣
𝑃𝐶𝑈𝑏𝑢𝑠
𝑃𝐶𝑈𝑡𝑟𝑢𝑐𝑘
𝑃𝐶𝑈2𝑤
𝑃𝐶𝑈3𝑤 ]
=
[ Q𝑏1
− 𝑓𝑐1
Q𝑏2− 𝑓𝑐2
Q𝑏3− 𝑓𝑐3
Q𝑏4− 𝑓𝑐4
Q𝑏5− 𝑓𝑐5
Q𝑏6− 𝑓𝑐6
. .
. .
. .Q𝑏𝑛
− 𝑓𝑐𝑛]
(6) 1
2
Where, 3
𝑓𝑐𝑖 , 𝑓𝑙𝑐𝑣𝑖
, 𝑓𝑏𝑢𝑠𝑖 , 𝑓𝑡𝑟𝑢𝑐𝑘𝑖
, 𝑓2𝑤𝑖 , 𝑓3𝑤𝑖
= Flow of Car, light commercial vehicle (LCV), bus, truck, 4
motorized two-wheeler (2w), motorized three wheeler (3w) for any 1-min time interval, i 5
6
Q𝑏𝑖 is the base traffic flow for respective 1-minute time interval, i 7
8
i represents different 1-minute interval from 1 to n. In this case, it is from 1 to 120 for two hours 9
of data (Delhi Section) and 1 to 180 for three hours of data (Mumbai Section). 10
11
𝑃𝐶𝑈𝑙𝑐𝑣 , 𝑃𝐶𝑈𝑏𝑢𝑠 , 𝑃𝐶𝑈𝑡𝑟𝑢𝑐𝑘 , 𝑃𝐶𝑈2𝑤 , 𝑃𝐶𝑈3𝑤 = Passenger Car Equivalent of light commercial 12
vehicle (lcv), bus, truck, motorized two-wheeler (2w), motorized three wheeler (3w) respectively. 13
14
The formulation of matrix form of simultaneous equation and its solution is understood 15
using general matrix related studies (Atuedu. 2016 (35), Mathworkscom, 2016(36)) as shown in 16
equations 7 and 8. 17
18
Equation 6 can be written as: 19
[A]*[PCU]=[B] (7) 20
21
Further, solution of set of unique or optimized PCU values can be obtained as, 22
[PCU] =[A]-1[B] (8) 23
24
Matrix solution was obtained using MATLAB software. The solution of Matrix gives the unique 25
or optimized PCU values for different vehicle categories in the traffic stream. This unique PCU 26
value is based on the observed base-traffic (with all cars traffic) as well as mixed traffic flow at 27
same performance level. Using the above-mentioned procedure, the optimized PCU values of 28
different vehicle categories in the traffic stream was obtained for eight-lane (Delhi) and ten-lane 29
divided (Mumbai) multi-lane urban roads. The estimated values based on matrix method for both 30
study sections are depicted in Table 3. 31
32
33
34
35
36

Kumar, Arkatkar, Joshi, Dhamaniya 16
TABLE 3 PCU values of vehicles on Delhi and Mumbai Section 1
2
Vehicle Category Delhi, Eight-lane divided section Mumbai, Ten-lane divided section
Car 1.00 1.00
Bus 2.45 3.20
LCV * 3.02
Truck 3.78 4.68
2W 0.48 0.78
3W * 0.95
Note: * Not observed in field 3
4
In order to check, whether there is increase in optimized PCU values of vehicles 5
categories while road space is increasing from eight-lane divided carriageway (Delhi multilane 6
road) to ten- lane divide carriageway (Mumbai multilane road) for vehicle movement. One tail t-7
test was conducted with null hypothesis of there is no increase and alternate hypothesis saying 8
there is significant increase. The test was conducted for Bus, Tuck and 2W. P-value for the test 9
result is 0.033. The result of t-test shows that there is significant increase in PCU values of all 10
vehicle categories with increase in carriageway width at 5% level of significance. This increase in 11
PCU value for different vehicle classes may be attributed to higher speed difference between car 12
as reference vehicle and subject vehicle category for which PCU is to be estimated. 13
14
VALIDATION OF PROPOSED PCU VALUES 15
Using these estimated optimized PCU values; flow in terms of vehicles/hour/direction of mixed 16
traffic stream can be represented in terms of PCU/hour/direction as shown in Figure 7 below. After 17
converting mixed traffic using proposed PCU, the extent of scatter shown by mixed traffic flow 18
(PCU/hour/direction) is exactly overlapped with the trend line developed for base-traffic (cars-19
only scenario), as depicted in Figures 7(a) and 7(b). This proves the credibility of proposed PCU 20
estimation concept as well as practical applicability of devised PCU estimates. For temporal 21
validation using every 1-minute time interval, the comparison of base-traffic values (from trend 22
line equation, generated based on real filed cars-only data points) with converted equivalent flow 23
values (PCU/hour/direction) was made. The comparative line plots generated using equivalent 24
flow (the converted mixed traffic-scenario) and base-traffic flow (cars-only traffic scenario) for 25
every 1-minute time interval is also presented in figures 7 (c) and 10(d) below for considerable 26
time duration. 27
28
29
30
31
32
33
34
35
36

Kumar, Arkatkar, Joshi, Dhamaniya 17
1 (a) 2
3 (b) 4
5 (c) 6
7 (d) 8
FIGURE 7 Validation of PCU concept using: flow vs area occupancy diagram for (a) Delhi 9
Section (b) Mumbai Section; and comparison of base flow and equivalent flow for (c) Delhi 10
Section (d) Mumbai Section 11

Kumar, Arkatkar, Joshi, Dhamaniya 18
From figures, it may be noted that the comparison between base traffic flow and 1
equivalent flow in terms of PCU/hour/direction both for Delhi (Figures 7a and 7c) and Mumbai 2
(Figures 7b and 7d) multilane road sections is reasonably matching and hence sounds accurate. To 3
quantify the error, the Mean Absolute Percentage Error (MAPE) of 8% and 9% is found for Delhi 4
and Mumbai multilane sections, respectively. This further corroborates that the proposed PCU 5
values obtained for both the sections can be considered accurate. Also, the approach developed in 6
the present study appears to be practically adequate to handle the traffic flow variation particularly 7
under mixed traffic conditions in India and also in other Asian countries having similar traffic 8
situation. This approach may even be extended for other uninterrupted roads and also in developed 9
countries having mixed traffic conditions, but lane-based controlled movement. 10
11
COMPARISON WITH EXISTING PRACTICES/METHODOLOGY 12
In order to visualize the credibility of the proposed PCU estimation approach, it was realized to 13
compare it with PCU values from code of practice for India, IRC-106 and and with most acceptable 14
methodology of PCU estimation for different vehicle categories in India and other developing 15
Asian countries. Thus, PCU is also estimated using dynamic PCU concept (Chandra and Kumar 16
(2000)) based on speed-area ratio. Equation 9 given below is used to estimate dynamic PCU values 17
for each time-interval under consideration. 18
19
PCUi = Vc Vi⁄
Ac Ai⁄ (9) 20
21
Where, PCUi = Equivalent Passenger Car unit of vehicle i, 22
Vc = average speed of car in traffic stream km/h, 23
Vi= average speed of vehicle i in traffic stream km/h, 24
Ac = projected rectangular plan area of car (m2), 25
Ai = projected rectangular plan area of vehicle i (m2). 26
27
After temporal validation of optimized PCU values in previous section, the check for accuracy was 28
also done for different boundary conditions of traffic flow, particularly at capacity level, for 29
example. For this purpose, fundamental speed-flow relationships were developed using field 30
observed data by converting mixed traffic-flow (vehicles/hour/direction) to equivalent flow 31
(PCU/hour/direction) using both optimized PCU (shown in Table 3) and values suggested by IRC, 32
as well as dynamic PCU concept (as explained using equation-9) for each 5-minute interval, as 33
discussed earlier. For this purpose, the left out 10- hours of traffic data for Delhi Section and 9 34
hours of data for Mumbai section out of 12 hours of extracted data for each of the sections was 35
used. The relationship between speed and flow for every 5-minute interval data was fitted using 36
polynomial function using field observed data points for both the study sections. The speed-flow 37
relationships hence developed using dynamic as well as optimized PCU values for Delhi and 38
Mumbai Sections are shown in Figures 8 (a) and 8 (b), respectively on same set of axes for better 39
comparison. From Figures 8 (a) and 8 (b), it may be noted that for both Delhi as well as Mumbai 40
multilane study sections, speed-flow relationships developed using dynamic as well as optimized 41
(proposed) PCU values are matching satisfactorily. Speed-flow relationship developed using PCU 42
values from IRC was found to be matching satisfactorily to the other methods in case of eight-lane 43
divided Delhi section. But, it failed to match with the other two methods in case of ten-lane divided 44
Mumbai section. This brings about an important finding that the same PCU values suggested by 45
IRC-106 for all the multilane roads, irrespective of number of lanes may not work well always. 46
This expresses the inadequacy in the PCU values proposed by IRC-106 and puts forward a scope 47

Kumar, Arkatkar, Joshi, Dhamaniya 19
to revise the PCU values based on the change in roadway width in the guideline. 1
Further, it is also found that flow in terms of PCU/hour using optimized and dynamic 2
PCU concept have the difference in capacity value of 2.0 % and 1.3% for Delhi and Mumbai study 3
sections, respectively. Hence, it may be inferred that proposed concept of PCU estimation using 4
area occupancy as measure of performance is able to capture the effect of variation in mixed-traffic 5
flow as well as composition of traffic stream. The proposed matrix solution for solving area-6
occupancy based simultaneous equations is able to provide unique and single set of PCU values, 7
which may be easier to apply for practitioners in planning, design as well as operational analysis. 8
By virtue of this solution, the uncertainty involved in using dynamic PCU values for different 9
levels of variation can be resolved. The present study is expected to bring lot of insights in ongoing 10
efforts for developing Indian Highway Capacity Manual. 11 12
13 (a) 14
15
16 (b) 17
FIGURE 8 Speed-Flow Relationship for: (a) Delhi Section (b) Mumbai Section 18
19

Kumar, Arkatkar, Joshi, Dhamaniya 20
CONCLUSIONS AND DISCUSSIONS 1
Various methods have been used over past fifty yerars to derive PCE factors for different roadway 2
facilities. In this study, a new methodology is proposed to estimate PCU for mulltilane urban roads 3
under heterogeneous traffic conditions. The method appears to be robust in generating PCU factors 4
for similar road characteristics and offers a more practical approach to estimating PCU factors for 5
application. The present study demonstrates a methodology which would be helpful to get the 6
optimized set of PCU values for different vehicle categories applicable for uninterrupted facility 7
such as multilane urban as well as interurban roads, over a wider range of traffic volumes. The 8
basis of this approach is well established to equate base-traffic flow with mixed traffic flow with 9
PCU values for varying vehicle classes for same area-occupancy (MoE for uninterrupted multilane 10
roads) values. Consequently, several simultaneous equations are developed for combinations of 11
different real field observed flow levels as well as wide variation of traffic compositions. The 12
proposed matrix solution gives a single set of unique or optimized set of PCU values applicable to 13
different flow condition. This concept is also in agreement with HCM 2010 (United States) 14
guideline of providing a single set of PCU value for different flow levels. However, values are not 15
comparable due to wide variation in traffic flow, movement and vehicular interactions. 16
This methodology is used for determination of PCU values for multilane urban roads in 17
Delhi and Mumbai in India using field data as case studies. The analysis was carried out for eight-18
lane divided (Delhi) and ten-lane divided (Mumbai) midblock sections. The study shows there is 19
significant increase in PCU values obtained using the proposed methodology with the increase in 20
roadway width. Accuracy of PCU values was also checked and the results obtained are evident for 21
inferring that the estimated PCU values are reasonably accurate, while comparing equivalent flow 22
(PCU/hour/direction) with the base-traffic flow (cars-only traffic scenario). Accuracy of proposed 23
PCU values is also checked with dynamic PCU concept for mixed traffic on multilane urban roads. 24
The flow values obtained using proposed optimized as well as dynamic PCU values were found to 25
be comparable, indicating the ease in using unique PCU values against dynamic PCU values by 26
field engineers. Speed-flow curves developed using these PCU factors yielded the difference in 27
capacity values which is just 2 % both for Mumbai as well as Delhi study sections, thereby 28
indicating substantial potential of proposed PCU estimation approach. Based on speed-flow plot, 29
the PCU values suggested by IRC-106 were in agreement with the optimized and dynamic PCU 30
concept for eight-lane divided section, but ended up underestimating the capacity for ten-lane 31
divided Mumbai section. Therefore, this study recommends that the same PCU values suggested 32
by IRC-106 should not be used for the varying carriageway and there is a scope of revision in this 33
direction. 34
The present study also establishes an enormous potential of using a micro-level traffic 35
flow parameter, area-occupancy as a convincing basis of measure of performance for estimating 36
optimized PCU values for different vehicle classes. The free-flow speed studies indicated that the 37
mean free speeds of different vehicle categories on both the multilane unban study sections (eight-38
lane and ten-lane divided) are not found to be significantly different. However, traffic compositions 39
and flow levels vary significantly on these study sections. However, area occupancy concept gives 40
consistent results even with variation in traffic composition and roadway conditions (Arasan and 41
Dhivya, 2008 and 2010) (29,30). The major contribution of this research is providing unique or 42
optimized PCU values for different vehicle classes, applicable to different flow levels and 43
compositions as observed in field. The values are different for eight-lane and ten-lane divided 44
roadway sections for a well-known reason of higher speed differential between car as reference 45
vehicle and subject vehicle class. These values may be directly used by field engineers for similar 46
type of roadway sections. The PCU values proposed above will reduce time as well as cost of field 47
Kumar, Arkatkar, Joshi, Dhamaniya 21
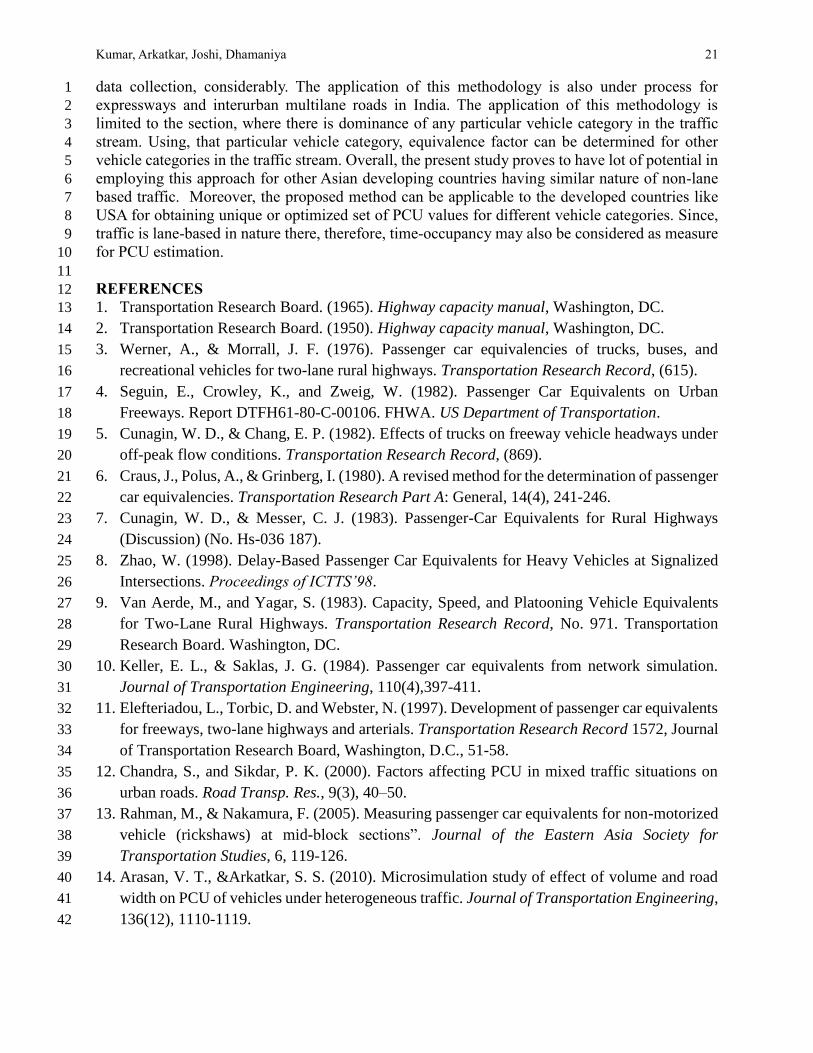
data collection, considerably. The application of this methodology is also under process for 1
expressways and interurban multilane roads in India. The application of this methodology is 2
limited to the section, where there is dominance of any particular vehicle category in the traffic 3
stream. Using, that particular vehicle category, equivalence factor can be determined for other 4
vehicle categories in the traffic stream. Overall, the present study proves to have lot of potential in 5
employing this approach for other Asian developing countries having similar nature of non-lane 6
based traffic. Moreover, the proposed method can be applicable to the developed countries like 7
USA for obtaining unique or optimized set of PCU values for different vehicle categories. Since, 8
traffic is lane-based in nature there, therefore, time-occupancy may also be considered as measure 9
for PCU estimation. 10
11
REFERENCES 12
1. Transportation Research Board. (1965). Highway capacity manual, Washington, DC. 13
2. Transportation Research Board. (1950). Highway capacity manual, Washington, DC. 14
3. Werner, A., & Morrall, J. F. (1976). Passenger car equivalencies of trucks, buses, and 15
recreational vehicles for two-lane rural highways. Transportation Research Record, (615). 16
4. Seguin, E., Crowley, K., and Zweig, W. (1982). Passenger Car Equivalents on Urban 17
Freeways. Report DTFH61-80-C-00106. FHWA. US Department of Transportation. 18
5. Cunagin, W. D., & Chang, E. P. (1982). Effects of trucks on freeway vehicle headways under 19
off-peak flow conditions. Transportation Research Record, (869). 20
6. Craus, J., Polus, A., & Grinberg, I. (1980). A revised method for the determination of passenger 21
car equivalencies. Transportation Research Part A: General, 14(4), 241-246. 22
7. Cunagin, W. D., & Messer, C. J. (1983). Passenger-Car Equivalents for Rural Highways 23
(Discussion) (No. Hs-036 187). 24
8. Zhao, W. (1998). Delay-Based Passenger Car Equivalents for Heavy Vehicles at Signalized 25
Intersections. Proceedings of ICTTS’98. 26
9. Van Aerde, M., and Yagar, S. (1983). Capacity, Speed, and Platooning Vehicle Equivalents 27
for Two-Lane Rural Highways. Transportation Research Record, No. 971. Transportation 28
Research Board. Washington, DC. 29
10. Keller, E. L., & Saklas, J. G. (1984). Passenger car equivalents from network simulation. 30
Journal of Transportation Engineering, 110(4),397-411. 31
11. Elefteriadou, L., Torbic, D. and Webster, N. (1997). Development of passenger car equivalents 32
for freeways, two-lane highways and arterials. Transportation Research Record 1572, Journal 33
of Transportation Research Board, Washington, D.C., 51-58. 34
12. Chandra, S., and Sikdar, P. K. (2000). Factors affecting PCU in mixed traffic situations on 35
urban roads. Road Transp. Res., 9(3), 40–50. 36
13. Rahman, M., & Nakamura, F. (2005). Measuring passenger car equivalents for non-motorized 37
vehicle (rickshaws) at mid-block sections”. Journal of the Eastern Asia Society for 38
Transportation Studies, 6, 119-126. 39
14. Arasan, V. T., &Arkatkar, S. S. (2010). Microsimulation study of effect of volume and road 40
width on PCU of vehicles under heterogeneous traffic. Journal of Transportation Engineering, 41
136(12), 1110-1119. 42

Kumar, Arkatkar, Joshi, Dhamaniya 22
15. Sumner, R., Hill, D., & Shapiro, S. (1984). Segment passenger car equivalent values for cost 1
allocation on urban arterial roads. Transportation Research Part A: General, 18(5), 399-406. 2
16. John, A., & Glauz, W. (1976). Speed and Service on Multilane Upgrades. Transportation 3
Research Record, No. 61, Washington, DC. 4
17. Al-Kaisy, A. F., Hall, F. L., & Reisman, E. S. (2002). Developing passenger car equivalents 5
for heavy vehicles on freeways during queue discharge flow. Transportation Research Part A: 6
Policy and Practice, 36(8), 725-742. 7
18. Al-Kaisy, A., Jung, Y., & Rakha, H. (2005). Developing passenger car equivalency factors for 8
heavy vehicles during congestion. Journal of transportation engineering, 131(7), 514-523. 9
19. Benekohal, R. F., & Zhao, W. (2000). Delay-based passenger car equivalents for trucks at 10
signalized intersections. Transportation Research Part A: Policy and Practice, 34(6), 437-457. 11
20. Skabardonis A., Dowling R., Kiattikomol V, and Safi C. (2014). Developing improved truck 12
passenger car equivalent values at signalized intersections. Transportation Research Record 13
2461 Journal of the Transportation Research Board, Washington, D.C., 121–128. 14
21. Transportation Research Board. (2010). Highway capacity manual, 5th Ed., National 16 15
Research Council, Washington, DC. 16
22. Dhamaniya, A. and Chandra, S. (2015). Conceptual Approach for Estimating Dynamic PCU 17
on Urban Arterial Roads using Simultaneous Equations. Transportation Research Record, 18
Journal of the Transportation Research Board, Washington, D.C., (in compendium). 19
23. Preethi, P. and Ashalatha, R. (2016). Estimation of Dynamic PCU Using the Area Occupancy 20
Concept at Signalised Intersections. International Conference on Transportation and 21
Development 2016: pp. 825-837. doi: 10.1061/9780784479926.075 22
24. Scott S. Washburn and Seckin Ozkul. Heavy Vehicle Effects on Florida Freeways and 23
Multilane Highways. Florida: University of Florida Transportation Research Center 24
Department of Civil and Coastal Engineering, 2013. 25
25. Krammes, R. A., & Crowley, K. W. (1986). Passenger car equivalents for trucks on level 26
freeway segments. Transportation Research Record, 1091, 10-16. 27
26. Chari, S. R. and Badrinath, K. M. (1983). Study of mixed traffic stream parameters through 28
time lapse photography. Highway Research Bulletin (Indian Road Congress, Highway 29
Research Board), 20, p.57. 30
27. Satish Chandra, Verma, V. S. (1995). Capacity of Urban Roads Using Areal Density Concept. 31
Journal of REAAA, vol. 5, 1995, Malaysia, pp. 14-20. 32
28. Khan, S. and Maini, P. (1999). Modeling heterogeneous traffic flow. Transportation Research 33
Record: Journal of the TRB, (1678), 234-241. 34
29. Mallikarjuna, C. and Rao, K. R. (2006). Area occupancy characteristics of heterogeneous 35
traffic. Transportmetrica, 2(3), 223-236. 36
30. Arasan, V. T. and Dhivya, G. (2008). Measuring heterogeneous traffic density. In Proceedings 37
of International Conference on Sustainable Urban Transport and Environment, World 38
Academy of Science, Engineering and technology, Bangkok (Vol. 36, p. 342). 39

Kumar, Arkatkar, Joshi, Dhamaniya 23
31. Arasan, V. T. and Dhivya, G. (2010). Simulation of highly heterogeneous traffic flow 1
characteristics. In Proceedings of 24th European Conference on Modelling and Simulation 2
ECMS (pp. 81-87). 3
32. Indian Roads Congress. (1990). Guidelines for capacity of urban roads in plain areas. IRC 4
code of practice, 106, New Delhi, India. 5
33. Arasan, V. T. and Arkatkar, S. S. (2010). Micro-simulation Study of Effect of Volume and 6
Road Width on PCU of Vehicles under Heterogeneous Traffic. Journal of Transportation 7
Engineering, ASCE, 2010, 136(12), 1110-1119. doi:10.1061/(ASCE)TE.1943-5436.0000176 8
34. Huber, M. J. (1982). Estimation of passenger-car equivalents of trucks in traffic stream. 9
Transportation Research Record,869, 60-70. 10
35. Atuedu. (2016). Atuedu. Retrieved from http://faculty.atu.edu/mfinan/solutions.pdf 11
36. Mathworkscom. (2016). Mathworkscom. Retrieved from 12
http://in.mathworks.com/help/matlab/ref/mldivide.html 13
14