1. measures of atmospheric compositionacmg.seas.harvard.edu/.../lecture_eps133_chap1.pdf1. measures...
TRANSCRIPT

1. MEASURES OF ATMOSPHERIC COMPOSITION
Daniel J. Jacob, Atmospheric Chemistry, Harvard University, Spring 2017

The atmosphere: gas envelopesurrounding the Earth
The atmosphere seen from space
• Size of air molecules ≈ 0.3 nm << λ⇒scattering is inefficient and ~ λ-4
• Absorption at visible wavelengths is also very weak
Sun is yellow
Sky is blue
Sunset is red
scatter
scatter
cloudy sunset
Sun seen from space shuttle
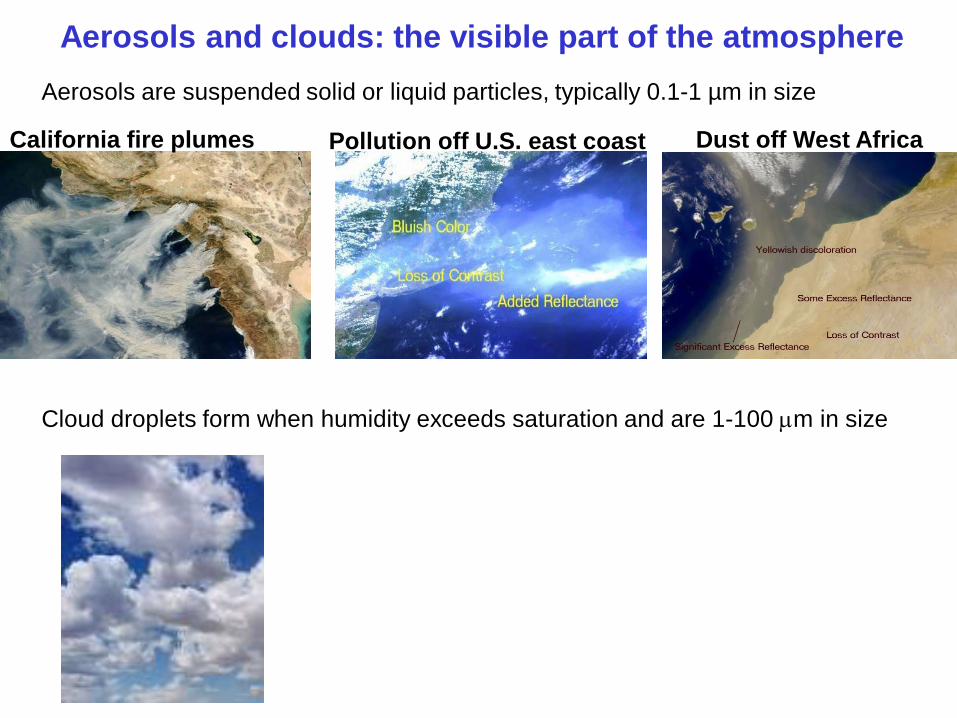
Aerosols and clouds: the visible part of the atmosphere
Pollution off U.S. east coast Dust off West AfricaCalifornia fire plumes
Aerosols are suspended solid or liquid particles, typically 0.1-1 µm in size
Cloud droplets form when humidity exceeds saturation and are 1-100 µm in size
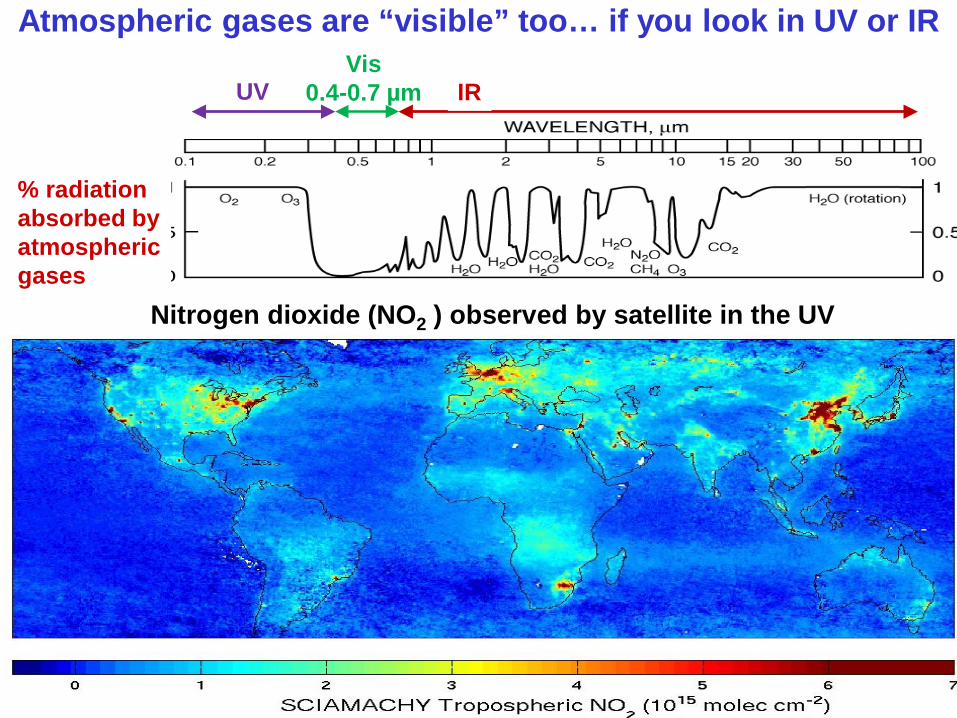
Vis0.4-0.7 µm
Atmospheric gases are “visible” too… if you look in UV or IR
Nitrogen dioxide (NO2 ) observed by satellite in the UV
% radiationabsorbed byatmosphericgases
UV IR
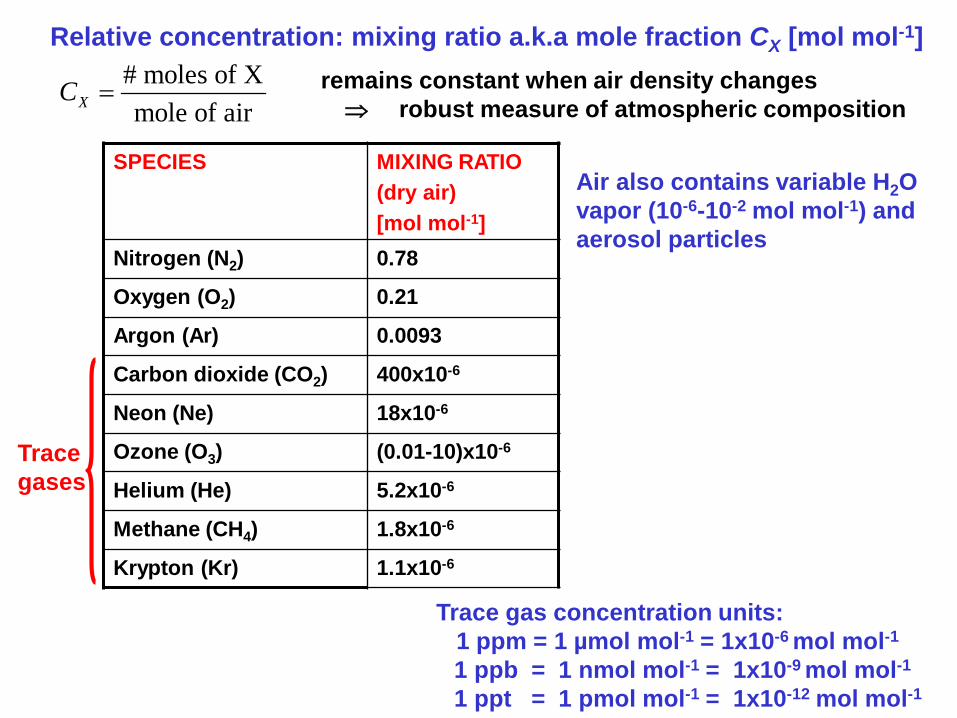
Relative concentration: mixing ratio a.k.a mole fraction CX [mol mol-1]# moles of Xmole of airXC = remains constant when air density changes
⇒ robust measure of atmospheric composition
SPECIES MIXING RATIO (dry air)[mol mol-1]
Nitrogen (N2) 0.78
Oxygen (O2) 0.21
Argon (Ar) 0.0093
Carbon dioxide (CO2) 400x10-6
Neon (Ne) 18x10-6
Ozone (O3) (0.01-10)x10-6
Helium (He) 5.2x10⁻⁶
Methane (CH4) 1.8x10⁻⁶
Krypton (Kr) 1.1x10⁻⁶
Tracegases
Air also contains variable H2O vapor (10-6-10-2 mol mol-1) and aerosol particles
Trace gas concentration units:1 ppm = 1 µmol mol-1 = 1x10⁻⁶ mol mol-11 ppb = 1 nmol mol-1 = 1x10⁻⁹ mol mol-11 ppt = 1 pmol mol-1 = 1x10-12 mol mol-1
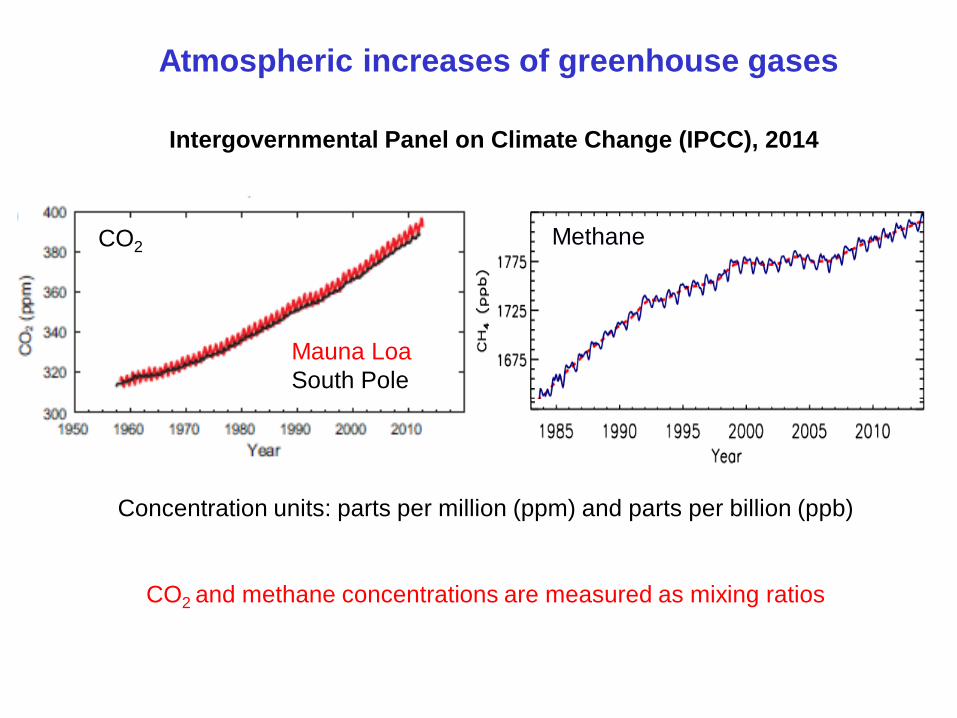
Atmospheric increases of greenhouse gases
Intergovernmental Panel on Climate Change (IPCC), 2014
Concentration units: parts per million (ppm) and parts per billion (ppb)
CO2 and methane concentrations are measured as mixing ratios
MethaneCO2
Mauna LoaSouth Pole
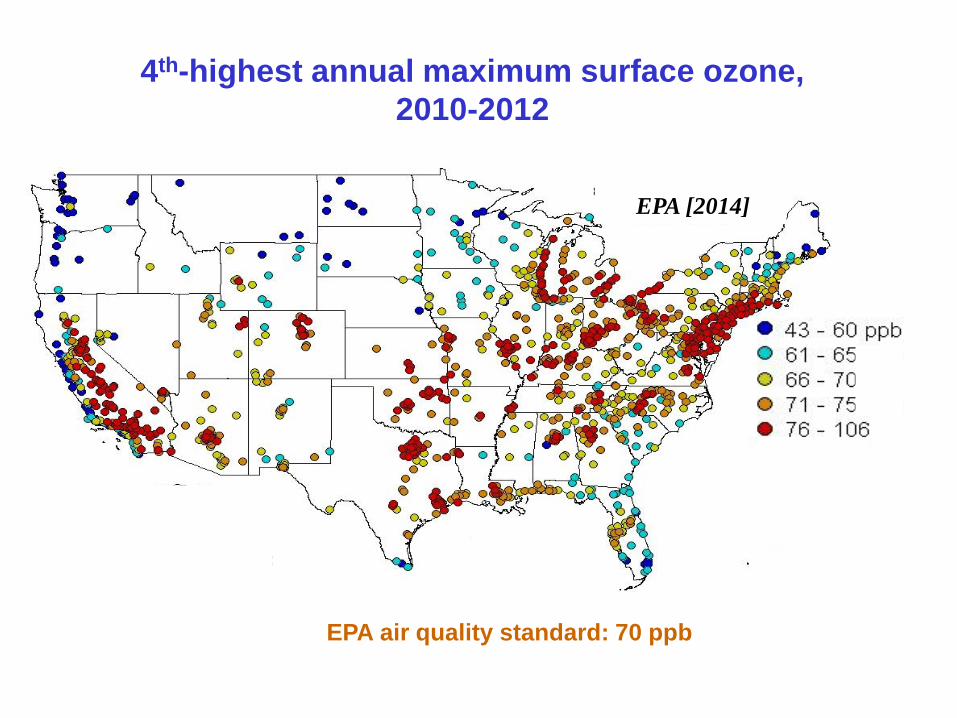
4th-highest annual maximum surface ozone,2010-2012
EPA [2014]
EPA air quality standard: 70 ppb
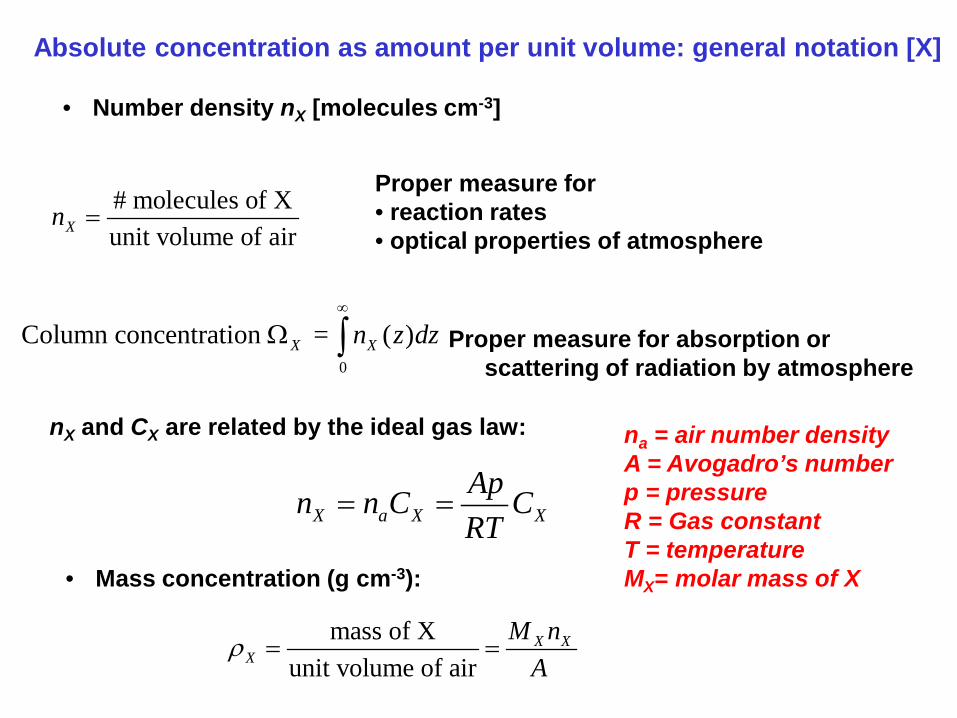
Absolute concentration as amount per unit volume: general notation [X]
# molecules of Xunit volume of airXn =
Proper measure for• reaction rates• optical properties of atmosphere
0
Column concentration = ( )X Xn z dz∞
Ω ∫ Proper measure for absorption or scattering of radiation by atmosphere
nX and CX are related by the ideal gas law:
X a X XApn n C CRT
= =
• Mass concentration (g cm-3):
mass of Xunit volume of air
= = X XX
M nA
ρ
na = air number densityA = Avogadro’s numberp = pressureR = Gas constantT = temperatureMX= molar mass of X
• Number density nX [molecules cm-3]
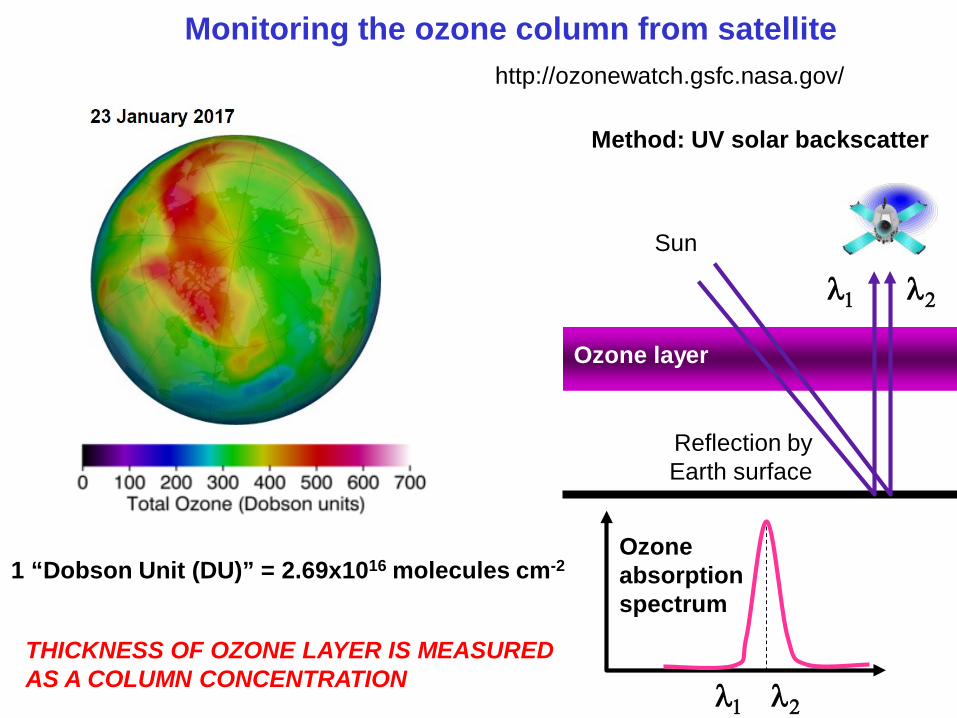
Monitoring the ozone column from satellite
Method: UV solar backscatter
Reflection by Earth surface
λ1
λ2
Ozone layer
Ozoneabsorptionspectrum
λ1
λ2
1 “Dobson Unit (DU)” = 2.69x10¹⁶ molecules cm-2
THICKNESS OF OZONE LAYER IS MEASURED AS A COLUMN CONCENTRATION
http://ozonewatch.gsfc.nasa.gov/
Sun
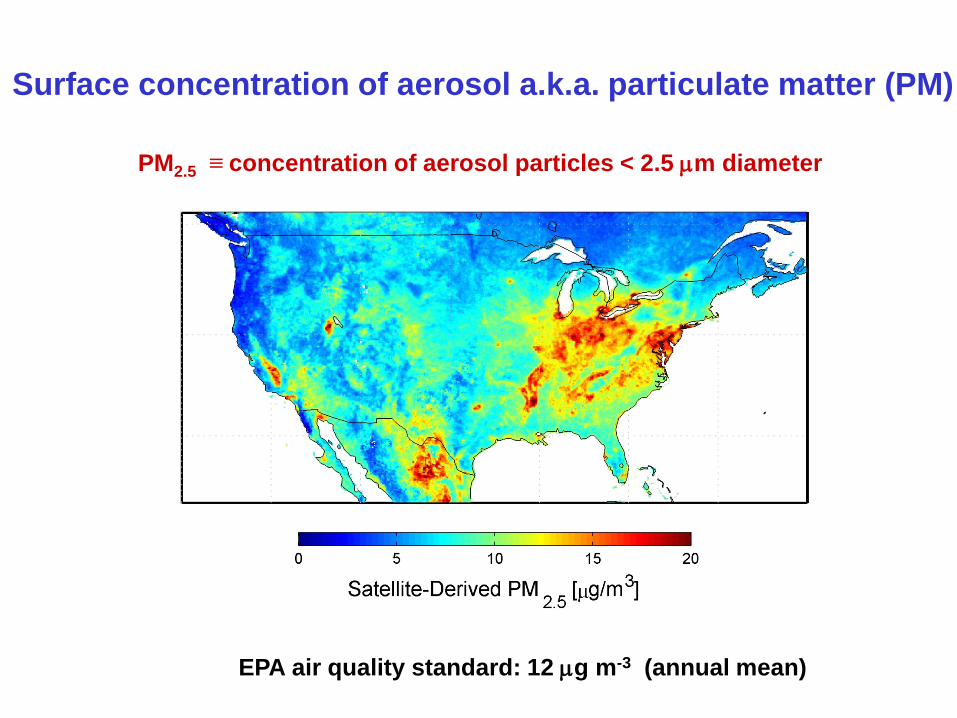
Surface concentration of aerosol a.k.a. particulate matter (PM)
PM2.5 ≡ concentration of aerosol particles < 2.5 µm diameter
EPA air quality standard: 12 µg m-3 (annual mean)

Absolute concentration as partial pressure px [Pa]
Dalton’s law: X Xp C p= Proper measure for phase change(such as condensation of water vapor)
Evaporation of liquid water from a pan:
Add a lid:• escaping water molecules collide on lid and return to surface; collision rate measures pH2O
• eventually, flux escaping = flux returning : saturation (pH2O,SAT)
• T pH2O,SAT
No lid: water molecules escape from pan to atmosphere (evaporation)
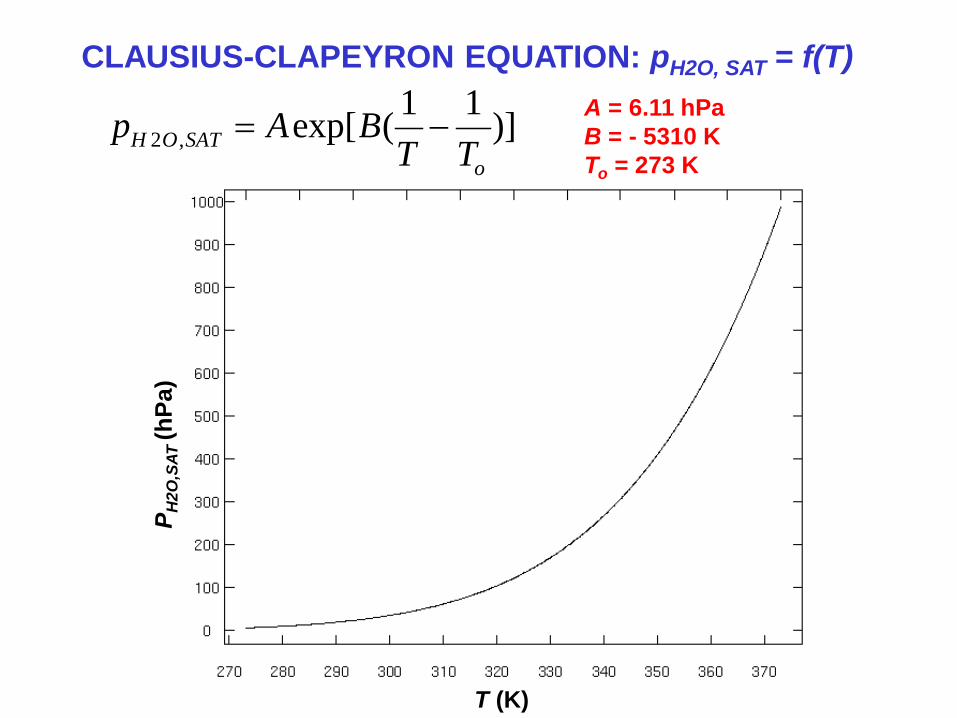
CLAUSIUS-CLAPEYRON EQUATION: pH2O, SAT = f(T)
2 ,1 1exp[ ( )]H O SAT
o
p A BT T
= − A = 6.11 hPaB = - 5310 KTo = 273 K
P H2O
,SAT
(hPa
)
T (K)

Phase rule of physical chemistry
The number n of independent variables determining the equilibrium partitioning of c species between q phases is given by
n = c + 2 - q
Consider pure H2O system: • One species ⇒ c = 1• Two variables: pH2O and T
For water vapor at equilibrium with liquid water, q = 2 ⇒ n = 1⇒ at given T there is only one pH2O at which you have equilibrium
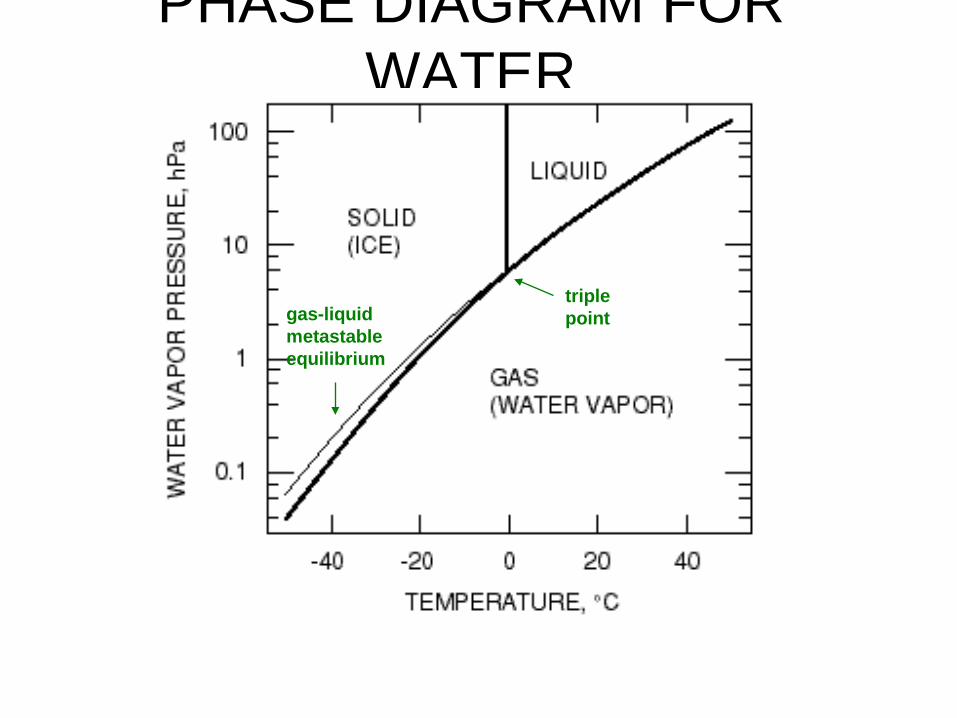
PHASE DIAGRAM FOR WATER
triple pointgas-liquid
metastableequilibrium
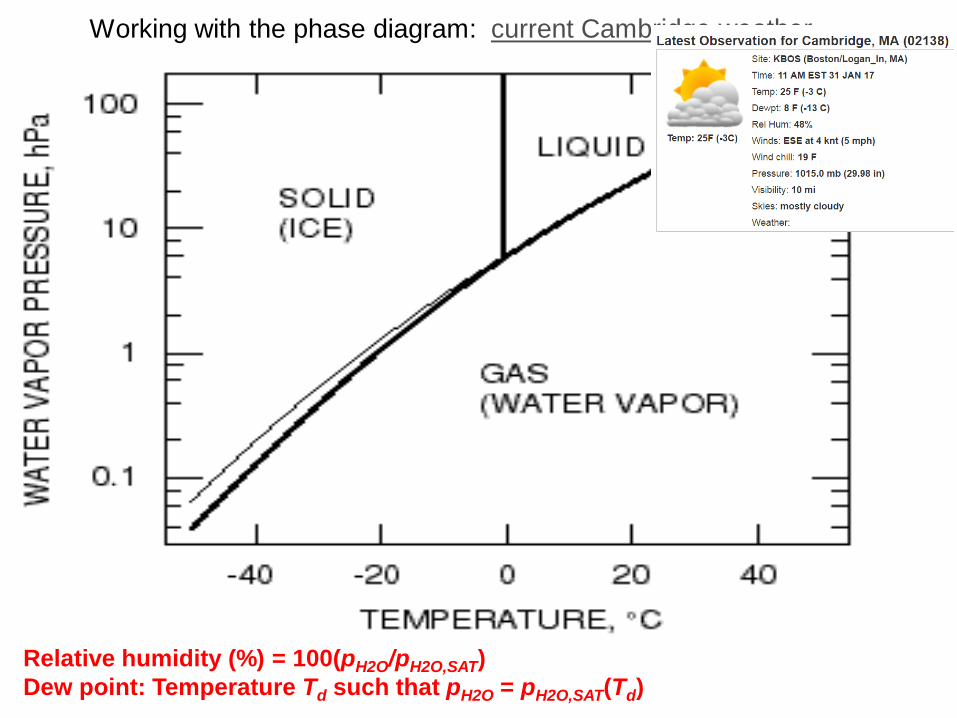
Working with the phase diagram: current Cambridge weather
Relative humidity (%) = 100(pH2O/pH2O,SAT)Dew point: Temperature Td such that pH2O = pH2O,SAT(Td)
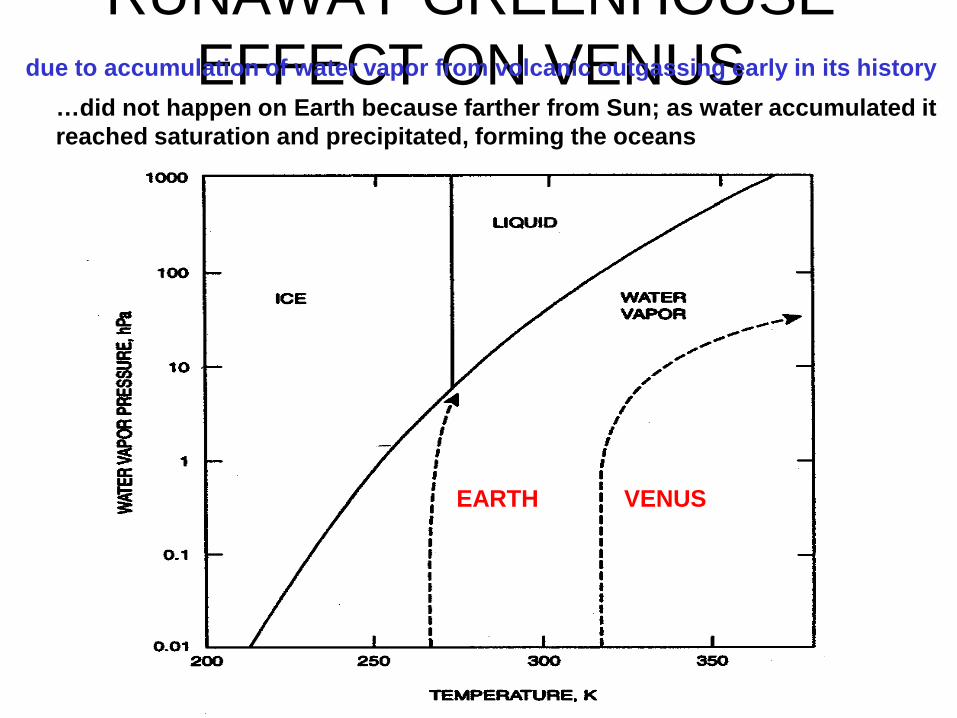
RUNAWAY GREENHOUSE EFFECT ON VENUS
EARTH VENUS
due to accumulation of water vapor from volcanic outgassing early in its history …did not happen on Earth because farther from Sun; as water accumulated it reached saturation and precipitated, forming the oceans
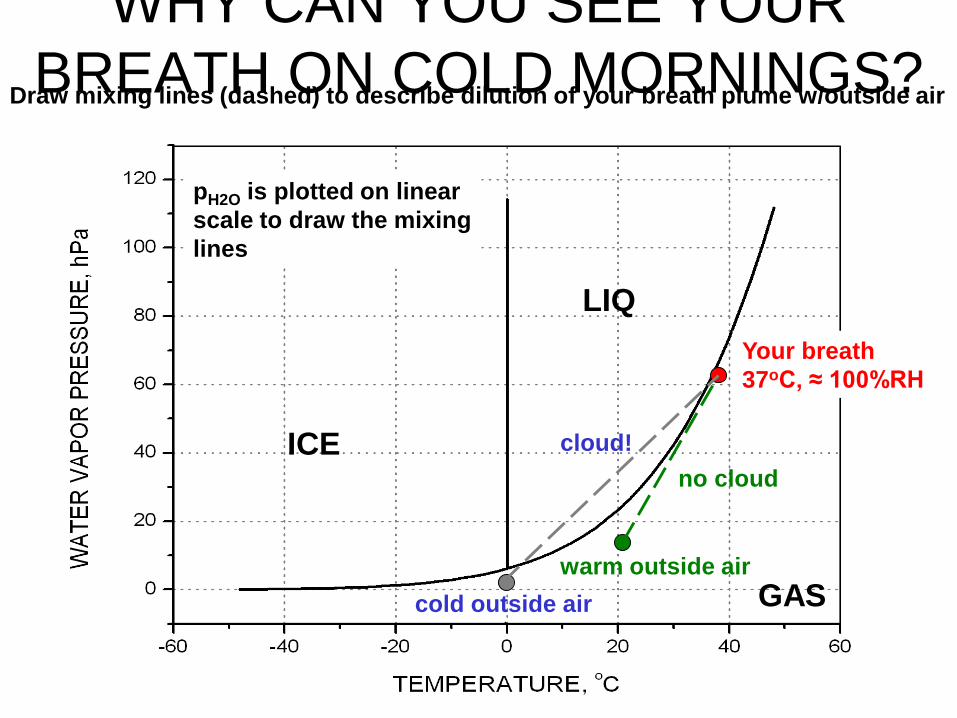
WHY CAN YOU SEE YOUR BREATH ON COLD MORNINGS?Draw mixing lines (dashed) to describe dilution of your breath plume w/outside air
Your breath37oC, ≈ 100%RH
warm outside air
no cloud
cold outside air
cloud!
pH2O is plotted on linearscale to draw the mixinglines
ICE
LIQ
GAS
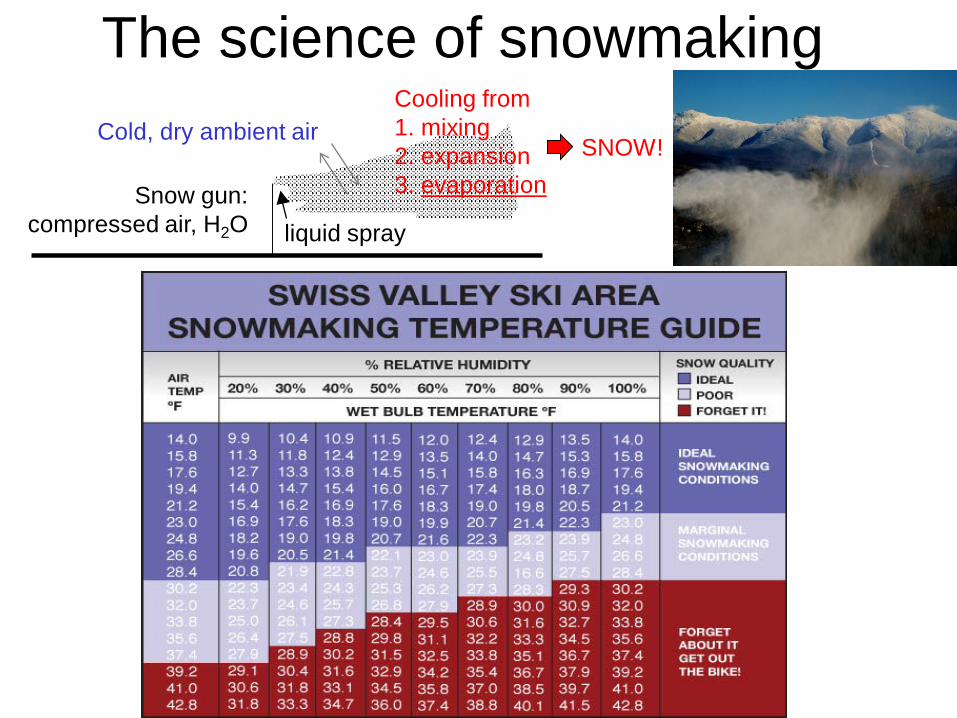
The science of snowmaking
Snow gun:compressed air, H2O
Cooling from1. mixing2. expansion3. evaporation
SNOW!Cold, dry ambient air
liquid spray
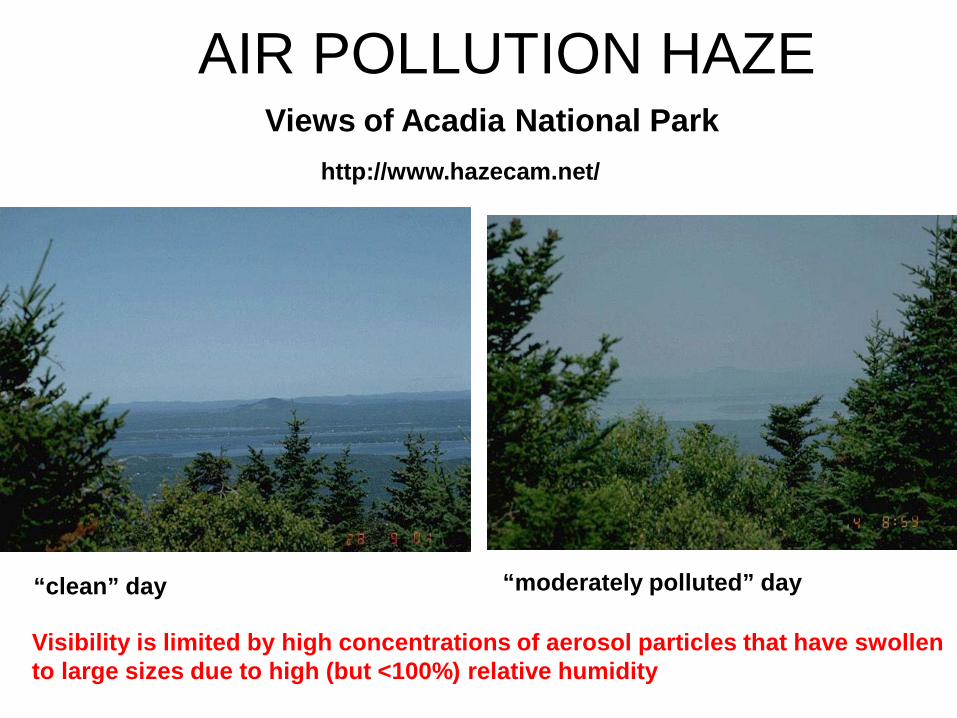
AIR POLLUTION HAZE
•
“clean” day “moderately polluted” day
http://www.hazecam.net/
Views of Acadia National Park
Visibility is limited by high concentrations of aerosol particles that have swollen to large sizes due to high (but <100%) relative humidity
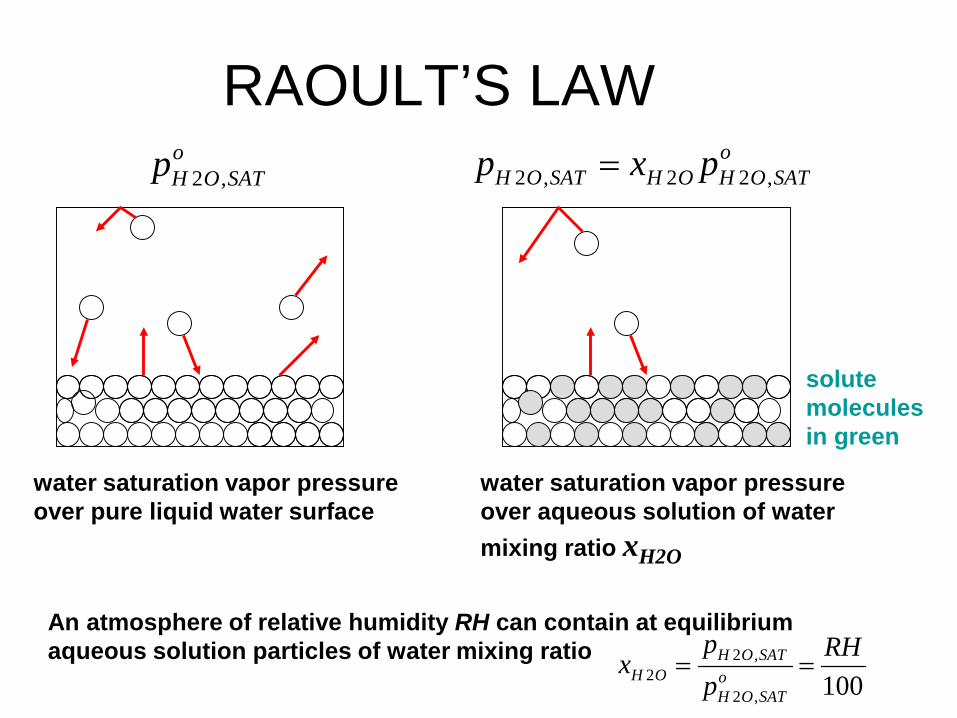
RAOULT’S LAW
water saturation vapor pressureover pure liquid water surface
water saturation vapor pressureover aqueous solution of watermixing ratio xH2O
2 ,oH O SATp 2 , 2 2 ,
oH O SAT H O H O SATp x p=
An atmosphere of relative humidity RH can contain at equilibrium aqueous solution particles of water mixing ratio 2 ,
22 , 100
H O SATH O o
H O SAT
p RHxp
= =
solutemoleculesin green
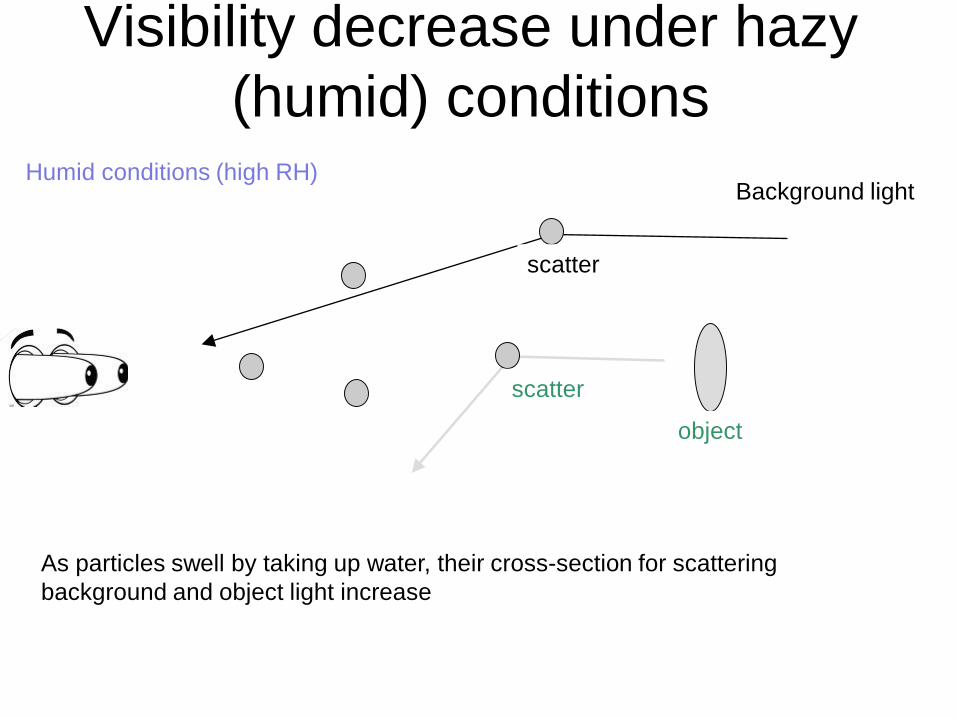
Visibility decrease under hazy (humid) conditions
object
Background lightDry conditions (low RH)Humid conditions (high RH)
scatter
scatter
As particles swell by taking up water, their cross-section for scattering background and object light increase