1 m&a and capital raising in a difficult environment from heaven to hell and back?
Post on 21-Dec-2015
216 views
TRANSCRIPT

1
M&A and Capital Raising in a Difficult EnvironmentFrom Heaven to Hell and back?

2
2007 – A Banker’s Dream
Extraordinary financing environment
M&A peak in the chemical industry
High valuation from significant demand by both strategic and financial buyers
Source: RSM EquiCo Capital Markets* Data as of March 17, 2008; subject to change pending future updates
42
54
30 3444
73 7281
22
40
$0
$20
$40
$60
$80
$100
'00 '01 '02 '03 '04 '05 '06 '07 '08 Pending
M&A Trough
Climb in M&A activity
CHEMICAL INDUSTRY M&A – DOLLAR VALUE ($ in billions)

3
Increasing Valuations
Chemical Industry and middle market valuations climbed from the dip in 2001 – 2002 time period Competitive bidding environment with financial buyers adding to the buyer pool Overall good economy
Source: RSM EquiCo Capital Markets* Data as of March 17, 2008; subject to change pending future updates
7.97.3 7.1
7.5 7.78.1
7.68.2
4 x
5 x
6 x
7 x
8 x
9 x
10 x
'00 '01 '02 '03 '04 '05 '06 '07
7.6 7.57.1 6.9
5.9
6.77 7.2
8.58.1
9.3
4 x
5 x
6 x
7 x
8 x
9 x
10 x
1997 1998 1999 2000 2001 2002 2003 2004 2005 2006 H12007
Source: Standard & Poor’s* For deals with EBITDA under $50 million
CHEMICAL INDUSTRY M&A VALUATION (EV/EBITDA) AVG. PRICE MULTIPLES PAID BY SPONSORS (EV / EBITDA)
4
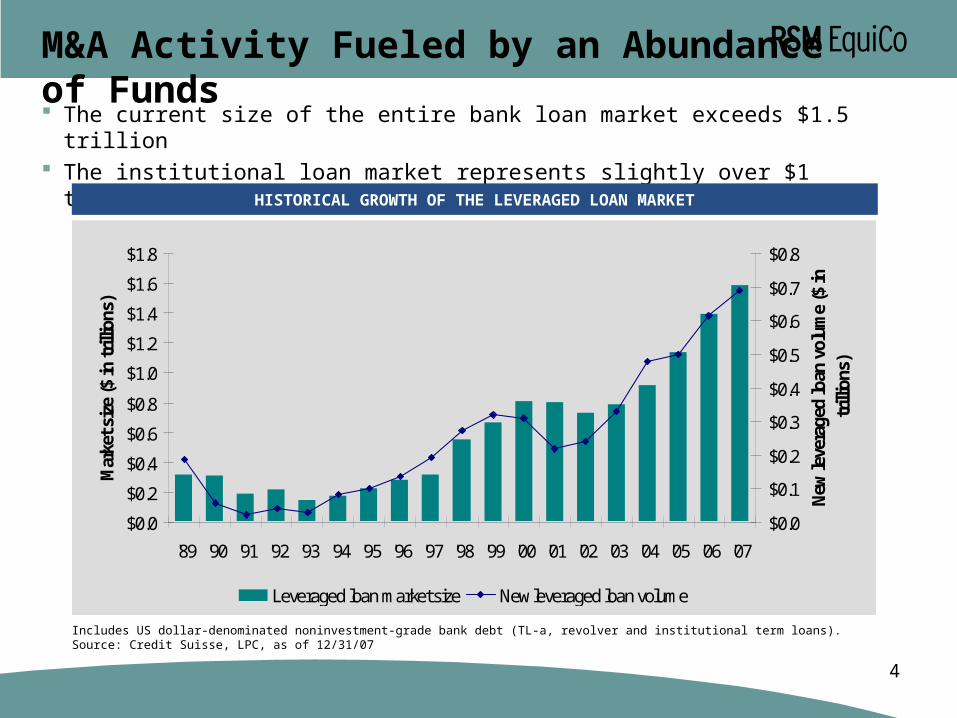
M&A Activity Fueled by an Abundance of Funds
The current size of the entire bank loan market exceeds $1.5 trillion The institutional loan market represents slightly over $1 trillion
HISTORICAL GROWTH OF THE LEVERAGED LOAN MARKET
$0.0
$0.2
$0.4
$0.6
$0.8
$1.0
$1.2
$1.4
$1.6
$1.8
'89 '90 '91 '92 '93 '94 '95 '96 '97 '98 '99 '00 '01 '02 '03 '04 '05 '06 '07
Mar
ket s
ize
($ in
trill
ions
)
$0.0
$0.1
$0.2
$0.3
$0.4
$0.5
$0.6
$0.7
$0.8
New
leve
rage
d lo
an v
olum
e ($
in
trill
ions
)
Leveraged loan market size New leveraged loan volume
Includes US dollar-denominated noninvestment-grade bank debt (TL-a, revolver and institutional term loans).Source: Credit Suisse, LPC, as of 12/31/07

5
M&A Activity Fueled by an Abundance of Funds
Through the third quarter of 2007, $199.4 billion was raised by U.S. private equity firms, well ahead of the $154.1 billion raised in the first three quarters of 2006 (source: Private Equity Analyst)
In 2007, over $500 billion was raised by private equity firms worldwide
GLOBAL PRIVATE EQUITY CAPITAL RAISED ($ in billions)
$0
$100
$200
$300
$400
$500
$600
1998 1999 2000 2001 2002 2003 2004 2005 2006 2007
Source: Thomson Financial, Private Equity Intelligence

6
However, the world changed in July…
Appetite for large leveraged loans dried
up suddenly as banks were overloaded
and sub-prime related troubles became
more apparent
In the first 6 months of 2007, $846.8
billion of transactions were conducted in
the U.S. while second half figures fell to
only $479.2 billion (source: Nixon
Peabody)
$300 billion in deals were overhanging
and are still being worked out
This number decreased to $180 billion in
April 2008
Alltel
US Borrowers
$23.2B
Amount Comment
- Transaction launch delayed
Cablevision $9.2B - Transaction launch delayed
Chrysler $12.0B - Pulled from market; bridge financing still in place
Clear Channel $22.1B - Transaction launch delayed
First Data $16.0B - Transaction launch delayed
Harrah’s Ent. $9.0B - Transaction launch delayed
Chrysler Financial $8.0B - Transaction still seeking clearing price/structure
Sallie Mae $16.5B - Transaction launch delayed
Alliance Boots £9.02B - £7.27B of Sr debt withdrawn; flexed jr capital
Maxeda €1.08B - Pulled from market
Springer Sci & Business Media
€1.77B - Pulled from market
Telenet €2.30B - Out to relationship banks; determining structure
Paroc €0.83B - Flexed: Increased margins & offering 50bps OID
phs €1.03B - Reduced amount of facilities. Flexed: Increased margins & offering 50bps OID
Camaieu €1.17B - Reduced amount of facilities during syndication
Zodiac €1.18B - Incr. Margins, added 100bps OID, tightened doc’s
European Borrowers
Expedia $3.0B - Share buy back reduced to $750MM
NOTABLE TRANSACTION’S PULLED/DELAYED

7
What happened by the end of 2007?
A rapid succession of events
The market was overheated
Hedge funds, which had become a source of senior sub and equity, disappeared; they were story-
friendly and aggressive
CLO’s disappeared
High yield market dried up
Banks were left with “Bridges to Nowhere” and immediately tightened their standards
The CP market froze
There were no significant transactions in August
The U.S. central banks intervened
Markets were hit on both sides of the Atlantic

8
What happened by the end of 2007? (continued)
The summer events were unusual in that it was liquidity and not credit quality which spooked the
market
At below 1%, the default rate was extremely low compared to 5% to 6% during the 2002 credit
crunch
In September, things looked better and we seemed to head towards normalcy
However, towards the end of 2007, the market experienced a second wave of pessimism which
continued into 2008
Further write offs and then Bear Stearns fails

9
2008 – A Banker’s Nightmare
Financing environment for mid to large-caps is very difficult
M&A for deals above $250 million are greatly impacted by financing difficulties
However, lower to middle market deals still healthy
$0
$50
$100
$150
$200
$250
1Q03
3Q03
1Q04
3Q04
1Q05
3Q05
1Q06
3Q06
1Q07
3Q07
1Q08
LEVERAGED LOAN ISSUANCE ($ in billions)
Source: Reuters LPC, Dealscan, LSTA

10
Back? Signs of Life
In April 2008, we started to see signs of life
– News that Citi is selling $10 billion of their leveraged loans and $2 billion of bond bridges has driven
market optimism
– High yield bond market is starting to gain momentum with 6 new issues priced in April
– Quarter-end amortization along with increasing repayments means cash is starting to build in investor
accounts
M&A activities are resuming
– May 2, 2008: Avista Capital Partners and Nordic Capital Fund VII agreed to acquire ConvaTec from
Bristol-Myers Squibb Company for approximately $4.1 billion
– April 28, 2008: Mars Inc., with financial support from Warren Buffett's Berkshire Hathaway Inc.,
announced plans to acquire The Wm. Wrigley Jr. Co. for $23 billion
– April 23, 2008: Liberty Mutual Group (“Liberty Mutual”) will acquire Safeco for approximately $6.2 billion

11
Middle Market: The Safe Harbor?
Lending activity dropped, but less dramatically than the large corporate market
There is no market risk and no syndication risk
Small is the sweetspot – the majority of the deals that will close in the next 12 months will be below
$500 million in value (source: Nixon Peabody survey)
Foreign buyers are now buying and out-bidding ‘local’ buyers constrained by debt capacity
As some people have said America is on sale and larger acquisitions can be afforded by foreign
buyers

12
Middle Market: The Safe Harbor? (continued)
There is bifurcation in the market
During 4Q07 there were 3339 deals worth $500 million or less and only 156 deals worth
greater than $1 billion
Usually there are 4 times as many large deals then small deals

13
Expectations in Today’s Debt Market
1) Source: Joint study from Oxford, Urbana Champaign and Stockholm Universities
Deal Component July 20071 September 20071 RSM’s Experience Today
Senior Debt (X EBITDA) 3.0 x – 4.0 x 2.5 x – 3.25 x 2.0 x – 3.0 x
Total Debt (X EBITDA) 4.5 x – 5.5 x 4.0 x – 4.5 x 3.0 x – 4.0 x
Sub Debt Pricing 12 – 16% 15 – 18% 11 – 14%
Warrants Feature Very Unusual Potentially Common
Toggle Feature (Cash / PIK) Potentially Very Unusual Gone
Minimum Equity Contribution 15 – 20% 25 – 30% 30 – 45%
Recap Liquidity Abundant Available Raises Red Flags

14
LIBOR’s Downward Trend
4.8%
5.2%4.9%
5.7%5.2%
3.9%
3.1% 3.1%2.5% 2.7%
2.0%
2.5%
3.0%
3.5%
4.0%
4.5%
5.0%
5.5%
6.0%
Sep-03
-07
Sep-20
-07
Oct-09
-07
Oct-26
-07
Nov-14
-07
Dec-03
-07
Dec-20
-07
Jan-0
9-08
Jan-2
8-08
Feb-14
-08
Mar-04
-08
Mar-21
-08
Apr-09
-08
EVOLUTION OF LIBOR
Launch Date Issuer Corp Ratings Implied Yield LIBOR Floor
8-Apr-08 Macrov ision Technologies' B3/B+ L+450 3.5% Libor Floor
1-Apr-08 Local Insight Yellow Pages B2/B L+550 3.75% Libor Floor
24-Mar-08 New port Telev ision - L+625 3.0% Libor Floor
24-Mar-08 Venture Transport - L+550 3.25% Libor Floor
17-Mar-08 Merisant Caa3/CCC L+875 3.5% Libor Floor
13-Mar-08 Abitabi-Consolidated B2/B- L+900 3.5% Libor Floor
Source: S&P Leveraged Commentary and Data, RBC Capital Markets

15
New Lenders Pick Up the Slack
LARGE MIDDLE MARKET INSTITUTIONAL LEAD ARRANGER VOLUME ($ in millions)
LARGE MIDDLE MARKET INSTITUTIONAL LEAD ARRANGER VOLUME ($ in millions)
$0$100$200$300$400$500$600
GECC
Barclay
s
Lehm
an
Wachovi
a CITBNP
Bank o
f Irela
ndHSBC MS
Capital
Source
1Q08
Source: Reuters Loan Pricing Corporation/DealScan
$0$500
$1,000$1,500$2,000$2,500$3,000
Credit S
uisse
Bank o
f Ameri
ca
JP M
organ
Goldman Sac
hs
Merrill L
ynch
Lehm
an
Wells Farg
o
Wachovi
aGECC
UBS
1Q06 1Q07
Jumbo LBOs struggled to syndicate in 1Q08 LBO lending fell 88% in 1Q08 to $5.4 billion from $45.9 billion in 1Q07 The largest LBO loan to clear market was just over $1 billion Make-up of lead arrangers shifts dramatically as Institutional volume declines New players are emerging as corporates now represent ~60% of new borrowers, up from ~20%
during Q1 2007:

16
Situation in Q1 2008
Banks were no longer liquid; for the first time the whole banking system was in doubt
Loan default is still relatively low
– 1.50% at the end of Feb.
– 1.83% through Mar.
But the mark to market of collateralized sub-prime loans triggered huge write-downs
This resulted in capital adequacy issues
This is being worked out as we speak through:
– Foreign investors
– Going to market by issuing preferred convertibles and equity

17
Summary
Financing is available under tighter conditions
The market has not dried out; overhang is being worked out; however, pricing is going up
Sponsored M&A lending declined 39% from the previous quarter and 60% from the first
quarter of 2007
With the continued availability of funds, what is happening to the M&A market and valuations?

18
2007 M&A Valuation & Volume
Good companies are still obtaining high multiples
Average EBITDA multiples for middle market companies declined from 6.5x in the first half of
2007 to 6.0x in the second half
In the $10 million to $25 million deal size, there was no appreciable decline in EBITDA multiple
which is holding at 5.7x
In the $25 million to $100 million deal size, EBITDA multiples dropped from 7.0x to 6.0x
Enterprise Value 1st Half 2007 2nd Half 2007
$10mm - $25mm 5.7x 5.7x
$25mm - $50mm 7.0x 6.0x
$50mm - $100mm 6.9x 6.0x
$100mm - $250mm 7.8x 7.4x
Total Enterprise Value/EBITDA
Source: Mergers & Acquisitions Magazine
VALUATION MULTIPLES
19
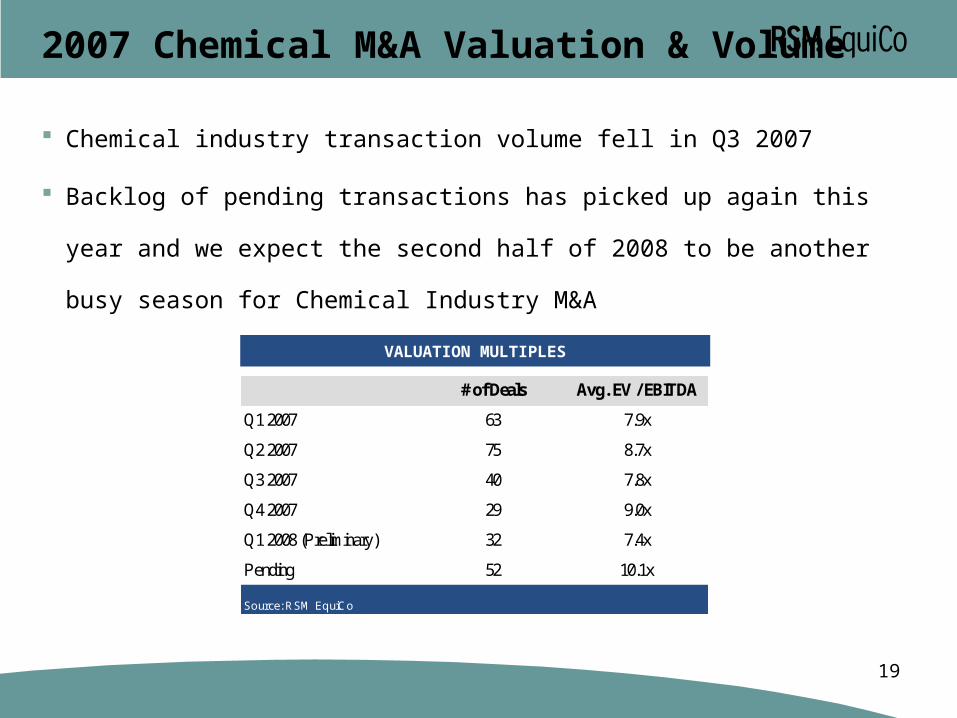
2007 Chemical M&A Valuation & Volume
Chemical industry transaction volume fell in Q3 2007
Backlog of pending transactions has picked up again this year and we expect the second half of
2008 to be another busy season for Chemical Industry M&A
# of Deals Avg. EV / EBITDA
Q1 2007 63 7.9x
Q2 2007 75 8.7x
Q3 2007 40 7.8x
Q4 2007 29 9.0x
Q1 2008 (Preliminary) 32 7.4x
Pending 52 10.1x
Source: RSM EquiCo
VALUATION MULTIPLES

20
2007 Chemical M&A Valuation & Volume (continued)
Average valuations will increase in the second half of 2008 as some large transactions close:– Agrium / UAP (closed May 7, 2008) – Carlyle / Neochimiki (closed May 9, 2008) – Incitec Pivot / Dyno Nobel – Henkel / ICI Electronic Materials
Sub-$100 million deals on average are discounted up to 2x EBITDA compared to deals $500 million and above
10.0
7.8
8.58.8 8.8
9.6
9.09.5
10.5
6.7
7.57.1 7.1 7.3
7.97.5 7.5
9.3
7.1
5.7
6.4
7.07.3 7.3
6.9
7.5
6.3
4x
5x
6x
7x
8x
9x
10x
11x
'00 '01 '02 '03 '04 '05 '06 '07 Pending
Deals >$500mm Deals $100mm - $500mm Deals <$100mm
VALUATION MULTIPLES
Source: RSM EquiCo

21
Closed Target Acquirer
Transaction Value
($mm) Revenue EBITDA
01/28/2008 Remaining 40% Stake in Mchem * Matrix Laboratories - $34.8 -
01/04/2008 FineTech Laboratories RxElite Inc. $19.2 $6.2 -
11/30/2007 Fine Chemicals (PPG) * ZaCh Systems $65.0 - $8.5
10/30/2007 SF Chem (Capvis) * CABB (AXA Private Equity) - $150.0 $22.5
07/02/2007 Ariane Orgachem (Aurangabad) & Ferico Laboratories (Navi Mumbai)
Albany Molecular Research Inc. $11.0 $5.0 -
06/18/2007 5 Fine Chemical Businesses * Argos Soditic - $105.8 -
06/14/2007 Particle and Coating Technologies KV Pharmaceutical - - -
01/09/2007 78.6% Stake in Group Novasep * Glide Buyout, Banexi & Management $544.0 $544.0 $85.0
12/31/2006 Remaining 39.9% Stake in Virbac Corp. * Virbac S.A. $44.0 $80.8 $10.5
12/02/2006 Be-Tabs Pharmaceuticals * Ranbaxy Labortoraies $70.0 $31.8 $9.1
10/25/2006 PLIVA D.D. Barr Pharmaceuticals, Inc. $2,418.7 $1,109.1 $268.6
10/22/2006 Connetics Corporation Stiefel Laboratories $625.0 $150.0 -
10/18/2006 Sharp & Dohme Ponders End, U.K. Plant * Aesica Pharmaceuticals - - -
09/07/2006 CarboGen-AMCIS (Solutia) * Dishman Pharmaceuticals and Chemicals $74.5 $68.0 $12.0
08/18/2006 Chemtec Leuna * Minafin - $15.0 -
07/30/2006 Biopharmaceutical Facility (Dow) Alexion Pharmaceuticals - - -
07/05/2006 West Coast Ingredients J.M. Huber Corporation - - -
06/26/2006 Fine Chemicals Business (Clariant) * TowerBrook Capital Partners $56.5 $169.4 $5.6
05/23/2006 Active Pharma Ingredient and Intermediates Business (Lubrizol)
Auctus Management $20.0 $30.0 -
03/13/2006 Novasep's Rohner Subsidiary (Rockwood Specialties)
* Arques Industries - - -
02/01/2006 RPS Custom Synthesis (Rhodia) * Shasun $0.0 - -$20.0
Avg. EV/EBITDA 8.6x
Transaction Details ($mm)
Fine Chemical Transactions
* Foreign BuyerSource: RSM EquiCo

22
What Will Happen?
Will M&A dry up?– No: Strategic buyers have very strong balance sheets, un-drawn lines of credit and very good stock
valuations and earnings
Will Private Equity decline?– In 2000 – 2002, total private equity deals averaged $30 billion in the U.S. and Europe
– In 2006 we saw figures of $233 billion in the U.S. and $151 billion in Europe
– There is $250 billion waiting to be invested and most PE firms are successfully raising larger funds
23
What Will Happen? (continued)
Private equity maintains its advantages
– Do not have to please the analyst community
– No tyranny of quarterly earnings
– No Sarbanes Oxley
– They have in some cases become “hybrids”
– They often have strategic horizons which are longer than traditional strategics
– They are very quick
Strategic buyers will probably regain some advantage
Private equity hybrid platforms allow them to generate the synergies to be competitive against
strategics (i.e. Hexion / Huntsman)
2002 to 2007: the “golden age” of private equity
24
Conclusion
There is evidence that lenders are redirecting funds to the middle market
– The banks to avoid syndication risk and still generate fees
– The mezzanine players who have been starved for the past year and have an abundance of funds
– BDC’s are canvassing the market with their “one-stop-shop” financing
Multiples have come down between ½ to 1 turn depending on the sector
– This means we are going back to 2006 which was an exciting year
– The froth is gone, sanity has come back
– We are open for business in the middle market

25
RSM EquiCo M&A Activity
TOTAL LIQUIDITY CREATED BY RSM EQUICO GROWTH IN RSM M&A ADVISORY ACTIVITY
618
24 2636
52 47
28
38
0
10
20
30
40
50
60
70
CY2001 CY2002 CY2003 CY 2004 CY 2005 CY 2006 CY 2007 CY 2008
$0
$500
$1,000
$1,500
$2,000
$2,500Pending
# Transactions
Deal Value
Tota
l Dea
l Val
ue (m
illion
s)
Source: RSM EquiCo as of 5/11/08
81 314283
513
792
1,657
5,2921,650
$0
$1,000
$2,000
$3,000
$4,000
$5,000
$6,000
CY 2001 CY 2002 CY 2003 CY 2004 CY 2005 CY 2006 CY 2007 Total
Rank Financial Advisor Deals
1 Houlihan Lokey Howard & Zukin 632 Jefferies Group, Inc. 56
3 RSM Equico Capital Markets LLC 48
4 Citigroup, Inc. 47
5 UBS AG 42
6 Goldsmith, Agio, Helms & Co. 36
7 Goldman Sachs & Co. 35
8 Morgan Stanley 32
9 BB&T Corp. 31
9 Keefe, Bruyette & Woods, Inc. 31
TOP U.S. ADVISORS ($1 - $100m deal value)

26
RSM Global Presence
RSM Hemmelrath Gruppe(Germany)22 offices
1,000 employees
RSM Nelson Wheeler(Hong Kong)Four offices
100 employees
RSM Bird Cameron(Australia)30 offices
500 employeesRSM France
(France)23 offices
1,600 employees
RSM Audihispana(Spain)
14 offices615 employees
RSM McGladrey & McGladrey & Pullen
(U.S.)100 offices
4,000 employees
American ExpressTax & Business Services
2,500 employees
RSM EquiCo(U.S.)
Four offices150+ employees
RSM EquiCo(UK)
One officeFive employees
RSM EquiCo(India)
One office25 employees
RSM Hemmelrath Gruppe(China)
One Office200 employees
RSM Stone Forest(Singapore & China)
400 employees
RSM Bently Jennison(UK)
14 offices1,000 employees
RSM Brazil(Brazil)
6 offices
RSM Mexico(Mexico) 24 offices