1 howard schultz, edward m. riseman, frank r. stolle computer science department university of...
TRANSCRIPT

1
Howard Schultz, Edward M. Riseman, Frank R. StolleComputer Science Department
University of Massachusetts, USA
Dong-Min WooSchool of Electrical EngineeringMyongji University, South Korea
Error Detection and DEM Error Detection and DEM Fusion Using Self-ConsistencyFusion Using Self-Consistency
7th IEEE International Conference onComputer Vision
September 20-27, 1999 Kerkrya, Greece

2
Long-Term Objectives Generate 3D terrain models from multiple,
overlapping images (including video sequences) Accurate - Photogrammetric applications Robust with respect to:
– Widely spaced cameras– Oblique viewing– Occlusions– Non-lambertian surface patches
Automatic Efficient

3
Long-Term Objectives Terrain models include an estimate of geospatial
uncertainty Detect unreliable elevation estimates associated with
blunders, occlusions, shadows, false matches,... Estimate the RMS elevation errors

4
Environmental Monitoring
Wide-angle video: 1 meter per pixels covers a 3/4 km swath Zoom Video: 10 cm pixels covers a 75 meter swath GPS, IMU & laser altimetery continuously recorded
Wide-angleWide-angle ZoomZoom

Reducing the forest to a simple model of Reducing the forest to a simple model of poles and circlespoles and circles
Biomass Estimation from Counting Trees

Counting Trees in 3D

7
Terrain Reconstruction from a Oblique Views
tilt: 34ºtilt: 53º

8
Real World Problems
Need reliable estimates of accuracy Almost impossible to get sufficient ground
truth Even 1 blunder in 1,00,000 is problematic

9
Work in object space to enable the fusion of multiple DEMs generated from multiple image pairs
Use Laclerc’s Self-Consistency measure to detect unreliable elevation estimates
General Approach

10
Elevation estimates result from two types of correspondences True correspondences, characterized by small,
normally distributed errors that result from– Surface micro structure– Geometric misalignment – Optical distortion
False correspondences (outliers), characterized by large errors resulting from
– random, unrealistic texture matches - Large effects
Small effects

11
We use the UMass Terrain reconstruction system Terrest, which is an implementation of a hierarchical, texture matching algorithm
Terrest produces a set of pixel correspondences, which are stored in a disparity map DRT R denotes the reference image T denotes the target image
The pixels (i,j) in R and (i+D(i,j)) in T view the same surface spot
The process is not symmetric with respect to the reference
and target images, DAB DBA

12
Correspondences
ComputedDEM
TrueDEM
Error
The computed DEM is the sum of the true surface structure and an error term

13
Two ways to compute a DEM from 2 images (A and B). A is the Reference and B is the Target
B is the Reference and A is the Target

14
The intra-frame difference
ZAB-ZBA = AB-BA
Depends only on the computed DEMs
Taking the standard deviation of both sides
(ZAB-ZBA) = (AB-BA)
The distribution (ZAB-ZBA) provides a means to
separate reliable from unreliable elevation estimates

15
If are normally distributed, except for a small number of outliers, and
computed
AB ,BA dependent
AB ,BA independent0 < < 1
uncertaintygeospatial
intra-frame standard deviation
describes the amount of statistical independence depends on surface geometry, viewing geometry, sensor type, optics,
...

16
The tails of the distribution are dominated by unreliable points.
We need a method to estimate (ZAB-ZBA) when the distribution is polluted by unreliable points
Fit the histogram of (ZAB-ZBA) to a Gaussian plus a constant
The numbers hmax, dz0, , h0 are parameters of the fit
,...2,1,0,
2exp 02
20
max
kh
dzdzh k

17
Consider ZAB and ZBA to be unreliable if
|ZAB-ZBA| > n n is a threshold Small values of n pass more points which are less
self-consistent Larger values of n pass fewer points which are
more self-consistent The threshold can be set based on consistency or
the number of points passed

18
A simple algorithm to estimate the optimal DEM Accumulate elevations that have an intra-frame difference less than the threshold.
Keep ZAB and ZBA if ZAB-ZBA n Compute the mean surface Z Go back and add in the elevations close to the mean surface, keep ZAB if Z-ZAB n
re-compute the mean surface Z

19
Example 4 Views

20

21
Z12
Z13
Z14
Z23
Z24
Z34
Z21
Z31
Z41
Z32
Z42
Z43
4 views 12 image pairs 12 DEMs

22
Z12-Z21
Z13-Z31
Z14-Z41
Z23-Z32
Z24-Z42
Z34-Z43
4 images 6 intra-frame differences
ZAB-ZBA
-1.0 0.0 +1.0

23
-2 -1 0 1 2
Self-Consistency [m]
8000
6000
4000
2000
0
Cou
nts
HistogramFitted Curve
hmax
dz0

24
Z12-Z21
Z13-Z31
Z14-Z41
Z23-Z32
Z24-Z42
Z34-Z43
Intra-frame differences after removing unreliable elevations
ZAB-ZBA
-1.0 0.0 +1.0

25
Rendered View
No. of consistent points0123456789 101112
157
0
17
41
84
296
782
2087
5997
19139
74096
288430
926778
DEM
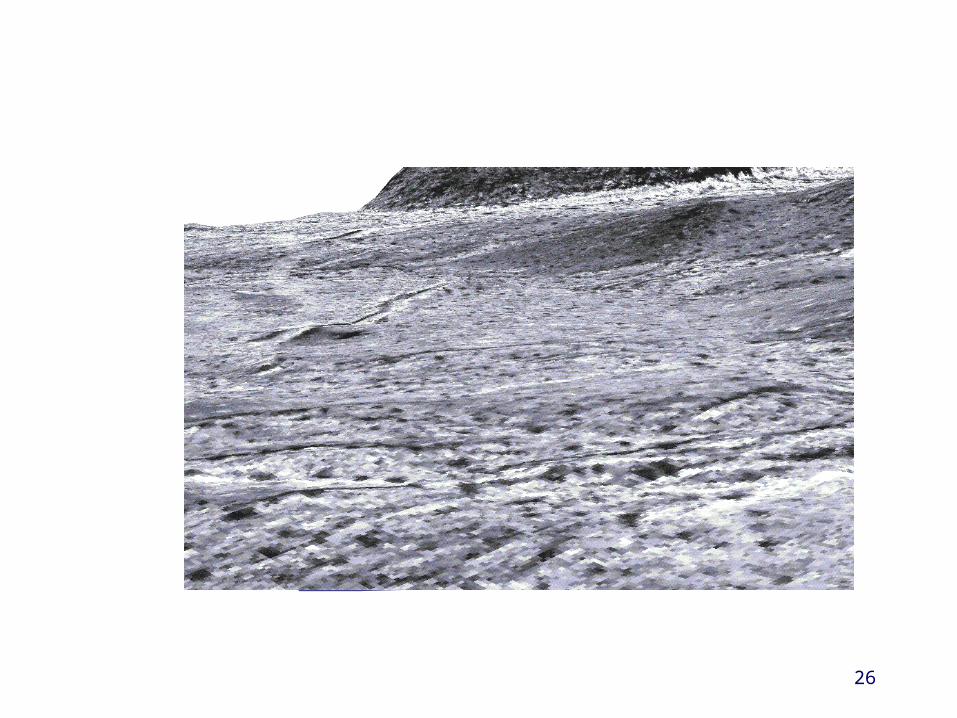
26
27
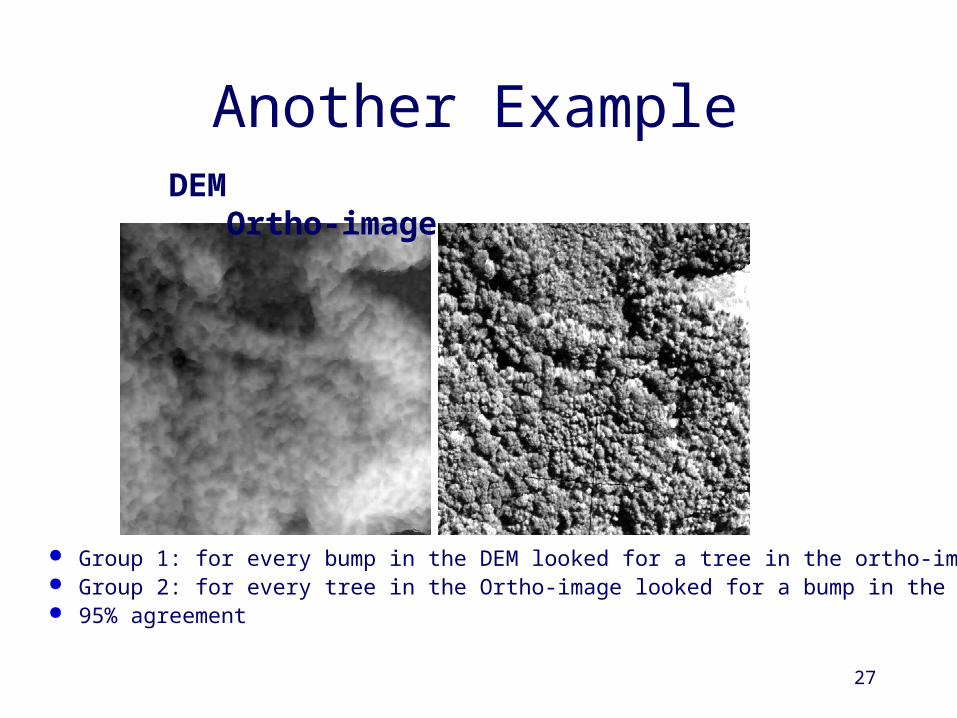
DEM Ortho-image
Tree Counting
Group 1: for every bump in the DEM looked for a tree in the ortho-image Group 2: for every tree in the Ortho-image looked for a bump in the DEM 95% agreement
Another Example

28
Verification Using Photo-realistic Simulation
Comprehensive analysis requires ground truth, which is impossible to collect
Instead use photo-realistic synthetic images Enables analysis from any view point Allows for changes in lighting and surface
texture

29
Start with a previously generated DEM and ortho-image (pseudo ground truth)
Define the viewing geometry Use a photo-realistic rendering program to
generate synthetic images of the pseudo ground truth
Recover the DEM and ortho-image and compare to the pseudo ground truth

30
XC,YC,ZC)
X
Y
Z
X
YZ
X
Y
Z
World Coordinate System
Camera Coordinate System
f

31
Nadir views Oblique views
32
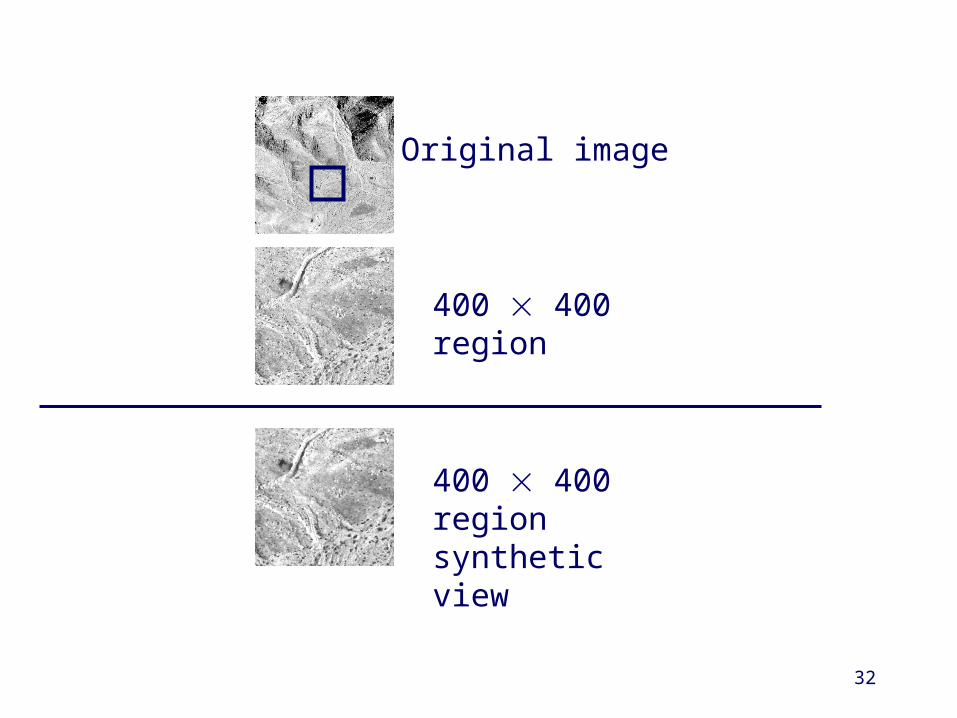
Original image
400 400 region
400 400 region synthetic view

33
Self-consistency and geospatial error statistics as a function of viewing geometry base-to-height ratio (b/h) incidence angle ()
B/h A B (ZAB–ZBA) % Inliers2 cutoff
(Z*–ZAB) (Z*–ZBA)
0.277 0 15 0.451189 91.90 0.332601 0.244706 0.2136850.293 15 30 0.486813 92.50 0.344480 0.330056 0.2606980.575 15 -15 0.311553 91.36 0.163137 0.213822 0.1314430.868 -15 30 0.203503 89.40 0.157535 0.194275 0.1523261.230 30 -30 0.167713 84.24 0.155302 0.188295 0.155993
(Z*–Z)–

34
Reliable Point Mask
A= -30°B= +30°
A= 0°B= +15°
No. ofReliable Points
DEM
RMS error: 17cmElevation range: 762.7 - 885.7mGSD: 35cm 2 consistent point:99.54%

35
Future Directions
Develop models that predict the geospatial uncertainty () from the distribution of self-consistency (ZAB-ZBA)
Use the DEM fusion techniques to generate terrain models from digital video sequences

36

37

38
39

40
Left Mosaic Right Mosaic
3D Rendering