1 extracting the cyclical component from australian multi-factor productivity mark zhang lewis conn
Post on 19-Dec-2015
219 views
TRANSCRIPT

1
Extracting the Cyclical Component from
Australian Multi-Factor Productivity
Mark Zhang
Lewis Conn
2
Background
The Australian Bureau of Statistics (ABS) produces two measures of Multi-Factor Productivity (MFP) growth Growth between adjacent years
Average annual growth between productivity peaks
The later is a more consistent measure of productivity growth
Reserve Bank Statement on Monetary Policy (9th Nov 2006)
"... Australia’s economic expansion has now reached a mature stage in which previously unused productive resources have been substantially re-employed ... this combination suggests that there may have been some underlying slowdown in productivity, either of a cyclical or structural nature, though its extent is difficult to explain. "
3
In theory, at MFP peaks there is full capacity utilisation
By measuring MFP growth from peak to peak we assume we have consistent capacity utilisation
MFP Peaks are currently derived using an 11 term Henderson time series filter (Aspen, 1989)
Separates the business cycle from long term trend
Other economic series (Labour market, business expectations) are also considered when declaring peaks
Deriving Average Annual MFP Growth
4
Objectives of This Study
Improve analysis and understanding of trends in multi-factor productivity
Review, update and explain the choice of method for estimating peaks in the productivity series.
Analysis of impact of methods on the productivity series
Analyse how industries' contribute to the aggregate productivity cycle (Phase 2)
Investigate how capacity utilisation may be taken into account when comparing productivity peaks (Phase3)
5
Filters Considered
11-Term Henderson (1916) - Linear low pass filter
Hodrick Prescott (1980) - Linear low pass filter
Baxter-King (1997) - Band Pass Filter
Beveridge-Nelson (1981) – Model based approach which produces a stochastic trend
Unobserved Components Model – Uses a structural model framework to models trend, cycle, and irregular explicitly
Current ABS Method

6
Frequency versus Model Based
Frequency based filters extract a signal within a predefined range. They implicitly apply a particular model to the data.
Hodrick and Prescott (1997) recommended a smoothing parameter of 1600 based on an empirical investigation of US quarterly GDP data.
Ravn (2002) recommended for annual data reducing the parameter by a factor of four (approx 6.25)
Model based filters fit the model directly to the data. They extract the signal from the estimated model.
Using the UCM to estimate the smoothing parameter 28.66
7
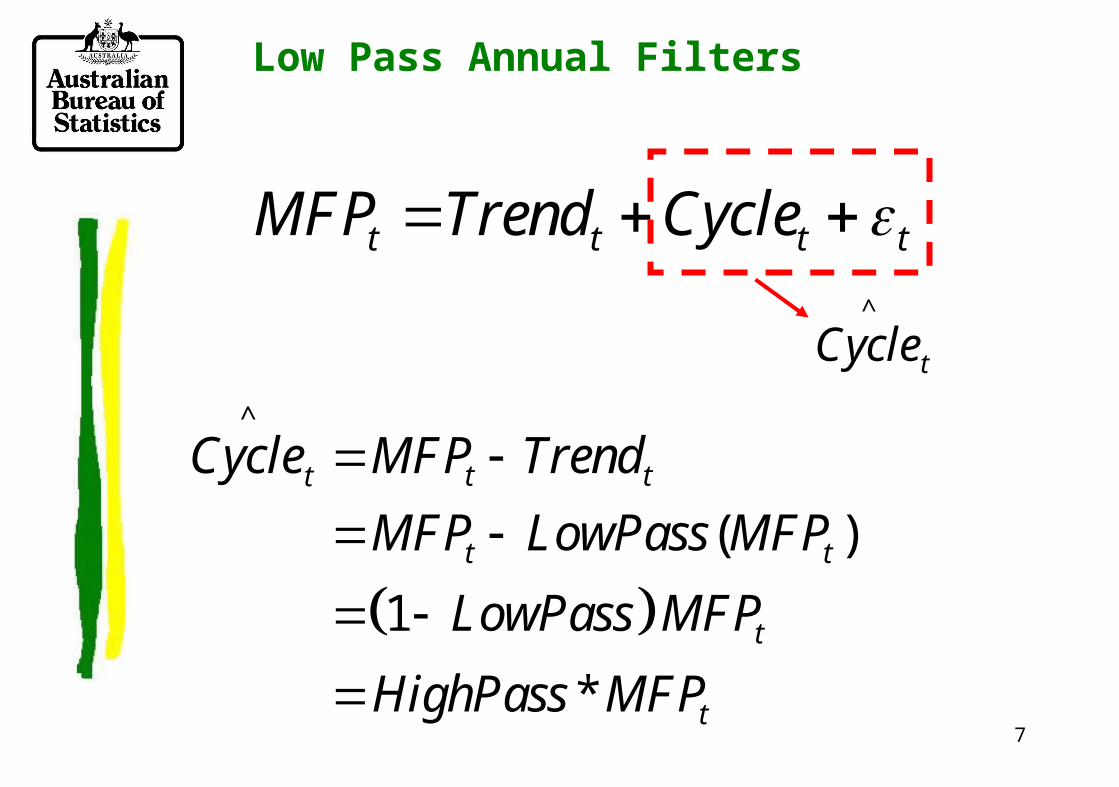
Low Pass Annual Filters
t t t tMFP Trend Cycle ^
tCycle
^
( )
1
*
t tt
t t
t
t
Cycle MFP Trend
MFP LowPass MFP
LowPass MFP
HighPass MFP
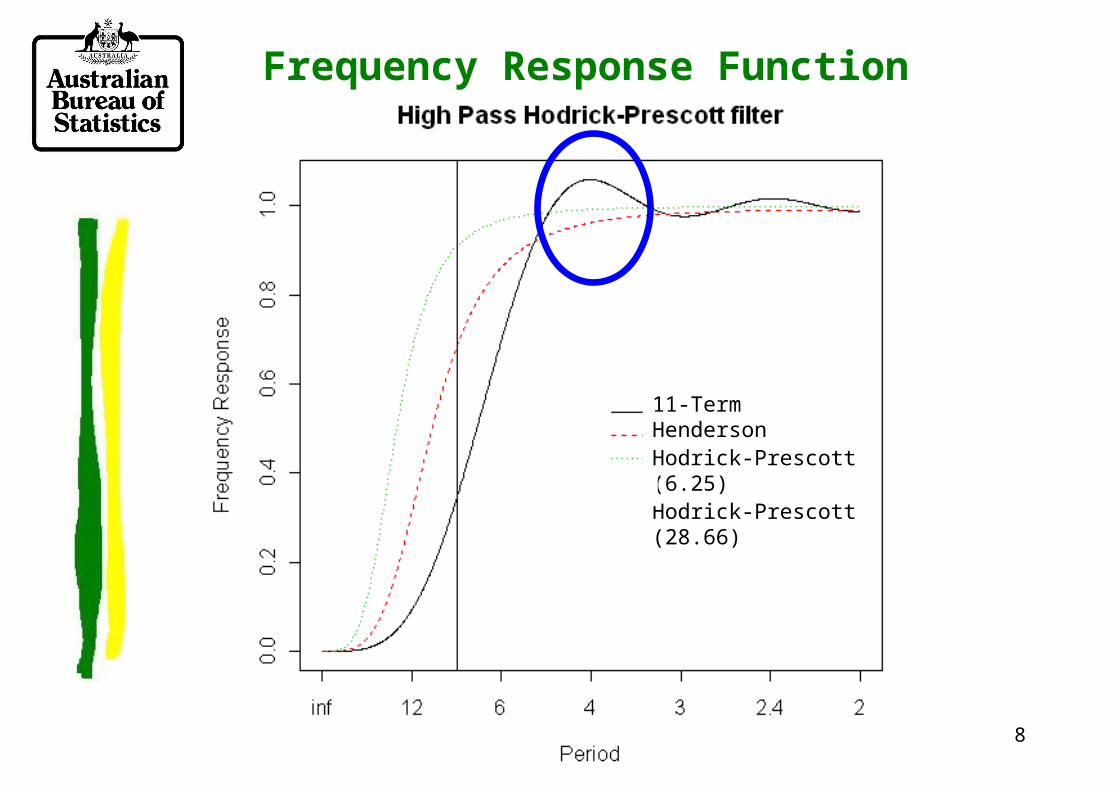
8
Frequency Response Function
11-Term HendersonHodrick-Prescott (6.25)Hodrick-Prescott (28.66)
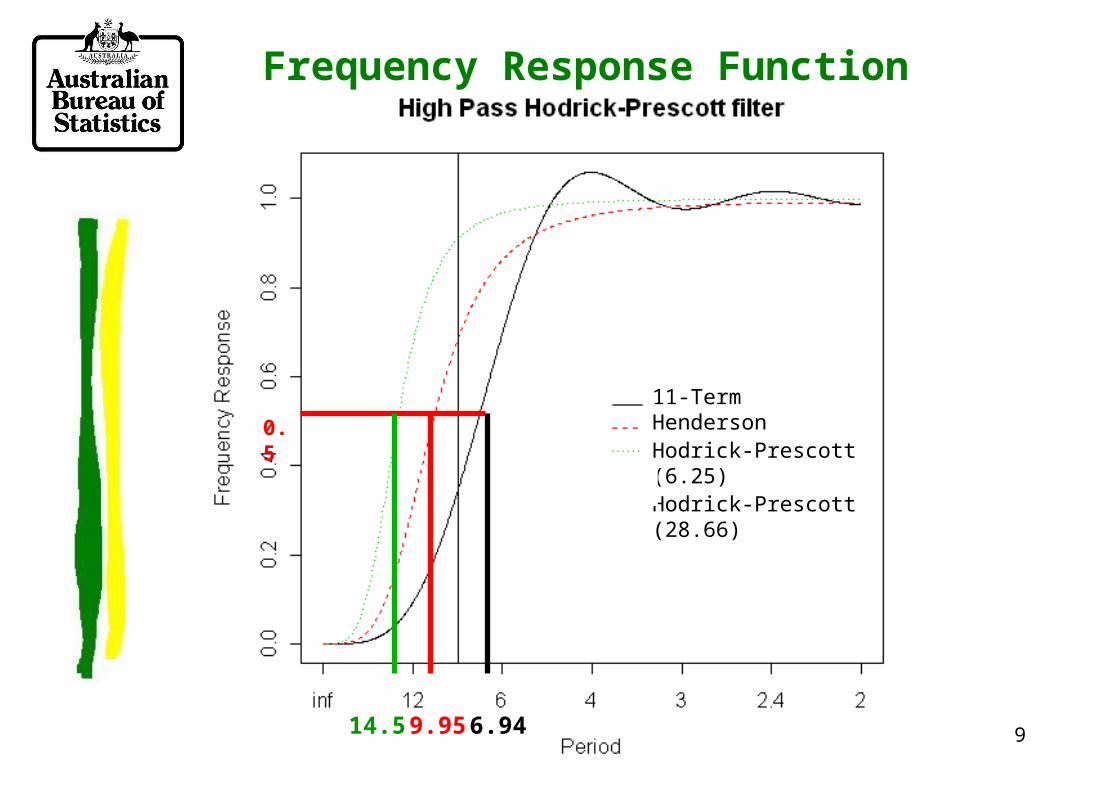
9
Frequency Response Function
0.5
6.949.9514.5
11-Term HendersonHodrick-Prescott (6.25)Hodrick-Prescott (28.66)
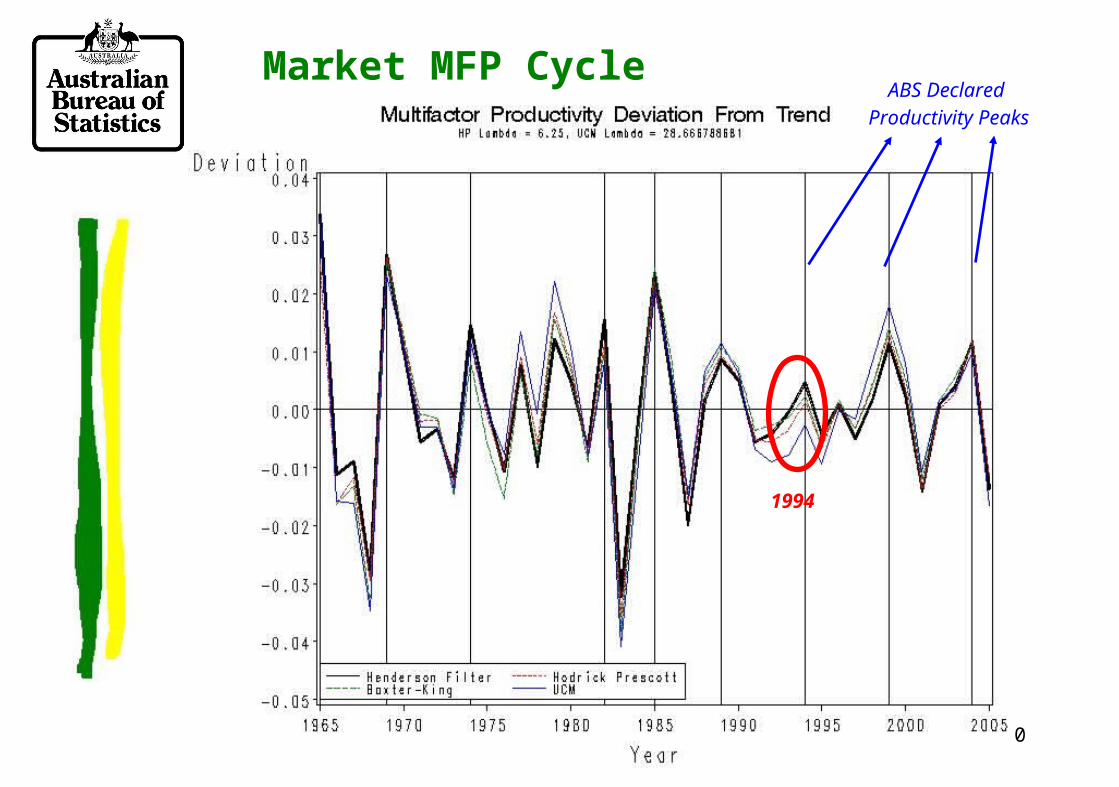
10
Market MFP Cycle Conparison
ABS Declared Productivity Peaks
1994
11
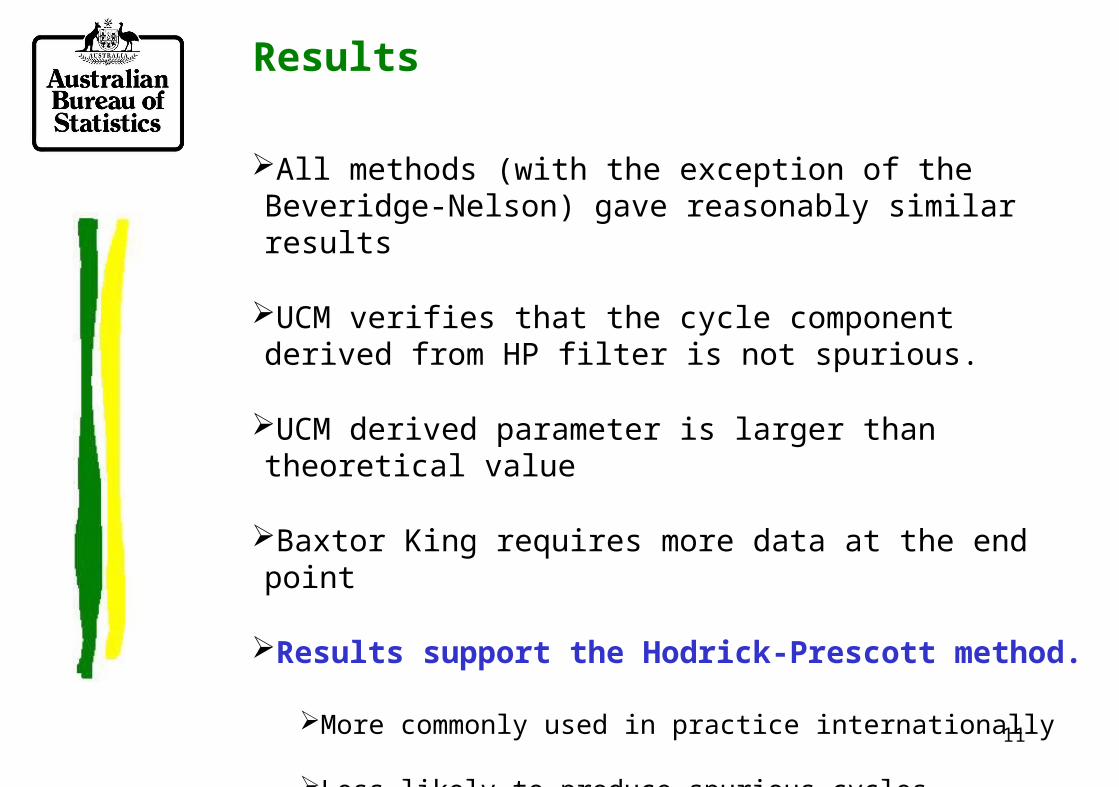
Results
All methods (with the exception of the Beveridge-Nelson) gave reasonably similar results
UCM verifies that the cycle component derived from HP filter is not spurious.
UCM derived parameter is larger than theoretical value
Baxtor King requires more data at the end point
Results support the Hodrick-Prescott method.
More commonly used in practice internationally
Less likely to produce spurious cycles
12
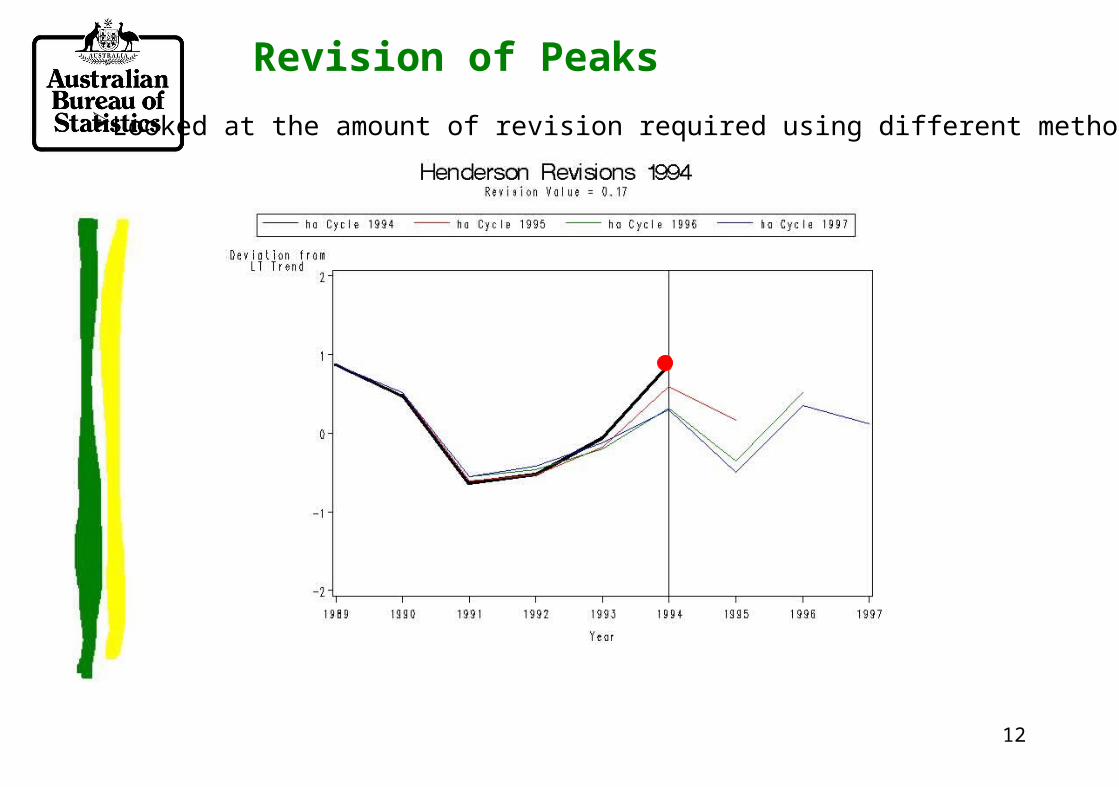
Revision of Peaks
Looked at the amount of revision required using different methods
13
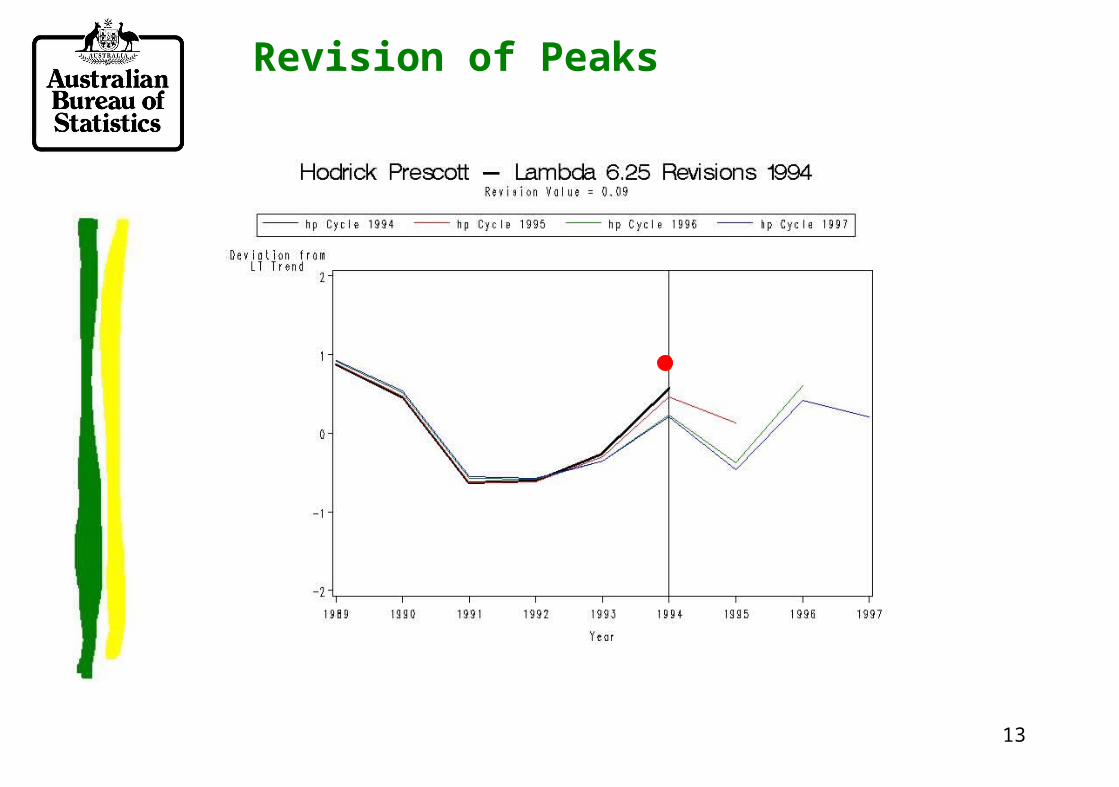
Revision of Peaks

14
Revision of Peaks
15
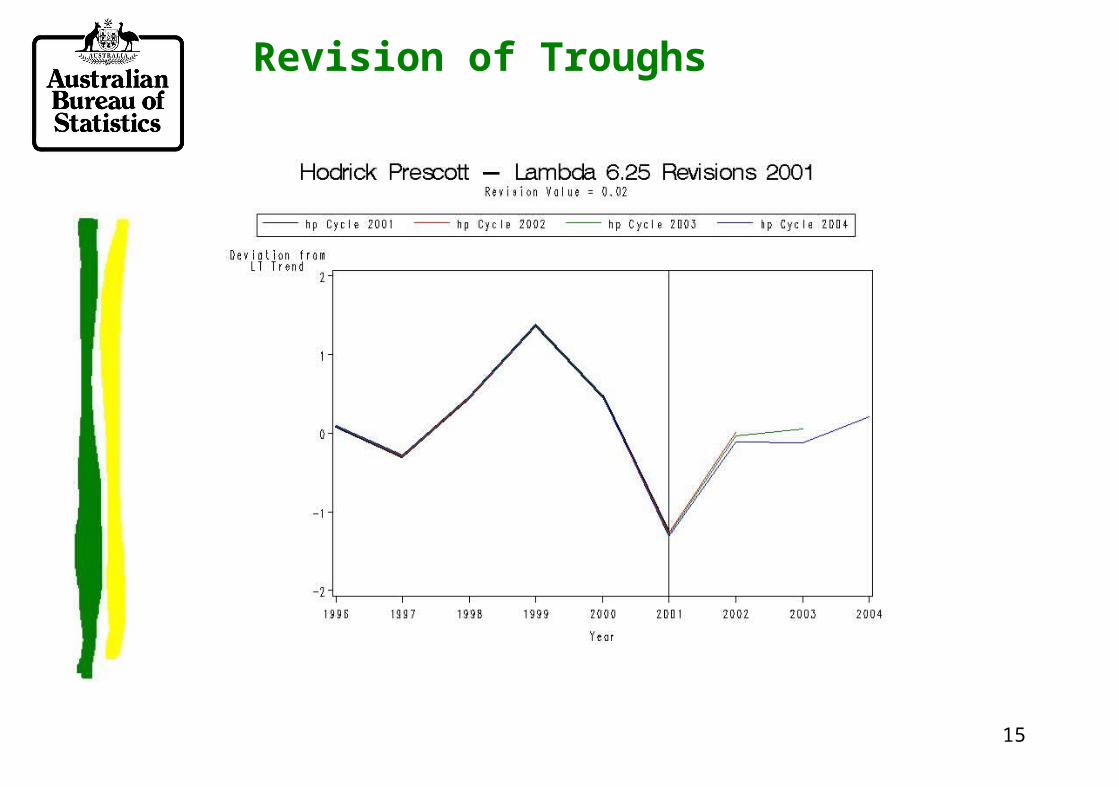
Revision of Troughs
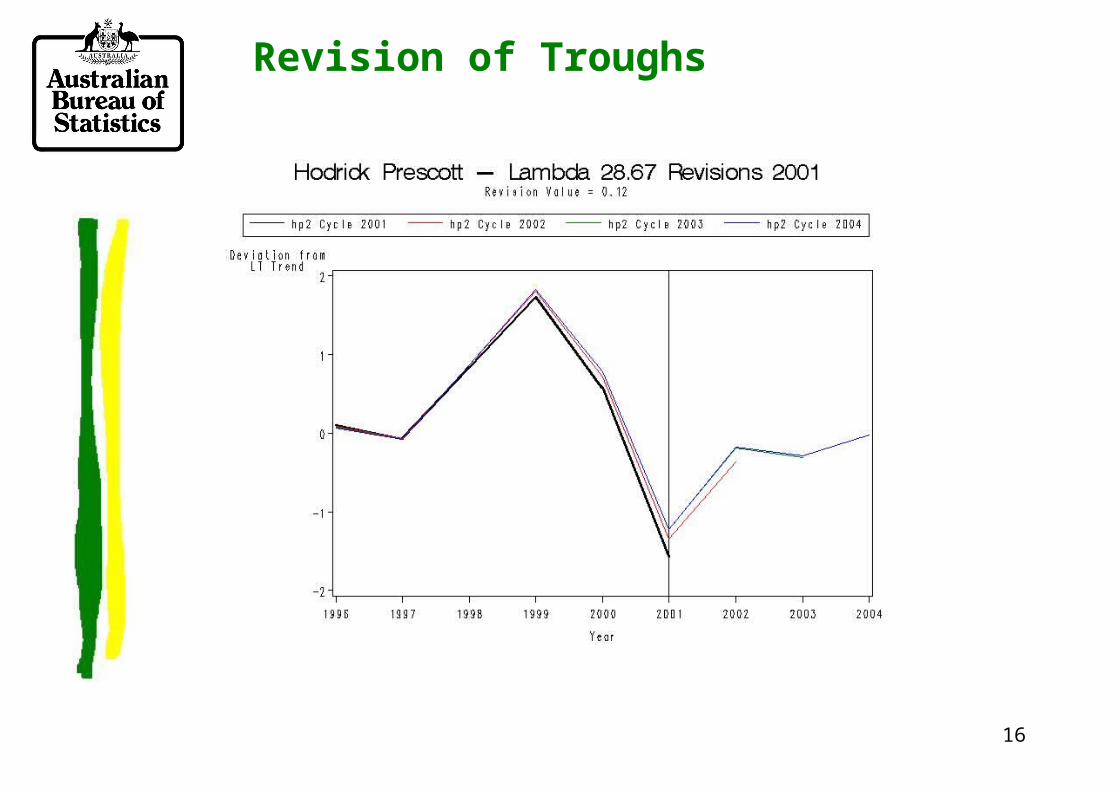
16
Revision of Troughs
17
Key Findings From Study
There is strong evidence of cyclic behaviour in the MFP series
The Henderson filter suppresses more power in low cycles (> 8 years) and amplifies cycles from 4 to 6 years
May produce spurious cycles
Results support updating methodology to Hodrick Prescott filter
Smoothing parameter, theoretical (6.25) or derived (28.66)?
Impact of change will affect the 1994 peak, but should not affect any other peaks
18
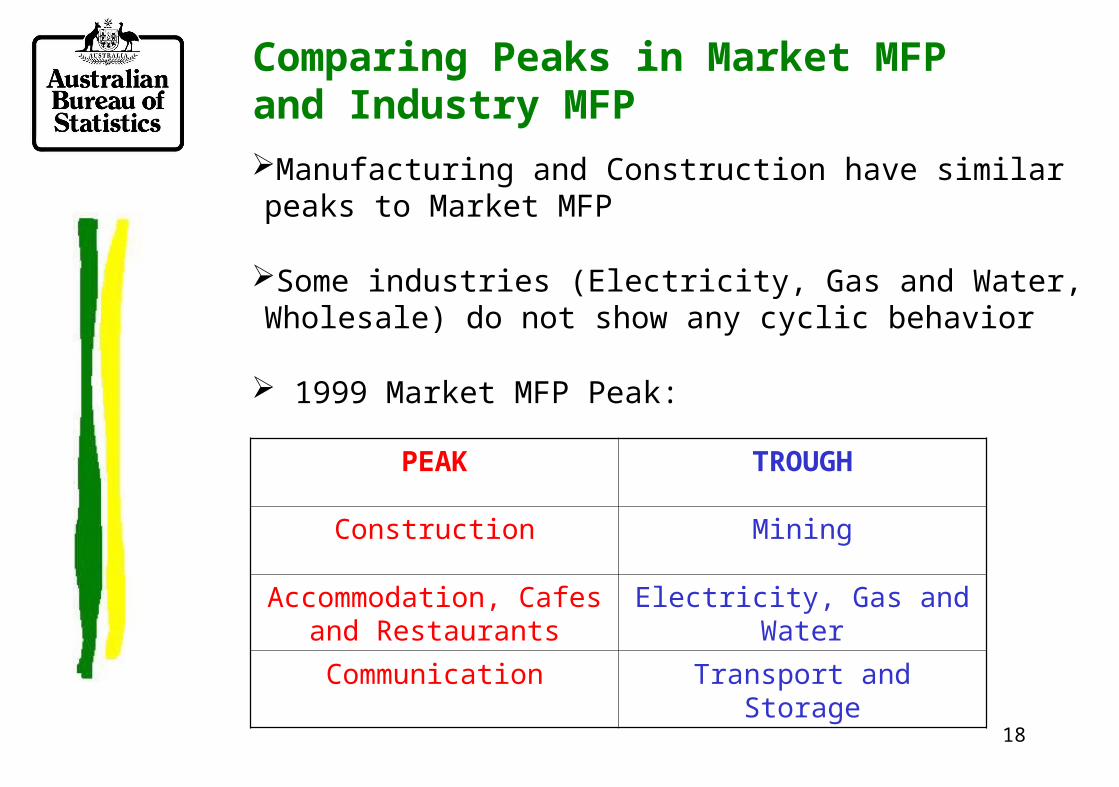
Comparing Peaks in Market MFP and Industry MFP Manufacturing and Construction have similar peaks to Market MFP
Some industries (Electricity, Gas and Water, Wholesale) do not show any cyclic behavior
1999 Market MFP Peak:
PEAK TROUGH
Construction Mining
Accommodation, Cafes and Restaurants
Electricity, Gas and Water
Communication Transport and Storage
19
Further Work
Finalise smoothing parameter
Further analysis of Industry MFP
Analysis of growth between adjacent years relative to average growth
Research capacity utilisation

20
Questions