1 dynamic simulation of pure hydrogen production via
TRANSCRIPT

Dynamic Simulation of Pure Hydrogen Production via ethanol Steam 1
Reforming in a Catalytic Membrane Reactor 2 3 4
Ali Hedayati*ab, Olivier Le Correa, Bruno Lacarrièrea, Jordi Llorcab 5 6
a Department of energy systems and environment, Ecole des Mines de Nantes, 4 Rue Alfred 7 Kastler,44307 Nantes, France. [email protected] 8 9 a Department of energy systems and environment, Ecole des Mines de Nantes, 4 Rue Alfred 10 Kastler, 44307Nantes, France. [email protected] 11 12 a Department of energy systems and environment, Ecole des Mines de Nantes, 4 Rue Alfred 13 Kastler, 44307Nantes, France. [email protected] 14 15 b Institute of Energy Technologies, Universitat Politècnica de Catalunya, Diagonal 647, 16 ETSEIB, 08028 Barcelona, Spain. [email protected] 17 18 *corresponding author : Ali Hedayati: 19 [email protected], Department of energy systems and environment, Ecole des 20 Mines de Nantes, 4 Rue Alfred Kastler, 44307Nantes, France. 21 [email protected], Institute of Energy Technologies, Universitat Politècnica de Catalunya, 22 Diagonal 647, ETSEIB, Pav. C, 08028 Barcelona, Spain. 23 24 25 Abstract 26
Ethanol steam reforming (ESR) was performed over Pd-Rh/CeO2 catalyst in a catalytic 27
membrane reactor (CMR) as a reformer unit for production of fuel cell grade pure hydrogen. 28
Experiments were performed at 923 K, 6-10 bar, and fuel flow rates of 50 to 200 µl/min using a 29
mixture of ethanol and distilled water with steam to carbon ratio of 3. A static model for the 30
catalytic zone was derived from the Arrhenius law to calculate the total molar production rates of 31
ESR products, i.e. CO, CO2, CH4, H2, and H2O in the catalytic zone of the CMR (coefficient of 32
determination R2 = 0.993). The pure hydrogen production rate at steady state conditions was 33
modeled by means of a static model based on the Sieverts’ law. Finally, a dynamic model was 34
developed under ideal gas law assumptions to simulate the dynamics of pure hydrogen 35
production rate in the case of the fuel flow rate or the operational pressure set point adjustment 36
(transient state) at isothermal conditions. The simulation of fuel flow rate change dynamics was 37
more essential compared to the pressure change one, as the system responds much faster to 38
such an adjustment. The results of the dynamic simulation fitted very well to the experimental 39

values, which proved the robustness of the simulation based on the Sieverts’ law. The 40
simulation presented in this work is similar to the hydrogen flow rate adjustments needed to set 41
the electrical load of a fuel cell, when fed online by the pure hydrogen generating reformer 42
studied. 43
44
Keywords: 45
Ethanol Steam Reforming, Pure hydrogen production, Membrane reactor, Dynamic simulation, 46
Sieverts’ law 47
48
Highlights: 49
Ethanol steam reforming (ESR) experiments were performed in a Pd-Ag membrane 50
reactor 51
The model of the catalytic zone of the reactor was derived from the Arrhenius law 52
The permeation zone (membrane) was modeled based on the Sieverts’ law 53
A dynamic model was developed under ideal gas law assumptions 54
Pressure and fuel flow rate adjustments were considered for dynamic simulation 55
56
1. Introduction 57
58
Renewable energy resources are now considered as one of the fastest and most feasible 59
solution to achieve the targets of clean electricity production; however, some challenges such 60
as dependency on the geographical and local conditions and infrastructures, and transmission 61
of produced electricity to the end users remain among the challenges to be encountered. In this 62
regard, on-site electricity production at the place/time where needed is beneficial. 63
64

Being compatible with modern energy carriers such as hydrogen, fuel cells are considered as 65
the efficient (45-50% electrical efficiency) and environmentally friendly energy convertors of the 66
future power generation systems [1–3]. Fuel cells have proved potentials in different 67
applications and can be applied in sub-MW size at any condition, independent from 68
geographical factors such as local climate conditions. Although production of hydrogen-rich 69
gases can offer flexible fuels for fuel cells [4], the pollution-free efficient performance of a fuel 70
cell is reached when pure hydrogen is used [5]. Accordingly, the main challenge remains in the 71
requirements of the special installations and infrastructures for production, distribution, and 72
delivery of hydrogen as it is needed in highly pure state [6]. Production of hydrogen – for 73
example via reforming processes – at the same place/time needed can make pure hydrogen 74
storage/transportation unnecessary [7]. 75
76
The use of renewable biofuels such as bio-ethanol as a source of hydrogen is highly beneficial 77
due to the higher H/C ratio, lower toxicity, and higher safety of storage that distinguishes ethanol 78
over other substrates. Bio-ethanol is cheaply and easily obtained from biomass and organic 79
waste and can be used directly in catalytic steam reforming processes to produce hydrogen 80
since it contains large amounts of water [8]. Concerning the production of fuel cell grade 81
hydrogen, the application of catalytic membrane reactors (CMRs) is beneficial where the 82
production and separation of hydrogen from the mixture of produced gases take place in the 83
same reactor vessel simultaneously. In the case of Pd-Ag metallic membrane reactors, 84
hydrogen purity up to 99.999% is obtained, which is suitable for direct low-temperature fuel cell 85
feeding [9,10]. 86
87
The application of the CMRs in pure hydrogen production (as a reformer unit) is still under 88
investigation. The effect of the co-presence of steam reforming bybroducts (CO, H2O, CO2 and 89
CH4) on the performance of the membrane in terms of pure hydrogen permeation rate is still a 90

challenge to be overcome. Hou et al. [11] reported that the hydrogen inhibition effect of CO, 91
CO2, and H2O in the case of a Pd-Ag membrane could be classified as H2O>CO>>CO2 in terms 92
of the competitive adsorption capability of the gases on the Pd-Ag membrane surface. In the 93
study by Unemoto et al. [12] the comparison between CO, CO2, and H2O showed that at T<600 94
K, CO had the strongest influence on the hydrogen permeability of the Pd membrane. They 95
suggested that at T>873 K, the effect of co-existence of other species for a membrane with a 96
thickness higher than 10 μm is negligible. On the contrary, Patrascu and Sheintuch [13] 97
concluded that the effect of very small amount of CO on hydrogen permeation inhibition could 98
be notable even in presence of H2O. The strong effect of low concentration of CO on the 99
membrane permeation behavior at different temperatures was reported also in other studies 100
[14–18]. Catalano et al. [19] stated that CH4 acted as inert gases in terms of hydrogen inhibition. 101
Barreiro et al. [20] showed that the hydrogen flux was reduced in presence of water at 593-723 102
K, while CO2 had no influence on the permeation rate of hydrogen. 103
104
Overall, the literature does not provide a consistent idea on the hydrogen inhibition 105
phenomenon due to the competitive adsorption of CO and H2O on the surface of the metallic Pd 106
membrane, the effect of reverse reactions of water gas shift (WGS) and methane steam 107
reforming (MSR), and the effect of operating at high pressure and temperature in the real 108
atmosphere of the ESR. It is not totally agreed if CO2 and CH4 are considered as inert gases as 109
their reactions with water via reverse WGS and MSR can lead to a more complicated situation 110
regarding the influence on the hydrogen permeation. According to the review given by Cornaglia 111
et al. [21], it can be understood that the hydrogen inhibition phenomenon caused by the ESR 112
products especially in presence of H2O, is a very complicated issue. It is inevitable to study each 113
fuel reformer system specifically in terms of the properties of the membrane, operating 114
conditions, and the composition of the fuel fed into the reformer reactor. 115
116

If a fuel cell is fed online by pure hydrogen generating system (hereafter referred to as 117
“reformer”), the dynamics of pure hydrogen supply must be fitted to the load variations (dynamic 118
behavior) of a fuel cell. Considering the dynamic energy demand of an end user – for example a 119
building – a reformer must be able to realize and track the dynamic electrical output of the fuel 120
cell in charge of electricity supply of the end user. Adjustment of the flow rate of pure hydrogen 121
provided by a reformer is a crucial phase to respond promptly and aptly to the electrical load 122
modifications of a fuel cell, aiming to optimize the whole system (reformer + fuel cell) 123
performance. Although a few studies are reported in the literature regarding the dynamic 124
performance of the fuel cells, the works devoted to the investigations of the dynamic 125
performance of the online fuel reformers – corresponding to the load variation of the fuel cells – 126
are not sufficiently reported in the literature [22]. 127
128
Garcia et al. [23] developed a dynamic model for a three module reformer made up of ethanol 129
dehydrogenation, acetaldehyde steam reforming, and water gas shift units for feeding hydrogen 130
to a fuel cell. They simulated the dynamic response of the reforming unit in terms of the 131
selectivity of the products of the ESR reaction rate to the changes in concentration of the feed 132
(ethanol + water). The same authors in another study [24] focused on the controllability and the 133
dynamics simulation of the same system as they reported in [23] by acting on the feed 134
concentration at isothermal conditions. A dynamic numerical model for the methane fuel 135
processor of a PEMFC was developed by Funke et al. [25] aiming at optimizing the reaction 136
conditions and heat integration especially during start up, shut down, and load change. The 137
effect of two constructions (the reactor and the evaporator with and without thermal coupling) on 138
the temperature profile, reaction rates, and methane conversion was investigated and it was 139
reported that hydrogen yield is higher when the reactor and the evaporator are not thermally 140
coupled. John and Schroer [26] presented a dynamic model of a methane steam reformer for a 141
residential fuel cell system. The dynamic model covered the full operating range including the 142

startup and shut down, and described the dynamics of the hydrogen yield and thermal behavior 143
of the reformer when the flow rate of water or natural gas changed. The thermal system was 144
affected by increasing the flow rate of the water. Higher hydrogen yield and lower methane 145
concentration at the outlet were reported at higher temperature, i.e. lower concentration of inlet 146
water. A dynamic model for an interconnected reformer and PEMFC stack was developed by 147
Stamps and Gatzke [27] with emphasis on the influence of various design and operating 148
parameters on system performance. It was concluded that operating at higher temperature 149
results in higher system performance. 150
151
A dynamic modeling study of a catalytic steam reformer by Kvamsdal et al. [28] showed that 152
the steam or gas (CO, CO2, H2, and CH4) supply interruption affects the reactor wall 153
temperature, which can directly lead to material failure or coke formation. Lin et al. [29] modeled 154
the dynamics of an experimental multi stage methane reformer in charge of providing hydrogen 155
to a PEMFC to design a control system to provide the responsiveness of the fuel reformer to the 156
alterations in the hydrogen demand. The response of the fuel reformer to changes in the 157
process variables such as CH4 feed flow rate, H2O/CH4 feed ratio, O2/CH4 feed ratio and the 158
reformer inlet temperature was studied. Tsourapas et al. [30] presented a dynamic model based 159
on thermodynamics and energy balance for a JP5 fuel reformer in connection with a membrane 160
separator (SEP) and a PEM fuel cell to investigate the effects of the operating set point of SEP 161
on the overall system efficiency. They concluded that the open loop response of the system is 162
shown to be satisfactory in terms of the response time and hydrogen production. It was shown 163
that there is a trade-off between the SEP efficiency and the overall efficiency of the system. 164
165
In another work by Koch et al. [10], a dynamic model of an ethanol steam reformer (as the fuel 166
reformer for pure hydrogen production to feed a PEMFC) was developed to implement an 167
adaptive and predictive control. The static behavior of the reformer system was described by 168

means of several maps developed in Matlab. Further, the dynamics of the fuel reformer in 169
connection with a PEMFC by acting upon reactor pressure and feed flow rate (ethanol + water) 170
was studied. They proposed an efficient controller that reduced the response time of the 171
reformer by a factor of 7 down to 8 s in terms of following the dynamics of a fuel cell load by 172
acting simultaneously on the fuel flow rate and pressure. However, such advanced controllers 173
require internal models and simulations for further development. 174
175
The purpose of this paper is to present a simpler approach mainly based on physical laws 176
(adapted Arrhenius model, mass balance, ideal gas law, and Sieverts’ law). Such a model can 177
be applied for the development of controllers, which is out of the scope of the paper. A dynamic 178
model of a reforming system (the CMR) is given to simulate the dynamics of the pure hydrogen 179
production rate at unsteady state conditions (between two steady state points) under fuel flow 180
rate and pressure set-up steps. The model considers the kinetics of the catalytic reforming 181
reactions regarding the molar production of ESR products, especially hydrogen inside the 182
reactor at unsteady operating conditions. Moreover, the dynamic simulation is based on the real 183
dynamic experiments using a Pd-Ag membrane reactor module (where production and 184
separation of hydrogen takes place in the same reactor) for production of fuel cell grade 185
hydrogen via ethanol steam reforming. Additionally, application of the CMR makes it possible to 186
investigate the effect of the byproducts of the ESR (CO, CO2, H2O, and CH4) on the 187
performance of a real case Pd-Ag membrane based on the observed reaction kinetics 188
(concentration of the ESR products). The latter is an important factor in monitoring and 189
simulation of the performance of the membrane in ESR environment so that many works have 190
been reported on the investigation of the effect of the gaseous byproducts on the permeation 191
behavior of the membranes. 192
193
2. Materials and methods 194
195
2.1. Experimental 196
197
The Pd-Rh/CeO2 catalyst (0.5% Pd – 0.5% Rh) was deposited over cordierite pellets of about 1 198
mm following the procedure described by López et al. [31]. When ESR is performed over Pd-199
Rh/CeO2 catalyst, the major reforming reactions are [32,33]: 200
C2H5OH → H2 + CO + CH4 (1) 201
CO + H2O ⇆ H2 + CO2 (2) 202
CH4 + 2H2O ⇆ 4H2 + CO2 (3) 203
C2H5OH + 3H2O ↔ 2CO2 + 6H2 (4) 204
205
Equations 1-3 represent the ethanol decomposition, water gas shift, and methane steam 206
reforming reactions, respectively. Equation 4 is the overall ESR reaction. 207
208
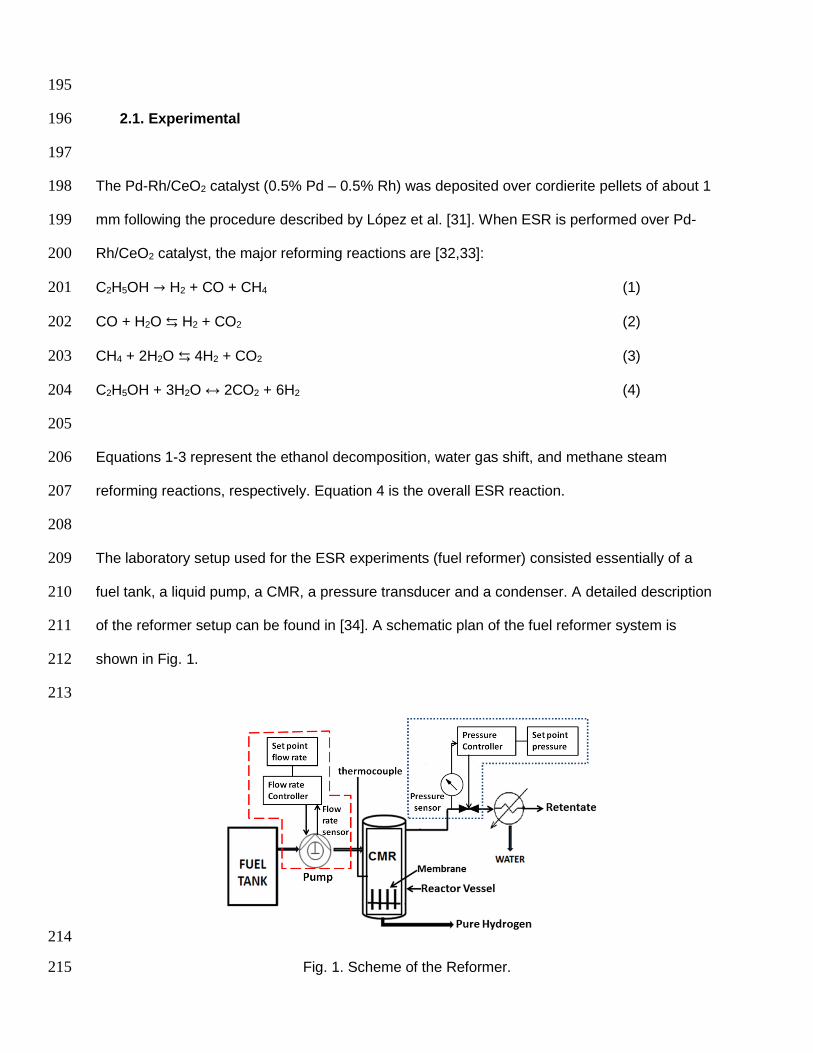
The laboratory setup used for the ESR experiments (fuel reformer) consisted essentially of a 209
fuel tank, a liquid pump, a CMR, a pressure transducer and a condenser. A detailed description 210
of the reformer setup can be found in [34]. A schematic plan of the fuel reformer system is 211
shown in Fig. 1. 212
213
214
Fig. 1. Scheme of the Reformer. 215

The dashed and dotted lines represent the fuel flow rate and pressure controlling systems, 216
respectively. The CMR (provided by Reb Research and Consulting [35]) was 10 in. tall and 1 in. 217
in diameter. There were four Pd-Ag membrane tubes selective to hydrogen inside the reactor; 218
each one 3 in. tall and 1/8 in. diameter in order to separate hydrogen from the gases produced. 219
To perform the experiments, the reactor was filled with the catalysts so that the metallic 220
membranes were fully covered. The retentate pressure was adjusted by a back-pressure 221
regulator (transducer). No pressure regulation was implemented on the permeate side and no 222
sweep gas was used so that pure hydrogen was obtained at atmospheric pressure. The flow 223
rate of pure hydrogen (permeate) was measured with a mass flow meter and fluctuated within 224
±2 ml/min. The composition of retentate gases (waste gases) was analyzed on a dry basis using 225
an online Gas Chromatograph (±3%) (Agilent 3000A MicroGC using MS 5 Å, PlotU and 226
Stabilwax columns) every 4 minutes. 227
228
The operating conditions of the experiments under steady conditions are summarized in Table 229
1. The experiments were performed at isothermal conditions. 230
231
Table 1. Experimental conditions 232
Temperature 𝑇𝑠𝑒𝑡 𝑝𝑜𝑖𝑛𝑡 (K) 923
Pressure 𝑃𝑠𝑒𝑡 𝑝𝑜𝑖𝑛𝑡 (bar) 6-10
Fuel flow rate 𝐹𝐹𝑠𝑒𝑡 𝑝𝑜𝑖𝑛𝑡
(μl/min) 50-200
Steam to carbon ratio SC 3
233
At 923 K, the ESR over the Pd-Rh/CeO2 catalyst is optimized in terms of hydrogen selectivity, 234
hydrogen recovery, and ethanol conversion [31,32,36,37]. At SC ratio of 3, the highest value of 235
hydrogen recovery was obtained during the experimental work that is attributed to the 236

availability of water for the reforming reactions. On the other hand, coke formation is less prone 237
to occur at a higher SC ratio with respect to the stoichiometric value. 238
239
Two types of dynamic tests were performed in this study: pressure change and flow rate 240
change. In the case of pressure change dynamic tests, both increasing and decreasing steps 241
were considered. As presented in Fig. 2, the pressures range of 7-10 bar was selected because 242
at these pressures the efficiency of the fuel reformer is maximum [38]. 243
244
245
246
247
Fig. 2. Scheme of the pressure change for the dynamic tests. 248
Dynamic tests regarding the response of the system to the fuel flow rate changes were 249
performed through intervals of 50 μl/min as shown in Fig. 3. 250
251
252

253
Fig. 3. Scheme of the fuel flow rate change for the dynamic tests. 254
The changing cycles were run more than one time to observe the durability of the performance 255
of the reforming system. According to the membrane limitations, higher flow rates were not 256
taken into account. 257
258
2.2. CMR isothermal model 259
260
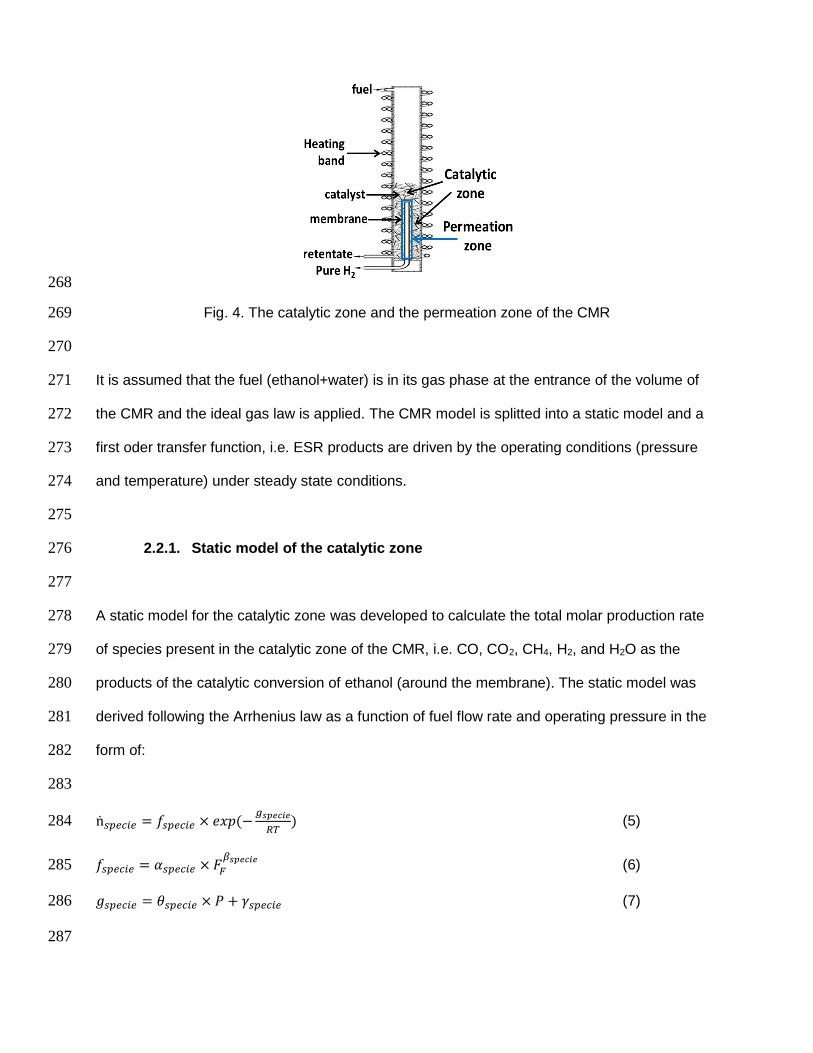
For the modeling task, the CMR was divided into two sections, i.e. the catalytic zone, and the 261
permeation zone (the membrane) as shown in the Fig. 4. The ESR reactions were supposed to 262
occur in the catalytic zone, resulting in total production of the retentate gas plus the permeated 263
hydrogen. The permeation zone (the membrane) stands for the pure hydrogen generating step 264
for which the dynamic model was developed. The outputs of the catalytic zone model were used 265
as the input of the static models of the permeation zone (i.e. the membrane). 266
267
268
Fig. 4. The catalytic zone and the permeation zone of the CMR 269
270
It is assumed that the fuel (ethanol+water) is in its gas phase at the entrance of the volume of 271
the CMR and the ideal gas law is applied. The CMR model is splitted into a static model and a 272
first oder transfer function, i.e. ESR products are driven by the operating conditions (pressure 273
and temperature) under steady state conditions. 274
275
2.2.1. Static model of the catalytic zone 276
277
A static model for the catalytic zone was developed to calculate the total molar production rate 278
of species present in the catalytic zone of the CMR, i.e. CO, CO2, CH4, H2, and H2O as the 279
products of the catalytic conversion of ethanol (around the membrane). The static model was 280
derived following the Arrhenius law as a function of fuel flow rate and operating pressure in the 281
form of: 282
283
ṅ𝑠𝑝𝑒𝑐𝑖𝑒 = 𝑓𝑠𝑝𝑒𝑐𝑖𝑒 × 𝑒𝑥𝑝(−𝑔𝑠𝑝𝑒𝑐𝑖𝑒
𝑅𝑇) (5) 284
𝑓𝑠𝑝𝑒𝑐𝑖𝑒 = 𝛼𝑠𝑝𝑒𝑐𝑖𝑒 × 𝐹𝐹
𝛽𝑠𝑝𝑒𝑐𝑖𝑒 (6) 285
𝑔𝑠𝑝𝑒𝑐𝑖𝑒 = 𝜃𝑠𝑝𝑒𝑐𝑖𝑒 × 𝑃 + 𝛾𝑠𝑝𝑒𝑐𝑖𝑒 (7) 286
287

ṅspecie [mol/s] is the molar production rate of each species produced in the CMR via ESR over 288
the catalyst (and around the membrane). FF [m3/s] and P [Pa] represent the fuel (ethanol + 289
water) flow rate and the reactor pressure, respectively. ‘𝑓𝑠𝑝𝑒𝑐𝑖𝑒’ represents a function of fuel flow 290
rate as pre-exponential factor, and ‘𝑔𝑠𝑝𝑒𝑐𝑖𝑒’ represents the energy of activation as a function of 291
pressure. 𝛼𝑠𝑝𝑒𝑐𝑖𝑒, 𝛽𝑠𝑝𝑒𝑐𝑖𝑒, 𝜃𝑠𝑝𝑒𝑐𝑖𝑒, and 𝛾𝑠𝑝𝑒𝑐𝑖𝑒 are the fitting parameters of the equations. The 292
introduced model was applied to calculate the molar production rate of the ESR products, 293
mainly to calculate the partial pressure of hydrogen (PH2,r in eq. 9) around the membrane 294
surface (right before the permeation zone). 295
296
2.2.2. Static models of the permeation zone 297
298
The model of hydrogen permeation through the membrane at steady state was derived from the 299
Sieverts’ law. Hydrogen permeation phenomenon through a Pd-Ag membrane is explained by 300
Sieverts’ law based on the mass transfer and surface reactions principals [19,39]. As stated by 301
the Sieverts’ law, the hydrogen permeation rate through Pd-Ag membrane is a temperature 302
activated phenomena driven by the difference between the partial pressure of hydrogen at two 303
sides, i.e. the retentate side (inside the reactor, around the membrane) and the permeate side 304
(right after the membrane) [31,33]: 305
306
𝐽𝐻2 =𝑄0
δ𝑒
−𝐸𝑎𝑅𝑇 (√𝑃𝐻2,𝑟 − √𝑃𝐻2,𝑝𝑒𝑟𝑚) (8) 307
308
Where JH2 is the pure hydrogen production rate obtained via the Sieverts’ law. δ is the thickness 309
of the membrane and Q0 is the pre-exponential factor. Ea, R, and T are the activation energy, 310
universal gas constant, and temperature, respectively. PH2,r and PH2,perm are the partial pressure 311
of hydrogen at the retentate and permeate side, respectively. 312

The partial pressure of hydrogen inside the reactor was calculated based on the hydrogen 313
fraction in the gas phase assuming that the only present species in the catalytic bed (and 314
around the membrane) are CO, CO2, CH4, H2 and H2O. Therefore: 315
316
𝑃𝐻2,𝑟 = 𝑃 × 𝑦𝐻2,𝑟 (9) 317
318
Where P and yH2,r represent the reactor pressure and the molar fraction of hydrogen in the 319
catalyst bed, respectively. The reactor pressure simulation method is explained in section 2.2.3. 320
The activation energy (Ea) and the pre-exponential factor (Q0) are calculated by means of 321
permeation experiments during which pure hydrogen at known temperature and pressure is 322
purged and the permeation rate of hydrogen through the membrane is measured (atmospheric 323
pressure at the permeate side) [40–45]. 324
325
As discussed before, the published open literature offers no robust model/analysis on the effect 326
of different species on the performance of the membrane in the real atmosphere of methane 327
steam reforming and water gas shift reactions. It was concluded that to understand the influence 328
of co-existence of ESR products on the permeation performance of the membrane, specific 329
models must be developed regarding specific operational conditions of the ESR environment. 330
331
Accordingly, a model was developed for hydrogen permeation through the Pd-Ag membrane; 332
specifically for the ESR environment at the operating conditions presented in this work. It is 333
assumed that the concentrations of CO and H2O affect the permeation performance of the 334
membrane differently at different operating conditions. The hidden effect of CH4 and CO2 are 335
taken into account considering the ESR reactions (eq. 1-3). Firstly, the model presented in the 336
section 2.2.1 (catalytic zone) was used to fit the molar flow rate of the species present in the 337
retentate gas, i.e. CO, CO2, CH4, H2, and H2O (to calculate the partial pressure of hydrogen at 338
the retentate side). 339

340
Regarding equation 9, the activation energy (Ea) was taken from the work by Papadias et al. 341
[46] as they used the same membrane module as the one used in this work, with the same 342
characteristics and synthetized by the same manufacturer (REB Research & Consulting [35]). 343
Therefore, the term 𝑒
−𝐸𝑎𝑅𝑇
δ in eq. 9 was calculated, which is equal to 54.9 [m-1]. Then, the term ‘Q0’ 344
was obtained firstly from the experimental results (Q0measure), and then modeled (Q0
model) by 345
means of a static model as a function of the reactor pressure (P) and fuel flow rate (FF): 346
347
𝑄0𝑚𝑒𝑎𝑠𝑢𝑟𝑒 =
𝐽𝐻2×δ
𝑒−𝐸𝑎𝑅𝑇 ×(√𝑃𝐻2,𝑟−√𝑃𝐻2,𝑝𝑒𝑟𝑚)
(10) 348
349
𝑄0𝑚𝑜𝑑𝑒𝑙 = 𝑘1 × 𝐹𝐹 × 𝑒𝑥𝑝(𝑘2 × 𝑃) (11) 350
351
Where ‘𝑘𝑖’ is the fitting parameter. PH2,r in eq. 10 is obtained via eq. 9 by using the modeled 352
values of the molar production rate of ESR products (eq. 5-7) to calculate the hydrogen fraction 353
in the catalytic zone. In fact, this factor was used to fit the results of the Sieverts’ law based 354
model to the experimental ones. 355
356
Accordingly, the hydrogen permeation rate at steady state conditions was modeled to be used 357
in the simulation of the dynamics of hydrogen permeation rate at transient conditions, i.e. 358
between two steady state points. 359
360
2.2.3. Isothermal dynamic simulation of the permeation zone 361
362
Prior to the dynamic simulation of the permeation zone, the reactor pressure was modeled in 363
the case of pressure set point adjustment during which the pressure valve of the reforming 364

systems acts on the retentate gas flow rate to adjust to a higher or lower pressure. The ideal 365
gas law in the form of PV = mRT
MW was used to model the pressure of the reactor. P, V, T, and MW 366
are reactor pressure, the volume of the reactor, reactor temperature, and the molar mass of the 367
fuel mixture, respectively. ‘m’ is the accumulated mass of the fuel added to the reactor volume. 368
It was assumed that the accumulation rate of the pumped fuel into the constant volume of the 369
reactor at constant temperature, results in pressure rise as the pressure valve acts on the outlet 370
of the system to block the retentate stream when pressure increase is required. Conversely, to 371
decrease the pressure, the pressure valve lets the retentate gas be released, so that the inlet 372
mass flow rate of the fuel gets lower than the outlet mass flow rate. Regardless of the action of 373
the pressure valve on the retentate gas stream, hydrogen constantly permeates through the 374
membrane. Therefore, the added mass to the reactor volume is the difference between the fuel 375
flow rate, and the retentate gas flow rate plus hydrogen permeation rate, so that: 376
377
𝑑𝑚
𝑑𝑡= ṁ𝑓𝑢𝑒𝑙 − ṁ𝑟 − ṁ𝐻2.𝑝𝑒𝑟𝑚 (12) 378
379
Where ṁfuel and ṁH2.perm represent the fuel flow rate and hydrogen permeation rate, respectively, 380
both in [kg/s]. Then, the ideal gas law is written as: 381
382
𝑑𝑃
𝑑𝑡= (
𝑅𝑇
𝑉𝑀𝑊) ×
𝑑𝑚
𝑑𝑡 (13) 383
384
Where dm
dt is the rate of the accumulation of the mass in the reactor volume. In this work, the 385
CMR is a packed bed reactor running at isothermal conditions, with negligible axial mixing. The 386
temperature and concentration difference is neglected, so that the models are considered as 387
ideal plug flow pseudo-homogenous ones [47]. 388
389

The dynamic simulation was performed to predict the dynamic behavior of the pure hydrogen 390
production rate (permeate zone) in the transient periods during which the reforming system 391
alters between two steady state points, as a result of the fuel flow rate or operating pressure set 392
point adjustments. To develop the dynamic model of the permeate zone, a first order function 393
was used: 394
395
𝐽𝐻2𝐷
𝐹𝐹 =
𝐽𝐻2
1+𝜏𝑠 (14) 396
397
𝐽𝐻2𝐷 is the pure hydrogen production rate obtained by the dynamic model. The superscript “D” 398
stands for the dynamic model. 𝐽𝐻2 represents the hydrogen permeation rate calculated via the 399
static model based on the Sieverts law, considering every single operating point as steady state. 400
The time constant is presented as τ. The measured dynamic of fuel flow rate was faster than the 401
sampling time (1 second). Therefore, the fuel flow rate is always equal to its set point value: 402
403
𝐹𝐹 = 𝐹𝐹𝑠𝑒𝑡 𝑝𝑜𝑖𝑛𝑡
(15) 404
405
Finally, equation 14 is written as: 406
407
𝐽𝐻2𝐷
𝐹𝐹𝑠𝑒𝑡 𝑝𝑜𝑖𝑛𝑡 =
𝐽𝐻2
1+𝜏𝑠 (16) 408
409
Where FFset point
is the fuel flow rate set point (see Fig. 3). 410
411
The simulation was performed by means of Ordinary Differential Equation (O.D.E) solver. 412
413
3. Results and discussion 414

415
Least Square Method (LSM) was applied to obtain all the fitting parameters regarding the static 416
models. The time constant was estimated from a set of trials and errors. 417
418
3.1. Static models of the permeation zone 419
420
The products of ESR (H2, CO, CO2, CH4, and H2O) and the pure hydrogen permeation rate was 421
modeled at four different fuel flow rates, i.e. 50, 100, 150, 200 µl/min and three different 422
pressures (6, 8, and 10 bar). As mentioned before, the molar production rate of all the ESR 423
products was needed in order to calculate the partial pressure of hydrogen in the catalytic zone 424
(around the membrane). The calculated molar production rates of the ESR products (catalytic 425
zone) are presented in Fig. 5. The dashed lines represent the 10% error (discrepancy between 426
experiment and measurement). The x-axis (modeled) and y-axis (measured) are referred to the 427
values calculated by the static model and obtained via experiments, respectively. 428
429
430

431
432
433
Fig. 5. Parity plots of the ESR products calculated by the static model (eq. 5-7). 434
The modeled values could fit the experimental results within the 10% error, especially in the 435
case of production rate of hydrogen. The values of the fitting parameters (eq. 6 and 7) for all the 436
gases are given in Table 2. 437
438
439
440
441

Table 2. Fitting parameters of the static model for the ESR products production rate model (eq. 442
6 and 7) 443
specie αspecie [mol.m-3] βspecie [-] θspecie [J.mol-1.Pa-1] γspecie [J.mol-1] R2
H2 1.0873 0.7096 8.3800×10⁻⁷ -0.0665 0.9954
CO 75.5364 0.8930 -1.5028×10⁻⁶ -4.2727 0.9849
CO2 133.8928 1.0915 -1.4717×10⁻⁷ 1.1520 0.9911
CH4 560.2602 1.3303 -4.7941×10⁻⁷ 3.7000 0.9950
H2O 226.0976 1.1131 -1.7989×10⁻⁷ 2.6771 0.9992
444
Keeping in mind equations 5-7, it can be seen that the values of P×θ are very small compared 445
to γ, except in the case of hydrogen. As mentioned before, the most effective factor on the 446
hydrogen permeation is the partial pressure of hydrogen in the reactor; hence, the value of P×θ 447
is higher in this case. The same explanation can be given regarding the parameter β. In the 448
case of hydrogen, the effect of pressure in the CMR configuration is dominant in comparison 449
with the fuel flow rate, resulting in the smallest value of β in the case of hydrogen. Conversely, 450
the value of β in the case of CH4 is the highest among the gases because the only source of 451
CH4 is the ethanol decomposition reaction (eq. 1). At complete ethanol conversion, the higher 452
the fuel flow rate is, the higher the production rate of CH4 is. The value of β in the case of H2O is 453
nearly one, which is very relevant since the ESR reaction were performed at SC=3, where there 454
is a large amount of excess water. It can be concluded that the molar flow rate of water is 455
proportional to the inlet molar flow rate of water in the fuel mixture (ethanol + water). At SC=3, a 456
large portion of the inlet water (70-90%) leaves the reactor in the form of steam as unreacted 457
water. The value of θ in the case of CO is one order of magnitude smaller than other gases, 458
which is attributed to the very small amount of CO detected at the outlet of the reactor. The 459
values of θ proves that at higher pressures, less byproducts (CO, CO2, CH4, and H2O) and more 460

hydrogen are generated, which is totally in agreement with the experimental results and the aim 461
of application of the CMR, where ESR reactions are promoted (the shift effect). 462
463
The value of the pre-exponential factor model (eq. 11) showed a good correlation (R2=0.91) with 464
the calculated values (Fig. 6) except at P=6 bar; this is interpreted to the fact that at this 465
pressure the membrane starts to be effective for hydrogen separation. 466
467
468
469
470
Fig. 6. The result of the pre-exponential factor model (eq. 11) at P>6 bar. The dashed lines 471
show the 15% error range. 472
473
The values at P=6 bar are not presented due to membrane diffusion limitation at pressures 474
lower than 6 bar. The fitting parameters considering the static models for the permeation zone 475
(eq. 11) are given in Table 3. 476
477
478
479

480
481
Table 3. Fitting parameters of the pre-exponential factor model (eq. 11) 482
483
Parameter k1 k2 R2
value 0.602 -3.4823×10⁻⁶ 0.91
Unit [mol.m-2.Pa-0.5] [Pa-1] [-]
484
485
Regarding the value of k2, the diverse effect of pressure is obvious (see eq. 11). This is 486
attributed to the fact that at higher pressure, the concentration of hydrogen is higher around the 487
membrane (permeation zone) leading to the lower concentration of the other gases, which 488
directly means that the permeation performance of the membrane is less affected. This is 489
completely in agreement with the experimental results and the assumption of the negative effect 490
of the byproducts of the ESR reactions on the permeation behavior of the Pd-Ag membrane. 491
492
The result of the Sieverts’ law model (permeation zone) is shown in Fig. 7 (P>6 bar; R2=0.86). 493
The partial pressure of hydrogen in the reactor (obtained based on the molar production rates of 494
the ESR products calculated by the Arrhenius based static model) was used in the Sieverts’ law 495
to obtain the pure hydrogen permeation rate. 496
497

498
499
Fig. 7. Parity plots of the hydrogen permeation rate obtained by the Sieverts’ law model 500
501
502
503
3.2. Isothermal Dynamic simulation 504
505
3.2.1. Pressure change simulation 506
507
To develop the dynamic model of the reforming system in the case of pressure change, firstly, 508
the reactor pressure was simulated. Keeping in mind the configuration of the CMR, when the 509
pressure of the reactor is set at a higher value, the outlet of the reactor is blocked so that the 510
inlet fuel is added to the volume of the reactor to increase the pressure gradually with time. 511
When the pressure is increased, the flow rate of the retentate gas (ṁr) is zero (see eq. 12). On 512
the contrary, when reactor pressure is set at a lower value, the pressure valve is opened so that 513
gas is released leading to sudden pressure drop in the reactor. The different behavior of the 514
system during pressure increasing and decreasing steps is due to the different act of the 515
pressure controlling system on the pressure valve (see Fig. 1). Therefore, the dynamics of the 516

system pressure control differ in different steps. The importance of such a performance lies in 517
the dependency of pure hydrogen permeation rate through the membrane on the partial 518
pressure of hydrogen in the reactor. The simulated pressure change behavior of the reformer 519
system is shown in Fig. 8. 520
521
522
523
Fig. 8. Measured and simulated reactor pressures in the pressure change dynamic tests. T=923 524
K, FF=200 μl/min. 525
It is clear that the results of simulation of reactor pressure by means of the ideal gas law fit the 526
measurement very well. 527
528
As mentioned before, the hydrogen partial pressure difference at the retentate and permeate 529
sides is the driving force for hydrogen permeation, which is stated by the Sieverts’ law (eq. 8). 530
Therefore, consideration of the Sieverts’ law as the base of simulation of hydrogen permeation 531
dynamic performance is essential. The simulated dynamic performance of the reforming system 532
in the case of pressure change dynamic tests is shown in Fig. 9. 533
534

535
536
Fig. 9. Simulation of the dynamics of the pure hydrogen production rate for pressure change 537
tests. T=923 K, FF=200 μl/min. 538
539
The small fluctuations of the pure hydrogen measurement during the experiments are attributed 540
to the small variations of the pressure inside the reactor, as the pressure valve acts on the outlet 541
retentate stream. This fluctuation is ca. 10-6 mol/s of pure hydrogen. As expected, at constant 542
temperature and fuel flow rate, pure hydrogen production rate follows the variation of reactor 543
pressure by time. The CMR time constant in the case of pressure change tests was 200 544
seconds. The simulation of the pressure change steps fitted the experimental observation very 545
well, proving the successful modeling and application of the Sieverts’ law. 546
547
548
3.2.2. Fuel flow rate change simulation 549
550
In comparison with the pressure change models, it is more essential to develop a model on the 551
fuel flow rate change. The importance of fuel flow rate change model lies in the fact that acting 552
on fuel flow rate is much faster than the operating pressure. The CMR time constant (eq. 14) in 553

the fuel flow rate change tests was 55 seconds, which is nearly four times shorter than the 554
pressure change tests (200 seconds). The simulation result of the pure hydrogen production 555
rate for fuel flow rate change tests is presented in Fig. 10. 556
557
558
559
Fig. 10 . Simulation of the dynamics of the pure hydrogen production rate for fuel flow rate 560
change tests. T=923 K, P=10 bar. 561
562
The Sieverts’ law simulation results in the case of the fuel flow rate change (Fig. 10) fitted very 563
well to the experimental observation. This is an outstanding result since the accuracy of the 564
prediction of the pure hydrogen dynamics together with fast response of the reforming system to 565
the fuel flow rate adjustments can build up a robust essential step toward further control studies. 566
567
The isothermal dynamic simulation of pure hydrogen production via ESR in the CMR 568
considering the fuel flow rate and pressure changes can play an essential role for a general 569
model of the dynamic performance of the system when connecting to a fuel cell for its online 570
feeding and control. The simulations presented in this work were able to predict the dynamics of 571

hydrogen permeation rate with high accuracy; however, the significance of the simulation based 572
on fuel flow rate modifications lies in the faster response of the reformer to reach the steady 573
state regarding the new set point. 574
575
4. Conclusion 576
577
Ethanol steam reforming (ESR) over Pd-Rh/CeO2 catalyst was performed in a CMR at 923 K, 6-578
10 bar, and fuel flow rates of 50 to 200 µl/min using a mixture of ethanol and distilled water. A 579
static model was proposed based on the Arrhenius law to calculate the molar production rate of 580
ESR products inside the reactor (catalytic zone). The pure hydrogen production rate at steady 581
state conditions was simulated by means of Sieverts’ law model. Finally, the dynamics of the 582
pure hydrogen production rate (permeation zone) in the case of the operating fuel flow rate or 583
pressure set point adjustment was simulated under the ideal gas law assumptions at isothermal 584
conditions. The effective critical factors such as hydrogen partial pressure in the CMR and the 585
influence of the co-existence of the ESR products on the permeation behavior of the membrane 586
were taken into account by the Sieverts’ law model. Both pressure and fuel flow rate change 587
steps simulations fitted the experimental values very well. However, the simulation of the 588
dynamics of the fuel flow rate change was more essential, as the system responds much faster 589
to such an adjustment. The future work will be devoted to the simulation of the startup and shut 590
down dynamics, the effect of the composition of the inlet fuel, and the temperature profile aiming 591
to provide a controlling system. 592
593
Acknowledgements 594
Funding from MINECO project ENE2015-63969-R is acknowledged. A.H. gratefully 595
acknowledges Erasmus Mundus Joint Doctoral Program SELECT+. J.L. is Serra Húnter Fellow 596
and is grateful to ICREA Academia program. 597
598

References 599
[1] Jian Q, Zhao Y, Wang H. An experimental study of the dynamic behavior of a 2 kW 600 proton exchange membrane fuel cell stack under various loading conditions. Energy 601 2015;80:740–5. 602
[2] Carton JG, Lawlor V, Olabi AG, Hochenauer C, Zauner G. Water droplet accumulation 603 and motion in PEM (Proton Exchange Membrane) fuel cell mini-channels. Energy 604 2012;39:63–73. 605
[3] Sharaf OZ, Orhan MF. An overview of fuel cell technology: Fundamentals and 606 applications. Renewable and Sustainable Energy Reviews 2014;32:810–53. 607
[4] BOETTNER D. Proton exchange membrane (PEM) fuel cell-powered vehicle 608 performance using direct-hydrogen fueling and on-board methanol reforming. Energy 609 2004;29:2317–30. 610
[5] Huang Z-M, Su A, Liu Y-C. Hydrogen generator system using Ru catalyst for PEMFC 611 (proton exchange membrane fuel cell) applications. Energy 2013;51:230–6. 612
[6] Commission E. Comunication from the commission to the European parliament, the 613 council, the European economic and social committee and the committee of the region. 614 2011. 615
[7] Llorca J. Microreactors for the generation of hydrogen from ethanol. In: WH L, VG C, 616 editors. Handbook of sustainable energy, New York, USA: NOVA Publication; 2010, p. 617 693–9. 618
[8] Deluga GA, Salge JR, Schmidt LD, Verykios XE. Renewable hydrogen from ethanol by 619 autothermal reforming. Science (New York, NY) 2004;303:993–7. 620
[9] Philpott BJE. Hydrogen Diffusion Technology, commercial applications of palladium 621 membranes. Platinum Metals Review 1985:12–6. 622
[10] Koch R, López E, Divins NJ, Allué M, Jossen A, Riera J, et al. Ethanol catalytic 623 membrane reformer for direct PEM FC feeding. International Journal of Hydrogen Energy 624 2013;38:5605–15. 625
[11] Hou K, Hughes R. The effect of external mass transfer, competitive adsorption and 626 coking on hydrogen permeation through thin Pd/Ag membranes. Journal of Membrane 627 Science 2002;206:119–30. 628
[12] Unemoto A, Kaimai A, Sato K, Otake T, Yashiro K, Mizusaki J, et al. The effect of co-629 existing gases from the process of steam reforming reaction on hydrogen permeability of 630 palladium alloy membrane at high temperatures. International Journal of Hydrogen 631 Energy 2007;32:2881–7. 632
[13] Patrascu M, Sheintuch M. On-site pure hydrogen production by methane steam 633 reforming in high flux membrane reactor: Experimental validation, model predictions and 634 membrane inhibition. Chemical Engineering Journal 2015;262:862–74. 635
[14] Gallucci F, Chiaravalloti F, Tosti S, Drioli E, Basile A. The effect of mixture gas on 636 hydrogen permeation through a palladium membrane: Experimental study and theoretical 637 approach. International Journal of Hydrogen Energy 2007;32:1837–45. 638
[15] Li A, Liang W, Hughes R. The effect of carbon monoxide and steam on the hydrogen 639 permeability of a Pd/stainless steel membrane. Journal of Membrane Science 640 2000;165:135–41. 641
[16] Peters T a., Stange M, Klette H, Bredesen R. High pressure performance of thin Pd-642

23%Ag/stainless steel composite membranes in water gas shift gas mixtures; influence of 643 dilution, mass transfer and surface effects on the hydrogen flux. Journal of Membrane 644 Science 2008;316:119–27. 645
[17] Amandusson H, Ekedahl L-G, Dannetun H. The effect of CO and O2 on hydrogen 646 permeation through a palladium membrane. Applied Surface Science 2000;153:259–67. 647
[18] Mejdell AL, Chen D, Peters TA, Bredesen R, Venvik HJ. The effect of heat treatment in 648 air on CO inhibition of a ∼3μm Pd–Ag (23wt.%) membrane. Journal of Membrane 649 Science 2010;350:371–7. 650
[19] Catalano J, Giacinti Baschetti M, Sarti GC. Influence of the gas phase resistance on 651 hydrogen flux through thin palladium–silver membranes. Journal of Membrane Science 652 2009;339:57–67. 653
[20] Barreiro MM, Maroño M, Sánchez JM. Hydrogen permeation through a Pd-based 654 membrane and RWGS conversion in H2/CO2, H2/N2/CO2 and H2/H2O/CO2 mixtures. 655 International Journal of Hydrogen Energy 2014;39:4710–6. 656
[21] Cornaglia L, Múnera J, Lombardo E. Recent advances in catalysts, palladium alloys and 657 high temperature WGS membrane reactors. International Journal of Hydrogen Energy 658 2015;40:3423–37. 659
[22] Zhang C, Liu Z, Zhou W, Chan SH, Wang Y. Dynamic performance of a high-660 temperature PEM fuel cell – An experimental study. Energy 2015;90:1949–55. 661
[23] García VM, López E, Serra M, Llorca J. Dynamic modeling of a three-stage low-662 temperature ethanol reformer for fuel cell application. Journal of Power Sources 663 2009;192:208–15. 664
[24] García VM, López E, Serra M, Llorca J, Riera J. Dynamic modeling and controllability 665 analysis of an ethanol reformer for fuel cell application. International Journal of Hydrogen 666 Energy 2010;35:9768–75. 667
[25] Funke M, Kühl H-D, Faulhaber S, Pawlik J. A dynamic model of the fuel processor for a 668 residential PEM fuel cell energy system. Chemical Engineering Science 2009;64:1860–7. 669
[26] Jahn H-J, Schroer W. Dynamic simulation model of a steam reformer for a residential 670 fuel cell power plant. Journal of Power Sources 2005;150:101–9. 671
[27] Stamps AT, Gatzke EP. Dynamic modeling of a methanol reformer—PEMFC stack 672 system for analysis and design. Journal of Power Sources 2006;161:356–70. 673
[28] Kvamsdal HM, Svendsen HF, Olsvik O, Hertzberg T. Dynamic simulation and 674 optimization of a catalytic steam reformer. Chemical Engineering Science 1999;54:2697–675 706. 676
[29] LIN S, CHEN Y, YU C, LIU Y, LEE C. Dynamic modeling and control structure design of 677 an experimental fuel processor. International Journal of Hydrogen Energy 2006;31:413–678 26. 679
[30] Tsourapas V, Sun J, Nickens A. Modeling and dynamics of an autothermal JP5 fuel 680 reformer for marine fuel cell applications. Energy 2008;33:300–10. 681
[31] López E, Divins NJ, Llorca J. Hydrogen production from ethanol over Pd–Rh/CeO2 with 682 a metallic membrane reactor. Catalysis Today 2012;193:145–50. 683
[32] Idriss H, Scott M, Llorca J, Chan SC, Chiu W, Sheng P-Y, et al. A phenomenological 684 study of the metal-oxide interface: the role of catalysis in hydrogen production from 685 renewable resources. ChemSusChem 2008;1:905–10. 686

[33] Domínguez M, Taboada E, Molins E, Llorca J. Ethanol steam reforming at very low 687 temperature over cobalt talc in a membrane reactor. Catalysis Today 2012;193:101–6. 688
[34] Hedayati A, Le Corre O, Lacarrière B, Llorca J. Exergetic study of catalytic steam 689 reforming of bio-ethanol over Pd–Rh/CeO2 with hydrogen purification in a membrane 690 reactor. International Journal of Hydrogen Energy 2015;40:3574–81. 691
[35] Reb Research & Consulting, accessed on 2015-09-23, http://www.rebresearch.com/ 692 2015. 693
[36] Divins NJ, López E, Rodríguez Á, Vega D, Llorca J. Bio-ethanol steam reforming and 694 autothermal reforming in 3-μm channels coated with RhPd/CeO2 for hydrogen 695 generation. Chemical Engineering and Processing: Process Intensification 2013;64:31–7. 696
[37] Hedayati A, Le Corre O, Lacarrière B, Llorca J. Experimental and exergy evaluation of 697 ethanol catalytic steam reforming in a membrane reactor. Catalysis Today 2016;IN 698 PRESS. 699
[38] López E, Divins NJ, Anzola A, Schbib S, Borio D, Llorca J. Ethanol steam reforming for 700 hydrogen generation over structured catalysts. International Journal of Hydrogen Energy 701 2013;38:4418–28. 702
[39] Basile A. Hydrogen Production Using Pd-based Membrane Reactors for Fuel Cells. 703 Topics in Catalysis 2008;51:107–22. 704
[40] Hla SS, Morpeth LD, Dolan MD. Modelling and experimental studies of a water-gas shift 705 catalytic membrane reactor. Chemical Engineering Journal 2015;276:289–302. 706
[41] Basile A, Curcio S, Bagnato G, Liguori S, Jokar SM, Iulianelli A. Water gas shift reaction 707 in membrane reactors: Theoretical investigation by artificial neural networks model and 708 experimental validation. International Journal of Hydrogen Energy 2015;40:5897–906. 709
[42] Sanz R, Calles JA, Alique D, Furones L, Ordóñez S, Marín P. Hydrogen production in a 710 Pore-Plated Pd-membrane reactor: Experimental analysis and model validation for the 711 Water Gas Shift reaction. International Journal of Hydrogen Energy 2015;40:3472–84. 712
[43] Di Marcoberardino G, Sosio F, Manzolini G, Campanari S. Fixed bed membrane reactor 713 for hydrogen production from steam methane reforming: Experimental and modeling 714 approach. International Journal of Hydrogen Energy 2015;40:7559–67. 715
[44] Iulianelli A, Liguori S, Huang Y, Basile A. Model biogas steam reforming in a thin Pd-716 supported membrane reactor to generate clean hydrogen for fuel cells. Journal of Power 717 Sources 2015;273:25–32. 718
[45] Chein RY, Chen YC, Chyou YP, Chung JN. Three-dimensional numerical modeling on 719 high pressure membrane reactors for high temperature water-gas shift reaction. 720 International Journal of Hydrogen Energy 2014;39:15517–29. 721
[46] Papadias DD, Lee SHD, Ferrandon M, Ahmed S. An analytical and experimental 722 investigation of high-pressure catalytic steam reforming of ethanol in a hydrogen selective 723 membrane reactor. International Journal of Hydrogen Energy 2010;35:2004–17. 724
[47] Jakobsen, A. H. Chemical Reactor Modeling: Multiphase Reactive Flows. 2nd ed. 725 London: Springer; 2014. 726
727
728