local hydrogen production via catalytic...
TRANSCRIPT

Local Hydrogen Production via Catalytic Reformation of Fossil and Renewable Feedstocks
N. Muradov and F. Smith
Florida Solar Energy Center
Research Period: June 2002 to December 2007
Summary
Economical, safety and other factors will eventually necessitate on-site manufacturing of liquid hydrogen at the NASA-KSC site. The objective of this project was to develop an economically viable process for local production of hydrogen from renewable and fossil-based methane-containing feedstocks with minimal environmental impact. In this project, research and development was conducted on two novel hydrogen production technologies: (i) direct reforming of landfill gas (LFG) to syngas and its further processing to H2, and (ii) catalytic pyrolysis of methane to hydrogen and carbon. The advantages of direct reforming of LFG are that it does not require preliminary recovery of methane from LFG, which simplifies the process. The thermodynamic analysis of CO2 reforming of methane using AspenPlusTM chemical process simulator was conducted. Efficient and stable catalysts for the direct reforming of LFG were developed and tested. The catalytic activity of a number of commercial and synthesized transition metal catalysts (Ni, Fe, Pt, Pd, Ir, Ru, and Rh) was evaluated. Ni-based catalyst was down-selected for further evaluation and the operational conditions for its efficient and stable operation were determined. A pilot scale unit with the capacity of 1 SCFM of H2 was designed, fabricated and successfully operated using CH4:CO2=1.3:1 mixture mimicking local (Cocoa) LFG composition. It was estimated that the local resources of LFG would be sufficient for production of 5 tons/day of hydrogen. A preliminary economic assessment indicates the cost range of liquid hydrogen product to be $3.00-$6.00 per kilogram depending upon the production capacity and whether or not carbon sequestration is added. For the methane catalytic pyrolysis process, its advantage is that it allows production of hydrogen and clean carbon, with no or minimal CO2 emissions. The thermodynamic analysis of methane pyrolysis in two different regimes (thermo-neutral and external heat input) using AspenPlusTM chemical process simulator was conducted. Experimental data showed fairly good agreement with the simulation results. Comprehensive catalyst and process development studies for the methane pyrolysis reaction were conducted. Characterization and structural studies of carbon products of the process were conducted and potential markets for carbon products were evaluated. The technical feasibility of converting citrus waste products (e.g., citrus pulp pellets, CPP) into high purity hydrogen with the yield of 0.55 L of H2 per gram of CPP was also demonstrated. The research output consisted of four patent applications, 27 publications, 17 presentations, and support for two graduate students.
NASA/CR—2009-215441 27

Local Hydrogen Production via Catalytic Reformation of Fossil and Renewable Feedstocks
N. Muradov and F. Smith
Florida Solar Energy Center
Research Period: June 2002 to December 2007
Abstract Economical, safety and other factors will potentially necessitate on-site manufacturing of liquid hydrogen at the NASA-KSC site. Currently, liquid hydrogen delivered to NASA-KSC is manufactured by steam methane reforming (SMR). The shortcomings of SMR relate to the production of considerable amounts of CO2 emissions (which may become a serious problem in a carbon-restricted environment) and ever increasing cost of the natural gas (NG) feedstock. The objective of this project is to develop a process for local production of hydrogen from methane-containing, preferably, renewable feedstocks with minimal environmental impact. In this project, analytical (AspenPlusTM chemical process simulator) and experimental studies on the development of two novel hydrogen production technologies were conducted, namely: (i) direct reforming of landfill gas (LFG) to syngas and its further processing to H2, and (ii) catalytic pyrolysis (or decomposition) of methane to hydrogen and carbon. It was estimated that the local resources of LFG would be sufficient for production of 5 tons/day of hydrogen. The advantages of direct reforming of LFG is that it does not require preliminary recovery of methane from LFG, which simplifies the process and reduce the cost of hydrogen production. Efficient and stable catalysts for the direct reforming of LFG were developed and tested. A pilot scale unit with the capacity of 1 SCFM of H2 was designed, fabricated and operated using CH4:CO2=1.3:1 mixture mimicking local (Cocoa) LFG composition. Techno-economic evaluation of the process using AspenPlusTM process simulator was conducted. The advantage of the methane catalytic pyrolysis process is that it allows producing hydrogen and value-added byproduct: clean carbon without or minimal CO2 emissions. Comprehensive catalyst and process development studies for the methane pyrolysis reaction were conducted. Since the process is moderately endothermic, the conditions at which the process operates in thermo-neutral regime were determined. Characterization and structural studies of carbon products of the process were conducted. Potential markets for carbon products were evaluated. The technical feasibility of converting citrus waste products (e.g., citrus pulp pellets, CPP) into high purity hydrogen with the yield of 0.55 L of H2 per gram of CPP was demonstrated. The successful implementation of the above technologies would eliminate the necessity for costly and potentially unsafe transportation of liquid hydrogen from Louisiana-based hydrogen plant to the Central Florida.
Introduction In view of ever-increasing prices for hydrocarbon fuels and their dwindling resources, it is imperative to find alternative, preferably, renewable sources of energy for power generation and production of transportation fuels, e.g., hydrogen, synthetic hydrocarbons, etc. Biomass-derived methane-containing gases such as landfill gas (LFG), biogas and digester gas are important resources for power generation and production of hydrogen. LFG is generated by natural degradation of municipal solid waste (MSW) by anaerobic microorganisms. Once the gas is
NASA/CR—2009-215441 253

produced, it is collected by a collection system, which typically consists of a series of wells drilled into landfill and connected by pipelines. The advantages of using LFG as a source of energy and a feedstock are three-fold: (i) it is domestic energy resource, which can be used to offset petroleum imports, increasing our energy security, (ii) it can be obtained at little or no cost, thereby helping to decrease the end-use cost, and (iii) if not used, LFG can potentially create even more environmental damage than CO2 alone, because methane is much more potent greenhouse gas than CO2. Although the resources of LFG are vast and widely available throughout the country, they are mostly unused. According to a recent study, only small portion (330 out of 2100) landfill sites in the U.S. utilize LFG to generate heat or electricity, and over 500 landfills flare or burn the gas outright [1]. Of particular interest is the possibility of converting LFG (or other BMCG) to ecologically clean fuel-hydrogen. Despite the fact that extensive resources of these methane-containing gases are available, no large-scale commercial hydrogen production process has been implemented yet. In Florida, 59 landfills generate about 1.6mln m3/day LFG (in methane equivalent) [2], which could yield up to 100,000 tons of hydrogen per year. Location and LFG capacities of landfills within 50 miles from NASA-KSC are shown in the Appendix. LFG are complex gaseous mixtures containing methane and CO2 as major components along with small amounts of N2, H2, CO, H2S and a variety of organic components (e.g., non-methane hydrocarbons, alcohols, organic acids, esters) and S-, N-, Si-organic impurities. The composition of LFG varies drastically from one source to another, with methane concentration ranging from 40 to 80 vol.% (the balance being predominantly CO2). Table 1 shows the composition of Cocoa, FL landfill gas.
Table 1. Composition of Cocoa landfill gas
In principle, methane could be recovered from LFG using off-the-shelf technologies (e.g., cryogenic absorption, adsorption, membrane separation, etc.), and converted to hydrogen via steam methane reforming (SMR) process. It should be noted, however, that the separation of methane from BMCG is an energy intensive and costly process. Furthermore, in many cases this may not be economically and environmentally advantageous option, especially when the resources are not large enough or the sources are located in remote areas.
Composition of Cocoa LFG (v.%): Methane 48.3 Carbon dioxide 37.1 Nitrogen 11.3 Oxygen 3.3 Hydrogen <0.1 Hydrogen sulfide <0.1 Carbon monoxide <0.01 Ethylene <0.01 Ethane <0.01 Other hydrocarbons <0.01 Heating value: 488.7 BTU/CF
NASA/CR—2009-215441 254
The main objective of the present research work is to develop a novel process for direct (i.e., without preliminary recovery of methane) processing of LFG to synthesis gas (or syngas) and further to hydrogen. This option is technologically more simple (since, no CH4-CO2 separation stage is required) and feedstock flexible and potentially more cost effective than other approaches. Another objective is to develop a process for catalytic pyrolysis of methane into hydrogen and value-added product carbon with minimal CO2 emissions.
Background Since LFG contain CH4 and CO2 as two predominant components, they could be processed to syngas according to a well-known reaction called CO2 reforming of methane (also often called, “dry” reforming). This is a strongly endothermic reaction that is carried out catalytically at the temperature range of 800-950 °C and produces syngas with the H2:CO molar ratio of 1:1 according to the following chemical equation: CH4 + CO2 → 2H2 + 2CO ΔHo= 247 kJ/mol (1) Practical implementation of CO2-reforming of methane faces several key challenges, both technical and economical. One of the most serious problems hindering the practical application of CO2-reforming is the deactivation of metal catalysts due to deposition of carbon (or coke). Carbon formation could be attributed to two reactions: methane decomposition and CO disproportionation (or Boudouard reaction) (2): 2CO → C + CO2 ΔHo= -86.5 kJ/mol (CO) (2) From the practical viewpoint, it is preferable to operate CO2-reforming of methane at moderate temperatures maintaining the CH4:CO2 ratio close to unity, which would require a catalyst that kinetically inhibits the carbon formation under conditions that are thermodynamically favorable for carbon deposition. The form of carbon deposited on metal surfaces is controlled by the reaction temperature: in the lower temperature range of 350-600 °C, amorphous and filamentous carbons are the predominant forms of carbon, whereas an ordered graphitic structure dominates at the temperatures above 700 °C [3]. With regard to catalytic reforming of LFG, the above technical difficulties are aggravated by two additional factors. The first factor relates to the presence of potentially harmful impurities (S-, N-Si- and halogen-containing compounds) that could easily deactivate catalysts used in the reforming process. In principle, these contaminants could be efficiently removed from LFG before the reforming stage using conventional technologies (e.g., selective adsorbents, scrubbers, etc.) [4]. The second complicating factor is concerned with a feedstock non-uniformity. Due to the fact that in the majority of BMCG sources, methane is the predominant component in the mixture (typically, [CH4]= 55-65 vol.%), an undesirable and potentially detrimental methane decomposition reaction (2) may occur at the operating temperatures of the reforming process: Iron-, cobalt- and nickel-based catalysts are known to be particularly active in methane decomposition reaction, and noticeable deposition of carbon on the surface of these catalysts occurs at temperatures as low as 350 °C. The product carbon (or coke) blocks active sites of the catalyst leading to its rapid deactivation. In principle, the deposition of coke could be prevented by: (i) using highly selective catalysts (i.e., catalysts that promote CO2 reforming of methane, but suppress methane decomposition and/or CO disproportionation reactions), and/or
NASA/CR—2009-215441 255
(ii) adding an oxidizing agent to the CH4-CO2 feedstock thus guarding the catalyst against coke formation. Another technological approach to local hydrogen production explored in this work relates to catalytic pyrolysis of methane into hydrogen and value-added carbon products. In contrast to conventional processes, the significant part of the feedstock carbon will end up in the form of valuable carbon byproducts (activated carbon, pyrolytic graphite, carbon filaments) rather than CO2. Marketing of carbon byproduct will reduce the net cost of hydrogen production. This approach will significantly expand the resources for local hydrogen production and allow a smooth transition from NG to local renewable feedstocks. Benefits to NASA The successful implementation of the above technologies would eliminate the necessity for costly and potentially unsafe transportation of liquid hydrogen from Louisiana-based hydrogen plant to the NASA-KSC site. This report consists of two main sections:
A. Catalytic reforming of CH4-CO2 mixtures followed by water gas shift of syngas and separation of H2-CO2 mixture
B. Catalytic pyrolysis of methane to hydrogen-rich gas and value-added carbon products
Experimental The premixed gaseous mixture with the composition of CH4- 56.9, and CO2- 43.1 vol.% (i.e., molar ratio of CH4:CO2 =1.32:1) was obtained from Holox Inc. and used as a baseline feedstock in all experiments. This particular CH4/CO2 ratio mimics that of the landfill gas produced by the local landfill in Cocoa, Florida. For the sake of simplicity, N2, O2, H2S and other minor impurities were not included in the tested feedstock. Argon (99.999 vol.%) and oxygen (99.5 vol.%) (both from Air Products and Chemicals) were used in the experiments. Steam was produced from deionized water and introduced into the reactor using a precision syringe pump (Cole Palmer) and an evaporator. Ru (0.5 wt.%)/Al2O3, Pd (1 wt.%)/Al2O3, Pt (0.5 wt.%)/Al2O3 catalysts were obtained from Aldrich Chemical Co. Rh (5 wt.%)/Al2O3 was purchased from Strem Chemicals. Ir (1 wt.%)/Al2O3 and Ni(55-60 wt.%)/kieselguhr were obtained from Alfa Aesar. NiO (1-15 wt.%)/Al2O3 and NiO (25-45 wt.%) - Al2O3 (45-65 wt.%) - Ca aluminate (3-8 wt.%) were obtained from Süd-Chemie Inc. Fe-Cr-oxide catalyst containing 8-12 wt.% of Cr2O3 and small amounts of copper oxide was also obtained from Süd-Chemie Inc. Al2O3-supported Co (10 wt.%)-Mo (10 wt.%) oxide catalyst was synthesized according to the procedure described by Richardson [5]. The catalysts were used in the form of 10-18 mesh granules. A catalyst (0.5 g) was placed inside a quartz micro-reactor (O.D. = 1.2 cm) and purged with Ar at 600 °C for 1 hr before the experiments. The reactor temperature was controlled using a type K thermocouple and Love Controls temperature controller. All the experiments were conducted at the atmospheric pressure. The average residence time within the catalyst layer was about 1 s. The amount of carbon on the catalyst surface after the reforming experiments was determined by quantitatively combusting carbon in a stream of oxygen and measuring the amount of CO and CO2 produced. The gaseous products of the reforming reaction were analyzed gas chromatographically using two SRI- 8610A GC-TCD instruments: the first gas chromatograph used Ar as a carrier gas and a silica gel packed column, and the second one used He and Hayesep DB column.
NASA/CR—2009-215441 256

Results and Discussion Description of the Proposed Concept Figure 1 depicts a simplified schematic diagram of the proposed concept that utilizes NG, LFG and citrus waste. Based on the information provided by the Cocoa landfill facility management we estimated that the LFG resources from the facility would be adequate for the production of about 5 ton/day of hydrogen for the next 50 years. According to the proposed concept, the on-site production of liquid hydrogen could be realized via two technological options (or their combination).
Figure 1. Schematic diagram of the concept. In the Option 1 (upper section of Figure 1), methane is separated from CO2 at the LFG treatment plant and pumped into the Florida Gas Transmission System (which is in a short distance from the landfill site). Methane (in mixture with NG) is delivered to KSC site (the distance of approximately 15 miles), where it is pyrolyzed into hydrogen and carbon. Hydrogen is liquefied and stored for the use in the Space Shuttle program. Carbon could be marketed, thus reducing the net cost of hydrogen production. According to the Option 2 (lower section of Figure 2), LFG is purified of sulfurous and siloxane impurities and directly reformed into the synthesis gas (H2-CO mixture of about equimolar composition). The synthesis gas is further conditioned and purified into hydrogen gas that is directed to a hydrogen liquefaction unit. The advantage of this approach is that it obviates the need for the expensive and energy intensive preliminary CO2 separation stage. Another advantage relates to the possibility of co-processing of other renewable feedstocks such as biogas, or the producer gas from biomass (e.g., citrus waste) pyrolysis/gasification unit.
LFG
L-H2 CH4
H2
CH4-CO2 reforming plant
methane recovery plant
H2 liquefaction unitCocoa landfill site
citrus waste pyrolyzer/ gasifier
H2 to other end-users
Florida Gas Transmission System
to KSC
KSC
LFG
H2 plant
~15 mi
carbon
H2 carbon
NASA/CR—2009-215441 257

Hydrogen Production via Catalytic Reforming of CH4-CO2 Mixtures Mimicking LFG Thermodynamic analysis of CH4-CO2 and CH4-CO2- O2 reforming—Aspen Technology’s AspenPlusTM chemical process simulation (CPS) platform was used to determine equilibria of CH4-CO2 and CH4-CO2-O2 mixtures. The reforming reactions were modeled using a Gibbs reactor minimizing the free energies in order to calculate the conversion rates at given operating conditions. Figure 2 depicts the equilibrium concentrations of reaction products produced from CH4-CO2 (1.3°:1 mol/mol) mixture at the temperature range of 300-1000 °C and 1 atm pressure. It is evident from the Figure 2 that H2/CO molar ratio is greater than 1 and that elemental carbon is present in the mix of products in the entire range of temperatures examined. Both facts point to the contribution of methane decomposition reaction (3). Potentially, carbon product may lay down on the catalyst surface and deactivate it. The production of carbon can be prevented by adding an oxidant, such as CO2, steam or oxygen, to the reacting mixture. The use of oxygen may present an additional benefit of providing the heat input to the process, namely, it allows arranging the process in a thermoneutral regime. We conducted AspenPlusTM simulation studies to determine the amount of oxygen to be added to the CH4:CO2 (1.3:1 molar) mixture in order to carry out the reforming process in an autothermal (or thermoneutral) regime at the practical range of temperatures. Figure 3 depicts the heat flow into the reactor as a function of the amount of oxygen in the feed and the process temperature. Each curve corresponds to a certain amount of O2 introduced into the reactor; the curves intersect X-axis at a certain temperature corresponding to the conditions of thermo-neutrality. We selected the temperature of 850 °C as a baseline temperature for the CH4-CO2 reforming process. The data show that at this temperature and pressure the condition of thermo-neutrality in the reactor can be reached at O2:CH4 = 0.675 (mol/mol).
0
0.1
0.2
0.3
0.4
0.5
0.6
300 400 500 600 700 800 900 1000
Temperature, oC
Mol
ar F
ract
ion
H2
CO
H2O
CO2
CH4
C
Figure 3. Heat flow as a function of T and amount of O2. Feedstock: CH4- 0.59 kg-mol/hr, CO2-0.45 kg-mol/hr(25 °C, 1 atm).
-60
-40
-20
0
20
40
60
250 350 450 550 650 750 850 950
Temperature, oC
Hea
t flo
w (k
W)
0 kg-mol/hr O20.09 kg-mol/hr O20.18 kg-mol/hr O20.27 kg-mol/hr O20.36 kg-mol/hr O20.45 kg-mol/hr O2
Figure 2. Thermodynamic equilibrium composition of CH4:CO2 (1.3°:1 molar) mix.
NASA/CR—2009-215441 258
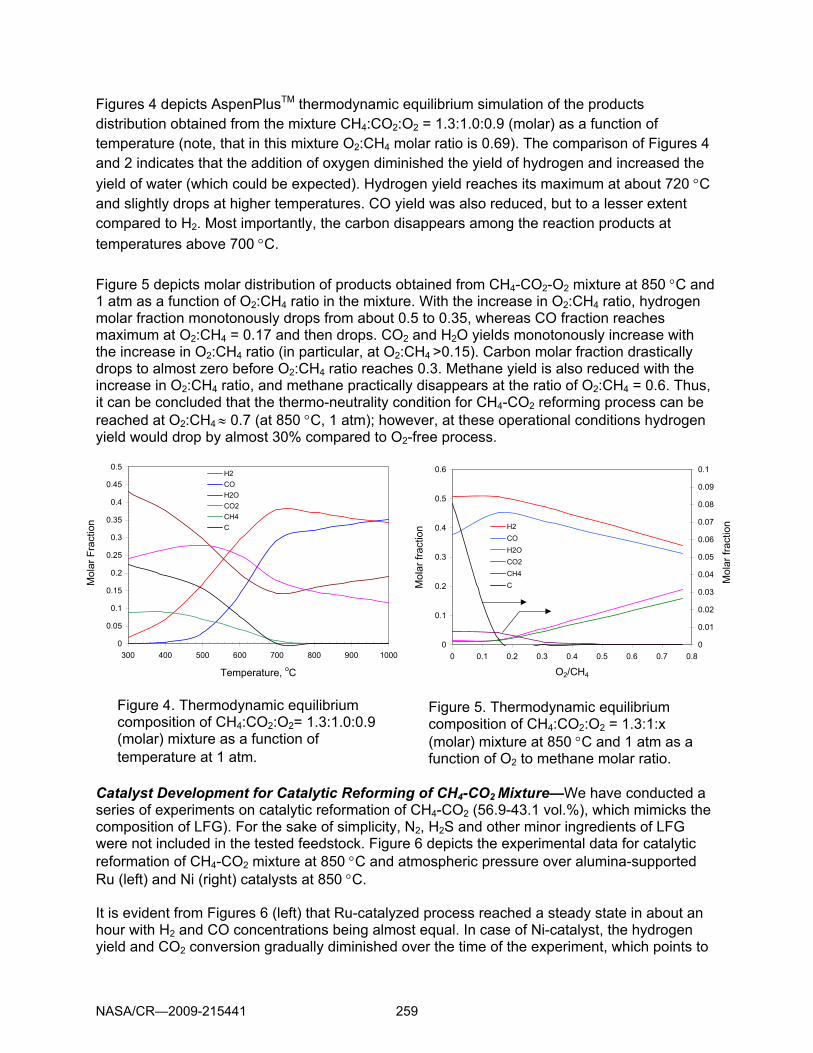
Figures 4 depicts AspenPlusTM thermodynamic equilibrium simulation of the products distribution obtained from the mixture CH4:CO2:O2 = 1.3:1.0:0.9 (molar) as a function of temperature (note, that in this mixture O2:CH4 molar ratio is 0.69). The comparison of Figures 4 and 2 indicates that the addition of oxygen diminished the yield of hydrogen and increased the yield of water (which could be expected). Hydrogen yield reaches its maximum at about 720 °C and slightly drops at higher temperatures. CO yield was also reduced, but to a lesser extent compared to H2. Most importantly, the carbon disappears among the reaction products at temperatures above 700 °C. Figure 5 depicts molar distribution of products obtained from CH4-CO2-O2 mixture at 850 °C and 1 atm as a function of O2:CH4 ratio in the mixture. With the increase in O2:CH4 ratio, hydrogen molar fraction monotonously drops from about 0.5 to 0.35, whereas CO fraction reaches maximum at O2:CH4 = 0.17 and then drops. CO2 and H2O yields monotonously increase with the increase in O2:CH4 ratio (in particular, at O2:CH4 >0.15). Carbon molar fraction drastically drops to almost zero before O2:CH4 ratio reaches 0.3. Methane yield is also reduced with the increase in O2:CH4 ratio, and methane practically disappears at the ratio of O2:CH4 = 0.6. Thus, it can be concluded that the thermo-neutrality condition for CH4-CO2 reforming process can be reached at O2:CH4 ≈ 0.7 (at 850 °C, 1 atm); however, at these operational conditions hydrogen yield would drop by almost 30% compared to O2-free process. Catalyst Development for Catalytic Reforming of CH4-CO2 Mixture—We have conducted a series of experiments on catalytic reformation of CH4-CO2 (56.9-43.1 vol.%), which mimicks the composition of LFG). For the sake of simplicity, N2, H2S and other minor ingredients of LFG were not included in the tested feedstock. Figure 6 depicts the experimental data for catalytic reformation of CH4-CO2 mixture at 850 °C and atmospheric pressure over alumina-supported Ru (left) and Ni (right) catalysts at 850 °C. It is evident from Figures 6 (left) that Ru-catalyzed process reached a steady state in about an hour with H2 and CO concentrations being almost equal. In case of Ni-catalyst, the hydrogen yield and CO2 conversion gradually diminished over the time of the experiment, which points to
0
0.05
0.1
0.15
0.2
0.25
0.3
0.35
0.4
0.45
0.5
300 400 500 600 700 800 900 1000
Temperature, oC
Mol
ar F
ract
ion
H2COH2OCO2CH4C
0
0.1
0.2
0.3
0.4
0.5
0.6
0 0.1 0.2 0.3 0.4 0.5 0.6 0.7 0.8
O2/CH4
Mol
ar fr
actio
n
0
0.01
0.02
0.03
0.04
0.05
0.06
0.07
0.08
0.09
0.1
Mol
ar fr
actio
nH2COH2OCO2CH4C
Figure 4. Thermodynamic equilibrium composition of CH4:CO2:O2= 1.3:1.0:0.9 (molar) mixture as a function of temperature at 1 atm.
Figure 5. Thermodynamic equilibrium composition of CH4:CO2:O2 = 1.3:1:x (molar) mixture at 850 °C and 1 atm as a function of O2 to methane molar ratio.
NASA/CR—2009-215441 259

the deactivation of the Ni catalyst. The analysis of the catalyst after the reforming reaction indicated the presence of carbon deposits on its surface. Figure 7 summarizes the data on the activity and selectivity of the tested catalysts for CH4-CO2 reforming. The measure of activity of the catalysts is determined by the extent of CO2 conversion during the steady state reforming reaction (using CH4 conversion for this purpose could be misleading, because CH4 could also participate in the dissociation reaction). The measure of the catalyst selectivity toward CH4-CO2 reforming reaction is determined by the quantity of carbon deposited on the catalyst surface: lesser is the amount of carbon (which is proportional to the methane dissociation yield), higher is the catalyst selectivity for CH4-CO2 reforming reaction. It can be seen from the Figure 7 that Ru-, Ir- and Pt-based catalysts demonstrated both high activity and selectivity for CO2 reforming of methane. Practically no carbon was detected on the surface of these catalysts. On the other hand, Pd- and Rh-catalysts, although featuring high activity in the reforming reaction showed some minor activity in methane decomposition reaction.
Figure 6. Catalytic reforming of CH4-CO2 (56.9-43.1 vol.%) mixture over Ru (0.5 wt.%)
/Al2O3 (left) and NiO(1-15 wt.%)/Al2O3 catalysts at 850 °C.
0.0251 0.04690.000588
0.2777 0.267 0.28670.3183
0.0223 0.00059 0 0
0.989 0.988 0.983 0.974 0.957 0.952 0.943 0.942 0.9330.865
0.202 0.1990.139
0.000698 0.001290
0.1
0.2
0.3
0.4
0.5
0.6
0.7
0.8
0.9
1
Ru/Al2O3
Pt/Al2O3
Rh/Al2O3
Pd/Al2O3
Ir/Al2O3
NiO/Al2O3
Ni/Al2O3
NiO/Ca aluminate/Al2O3
Ni/Kiese
lguhrNi-M
oCo-M
o
Ni-Mo TK75
1 Fe
Catalysts
Mas
s of
Cok
e Fo
rmed
(g/g
cat
.)
Mass of Coke formed (g/g of cat.)
Average Conversion over 5 hours
Figure 7. Comparative assessment of different catalysts for catalytic reforming of CH4-CO2 mixture.
0
10
20
30
40
50
60
0 100 200 300
Time (min.)
Pro
duct
s (v
ol.%
)
CO2
CH4
H2
CO
0
10
20
30
40
50
60
0 100 200 300
Time (min.)
Pro
duct
s (v
ol.%
)CO2CH4H2CO
NASA/CR—2009-215441 260
All Ni-based catalysts were active in both CO2 reforming and CH4 decomposition reactions, thus, demonstrating very poor selectivity for CH4-CO2 reforming reaction. These catalysts produced significant quantities of carbon deposits, which adversely affected their catalytic activity. For the sake of comparison, we also tested Fe-Cr oxide and Co-Mo oxide catalysts in CH4-CO2 reforming reaction (it was reported recently that silica-alumina supported Co catalysts showed high activity in CO2 reforming of methane [6]). Neither of these catalysts showed adequate catalytic activity for the reforming reaction in operating conditions similar to those of Ni-catalysts. All the transition metal catalysts tested could be arranged according to their activity for CO2 reforming reaction (at 850 °C) in the following order1: Ru > Pt > Rh > Pd > Ir > Ni >> Co-Mo > Fe-Cr The order of selectivity toward CO2 reforming of methane (850 °C) is as follows: Ru ≈ Ir > Pt > Rh > Pd >> Ni It is interesting to compare the experimental data for Ru- and Ni-catalyzed reforming reactions with the results of the thermodynamic equilibrium analysis of the CH4:CO2=1.3:1 mixture (see Figure 2). It is evident that the simulation data are more consistent with the results of Ni-catalyzed CH4-CO2 reforming (particularly, at the onset of the experiment), compared to Ru-catalyzed reaction. This is an indication of high catalytic activity of Ni-catalyst for both CH4-CO2 reforming and methane decomposition reactions. In contrast, Ru-catalyst demonstrates high activity only for CH4-CO2 reforming reaction and practically no activity for the methane decomposition reaction. From the practical viewpoint, Ru and other noble metal catalysts are rather expensive and unlikely to be used in large-scale commercial production of syngas via catalytic reforming of BMCG. Ni-based catalysts are more affordable and are widely used in commercial hydrogen production units, e.g., steam methane reforming process. Thus, it would be advantageous from practical and economical viewpoints to develop a sustainable process for direct catalytic reforming of BMCG using inexpensive Ni-catalysts. Catalytic Reforming of CH4-CO2-O2 Mixtures in Autothermal Regime—In this section we studied the effect of adding oxygen to the feedstock. The objectives were twofold:
1) To provide heat input to the reactor 2) To obviate the catalyst deactivation problem.
We conducted a series of experiments on autothermal catalytic reforming of CH4-CO2-O2 mixtures over Ni/alumina catalyst using a bench-scale and a pilot-scale (1 SCFM) units. Bench-scale experiments were conducted using a quartz reactor (OD = 10 mm). It was found that the addition of oxygen to the feedstock significantly decreased the amount of carbon deposit. Figures 8 and 9 show the effect of oxygen on the amount of carbon deposited on the catalyst surface and the distribution of reforming products. The important conclusion that can be drawn from the Figures 8 and 9 is that carbon practically disappears from the catalyst surface at the molar ratio of O2:CH4 ≈ 0.2 and higher. It is interesting to compare the experimental results with the AspenPlusTM simulation data on the reforming of CH4:CO2:O2 mixtures.
1 It should be noted that this is an apparent (or relative) order of activity (since metal content in the catalysts differs)
NASA/CR—2009-215441 261

The comparison of Figures 5 and 9 indicates that there is a good agreement between experimental and predicted values for the molar fractions of the reforming products. Thus the experiments demonstrated that the addition of oxygen to the CH4-CO2 feedstock improved long-term stability of Ni-catalyst by preventing carbon build-up on its surface. Experimental Validation of Catalytic Reforming of CH4-CO2 and CH4-CO2-O2 Feedstocks Using Pilot-Scale Unit with the Capacity of 1 SCFM Unit—Figure 10 depicts the schematics of the laboratory scale unit used for hydrogen production via catalytic reforming of CH4-CO2-O2 gaseous mixtures. The experimental unit consists of the following main sub-systems: (i) metering and delivery of gaseous feedstocks, (ii) catalytic reformer, (iii) gas conditioning (including low and high temperature WGS reactors, (iv) hydrogen recovery and purification, and (v) analytical sub-system. Figure 11 shows hydrogen production unit with the capacity of 1 SCFM at FSEC’s Hydrogen R&D lab. In the first series of experiments, we introduced different amounts of oxygen to the reforming reactor along with the CH4-CO2 (56.9-43.1 vol.%) feedstock and measured the temperature within the reactor. Initial test was performed to determine the affect of O2/CH4 ratio on the internal reactor temperature. It was found that as the ratio of O2/CH4 increases, the temperature changes in direct proportionality. This trend shows the endothermic nature of dry reforming reaction, and the relationship between the amount of O2 necessary for partial oxidation and combustion chemistries and reactor temperature. Thus, the reforming reactor temperature could be controlled by the flow rate of O2. According to Aspen simulation data (see section 4.2.1), the thermo-neutrality condition could be achieved at O2/CH4 ratio of 0.7. It was demonstrated that at the O2/CH4=0.7 ratio the reactor temperature can be maintained at the level of 850 °C. It is evident that there is a good agreement between simulation and experimental data.
0
0.1
0.2
0.3
0.4
0.5
0.6
0 0.2 0.4 0.6 0.8
O2/CH4 Ratio
Mol
ar fr
actio
n
0
0.01
0.02
0.03
0.04
0.05
0.06
0.07
0.08
0.09
0.1
Mol
ar fr
actio
nH2COH20CO2CCH4
0.1243
0.2364
0.5877
0.0015 2.1E-05 3.5E-05
0.1796
0.2777
0
0.0947
0.0000
0.1000
0.2000
0.3000
0.4000
0.5000
0.6000
0.7000
0 0.09 0.195 0.439 0.753
O2/CH4 Ratio
Am
ount
of w
ater
and
car
bon,
g/g
(cat
)
carbon
water
Figure 8. Amounts of carbon and water produced during reforming of CH4:CO2:O2=1.3:1:x (molar) mixture at 850 °C and 1 atm over Ni-catalyst as a function of O2:CH4 molar ratio in the feedstock. Time: 5 hrs.
Figure 9. Molar distribution of products of CH4:CO2:O2=1.3:1:x (molar) reforming at 850 °C and 1 atm over Ni-catalyst as a function of O2:CH4 ratio in the feedstock.
NASA/CR—2009-215441 262
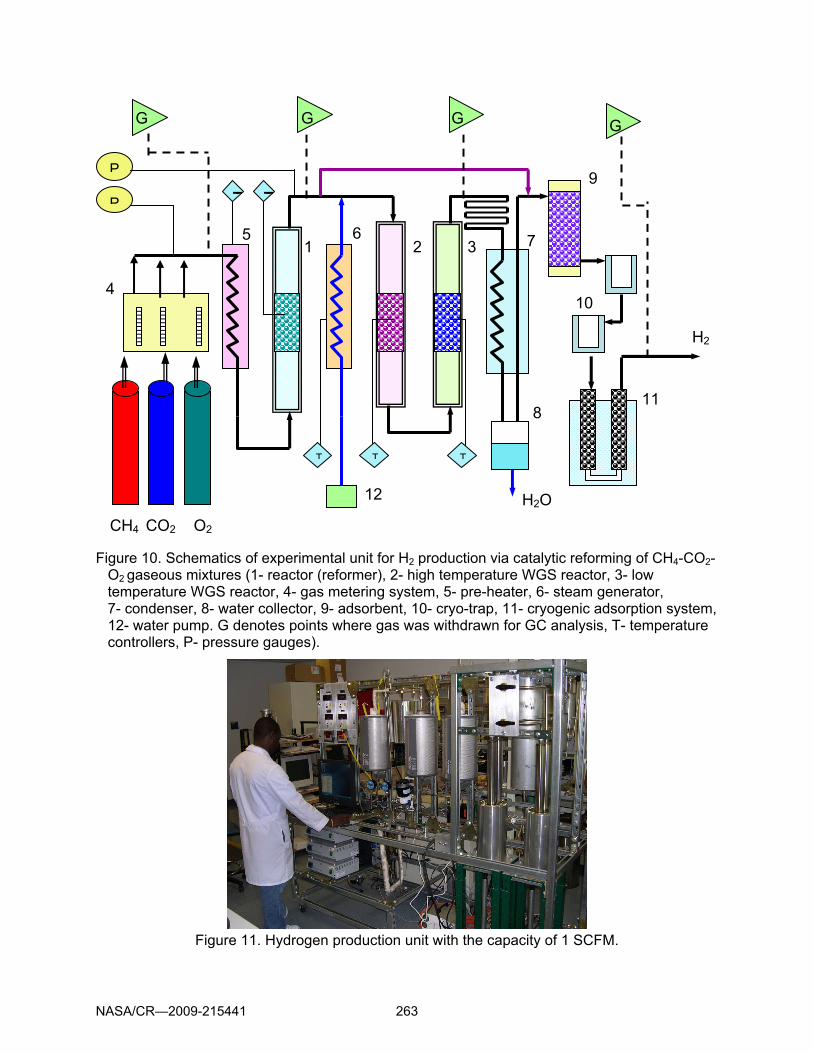
Figure 10. Schematics of experimental unit for H2 production via catalytic reforming of CH4-CO2-O2 gaseous mixtures (1- reactor (reformer), 2- high temperature WGS reactor, 3- low temperature WGS reactor, 4- gas metering system, 5- pre-heater, 6- steam generator, 7- condenser, 8- water collector, 9- adsorbent, 10- cryo-trap, 11- cryogenic adsorption system, 12- water pump. G denotes points where gas was withdrawn for GC analysis, T- temperature controllers, P- pressure gauges).
Figure 11. Hydrogen production unit with the capacity of 1 SCFM.
CH4
P T T
T T T
P
H2
H2O CO2
1 2 3
4
5 6 7
8
9
10
11
12
G GGG
O2
NASA/CR—2009-215441 263

The following outlines the results of the initial testing of the pilot scale unit. In the first series of testing experiment the unit was operated at a half capacity. The feed flow rate was 13.5 SLPM; with mole fractions of CH4, CO2, and O2 equal to 0.37, 0.37, and 0.26 respectively. Figure 12 illustrates product concentrations after the reforming reactor over a 7-hr period. The relatively high CO2 yield may point to excessive combustion of methane occurring in the reformer. Improved mixing before the reactor should obviate this problem and reduce the level of CO2 in syngas.
05
10152025
3035404550
0 1 2 3 4 5 6 7
Time (hrs.)
Con
cent
ratio
n (v
ol. %
)
00.20.40.60.81
1.21.41.61.82
Con
cent
ratio
n, C
H4
(vol
. %)
H2COCO2CH4
Figure 12. Reforming reactor product poncentrations over a 7-hr period.
0102030405060708090
100
0 1 2 3 4 5 6 7Time (hrs.)
Con
cent
ratio
n H
2, C
O2,
CO
(v
ol. %
)
0
0.2
0.4
0.6
0.8
1
1.2
1.4
Con
cent
ratio
n, C
H4 (
vol.
%)H2
CO2COCH4
Figure 13. Composition of products of high-temperature water gas shift reaction using the effluent gas after the catalytic reformer as a feedstock.
NASA/CR—2009-215441 264

The syn-gas produced was directed to two-stage WGS reactors. Figure 13 shows product concentrations after WGS. CO concentration decreased from 40% to approximately 2%. This shows that high-temperature WGS (HT-WGS) reactor performs adequately, whereas the low temperature WGS (LT-WGS) reactor still needs to improve its performance. It was found that the performance of LT-WGS reactor could be noticeably improved by adding more steam to the feedstock. A 24% increase in the steam flowrate resulted in 1 vol.% drop in CO concentration after LT-WGS reactor. 1 vol.% may seem to be insignificant, but one should take into consideration that at smaller CO percentages it is increasingly difficult to convert it into CO2 in the presence of large amounts of CO2 in the feedstock. The reforming reactor was operated at the system capacity of 23 SLPM (in H2 equivalent) (which is close to the unit’s full capacity of 1 SCFM). Figure 14 shows the concentration profile of syngas produced over a 13-hr period (i.e., two days of operation). As in the previous experiment the feedstock composition was CH4-CO2 (56.9-43.1 vol.%), O2:CH4=0.7 (by volume), temperature 850 °C and Ni-catalyst.
Figure 14. Reforming of CH4-CO2-O2 (1.3 :1 :0.9 mol) at 850 °C over Ni-catalyst.
It is evident that no apparent catalyst deactivation occurred during the two-days long experiment (longer experiments are now in progress). The average concentrations of H2, CO and CO2 in the effluent gas (after the reformer) were 43, 39, and 18 vol.%, respectively. Thus, the products composition is in fairly good agreement with the equilibrium composition of the reacting mixture, which is an indication of good activity of the catalyst. Techno-economic evaluation of hydrogen production by catalytic reforming of LFG is included in the Appendix B. Catalytic Pyrolysis of Methane Currently, most of the industrial hydrogen production is based on steam methane reforming (SMR) process, which is a source of significant CO2 emissions into the atmosphere. A typical hydrogen plant with the capacity of one million m3 of hydrogen per day produces 0.3-0.4 million standard cubic meters of CO2 per day, which is normally vented into the atmosphere. Different options to mitigate the CO2 emission problem associated with fossil-based hydrogen production are being actively discussed in the literature (e.g., [7]). One approach that recently attracted the
Day Day
0
5
10
15
20
25
30
35
40
45
50
0 2 4 6 8 10 12
Time, hrs
Con
cent
ratio
n, v
ol.% Hydrogen
Carbon Monoxide
Carbon Dioxide
Methane
Day 1 Day 2
NASA/CR—2009-215441 265

attention of researchers is CO2-free production of hydrogen by thermal decomposition (or pyrolysis) of methane [8-10]: CH4 → C + 2H2 ΔHo= 75.6 kJ/mole (3) Due to very strong C-H bonds methane decomposition occurs at elevated temperatures (>1000 °C). Different transition metal catalysts (e.g., Ni, Fe, Co, Pd) have been used to reduce the maximum temperature of methane thermal decomposition. The major problems associated with the use of metal catalysts relate to a catalyst deactivation (due to blocking of active sites by the carbon deposits) and technical difficulties with catalyst-carbon separation. The use of carbon-based catalysts offers some advantages over metal catalysts due to their availability, durability and low cost. In contrast to metal-based catalysts, carbon catalysts are sulfur resistant and can withstand much higher temperatures (in excess of 1000 °C). Furthermore, there will be no need for the separation of a carbon product from the catalyst. The technical feasibility of using carbon materials as catalysts for methane decomposition reaction is discussed in several publications (e.g., [11]). The concept is based on thermocatalytic decomposition (TCD) of methane over catalytically active carbon particles with the production of hydrogen-rich gas and carbon deposited on the surface of original carbon particles. The data on catalytic activity of a variety of carbon materials of different origin and structure, including a wide range of activated carbons, carbon blacks, micro-crystalline graphites, nanostructured carbons,, toward methane decomposition reaction is reported in [12]. Consideration of Heat Input Options for Methane Pyrolysis Process—Methane decomposition is a moderately endothermic reaction: the thermal energy requirement per mole of hydrogen produced is only 37.8 kJ/mole H2 compared to 63 kJ/mole for SMR. Less than 10% of the methane heating value is needed to drive the endothermic process. Figure 15 (A, B, and C) illustrates three possible technological concepts of heat supply to the TCD process. HRG HRG SG HRG HC NG NG NG O2 1 2 3 air 4 5 carbon carbon carbon Figure 15. Three process heat input options for catalytic pyrolysis of methane. HRG-Hydrogen-
Rich Gas, SG- Stack Gases, HC- Heat Carrier (1- methane decomposition reactor, 2- reactor heater, 3- fluidized bed reactor, 4-catalyst particles heater, 5-autothermal reactor).
(A) (B) (C)
NASA/CR—2009-215441 266
According to the option (A) the heat source is located inside the reaction zone. It could be a heat pipe, a heat exchanger or a catalytic burner that uses NG or a portion of hydrogen product as a fuel. In the first two cases the heat source could be located outside the reactor with heat carried to the reactor by a heat carrier, e.g., liquid metals. As an example of this approach, sodium-based heat pipes have been used as a mode of efficient heat transfer in methane steam reformers [13]. In the concept (B), the process heat is introduced to the reactor by means of externally heated catalyst particles acting as a heat carrier (similar to fluid catalytic cracking process widely used in refineries). The process employs two fluid-solids vessels: a reactor and a heater with carbon particles circulating between the vessels in a fluidized state. Catalyst particles are heated (e.g., by burning part of carbon product or by hot combustion gases) and carry the necessary heat to the reactor to achieve NG decomposition. This technological concept has been described in our earlier publications (e.g., [7]). According to the concept (C), a relatively small amount of oxygen is fed to the reactor along with the methane feedstock to generate necessary heat to carry out the endothermic methane decomposition reaction. One can notice that the concept looks similar to a well-known partial oxidation (POx) process. There is, however, a fundamental disparity between the two processes. In particular, POx process carries out the conversion of methane into synthesis gas and, therefore, it requires relatively large amount of oxygen (normally, O2/CH4≥0.5). In contrast, the objective of oxygen-assisted methane decomposition is to maximize the yields of both hydrogen and carbon products by introducing oxygen in the quantity just enough to sustain the endothermic methane decomposition reaction. We call this process “autothermal pyrolysis” (ATP) since it involves the combination of an exothermic (methane oxidation) and endothermic (methane pyrolysis) reactions in one apparatus (similar to autothermal reforming, ATR, where methane oxidation is coupled with SMR). It is evident that this approach would use much less oxygen than ATR or POx, since methane decomposition is almost three times less endothermic (per mole of methane) than SMR, and the reaction does not advance to synthesis gas as a final product. As a result, CO2 emissions from the process would also be significantly less than from ATR and POx. Advantageously, in ATP process most of the feedstock carbon ends up in the form of elemental carbon rather than CO2. In this paper we explore some process development issues related to the production of hydrogen and carbon by ATP of methane. In particular, we conduct the thermodynamic analysis of ATP of methane in a wide range of temperatures and pressures with O2/CH4 ratio as a variable. Thermodynamic Analysis of Autothermal Pyrolysis of Methane—AspenPlusTM chemical process simulator (CPS) was used to conduct thermodynamic analysis of CH4-χO2 system. The reactions involved were modeled using a Gibbs reactor to minimize the free energy in order to calculate thermodynamic parameters of the process at the given operating conditions. Input parameters are: a feed (CH4-χO2) composition, inlet pressure and temperature, and reactor temperature and pressure. Peng-Robinson property package was used for the reaction equilibrium calculations. Methane conversion, products yield, pyrolysis gas composition, process enthalpy, entropy and Gibbs energy flows as a function of temperature, pressure and O2/CH4 ratio (χ) have been determined. The temperature range of 300÷1200 °C, the pressure range of 0.2÷2.5 MPa and O2/CH4 ratio of χ= 0÷1.5 (mol./mol.) were chosen for the thermodynamic analysis of the process. The following Figures illustrate the results of the analysis.
NASA/CR—2009-215441 267

Figure 16 depicts 3D plots of methane conversion as a function of temperature and O2/CH4 ratio at two baseline pressures: P = 200 kPa and 2.5 MPa. It is evident from Figure 16 that in both cases methane conversion increases drastically with the increase in both T and χ. For example, at P = 200 kPa, T = 850 °C and relatively low O2/CH4 ratios (χ≤0.2) methane conversion reaches up to 90%. At P = 2.5 MPa (with the rest of parameters being equal), methane conversion is below 60%, which indicates that the process is not favored by elevated pressures.
Figure 16. Methane conversion as a function of temperature and O2/CH4 ratio at P = 200 kPa and 2.5 MPa.
00.3
0.60.9
1.5
300
400
500
600
700
800
900
1000
1100
1200
0.0
10.0
20.0
30.0
40.0
50.0
60.0
70.0
80.0
90.0
100.0CH
4 conversion (%)
Temp (oC)
O2/CH4 Ratio
90-10080-9070-8060-7050-6040-5030-4020-3010-200-10
P = 200 kPa
300
400
500
600
700
800
900
1000
1100
12000
0.4
0.8
1.5
0.0
10.0
20.0
30.0
40.0
50.0
60.0
70.0
80.0
90.0
100.0
CH4 converison (%
)
Temp (oC)
O2/CH4 Ratio
90-10080-9070-8060-7050-6040-5030-4020-3010-200-10
P = 2.5 MPa
NASA/CR—2009-215441 268
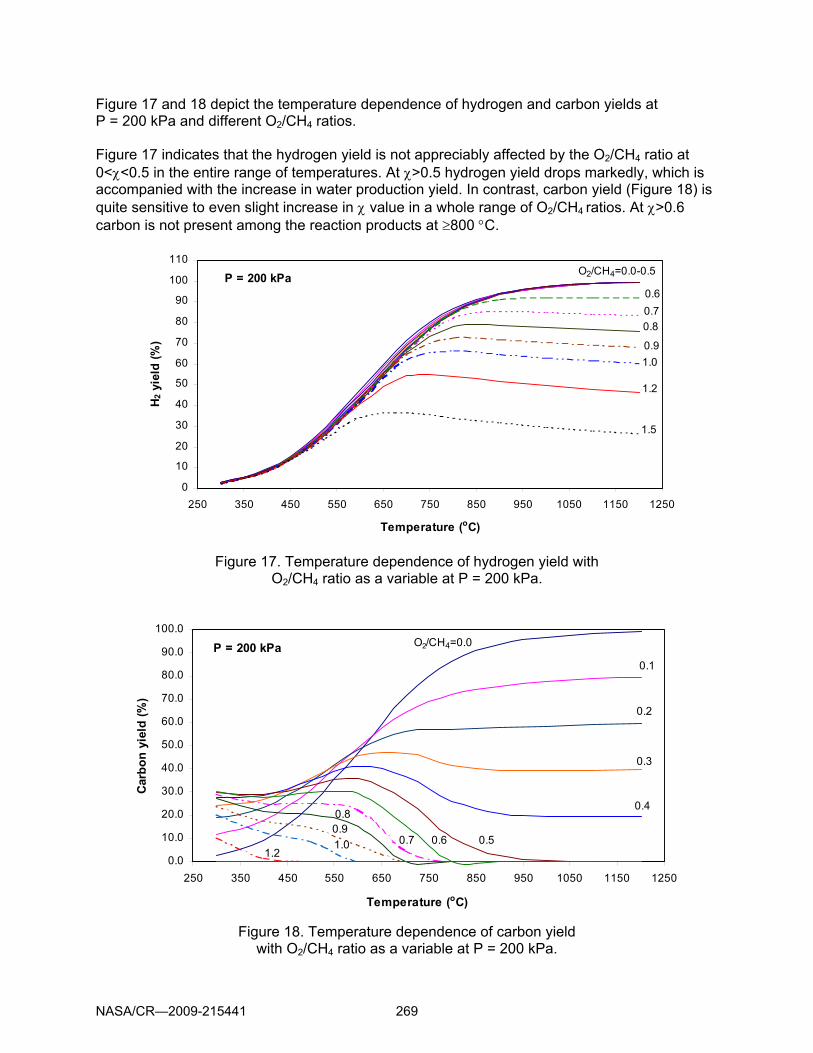
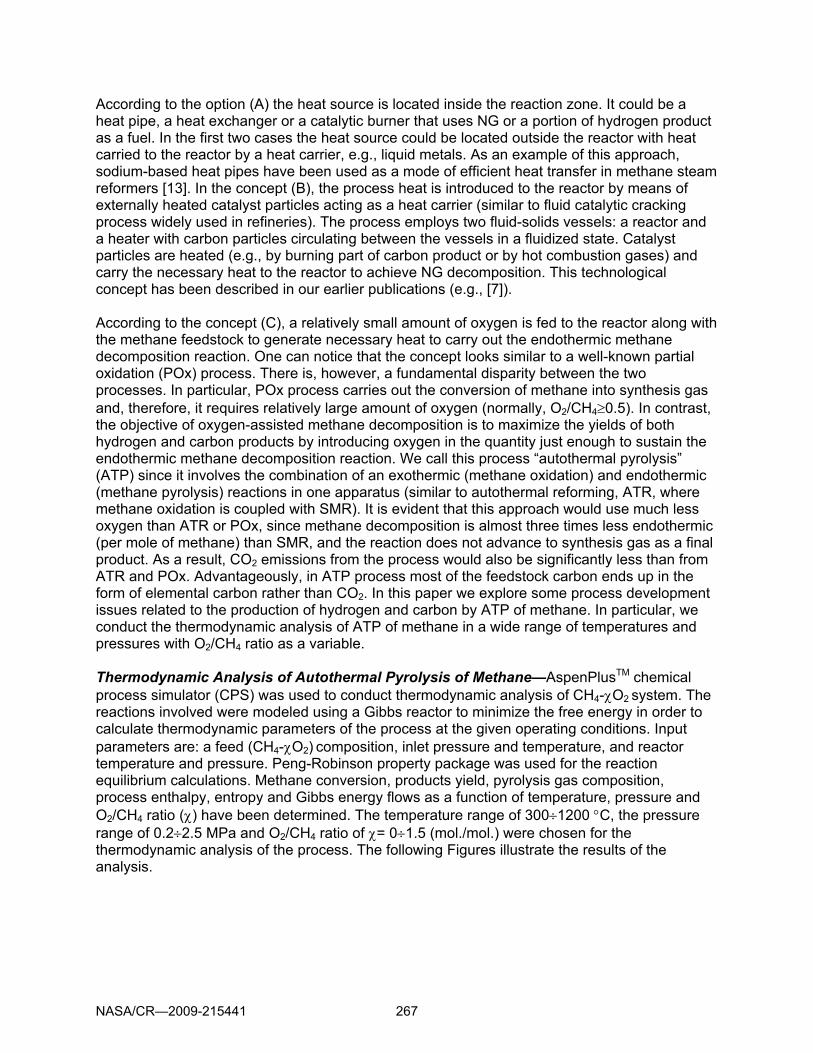
Figure 17 and 18 depict the temperature dependence of hydrogen and carbon yields at P = 200 kPa and different O2/CH4 ratios. Figure 17 indicates that the hydrogen yield is not appreciably affected by the O2/CH4 ratio at 0<χ<0.5 in the entire range of temperatures. At χ>0.5 hydrogen yield drops markedly, which is accompanied with the increase in water production yield. In contrast, carbon yield (Figure 18) is quite sensitive to even slight increase in χ value in a whole range of O2/CH4 ratios. At χ>0.6 carbon is not present among the reaction products at ≥800 °C.
Figure 17. Temperature dependence of hydrogen yield with O2/CH4 ratio as a variable at P = 200 kPa.
Figure 18. Temperature dependence of carbon yield with O2/CH4 ratio as a variable at P = 200 kPa.
0
10
20
30
40
50
60
70
80
90
100
110
250 350 450 550 650 750 850 950 1050 1150 1250
Temperature (oC)
H 2 y
ield
(%)
1.5
1.2
1.00.9
0.80.70.6
O2/CH4=0.0-0.5P = 200 kPa
0.0
10.0
20.0
30.0
40.0
50.0
60.0
70.0
80.0
90.0
100.0
250 350 450 550 650 750 850 950 1050 1150 1250
Temperature (oC)
Car
bon
yiel
d (%
)
P = 200 kPa O2/CH4=0.0
0.1
0.2
0.3
0.4
0.50.60.7
0.80.91.0
1.2
NASA/CR—2009-215441 269
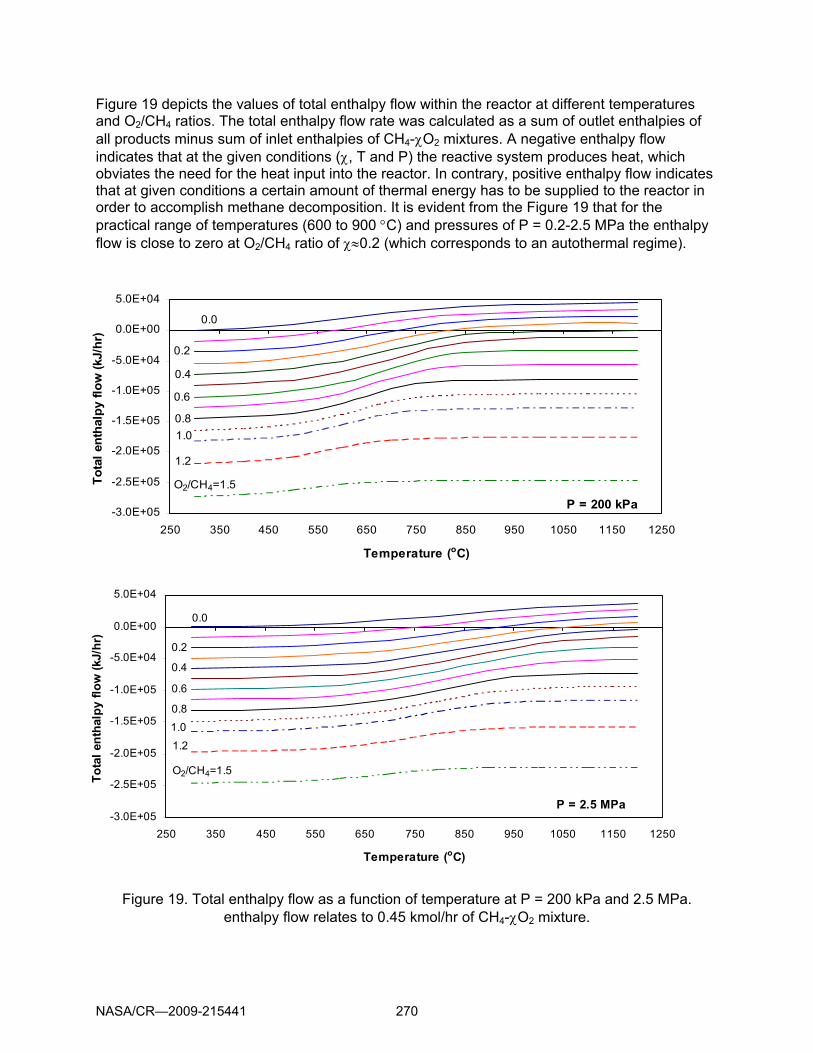
Figure 19 depicts the values of total enthalpy flow within the reactor at different temperatures and O2/CH4 ratios. The total enthalpy flow rate was calculated as a sum of outlet enthalpies of all products minus sum of inlet enthalpies of CH4-χO2 mixtures. A negative enthalpy flow indicates that at the given conditions (χ, T and P) the reactive system produces heat, which obviates the need for the heat input into the reactor. In contrary, positive enthalpy flow indicates that at given conditions a certain amount of thermal energy has to be supplied to the reactor in order to accomplish methane decomposition. It is evident from the Figure 19 that for the practical range of temperatures (600 to 900 °C) and pressures of P = 0.2-2.5 MPa the enthalpy flow is close to zero at O2/CH4 ratio of χ≈0.2 (which corresponds to an autothermal regime).
Figure 19. Total enthalpy flow as a function of temperature at P = 200 kPa and 2.5 MPa. enthalpy flow relates to 0.45 kmol/hr of CH4-χO2 mixture.
-3.0E+05
-2.5E+05
-2.0E+05
-1.5E+05
-1.0E+05
-5.0E+04
0.0E+00
5.0E+04
250 350 450 550 650 750 850 950 1050 1150 1250
Temperature (oC)
Tota
l ent
halp
y flo
w (k
J/hr
)
O2/CH4=1.5
P = 200 kPa
1.2
1.00.8
0.6
0.4
0.2
0.0
-3.0E+05
-2.5E+05
-2.0E+05
-1.5E+05
-1.0E+05
-5.0E+04
0.0E+00
5.0E+04
250 350 450 550 650 750 850 950 1050 1150 1250
Temperature (oC)
Tota
l ent
halp
y flo
w (k
J/hr
)
P = 2.5 MPa
O2/CH4=1.5
1.2
1.00.8
0.6
0.4
0.2
0.0
NASA/CR—2009-215441 270

Figure 20 demonstrates methane conversion and the reaction products yields as a function of temperature at P = 200 kPa and χ≈0.2. It can be seen that at T>850 °C hydrogen, carbon and CO are major reaction products and their yields are nearly independent of temperature. The composition of the pyrolysis gas at P = 200 kPa and χ≈0.2 is shown in Figure 21. At T>850 °C hydrogen and CO are two main components of the gaseous mixture with the average concentrations of 83 and 17 vol.%, respectively, that are nearly independent of the temperature.
Figure 20. Methane conversion and products yields as a function of temperature at P = 200 kPa and χ≈0.2.
Figure 21. Composition of gaseous product as a function of temperature
at P = 200 kPa and χ≈0.2.
0.0
10.0
20.0
30.0
40.0
50.0
60.0
70.0
80.0
90.0
100.0
250 350 450 550 650 750 850 950 1050 1150 1250
Temperature (oC)
CH4
conv
ersi
on &
pro
duct
s yi
eld
(%)
CH4
CO
CO2
H2O
H2
C
P = 200 kPa
0.0
10.0
20.0
30.0
40.0
50.0
60.0
70.0
80.0
90.0
100.0
250 350 450 550 650 750 850 950 1050 1150 1250
Temperature (oC)
Com
posi
tion
of g
as (m
ol%
)
CH4
H2
H2O CO
CO2
P = 200 kPa; O2/CH4 = 0.2
NASA/CR—2009-215441 271

At T>850 °C and χ≈0.2 the composition of the gaseous product of the reaction is consistent with the following stoichiometric equation: CH4 + 0.2O2 → 0.4 CO + 0.6C + 2H2 (4) It is noteworthy that the concentration of hydrogen in the effluent gas is significantly higher than that of the reformate gas after steam reforming of methane (∼52 vol.% including water vapor and ∼72 vol.% on a dry gas basis [14]). The presence of CO in the gaseous product would require the addition of water-gas shift reactors to the technological chain of the process. At the final stage of the process, high-purity hydrogen (>99.99 vol.%) will be recovered from H2-CO2 gaseous mixture using a standard pressure-swing adsorption system. Carbon is a valuable byproduct of the process and, if marketed, it could significantly reduce the cost of hydrogen production. The amount of CO2 emissions from the process could potentially be as low as 0.17 m3 CO2/m3 H2, which is 2.5 times less than that from the SMR process (0.43 m3 CO2/m3 H2) [9]. Experimental Studies of Catalytic Pyrolysis of Methane—The experimental studies on thermocatalytic pyrolysis of methane were conducted using pure (99.99 vol.%) and industrial grade (i.e., pipeline NG) methane. The composition of pipeline natural gas used in the experiments is shown in Table 1.
Table 2. Composition of pipeline NG In this work, we studied inhouse-prepared proprietary metal-doped carbon (MDC) catalysts. It was found that doping with metal increases the catalytic activity and sustainability of the process. Figure 22 depicts the results of methane decomposition at 900 °C in the presence of MDC at the residence time of 1 and 2.2 s using bench-scale unit. It is evident from the Figure 22 that at higher residence time (2.2 s) initial hydrogen concentration in the effluent gas reaches up to 83 vol.%. This however followed by a decrease in hydrogen yield to a quasi-steady level (hydrogen concentration about 60 vol.%). During first hour there was a small amount CO present in the effluent gas, which could be attributed to some residual oxygen in the catalyst. At lower residence time (1 s) (or higher space velocity) the initial concentration of hydrogen in the effluent gas was somewhat lower and the process was not sustainable (i.e., H2 concentration gradually dropped). This implies that the catalyst needs further improvement in its activity and stability.
Composition of NG, vol.% N2 0.9 CH4 93.1 C2H6 4.1 C3H8 0.7 C4+ 0.3 CO2 0.9 CH3SH 4 ppm
NASA/CR—2009-215441 272

Figure 22. Catalytic pyrolysis of methane over metal-doped catalyst at 900 °C and residence time of 1 and 2.2 s.
We also conducted high-throughput methane decomposition experiments using pilot-scale unit with maximum capacity of 1 SCFM (see Figure 11) (for this purpose the unit was modified). 180 g of carbon-based catalyst was placed in a two-inch OD Inconel reactor. The catalyst was purged with Ar at 400 °C for 3 hr, and pipeline quality natural gas was preheated to 350 °C and introduced to the reactor. The initial effluent gas consisted of 35 vol.% of H2 (balance mostly unconverted methane and <1 vol.% C2 hydrocarbons). CO concentration reached maximum value of 0.5 vol.% at 20 min and over period of 1 hr disappeared. CO2 concentration reached steady state value of about 0.25 vol.% and stayed at this value throughout the experiment (apparently, this CO2 was originated from the feedstock, see Table 3). The obtained mixture by composition is close to HYTHANETM gas.
0
10
20
30
40
50
60
70
80
90
100
0 60 120 180 240 300 360 420 480 540 600
Time (min.)
H2 ,
CH
4 co
ncen
tratio
n (v
ol. %
)
0
0.5
1
1.5
2
2.5
CO
, CO
2 co
ncen
tratio
n (v
ol. %
)
Hydrogen
Methane
Carbon Dioxide
Carbon Monoxide
0
20
40
60
80
100
0 60 120 180 240 300 360 420 480 540 600 660 720 780
Time (min.)
H2 ,
CH
4 co
ncen
tratio
n (v
ol. %
)
0
0.2
0.4
0.6
0.8
CO
, CO
2 co
ncen
tratio
n (v
ol. %
)
Hydrogen
Methane
Carbon Dioxide
Carbon Monoxide
τ = 2.2 s
τ = 1 s
NASA/CR—2009-215441 273
Autothermal Pyrolysis of Methane—In autothermal pyrolysis (ATP) process a relatively small amount of oxygen is fed into the reactor along with the methane feedstock to generate heat required to accomplish the endothermic methane decomposition reaction. Thus, ATP involves the combination of endothermic (methane decomposition) and exothermic (methane combustion) processes in one reactor (i.e., the process operates in a thermo-neutral regime). This approach may appear similar to the well-known partial oxidation (POx) process. However, there is a difference between the two processes. In particular, POx process is intended for complete conversion of methane into synthesis gas and, therefore, it requires relatively large amount of oxygen (O2:CH4 = 0.5 mole/mole). In contrast, the objective of oxygen-assisted methane decomposition is to maximize the yields of both hydrogen and carbon products by introducing oxygen in an amount just enough to sustain the endothermic methane decomposition reaction. It is evident that the ATP process would use much less oxygen and, consequently, produce less CO2 emissions than POx or SMR or autothermal methane reforming due to the relatively low endothermicity of methane decomposition reaction (it is almost three times less endothermic than SMR, per mole of H2) and the fact that it does not produce synthesis-gas as the final product. Advantageously, in the ATP process most of the feedstock carbon ends up in the form of elemental carbon rather than CO2. Screening Catalysts for their Catalytic Activity in Methane Decomposition—Performance studies were conducted for six different catalysts under identical conditions. Figure 23 depicts the time dependence of hydrogen production rate at 900 °C for six different cases (in semi-log coordinates). Fe-Cr catalyst exhibited the highest activity (curve 1), however this catalyst tended to disintegrate after several hours at 900 °C. Ni catalyst (curve 2) also exhibited high activity, however, hydrogen production rates gradually decreased as a result of catalyst deactivation caused by carbon deposition. Curve 3 corresponds to oxygen-assisted (χ = 0.2) methane decomposition in the presence of AC (lignite)-supported iron (10 wt.%) catalyst. There is an initial induction period on the kinetic curve, which corresponds to the reduction of iron oxides to the active metallic form of the catalyst. This was followed by relatively steady methane decomposition process (for about 10 hr) with the production of the same assortment of products as in the case of AC catalyst. It is evident that doping carbon catalyst with iron significantly improved the catalyst activity and stability. The positive effect of iron on the reaction is no surprise: high catalytic activity of iron in methane decomposition reaction is well documented (e.g., [8]). On the other hand, alumina- and silica-supported iron-based catalysts are known for their rapid deactivation due to blocking of active sites by carbon deposits. Thus, the combination of iron catalyst with a carbon support ensures better performance through some synergistic action, the nature of which is yet to be understood. Curve 7 relates to anaerobic methane decomposition (i.e., χ = 0) over AC (lignite). Curve 5 represents oxygen-assisted (χ = 0.2) methane decomposition over the same AC catalyst. It is clear that the addition of oxygen to the system noticeably slowed down the rate of catalyst deactivation. Since the main factors contributing to carbon catalyst deactivation relate to the deposition of catalytically inactive carbon species and the loss of surface area [3], it could be presumed that the presence of small amounts of oxygen promotes methane decomposition by creating more active sites on the catalyst surface and maintaining relatively high surface area. Indeed, BET surface area measurements of carbon samples after the AC (lignite)-catalyzed methane decomposition experiments indicated that the surface area of the carbon product formed in the presence of oxygen (χ = 0.2) is somewhat greater than that of the carbon produced in anaerobic conditions.
NASA/CR—2009-215441 274

Effect of O2/CH4 Ratio—Figure 24 depicts distribution of methane decomposition/oxidation products (in molar %) as a function of O2/CH4 ratio at 900 °C in the presence of AC-lignite. Hydrogen, carbon and CO are the main products of methane conversion. Minute amounts of ethylene (<0.1 mol.%) were also detected among the reaction products. As expected, hydrogen and carbon yields decrease and H2O, COx yields increase with the increase in O2/CH4 ratios in the entire range of χ (due to methane partial combustion). Interestingly, ethylene yield first increases reaching maximum at χ = 0.25 and then decreases.
0
0.5
1
1.5
2
2.5
3
3.5
4
4.5
5
1 10 100 1000Time, min.
H2 P
rodu
ctio
n R
ate,
mm
ol/g
(cat
.)-m
in
Figure 23. ATP of methane experiments for 6 catalysts (1 – Fe-Cr-oxides, 2 – NiO(1-15wt%)/Al2O3, 3 – Fe/AC Lignite, 4 – Fe/AC Peat, 5 – AC Lignite,
6 – Fe/Al2O3, 7 – Lignite without O2 feed (χ =0)) Temperature Dependence—Figure 25 illustrates the temperature dependence of the products yields (in mol.%) at χ =0.2 using AC lignite as a catalyst. It is evident that in the range of 850-1000 °C the COx yields remain almost independent of temperature, and the yields of carbon and, particularly, hydrogen steadily increase. The comparison of thermodynamic equilibrium (Figure 26) and experimentally determined (Figure 25) data on products distribution reveals some agreements as well as disparities. In particular, it can be seen that the molar fractions of hydrogen in the products mix on both plots are in fairly good agreement (within less than 10% margin of error), whereas the molar distribution of other products is quite dissimilar. For example, thermodynamic equilibrium data indicate that carbon yield exceeds that of CO, whereas experimental results show an opposite trend (i.e., CO yield is greater than that of carbon). Moreover, at the temperatures above 850 °C the thermodynamic equilibrium values for CO2 and H2O are close to zero, which, apparently, is not in agreement with the experimentally determined values. Factors underlying these discrepancies are yet to be determined. One can speculate that the presence of relatively large quantities of carbon (which is both a catalyst and reaction product, at the same time) in the system may hinder formation of carbon and shift the equilibrium in favor of CO.
7
2
3 4
56
1
NASA/CR—2009-215441 275

0%
10%
20%
30%
40%
50%
60%
70%
0 0.1 0.2 0.3 0.4O2/CH4 Ratio
Mol
e F
ract
ion,
x (%
)
0.00%
0.01%
0.02%
0.03%
0.04%
0.05%
0.06%
0.07%
0.08%
0.09%
0.10%
Mol
e Fr
actio
n, x
(Eth
ylen
e) (
%)
MethaneHydrogenCarbonW aterCarbon MonoxideCarbon DioxideEthylene
Figure 24. Molar distribution of ATP products as a function of O2/CH4 ratio.
0%
10%
20%
30%
40%
50%
60%
850 875 900 925 950 975 1000Temperature (oC)
Mol
e Fr
actio
n, x
(%)
0.00%
0.05%
0.10%
0.15%
0.20%
0.25%
0.30%
0.35%
Mol
e Fr
actio
n (E
than
e an
d E
thyl
ene)
, x (%
MethaneHydrogenWaterCarbon MonoxideCarbonCarbon DioxideEthane and Ethylene
Figure 25. Experimentally determined temperature dependence of the molar fraction of methane decomposition products (O2/CH4 = 0.2 (molar), P = 0.1 MPa).
NASA/CR—2009-215441 276

Analysis of Carbon Product—Carbon byproduct of the process could play an important role in reducing the cost of hydrogen production. We have previously reported that depending on the operational parameters of the process (temperature, catalyst, feedstock), carbon could be produced in several modifications: amorphous (i.e., carbon black), turbostratic and filamentous carbon. X-ray diffraction (XRD) studies of carbon samples produced by methane decomposition over carbon catalyst revealed ordering in a “columnar” or stacking direction. The d-spacing (lattice spacing) or spacing between plates is practically uniform, so that the (002) columnar reflection is clearly present.
Figure 26. Thermodynamic equilibrium data on molar fraction of methane conversion
products as a function of temperature at P = 0.1 MPa and χ≈0.2.
Thus, the carbon produced by carbon-catalyzed decomposition of hydrocarbons revealed a graphite-like a-b-c-a type stacking of the carbon ring plates (as opposed to a-b-a-b for pure graphite). The actual d-spacing (d = 3.4948 Å) of this (002) peak is larger than that of the standard graphite structure (d = 3.3480 Å), which indicates that the plates are slightly further apart in the columnar stacking direction. This type of arrangement has been termed in the literature as a turbostratic structure. The Table 3 shows the data on the price and market for carbon products obtained in the process
Table 3. Price, application area and market for carbon products.
N/A N/A 4-5 mln ton Market
composites, electronics aerospace, N-reactors electrodes, composites Application
>1000 1-18 0.3 Price, $/kg
Carbon filaments Pyrolytic graphite Turbostratic carbon
0.0
10.0
20.0
30.0
40.0
50.0
60.0
70.0
250 350 450 550 650 750 850 950 1050 1150 1250
Temperature (oC)
Mol
ar fr
actio
n (%
)
CH4
H2
C
CO
H2O
CO2
NASA/CR—2009-215441 277

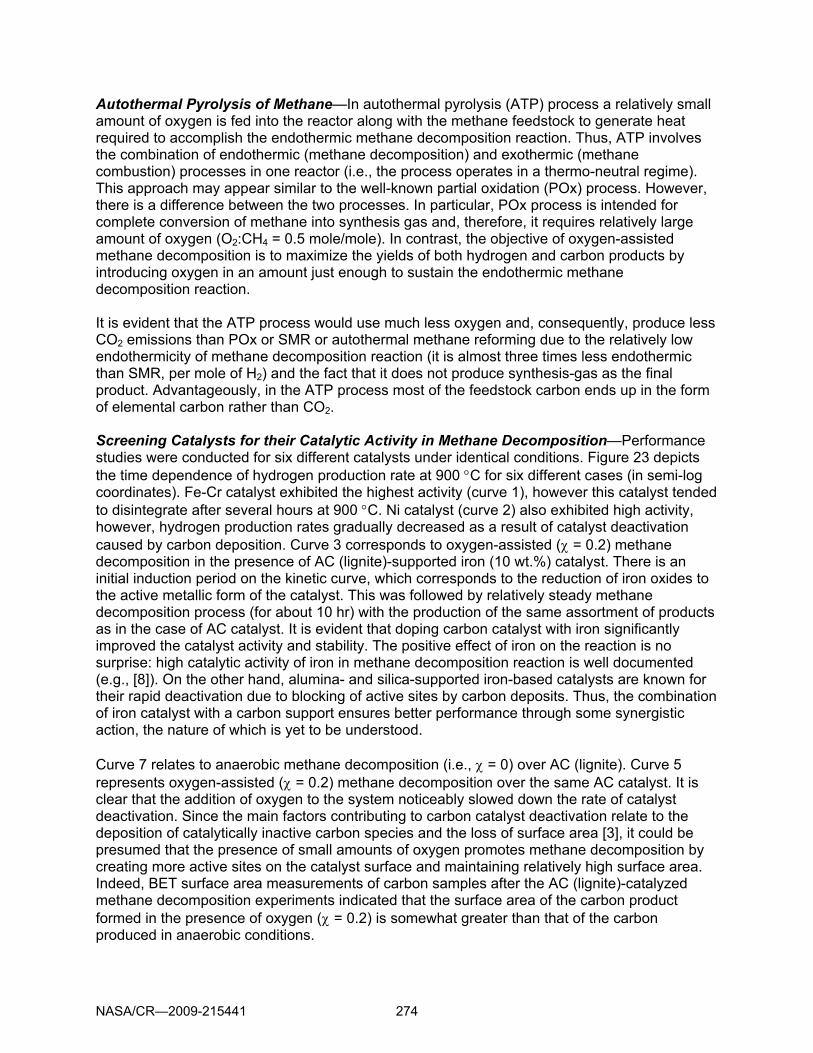
Carbon samples were analyzed by scanning (SEM) and transmission (TEM) electron microscopy, XRD and focused ion beam (FIB) materials characterization techniques. Figure 27 depict SEM and TEM images of carbon products obtained by thermocatalytic decomposition of methane in the presence of supported metal catalysts. It is evident that some of these catalysts produce filamentous forms of carbon. Dark spots on the TEM images are nano-size metal catalyst particles. These metal particles are seeds for the growth of carbon nanotubes. The TEM image (A) shows the fine structure of a multi-wall carbon nanotube. It is apparent that the metal catalyst particle (with the diameter of ∼10 nm) is wrapped by about 80 carbon graphene layers. The SEM image (B) shows a bunch of carbon nanotubes produced by Fe/alumina catalyzed decomposition of methane. It should be noted that carbon nanotubes and other carbon nano-structures were obtained from non-diluted methane and pipeline quality natural gas using inexpensive sulfur-resistant catalysts. This in contrast to previously reported works where carbon nanotubes were produced from methane-hydrogen mixtures using relatively expensive Ni-based catalysts. Thus, the hydrogen production method developed in this work could be a basis for the production of a value-added byproduct: filamentous carbon, which may significantly improve the commercial potential of the technology. Figure 27 (C) depict high-resolution transmission electron microscopic (TEM) image of carbon produced by methane decomposition over Fe (10 wt.%)/AC-lignite catalyst. It can be seen that the iron particle (the dark spot) is completely covered by several (about 40 to 50) layers of carbon, which is associated with the substantial deactivation of the catalyst. It is plausible that in the presence of oxygen the iron particle partially catalyzes the oxidation of carbon layers, thus, preventing a buildup of large carbon deposits on its surface (at least, on some portion of the surface). This effect could potentially slow down the rate of the catalyst deactivation and result in better performance (compared to the similar catalyst working in anaerobic conditions). It is also noteworthy that carbon layers around the iron particle are much less ordered compared to the carbon sample from the anaerobic experiment, where carbon layers almost perfectly organized in a parallel pattern. Our earlier studies (e.g., [12]) indicated that disordered carbons (e.g., CB, AC) are catalytically more active in methane decomposition than ordered ones (e.g., graphite). Thus, the presence of disordered carbon species could be another important factor contributing to higher catalytic activity of the carbon-supported iron catalyst.
NASA/CR—2009-215441 278
Figure 27. (A) TEM and (B) SEM images of filamentous carbon produced by methane decomposition in presence of Fe (10 wt.%)/alumina catalyst. (C) TEM images of Fe
(10 wt.%)/AC-iignite catalyst with carbon deposits produced by methane decomposition.
Production of Hydrogen via Catalytic Processing of Citrus Pulp Pellets We explored technical feasibility of converting citrus pulp pellets (CPP) into high purity hydrogen. Figure 28 shows the photo of CPP from local citrus processing facility. It was estimated that the Florida citrus industry generates about 1 million tons/yr of citrus waste residue. The citrus peel waste is dried into citrus peel pellets and sold as cattle feed (at approx. $40 to 45/ton). Citrus pulp pellets represent a large resource of inexpensive raw material for the local production of hydrogen.
A
c C
B
NASA/CR—2009-215441 279

Figure 28. Citrus pulp pellets.
In the first step, CPP has to be converted into gaseous feedstock suitable for reforming into the SG. There are two options: pyrolysis and gasification of CPP. Figure 29 depicts the schematic diagram of CPP processing into hydrogen. CPP were placed in the pyrolysis reactor and heated to 600-800 °C. In some experiments, a small amount of steam was introduced into the pyrolyzer. The pyrolysis gas produced was directed to the catalytic reformer followed by water gas shift reactor and gas separation unit.
Figure 29. Schematic diagram of experimental unit for hydrogen production from citrus pulp pellets.
pyrolyzer
600-800°C
reformer
850°shift reactor 200- 400°C
CO2
adsorber
H2O H2O
H2O
carbonaceous product, 90 m2/g
steam
Reformate, % H2 - 65.8 CO - 7.4 CO2 – 26.8
H2 (99.5 v.%)
Pyrolysis gas, % H2 37.3 CH4 13.2 C2 5.8 C3 1.0 CO 21.1 CO2 19.4 Other 2.2
CPP
NASA/CR—2009-215441 280

We used an activated carbon adsorber at sub-ambient temperature to separate hydrogen from CO2. A carbonaceous product with the surface area of 90 m2/g was produced as a byproduct of the process. This carbonaceous product can be upgraded into high-quality activated carbon for environmental applications. These experiments proved that it is technically feasible to process citrus waste products into pure hydrogen with reasonable high yield: 0.55 L of hydrogen per gram of citrus pulp pellets (as received).
Conclusions The objective of this project is to develop economically viable process for the local production of hydrogen from renewable methane-containing feedstocks with minimal environmental impact. It was estimated that the local resources of LFG would be sufficient for production of 5 tons/day of hydrogen (adequate for up to 8 shuttle launches per year). Analytical (using AspenPlusTM chemical process simulator) and experimental studies on the development of two novel hydrogen production technologies were conducted, namely: (i) direct reforming of landfill gas (LFG) to syngas and its further processing to H2, and (ii) thermocatalytic decomposition (TCD) of methane to hydrogen and carbon. The advantages of direct reforming of LFG is that it does not require preliminary recovery of methane from LFG, which simplifies the process. The thermodynamic analysis of methane pyrolysis in autothermal regime (in presence of relatively small amounts of oxygen) using AspenPlusTM chemical process simulator was conducted. Methane conversion, products yields, process enthalpy and Gibbs energy flows as a function of temperature, pressure and O2/CH4 ratio have been determined. The experimental data were in a fairly good agreement with the simulation results. Efficient and stable catalysts for the direct reforming of LFG were developed and tested. The catalytic activity of a number of commercial and synthesized transition metal catalysts (Ni, Fe, Pt, Pd, Ir, Ru and Rh) were evaluated. Ni-based catalyst was down-selected for further evaluation and the operational conditions for its efficient and stable operation were determined. A pilot scale unit with the capacity of 1 SCFM of H2 was designed, fabricated and successfully operated using CH4:CO2 = 1.3:1 mixture mimicking local (Cocoa) LFG composition. A preliminary economic assessment indicates the cost range of liquid hydrogen product to be $3.00 to $6.00 per kilogram depending upon the production rate and whether or not carbon sequestration is added to the scheme. The advantage of catalytic pyrolysis of methane process is that it allows producing hydrogen and value-added byproduct: clean carbon without or minimal CO2 emissions. Comprehensive catalyst and process development studies for the hydrocarbon decomposition reaction were conducted. Since the process is moderately endothermic, the conditions at which the process operates at thermo-neutral regime were determined. Efficient catalysts for methane pyrolysis based on high-surface area carbons and metal-doped carbons have been developed and tested. The technical feasibility of the production of high-value filamentous carbon products (multi-wall carbon nanotubes) from non-diluted methane and pipeline quality NG was demonstrated. Characterization and structural studies of carbon products of the process were conducted using several materials characterization techniques (SEM, TEM, FIB, XRD). Potential markets for carbon products and process economics were evaluated. The technical feasibility of converting citrus waste products (e.g., citrus pulp pellets, CPP) into high purity hydrogen with the yield of 0.55 L H2 per gram of CPP was demonstrated. The successful implementation of the above technologies would eliminate the necessity for costly and potentially unsafe transportation of liquid hydrogen from Louisiana-based hydrogen plant to the Central Florida.
NASA/CR—2009-215441 281

Patents, Publications, Presentations, and Students
Patents 1. Muradov, N., Patent Appl. No. 11/648,453, Thermocatalytic Process for CO2 Free
Production of Hydrogen and Carbon from Hydrocarbons (2006) 2. Muradov, N., Smith, F., T-Raissi, A., Patent Appl. No. 11/637,552, Process for Hydrogen
Production via Integrated Processing of Landfill Gas and Biomass (2006) 3. Muradov, N., Smith, F., T-Raissi, A., Patent Appl. No. 11/431,815, Process and Apparatus
for Hydrogen and Carbon Production via Carbon Aerosol Catalyzed Dissociation of Hydrocarbons (2006)
4. Huang, A. Raissi, N. Muradov, U.S. Patent Application No. 60/578212 (2004), “A Method for Zero-emission Liquid Hydrogen Production from Methane and Landfill Gas”
Publications 1. Muradov, N., “Emission-free Reformers for Mobile and Portable Fuel Cell Applications”,
Journal of Power Sources, 5236, 1-5(2003) 2. Muradov, N. “Catalytic Conditioning of Sulfurous Hydrocarbon Fuels for Fuel Cell
Applications”, Symposium: Fuel Clean-up Considerations for Fuel Cells, Amer. Chem. Soc. Meeting, New Orleans, 2003
3. Muradov, N. “On-site Production of Hydrogen from Hydrocarbon Fuels with Minimal Greenhouse Gas Emissions”, Symposium: Hydrogen Energy for the 21st Century, Amer. Chem. Soc. Meeting, New Orleans, 2003
4. Muradov, N., T-Raissi, A., Robertson, T. “Hydrogen Production via Catalytic Reformation of Low-quality Methane Containing Feedstocks”, Proceedings of HYPOTHESIS Conf., Italy, 2003
5. Muradov, N., Smith, F. “Thermocatalytic Hydrogen Production from Natural Gas with Drastically Reduced CO2 Emissions”, Proc. HYPOTHESIS Conf., Italy, 2003
6. Muradov, N., Huang, C., T-Raissi, A., Smith, F. “Hydrogen Production from Natural Gas with Reduced CO2 Emissions”, Proc. XV World Hydrogen Energy Conf., Yokohama, Japan, 2004
7. Muradov, N., T-Raissi, A., Smith, F., Elbaccouch, M. “Hydrogen Production via Catalytic Reformation of Landfill Gas and Biogas”, Proc. XV World Hydrogen Energy Conf., Yokohama, Japan, 2004
8. Huang, C., Muradov, N., T-Raissi, A. “Analysis of Liquid Hydrogen Production from Methane and Landfill Gas”, Proc. XV World Hydrogen Energy Conf., Yokohama, Japan, 2004
9. Muradov, N., Smith, F., T-Raissi, A. “Catalytic Properties of Carbons in Methane Decomposition Reaction”, Proceedings of International Symposium on Carbon for Catalysis, Lausanne, Switzerland, 2004
10. Muradov, N., Smith, F., T-Raissi, A. “Thermocatalytic Hydrogen Production from Natural Gas with Drastically Reduced CO2 Emissions”, Hydrogen Power Theoretical and Engineering Solutions, Eds. M. Marini, G. Spazzafumo, SG Editoriali, Padova, Italy, 2004, pp. 87-95 (peer reviewed)
11. Muradov, N., T-Raissi, A., Robertson, T. “Hydrogen Production via Catalytic Reformation of Low-quality Methane Containing Feedstocks”, Hydrogen Power Theoretical and Engineering Solutions, Eds. M. Marini, G. Spazzafumo, SG Editoriali, Padova, Italy, 2004, pp. 191-199
12. Muradov, N., Smith, F., T-Raissi, A. Catalytic Activity of Carbons for Methane Decomposition Reaction”, Catalysis Today, v. 102-103 (2005) 225-233
13. Muradov, N., Veziroglu, N., “From Hydrocarbon to Hydrogen-Carbon to Hydrogen Economy”, International Journal of Hydrogen Energy, v.30 (3), pp. 225-237 (2005)
NASA/CR—2009-215441 282

14. Muradov, N., Chen Z., Smith F., “Modeling TCD of Methane in Fluidized Bed of Carbon Particles”, International Journal of Hydrogen Energy, 30, 1149-1158 (2005)
15. Muradov, N., Smith, F., Huang, C. T-Raissi, “Autothermal Catalytic Pyrolysis of Methane as a New Route to Hydrogen Production with Reduced CO2 Emission”, 2nd European Hydrogen Energy Conf., Saragossa, Spain, 2005
16. Muradov, N., Smith, F., T-Raissi, A. “Hydrogen Generators for Portable and Back-up Power Applications”, Abstracts of 2nd Annual Florida Tech-Transfer Conf., Orlando, FL, May 18-19, 2005
17. Muradov, N., Smith, F., T-Raissi, A. “Catalytic Dissociation of Hydrocarbons: a Route to CO2-free Hydrogen”, Proc. XV Annual Saudi-Japanese Symposium “Catalysts in Petroleum Refining and Petrochemicals”, Dhahran, Saudi Arabia, November, 2005
18. Muradov, N., Smith, F., T-Raissi, A. “Autothermal catalytic pyrolysis of methane as a new route to hydrogen production with reduced CO2 emissions”, Catalysis Today, 116, 281-288, 2006
19. Muradov, N., Smith, F., T-Raissi, A., Catalysis of Methane Dissociation by Carbon Materials, Proc. Intern. Symp. Carbon in Catalysis, Saint Petersburg, Russia, 2006
20. Muradov, N., Smith, F., T-Raissi, A. “Decentralized Production of Hydrogen from Hydrocarbons without CO2 Emission”, Proc. XVI World Energy Conf., Lyon, France, 2006.
21. Muradov, N., Smith, F., Elbaccouch, M., T-Raissi, A. “Hydrogen Production via Catalytic Processing of Renewable Feedstocks”, Proc. XVI World Energy Conf., Lyon, France, 2006
22. Muradov, N., Rahman, Z., Synthesis and Characterization of Radially-Alligned Carbon Filaments, J. Nanoscience and Nanotechnology, submitted for publication
23. Muradov, N., Chapter 2: Hydrogen Production from Hydrocarbons, in book Hydrogen Production, Storage and Utilization, Fransis and Taylor Publ., 2007
24. Smith, F., Muradov, N., Raissi, A. Production of Hydrogen via Autothermal Dry Reforming of Landfill Gas, Proc. ACS (Florida section) FAME Meeting, 2007
25. Muradov, N., Smith, F., Catalytic Reforming of Landfill Gas to Syngas, Appl. Catal, submitted for publication, 2007
26. Muradov, N., CO2-free Production of Hydrogen: Vision of Hydrogen-Carbon Economy, Dutch Hydrogen Dialogue Meeting, Amsterdam, March, 2007
27. Muradov, N., Veziroglu, N., CO2-free Fossil Hydrogen: Vision of Hydrogen-Carbon Economy, Proc. Intern. Hydrogen Energy Conf. and Exhibition, Istanbul, Turkey, 2007
Presentations 1. Muradov, N. “Catalytic Conditioning of Sulfurous Hydrocarbon Fuels for Fuel Cell
Applications”, Symposium: Fuel Clean-up Considerations for Fuel Cells, Amer. Chem. Soc. Meeting, New Orleans, 2003
2. Muradov, N. “On-site Production of Hydrogen from Hydrocarbon Fuels with Minimal Greenhouse Gas Emissions”, Symposium: Hydrogen Energy for the 21st Century, Amer. Chem. Soc. Meeting, New Orleans, 2003
3. Muradov, N., Huang, C., T-Raissi, A., Smith, F. “Hydrogen Production from Natural Gas with Reduced CO2 Emissions”, Proc. XV World Hydrogen Energy Conf., Yokohama, Japan, 2004
4. Muradov, N., T-Raissi, A., Smith, F., Elbaccouch, M. “Hydrogen Production via Catalytic Reformation of Landfill Gas and Biogas”, Proc. XV World Hydrogen Energy Conf., Yokohama, Japan, 2004
5. Huang, C., Muradov, N., T-Raissi, A. “Analysis of Liquid Hydrogen Production from Methane and Landfill Gas”, Proc. XV World Hydrogen Energy Conf., Yokohama, Japan, 2004
6. Muradov, N., Smith, F., T-Raissi, A. “Catalytic Properties of Carbons in Methane Decomposition Reaction”, Proceedings of International Symposium on Carbon for Catalysis, Lausanne, Switzerland, 2004
NASA/CR—2009-215441 283

7. Muradov, N., Smith, F., T-Raissi, A. “Thermocatalytic Hydrogen Production from Natural Gas with Drastically Reduced CO2 Emissions”, Hydrogen Power Theoretical and Engineering Solutions, Italy, 2004
8. Muradov, N., T-Raissi, A., Robertson, T. “Hydrogen Production via Catalytic Reformation of Low-quality Methane Containing Feedstocks”, Hydrogen Power Theoretical and Engineering Solutions, Italy, 2004
9. Muradov, N., Smith, F., Huang, C. T-Raissi, “Autothermal Catalytic Pyrolysis of Methane as a New Route to Hydrogen Production with Reduced CO2 Emission”, 2nd European Hydrogen Energy Conf., Saragossa, Spain, 2005
10. Muradov, N., Smith, F., T-Raissi, A. “Hydrogen Generators for Portable and Back-up Power Applications”, Abstracts of 2nd Annual Florida Tech-Transfer Conf., Orlando, FL, May 18-19, 2005
11. Muradov, N., Smith, F., T-Raissi, A. “Catalytic Dissociation of Hydrocarbons: a Route to CO2-free Hydrogen”, XV Annual Saudi-Japanese Symposium “Catalysts in Petroleum Refining and Petrochemicals”, Dhahran, Saudi Arabia, November, 2005
12. Muradov, N., Smith, F., T-Raissi, A., Catalysis of Methane Dissociation by Carbon Materials, Intern. Symp. Carbon in Catalysis, Saint Petersburg, Russia, 2006
13. Muradov, N., Smith, F., T-Raissi, A. “Decentralized Production of Hydrogen from Hydrocarbons without CO2 Emission”, XVI World Energy Conf., Lyon, France, 2006
14. Muradov, N., Smith, F., Elbaccouch, M., T-Raissi, A. “Hydrogen Production via Catalytic Processing of Renewable Feedstocks”, XVI World Energy Conf., Lyon, France, 2006
15. Smith, F., Muradov, N., Raissi, A. Production of Hydrogen via Autothermal Dry Reforming of Landfill Gas, Proc. ACS (Florida section) FAME Meeting, 2007
16. Muradov, N., CO2-free Production of Hydrogen: Vision of Hydrogen-Carbon Economy, Dutch Hydrogen Dialogue Meeting, Amsterdam, March, 2007
17. Muradov, N., Veziroglu, N., CO2-free Fossil Hydrogen: Vision of Hydrogen-Carbon Economy, Intern. Hydrogen Energy Conf. and Exhibition, Istanbul, Turkey, 2007
Students Franklyn Smith (Florida Institute of Technology) Neal Atmaram (Vilanova University) References [1] J. Keating: Cheaper energy by going to waste. Distributed Energy, January/February
(2004) 22-26. [2] Landfill Gas-to-Energy Project Opportunities. EPA 430-K-99-007 (1999). [3] Y. Hu, E. Ruckenstein, Advances in Catalysis, 48, (2004) 297-345. [4] H. Henz et al, Gas Production, in Ullmann’s Encyclopedia of Industrial Chemistry, Wiley-
VCH Verlag GmbH & Co. KgaA, 2002. [5] J. Richardson, Principles of Catalyst Development, Plenum Press, NY, 1989. [6] K. Mondal, V. Choudhary, U. Joshi, Appl. Catal. A: General, 316 (2007) 47-52.
NASA/CR—2009-215441 284
[7] N. Muradov: Hydrogen via methane decomposition: an application to decarbonization of fossil fuels. Int. J. Hydrogen Energy 2001; 26:1165 [8] N. Muradov: How to produce hydrogen from fossil fuels without CO2 emission. Int. J.
Hydrogen Energy 1993; 18: 211 [9] M. Steinberg: Fossil fuel decarbonization technology for mitigating global warming. Int. J.
Hydrogen Energy 1999; 24: 771, [10] L. Fulcheri, Y. Schwob: From methane to hydrogen, carbon black and water. Int. J.
Hydrogen Energy 1995; 20: 197. [11] N. Muradov: CO2-free Production of hydrogen by catalytic pyrolysis of hydrocarbon fuel.
Energy & Fuels 1998; 12:41 [12] N. Muradov: Catalysis of methane decomposition over elemental carbon. Catalysis
Commun. 2001; 2: 89 [13] James Richardson: A gas-fired heat pipe reformer for small scale hydrogen production,
Natural Gas Conversion IV, Studies in Surface Science and Catalysis, vol. 107, Eds. M.de Pontes et al., 1997, Elsevier, Oxford
[14] Ullmann’s Encyclopedia of Industrial Chemistry, vol. A-13, VCH, 1985
NASA/CR—2009-215441 285

Appendix A
Location and Resources of LFG in Central Florida within 50 miles from NASA-KSC Figure A-1. Location and Resources of LFG in Central Florida within 50 Miles from NASA-KSC
The capacities of landfill sites are shown in MMbtu/hr.
Daytona Beach, 76
Cocoa, 32
Vero Beach, 26
Winter Haven, 46
Kissimmee, 23
Orlando, 75
Sanford, 51
NASA-KSC
NASA/CR—2009-215441 286
Appendix B Technoeconomic Assessment of Hydrogen Production from Landfill Gas Input Data and Assumptions—Capital cost estimation was performed using the Icarus Process Estimator™ (IPE™), part of the Aspen Engineering Suite of programs. Individual process components are mapped into IPE™; process simulation results are transferred from Aspen Plus™ in order to size the equipment. Components in the Aspen Plus spreadsheet are equated to equipment types and then priced for the next largest size. All pricing data comes from actual industry data. Engineering, procurement and construction costs are added to the project. This procedure was performed for simulations producing from less than one ton per day of hydrogen to twenty tons per day of hydrogen in order to determine economy of scale for all three scenarios. IPE™ provides operating cost estimates as well. In order to determine total production cost of hydrogen for KSC’s use, liquefaction capital cost estimates were added [Syed MT et al. An Economic Analysis of Three Hydrogen Liquefaction Systems. International Journal of Hydrogen Energy 1998,23, 565] along with power costs assuming an electricity rate average of $0.052/kWh [Bossel U, Eliasson B and Taylor G. The Future of the Hydrogen Economy: Bright or Bleak? 2003]. Actual landfill gas cost was assumed to be $1.42/GJ (in NG equivalent); no actual cost data for the LFG was found in the literature. Compressor power requirement cost was added at the same rate. Total production cost was calculated assuming a plant lifetime of twenty years, and a discount rate of 6% was used to calculate present value of operating and maintenance. For oxygen costs in the oxygen-fired dry reforming and autothermal reforming cases, a current KSC gate purchase price of $650/ton was assumed [Bain A. NASA Kennedy Space Center Base Center Hydrogen Operations. FSEC-UCF report for NASA FSEC-CR-1359-02, October 2002]. In addition, evaporator capital cost was added and amortized. In reality, this scenario would not be likely to be considered; oxygen firing would only occur if there were a cheap local source of oxygen available. After analysis, however, this scenario becomes even less attractive. No great improvement in process efficiency is realized for the standard reforming case, and the autothermal case is not an economical fit with PSA purification. In addition, carbon sequestration costs were estimated in order to account for possible environmental impact of the proposed technology. Carbon sequestration for this type of production facility would in fact result in a net decrease in greenhouse gas emissions compared to the release of LFG directly to the atmosphere. To include this cost, additional capital cost estimation for CO2 compression equipment is included along with the corresponding power cost at the $0.052/kWh rate. For sequestration, an average of Department of Energy cost estimates utilizing currently available technology are used [Office of Fossil Energy, DOE website, http://www.fossil.energy.gov/coal_power/sequestration/index.shtml]. For this study, a range of one to seven shuttle launches per year at KSC was analyzed. Costs were calculated as detailed above for the broad range of production rates (<1 to 20 tons per day) and a regression analysis was performed to give an approximate cost of hydrogen on a per kilogram basis. This procedure was performed for three separate cases: gaseous hydrogen production without carbon sequestration, liquid hydrogen production without carbon sequestration, and liquid hydrogen production with carbon sequestration.
NASA/CR—2009-215441 287

Results of Analysis—Figures B1-B3 depict cost results for this analysis. One launch at KSC requires, on the average, approximately 0.8 tpd of hydrogen averaged over the period of one year. This is only an estimate, however; actual hydrogen demand is not a linear function of number of shuttle launches because of the base annual requirements [Bain A. NASA KSC Base Center Hydrogen Operations. FSEC-UCF report for NASA FSEC-CR-1359-02, October 2002]. Figure B1 shows the case where gaseous hydrogen is produced. Clearly, the unit cost of gaseous hydrogen produced drops as plant capacity is increased. The air-fired reforming process is more cost effective on a per kilogram (of gas) basis than an oxygen-fired process; the autothermal case is less economically attractive because of hydrogen losses in PSA offgas and high oxygen cost.
Launches per Year
0 1 2 3 4 5 6 7
Hyd
roge
n C
ost (
$/kg
)
1.0
1.5
2.0
2.5
3.0
3.5
4.0
4.5
Hyd
roge
n C
ost (
$/lb
)
0.4
0.6
0.8
1.0
1.2
1.4
1.6
1.8
2.0
Air-fired O2 FiredATR
Figure B1. Cost of gaseous hydrogen production by dry reforming of LFG (1 launch/year = 725 kg H2/day, LFG Cost = $1.42/GJ).
In case of liquid hydrogen production (Figure B2) the trend is identical, provided, liquefaction costs will be equal for all three scenarios. In Figure B3, that presents the analysis of liquid hydrogen production by the autothermal process the hydrogen cost approaches that of the oxygen-fired reformer. This is due to the lack of carbon sequestration for the flue gas needed in the standard reforming cases. All of the CO2 present in the process exists in the actual process stream and is separated out in the PSA unit. These preliminary results indicate that, for greater than two launches per year, local liquid hydrogen production via catalytic reforming of LFG with air used for combustion appears to be cost competitive with the option of liquid hydrogen delivery from Louisiana. When greenhouse gas sequestration is accounted for, the break-even number of launches is driven up to four. At a lower range of launches, the processes requiring oxygen are not economical when compared to the current KSC purchase price of liquid hydrogen.
NASA/CR—2009-215441 288

Launches per Year
0 1 2 3 4 5 6 7
Hyd
roge
n C
ost (
$/kg
)
2.0
2.5
3.0
3.5
4.0
4.5
5.0
5.5
6.0
6.5
7.0
Hyd
roge
n C
ost (
$/lb
)
1.0
1.2
1.4
1.6
1.8
2.0
2.2
2.4
2.6
2.8
3.0
Air-fired O2 FiredATR
Figure B2. Cost of liquid hydrogen production by dry reforming of LFG.
Launches per Year
0 1 2 3 4 5 6 7
Hyd
roge
n C
ost (
$/kg
)
3.5
4.0
4.5
5.0
5.5
6.0
6.5
7.0
Hyd
roge
n C
ost (
$/lb
)
1.6
1.8
2.0
2.2
2.4
2.6
2.8
3.0
3.2
Air-fired O2-fired ATR
Figure B3. Cost of liquid hydrogen production with carbon dioxide sequestration.
LH2 Price Delivered to KSC
LH2 Price Delivered to KSC
NASA/CR—2009-215441 289

Summary of Appendix B—This study identifies catalytic reforming of landfill gas as a technically and economically viable process for on-site hydrogen production at NASA-KSC. Experimental verification of hydrogen production from CH4-CO2 mixtures mimicking LFG using commercial catalysts was demonstrated. The composition of the reforming gas is in good agreement with the thermodynamic equilibrium data, which is an indication of high catalytic activity and near optimal operational conditions. Three scenarios distinguished by the mode of heat input to the process were modeled and compared. The reforming using an external heat input and using air for combustion results in an overall first law efficiency of approximately 60%. This scenario is particularly advantageous because PSA produces hydrogen with very purity , and the PSA offgas can be used in the combustor. A preliminary economic assessment indicates the cost range of liquid hydrogen product to be $3.00 to $6.00 per kilogram depending upon the production rate and whether or not carbon sequestration is added to the scheme. Hydrogen production options with external heat input and O2 for combustion, and autothermal reforming were economically less attractive; the liquid hydrogen cost was estimated to be in the range of $3.75 to $7.00 per kilogram. November 2007
NASA/CR—2009-215441 290