1 construction and application of sustainable energy indicator in taiwan chien-ming lee, chun-kai...
TRANSCRIPT
1
Construction and Application of Sustainable Energy Indicator
in Taiwan
Chien-Ming Lee, Chun-Kai Wang, Hue-Dhe Chou
Institute of Natural Resource and Environmental Management / Taipei University
October,11,2004 Taipei/Taiwan
2
Content
Taiwan Energy Development Status The Meaning of Sustainable Energy D
evelopment(SED) Sustainable Indicators Construction and
Investigation in Taiwan Taiwan Indicators for Sustainabe Energ
y Development (TISED) model Conclusion
3
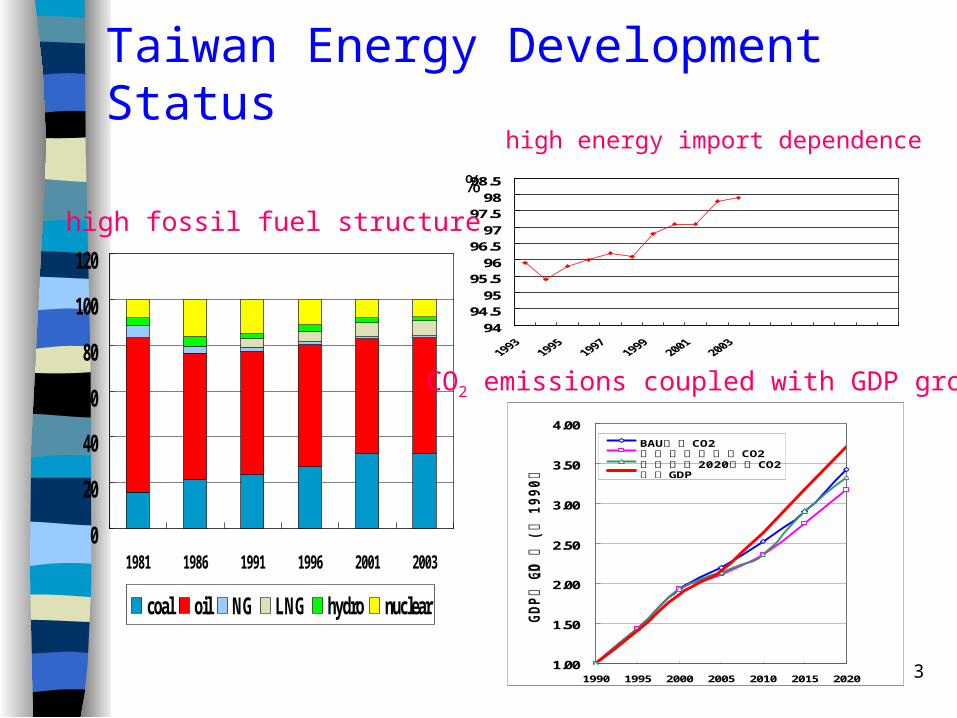
Taiwan Energy Development Status
9494.595
95.596
96.597
97.598
98.5%
high energy import dependence
1.00
1.50
2.00
2.50
3.00
3.50
4.00
1990 1995 2000 2005 2010 2015 2020
GDP
CO
與2
(1990
1)
指數
以年
為
BAU CO2情景CO2高能源效率情景
2020 CO2再生能源 年案GDP實質
0
20
40
60
80
100
120
1981 1986 1991 1996 2001 2003
coal oil NG LNG hydro nuclear
high fossil fuel structure
CO2 emissions coupled with GDP growth
4
Energy Development Issues
High energy import dependence, the energy supplies system is vulnerable
How to decouple CO2 emissions with economic growth
High fossil fuel share, to increase renewable energy is difficult
New energy development lacks of market competition as well as market inducements
5
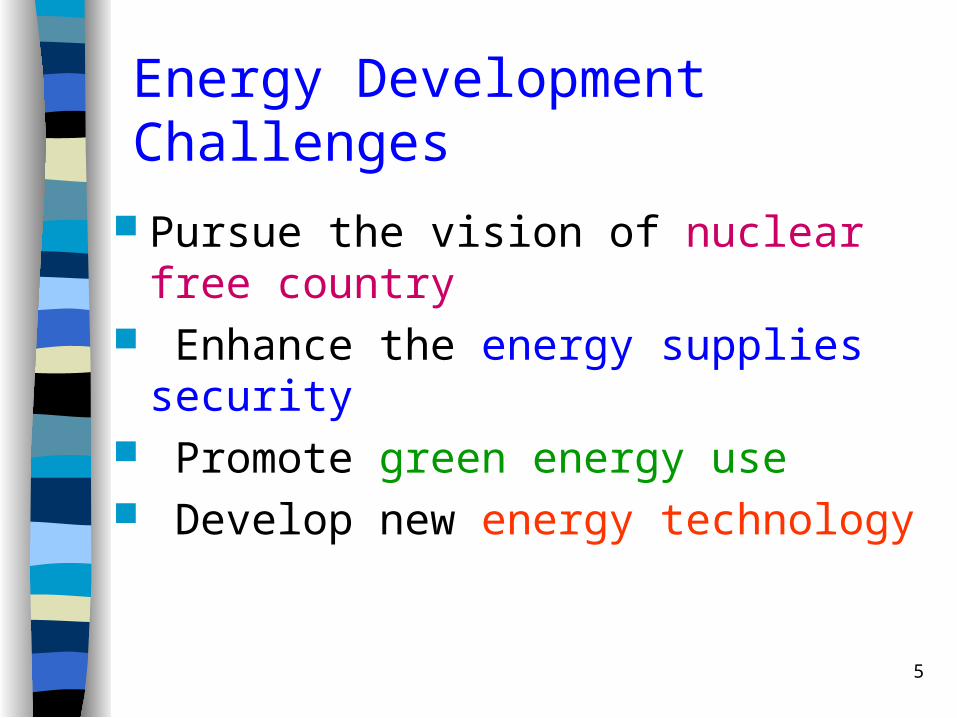
Energy Development Challenges
Pursue the vision of nuclear free country Enhance the energy supplies security Promote green energy use Develop new energy technology
6
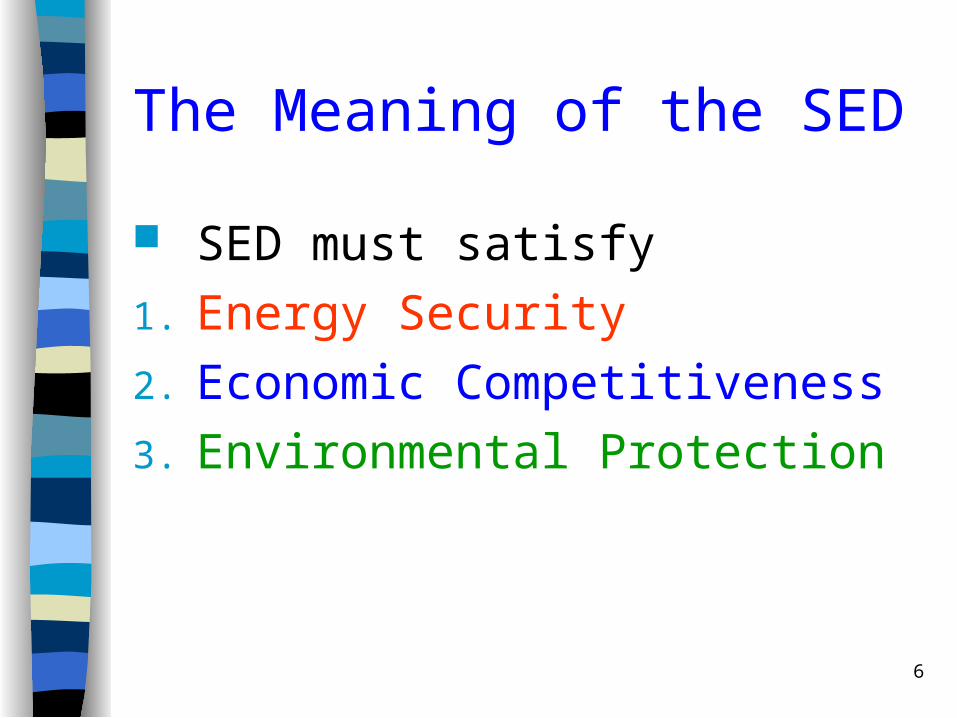
The Meaning of the SED
SED must satisfy
1. Energy Security
2. Economic Competitiveness
3. Environmental Protection
7
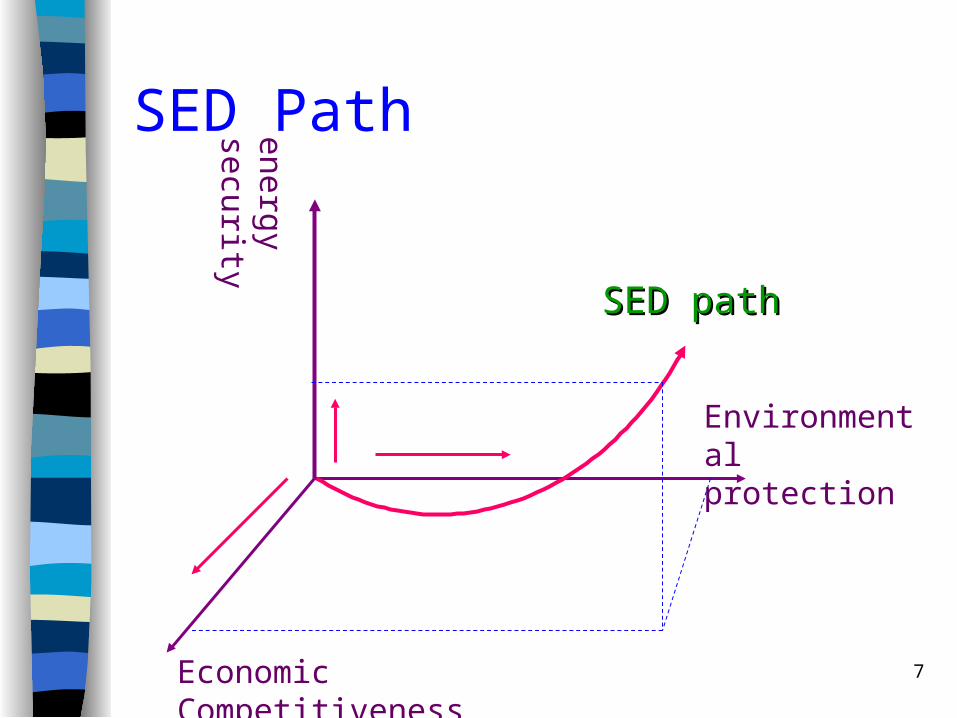
SED Path
Economic Competitiveness
Environmental protection
energy security
SED pathSED path
8
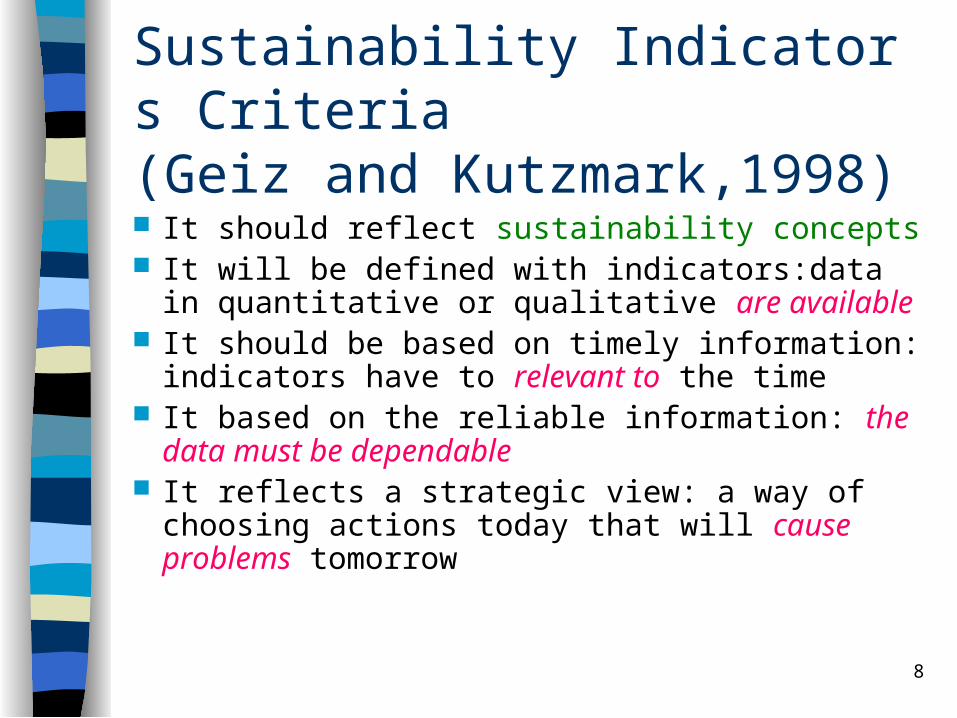
Sustainability Indicators Criteria(Geiz and Kutzmark,1998)
It should reflect sustainability concepts It will be defined with indicators:data in
quantitative or qualitative are available It should be based on timely information:
indicators have to relevant to the time It based on the reliable information: the data
must be dependable It reflects a strategic view: a way of choosing
actions today that will cause problems tomorrow
9
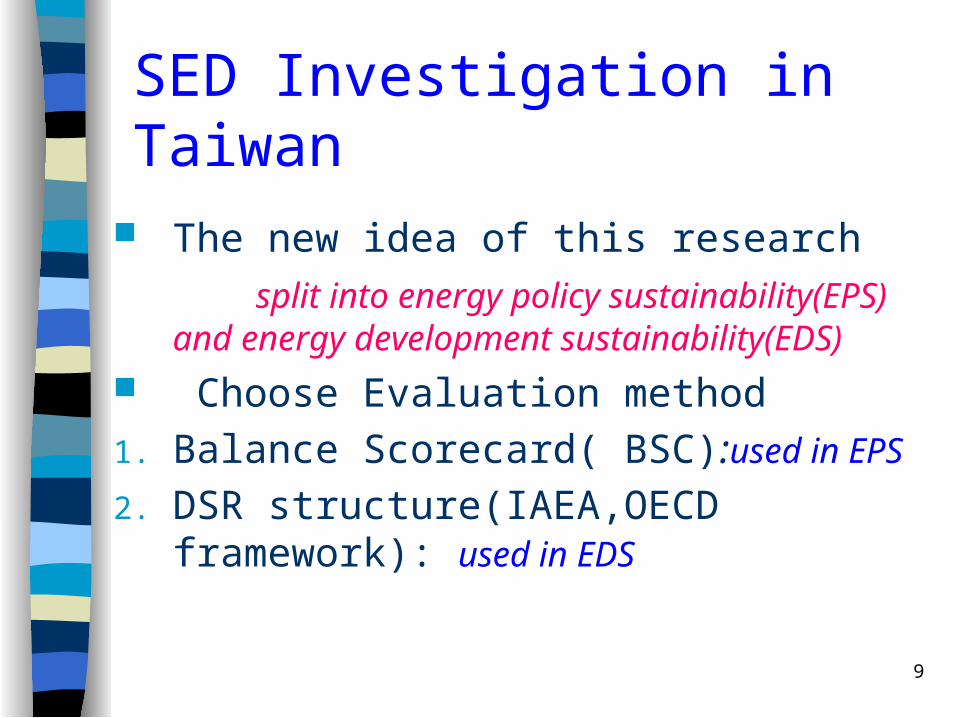
SED Investigation in Taiwan
The new idea of this research
split into energy policy sustainability(EPS) and energy development sustainability(EDS)
Choose Evaluation method
1. Balance Scorecard( BSC):used in EPS
2. DSR structure(IAEA,OECD framework): used in EDS
10
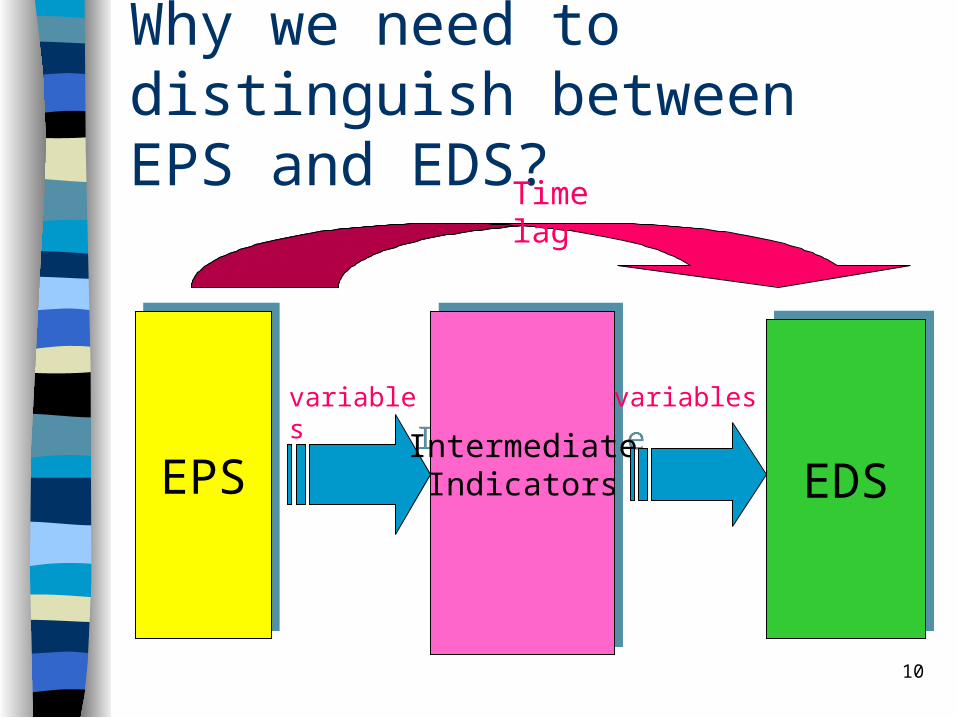
Why we need to distinguish between EPS and EDS?
EPSEPSIntermediate
IndicatorsIntermediate
Indicators EDSEDS
variables variables
Time lag
11
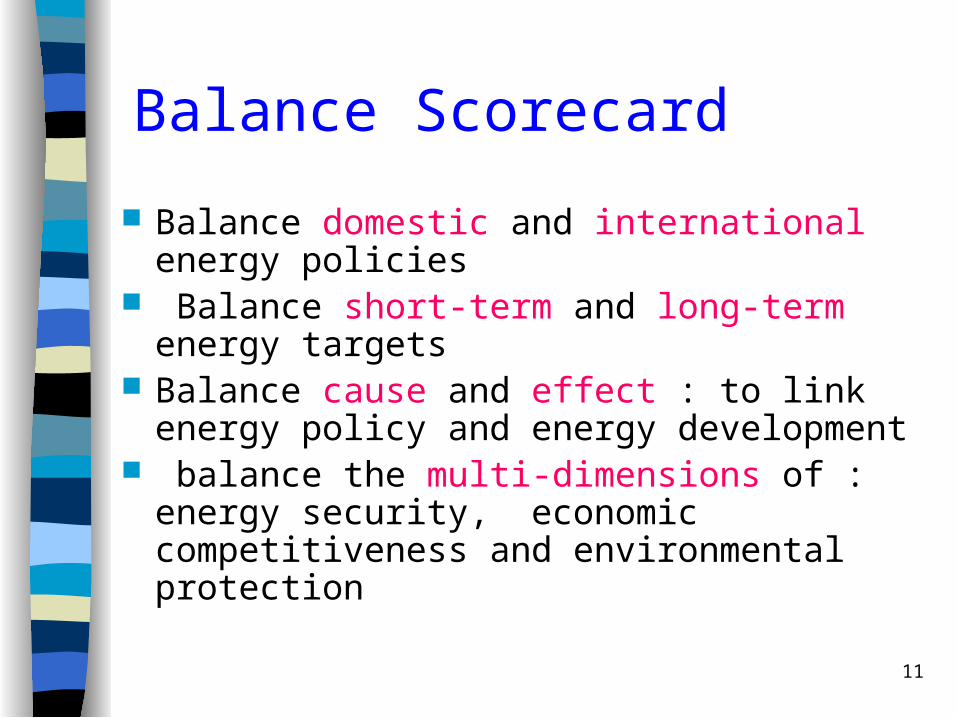
Balance Scorecard
Balance domestic and international energy policies
Balance short-term and long-term energy targets
Balance cause and effect : to link energy policy and energy development
balance the multi-dimensions of : energy security, economic competitiveness and environmental protection
12
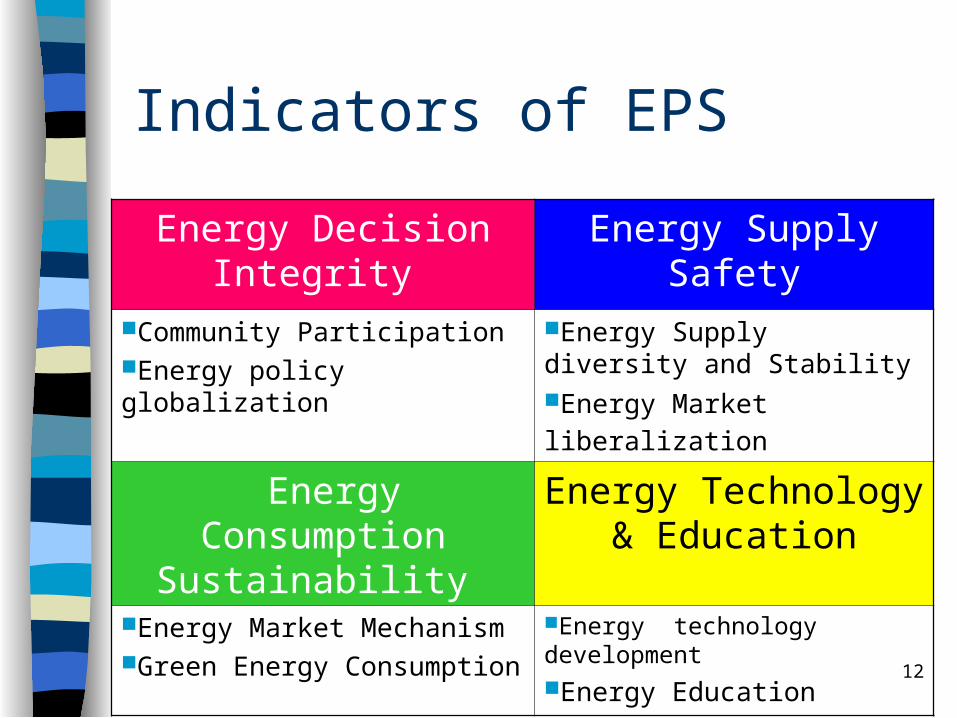
Indicators of EPS
Energy Decision Integrity
Energy Supply Safety
Community ParticipationEnergy policy globalization
Energy Supply diversity and Stability
Energy Market liberalization
Energy Consumption Sustainability
Energy Technology & Education
Energy Market MechanismGreen Energy Consumption
Energy technology developmentEnergy Education
13
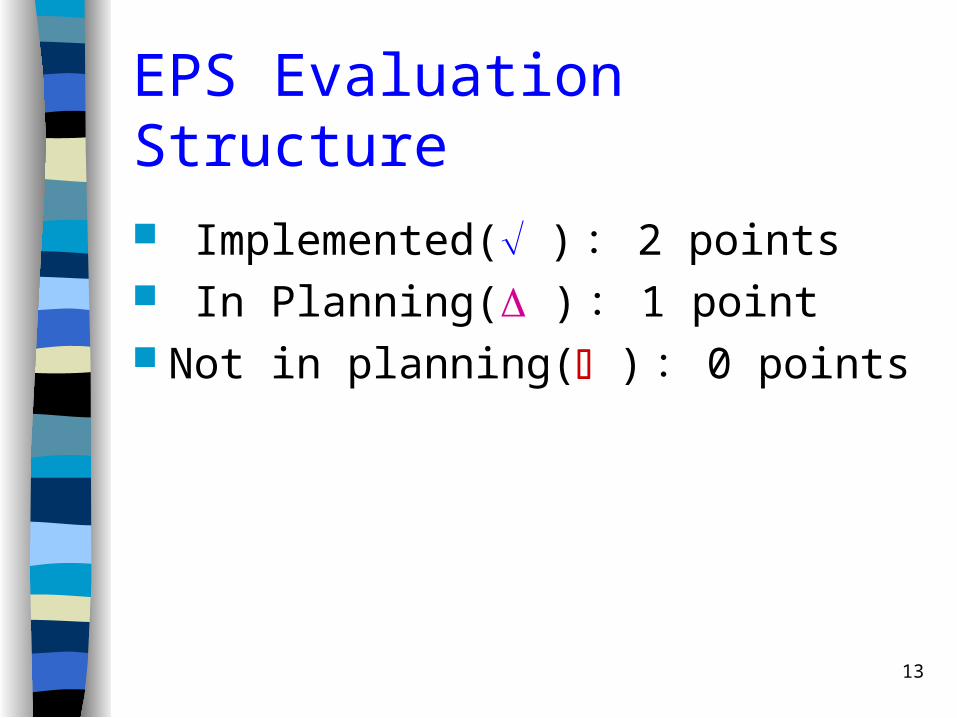
EPS Evaluation Structure
Implemented( ): 2 points In Planning( ): 1 point Not in planning( ): 0 points

14
Energy Decision IntegrityCommunity Participation indicators status
1. Energy decision transparency energy statistics publication Check energy target
2. Community human capital Subsidize energy community Develop energy model
3. Complementary relationship between the community and the government
Subsidize domestic NGO joint international meeting
Subsidy domestic NGO held energy policy conference
Energy policy globalization 1. Integrate international energy
development strategy
Annual participate worldwide meeting
Energy institute linkage in the worldwide
Energy policy toward market mechanism
2. Energy policy response to international treats
CO2 abatement policy Participation an internal meeting Long tern responsible project

15
Energy Supply SafetyEnergy Supply diverse indicators status
1.Pursuit nuclear free country
Nuclear free actReducing nuclear share Nuclear free launch project
2.Developing renewable energy
Renewable development actIncreasing renewable share Subsidize renewable projectRenewable portfolio system
3.Increasing green energy share
Decreasing oil and coal shareIncreasing natural gas shareGrowth of co-generation share
4.Energy emergency mechanism
Cooperation with energy producing countriesDialogue with energy producing countriespetroleum security saves energy prospects plan
16
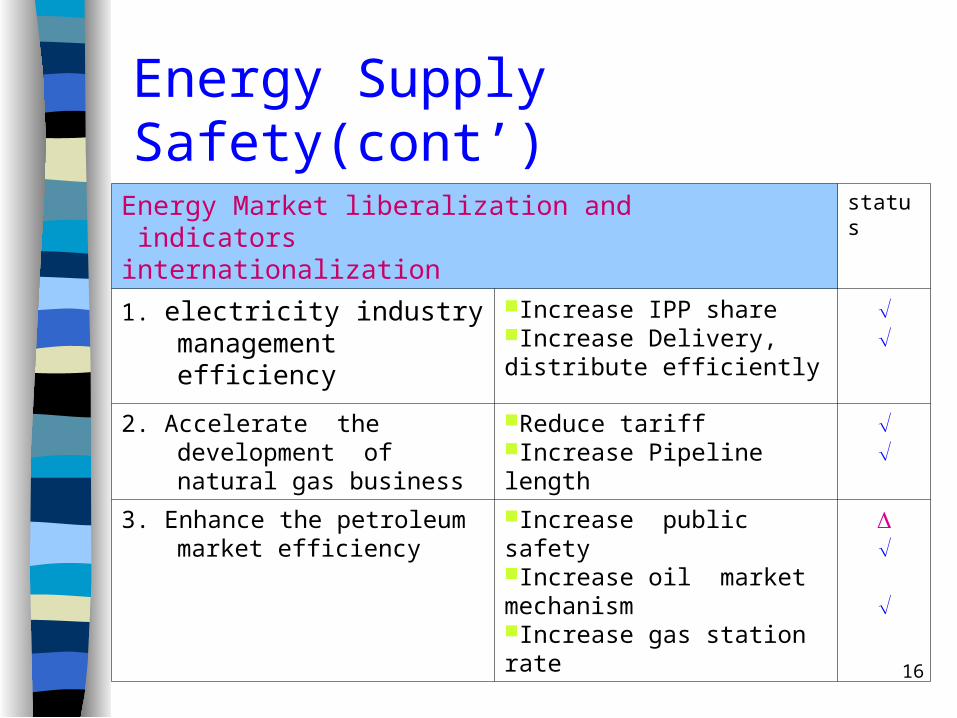
Energy Supply Safety(cont’)
Energy Market liberalization and indicators internationalization
status
1. electricity industry management efficiency
Increase IPP shareIncrease Delivery, distribute efficiently
2. Accelerate the development of natural gas business
Reduce tariffIncrease Pipeline length
3. Enhance the petroleum market efficiency
Increase public safetyIncrease oil market mechanismIncrease gas station rate
17
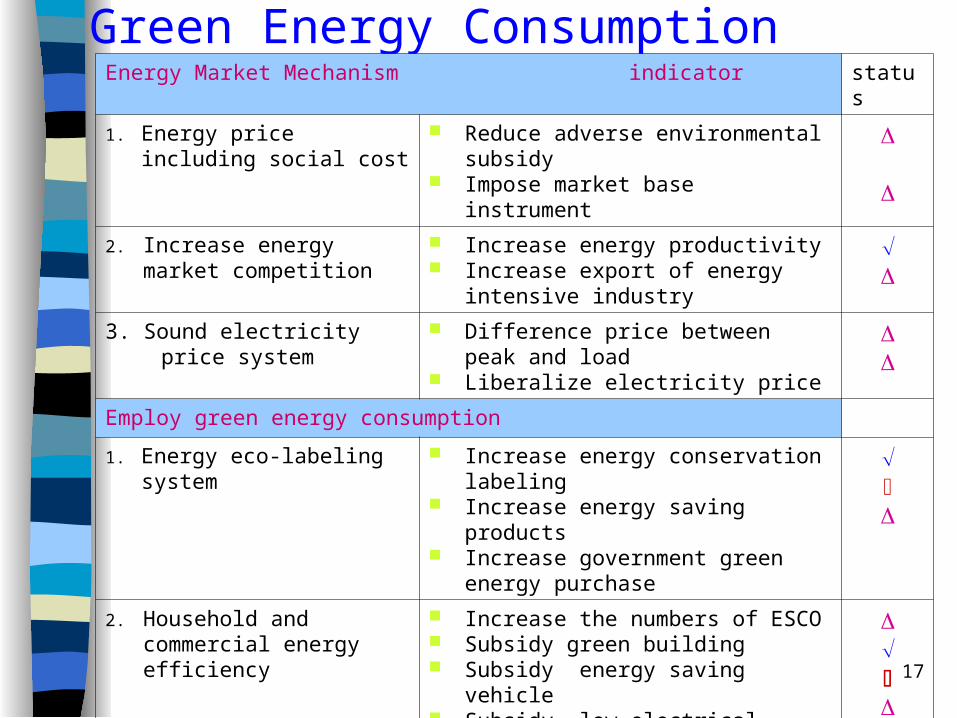
Green Energy Consumption Energy Market Mechanism indicator status
1. Energy price including social cost
Reduce adverse environmental subsidy
Impose market base instrument
2. Increase energy market
competition
Increase energy productivity Increase export of energy intensive
industry
3. Sound electricity price system
Difference price between peak and load
Liberalize electricity price
Employ green energy consumption
1. Energy eco-labeling system Increase energy conservation labeling Increase energy saving products Increase government green energy
purchase
2. Household and commercial energy efficiency
Increase the numbers of ESCO Subsidy green building Subsidy energy saving vehicle Subsidy low electrical appliance
3. Monitor energy intensive industry
Increase energy audit Energy saving of energy intensive
industry
18
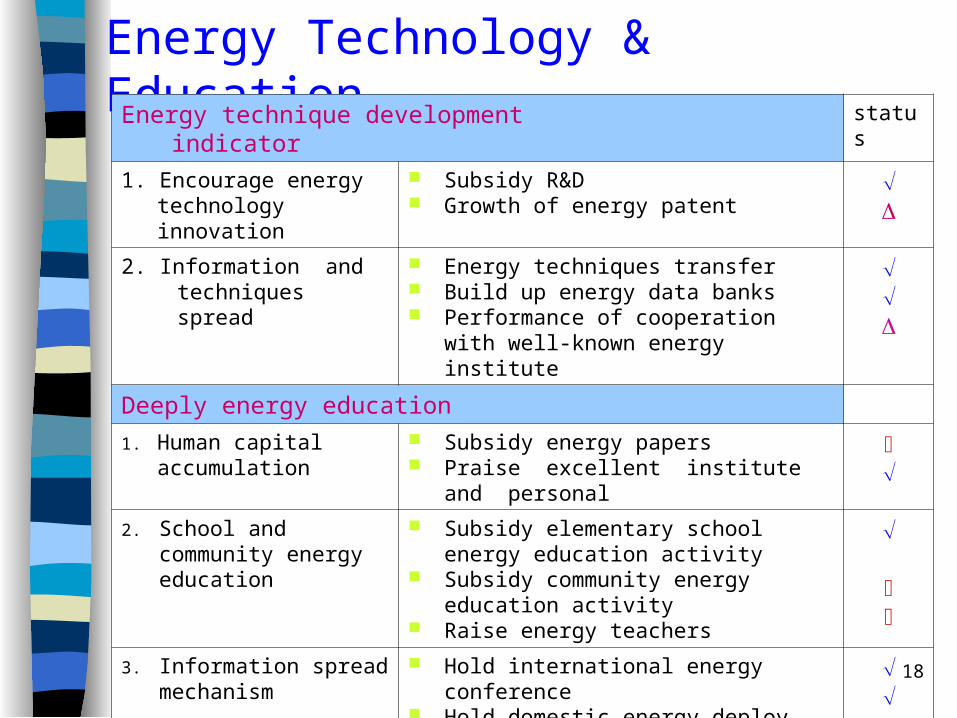
Energy Technology & EducationEnergy technique development indicator status
1. Encourage energy technology innovation
Subsidy R&D Growth of energy patent
2. Information and techniques spread
Energy techniques transfer Build up energy data banks Performance of cooperation with well-
known energy institute
Deeply energy education
1. Human capital accumulation
Subsidy energy papers Praise excellent institute and personal
2. School and community energy education
Subsidy elementary school energy education activity
Subsidy community energy education activity
Raise energy teachers
3. Information spread mechanism
Hold international energy conference Hold domestic energy deploy meeting
4. Public energy conservation cognition
Energy conservation conduct in media Energy website
19
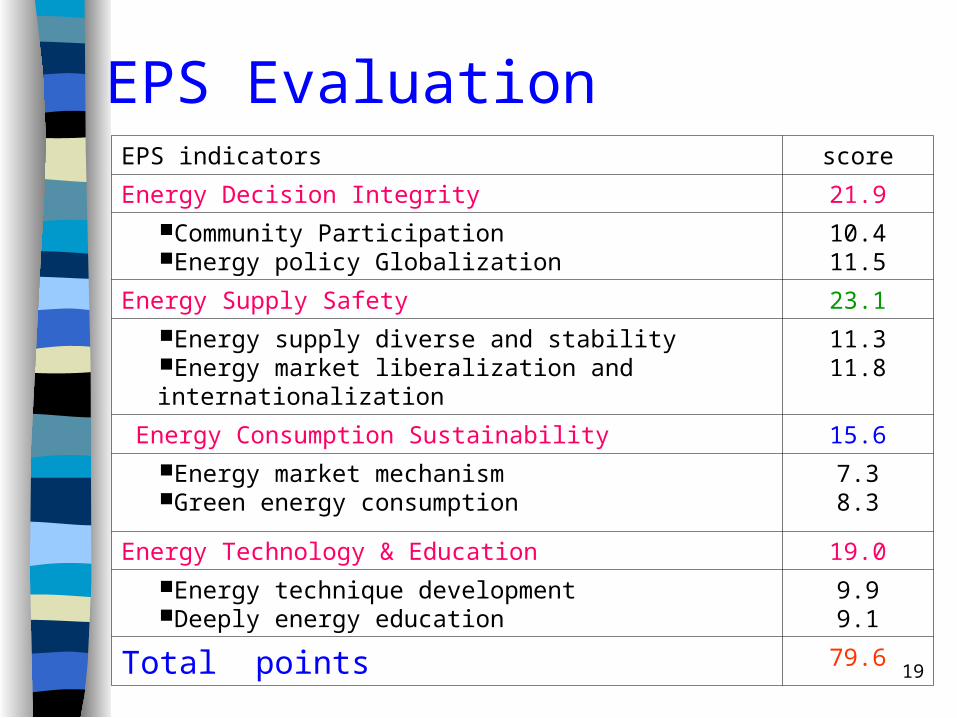
EPS EvaluationEPS indicators score
Energy Decision Integrity 21.9
Community ParticipationEnergy policy Globalization
10.411.5
Energy Supply Safety 23.1
Energy supply diverse and stabilityEnergy market liberalization and internationalization
11.311.8
Energy Consumption Sustainability 15.6
Energy market mechanismGreen energy consumption
7.38.3
Energy Technology & Education 19.0
Energy technique development Deeply energy education
9.99.1
Total points 79.6
20
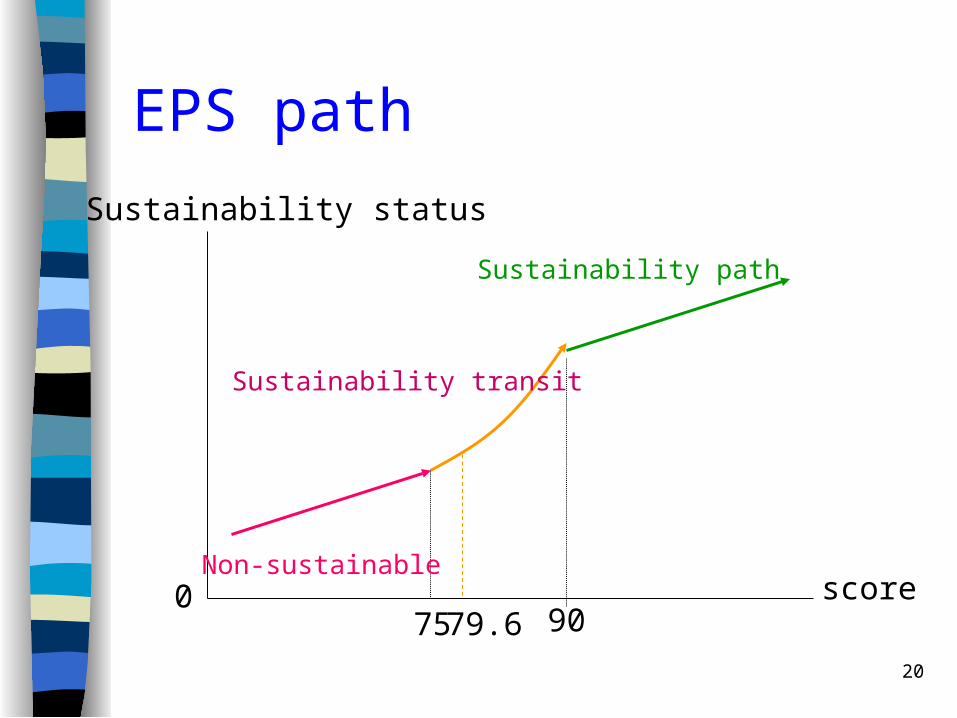
EPS path
75 79.6 90
Sustainability status
0 score
Sustainability path
Sustainability transit
Non-sustainable

21
Results
Total points are 79.6 (greater than 75 points), shows that the country energy policy is on the sustainability transit , however, not on the sustainability path(less than 90 points)
The energy supplies safety received the highest score with 23.1
Enhancing green energy consumption is a policy priority in the future
22
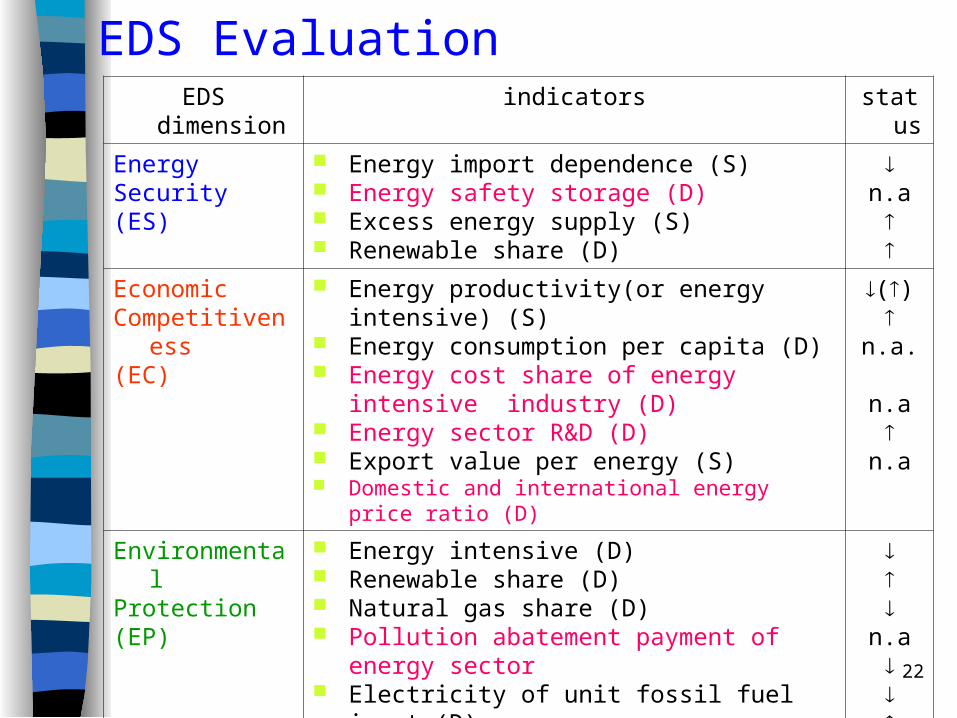
EDS Evaluation EDS dimension indicators status
Energy Security(ES)
Energy import dependence (S) Energy safety storage (D) Excess energy supply (S) Renewable share (D)
n.a
Economic Competitiveness(EC)
Energy productivity(or energy intensive) (S) Energy consumption per capita (D) Energy cost share of energy intensive
industry (D) Energy sector R&D (D) Export value per energy (S) Domestic and international energy price ratio (D)
()
n.a.
n.a
n.a
Environmental Protection(EP)
Energy intensive (D) Renewable share (D) Natural gas share (D) Pollution abatement payment of energy sector Electricity of unit fossil fuel input (D) CO2/energy (S) CO2/GDP (s) Radioactive waste (S)
n.a
23
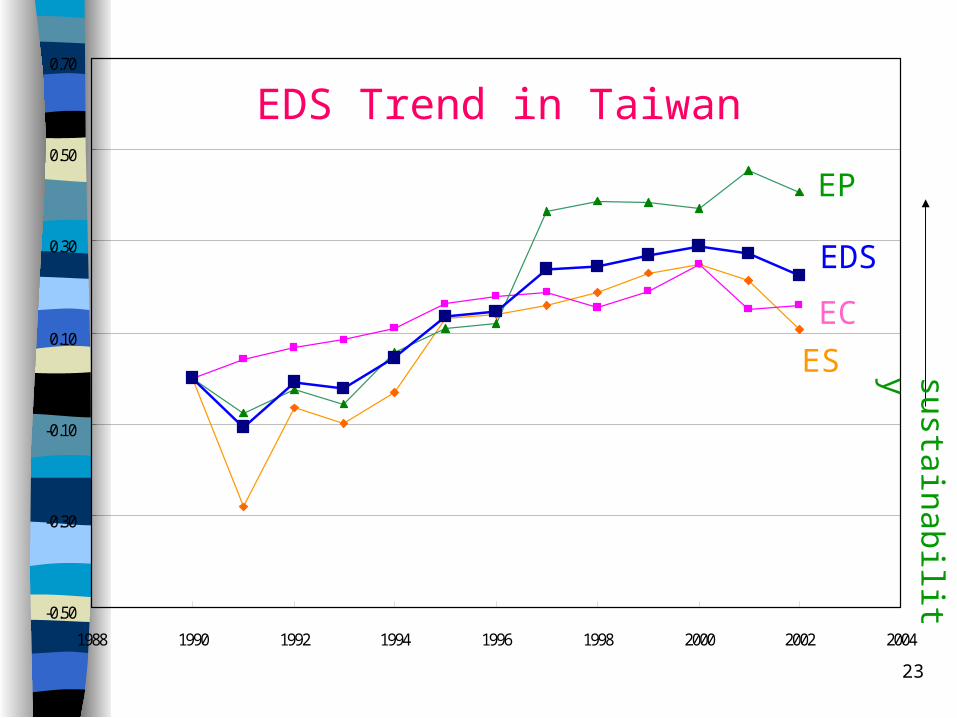
-0.50
-0.30
-0.10
0.10
0.30
0.50
0.70
1988 1990 1992 1994 1996 1998 2000 2002 2004
ES
EC
EP
EDS
EDS Trend in Taiwan
sustainability

24
Regression
Regression Equation R2
EC = 0.11 + 0.36 ES
(8.42) (4.74)
0.67
EP = -0.11 + 2.25 EC
(-1.29) (3.95)
0.59
25
Results Energy development approaches to the
sustainability path Energy security is the bases of the EDS
in Taiwan
26
Establish TISED Model
Uses IAEA/IAE(2001) framework(DSR) and indicators selection
Build up a System Regression Model
27
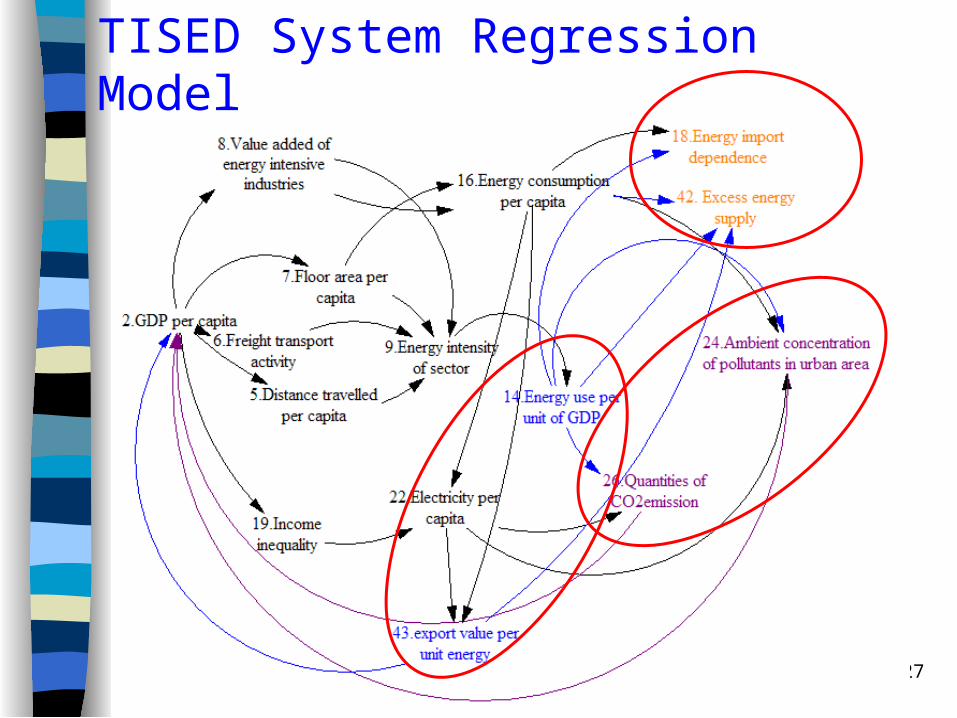
TISED System Regression Model
28
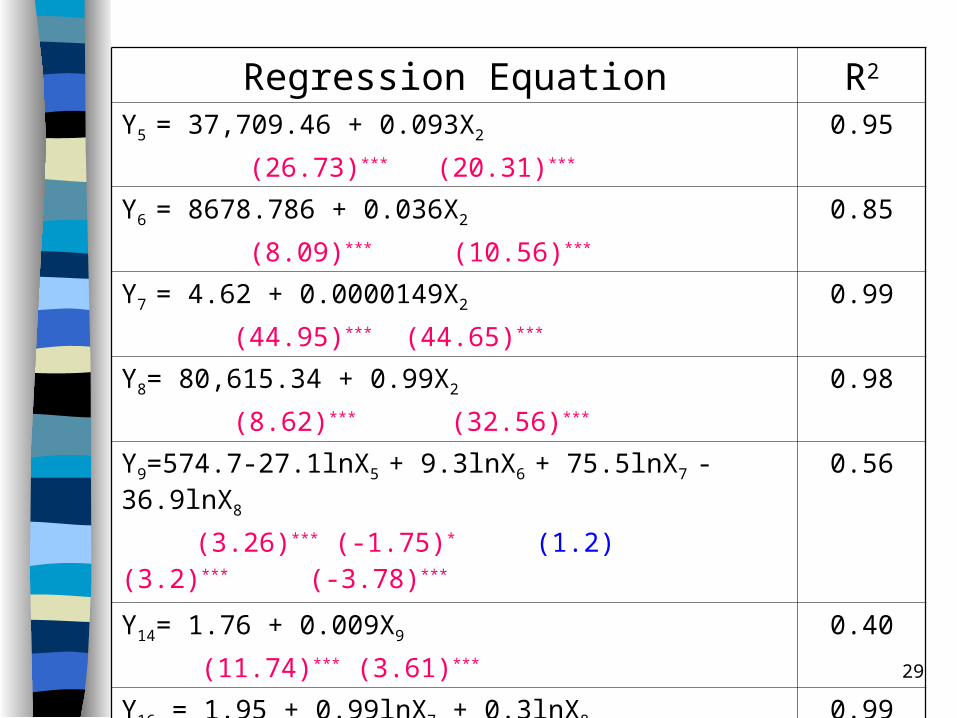
Data and Regression Equation
Observers: time series (1982 – 2003) Regression equations:14
29
Regression Equation R2
Y5 = 37,709.46 + 0.093X2
(26.73)*** (20.31)***
0.95
Y6 = 8678.786 + 0.036X2
(8.09)*** (10.56)***
0.85
Y7 = 4.62 + 0.0000149X2
(44.95)*** (44.65)***
0.99
Y8= 80,615.34 + 0.99X2
(8.62)*** (32.56)***
0.98
Y9=574.7-27.1lnX5 + 9.3lnX6 + 75.5lnX7 - 36.9lnX8
(3.26)*** (-1.75)* (1.2) (3.2)*** (-3.78)***
0.56
Y14= 1.76 + 0.009X9
(11.74)*** (3.61)***
0.40
Y16 = 1.95 + 0.99lnX7 + 0.3lnX8
(3.81)*** (9.95)*** (5.33)***
0.99
30
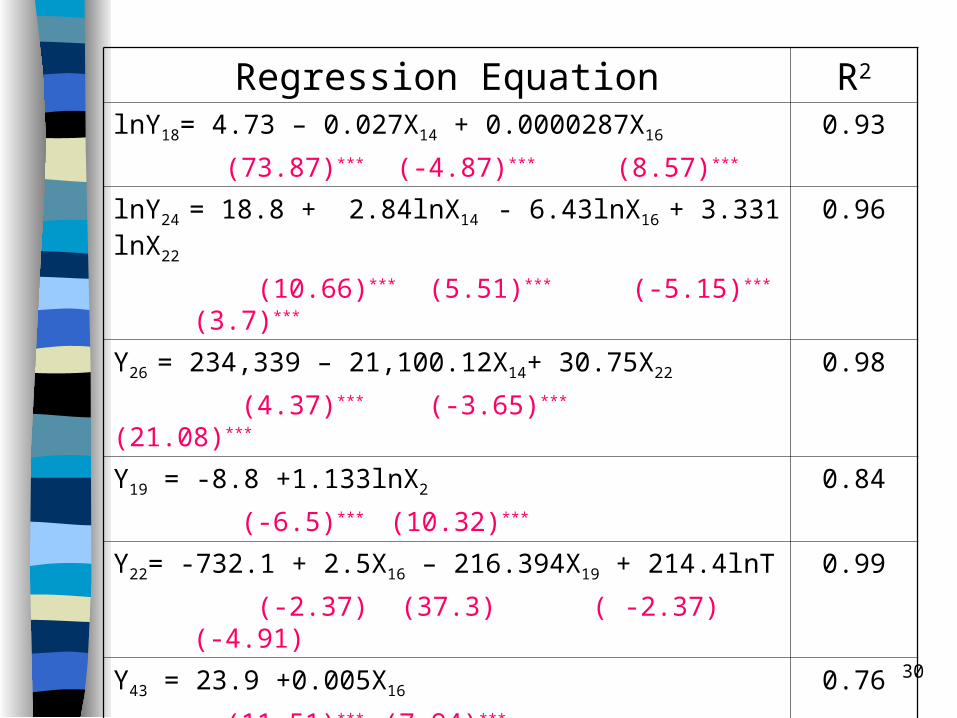
Regression Equation R2
lnY18= 4.73 – 0.027X14 + 0.0000287X16
(73.87)*** (-4.87)*** (8.57)***
0.93
lnY24 = 18.8 + 2.84lnX14 - 6.43lnX16 + 3.331lnX22
(10.66)*** (5.51)*** (-5.15)*** (3.7)***
0.96
Y26 = 234,339 – 21,100.12X14+ 30.75X22
(4.37)*** (-3.65)*** (21.08)***
0.98
Y19 = -8.8 +1.133lnX2
(-6.5)*** (10.32)***
0.84
Y22= -732.1 + 2.5X16 – 216.394X19 + 214.4lnT
(-2.37) (37.3) ( -2.37) (-4.91)
0.99
Y43 = 23.9 +0.005X16
(11.51)*** (7.94)***
0.76
Y42 = 5.729 – 0.42lnX24 + 0.65lnX26 + 0.22lnX43
(3.16)*** (-3.37)*** (5.83)*** (1.85)*
0.87
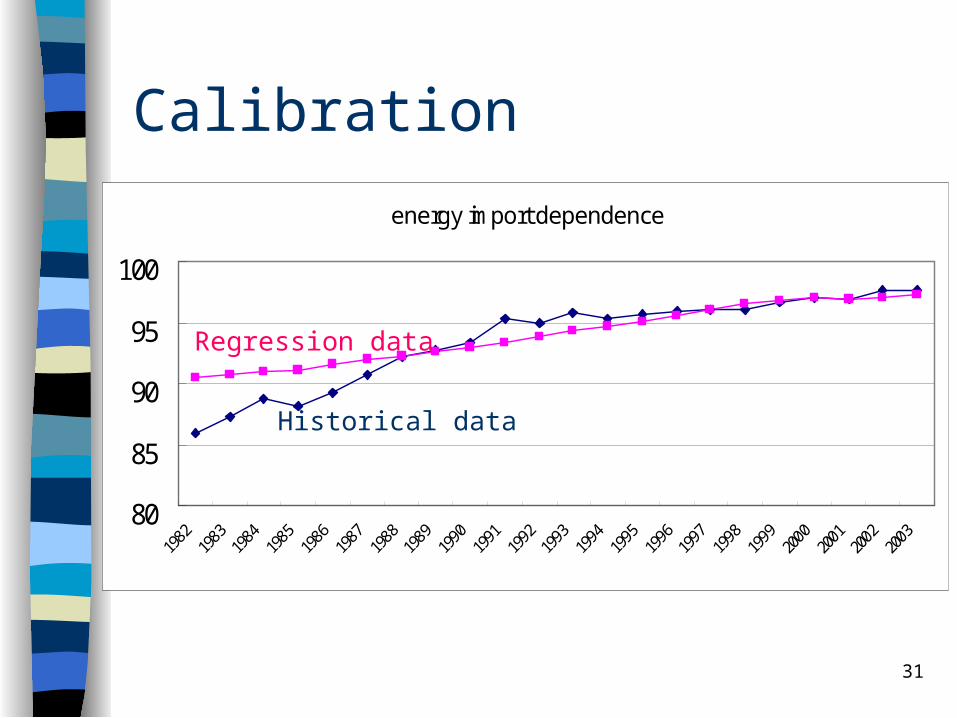
31
Calibration
energy import dependence
80
85
90
95
100
Historical data
Regression data
32
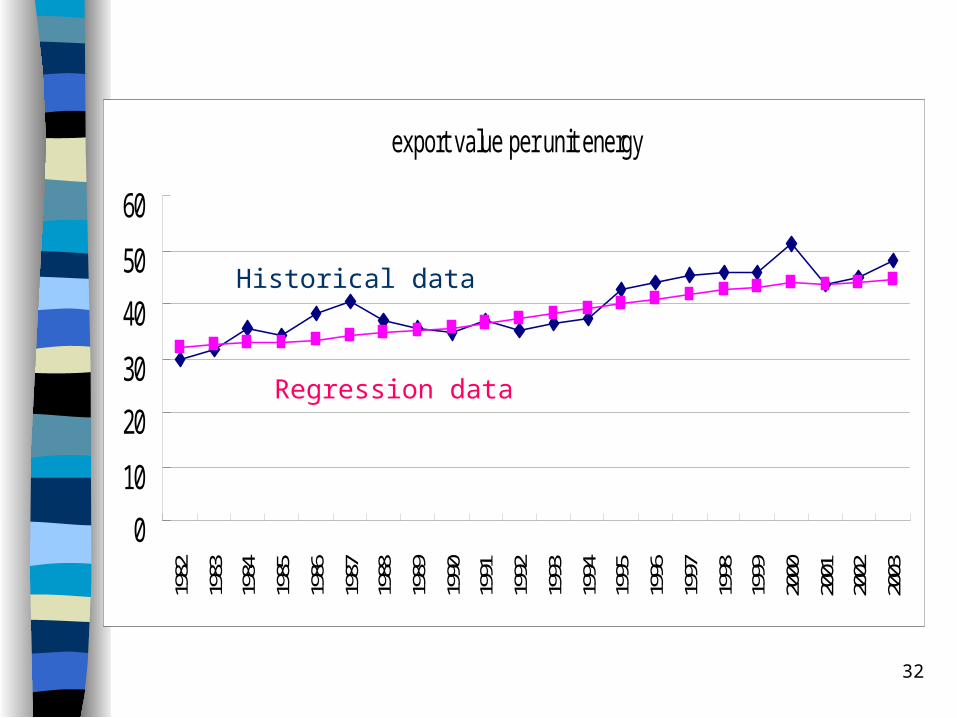
export value per unit energy
0
10
20
30
40
50
6019
8219
8319
8419
8519
8619
8719
8819
8919
9019
9119
9219
9319
9419
9519
9619
9719
9819
9920
0020
0120
0220
03
Historical data
Regression data
33
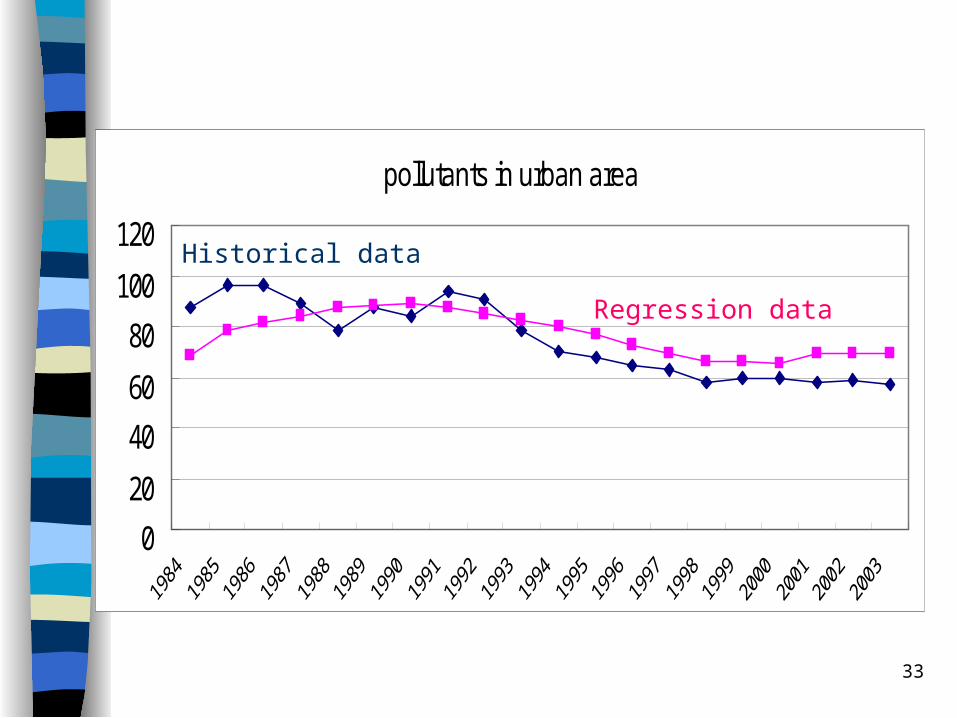
pollutants in urban area
0
20
40
60
80
100
120
Regression data
Historical data
34
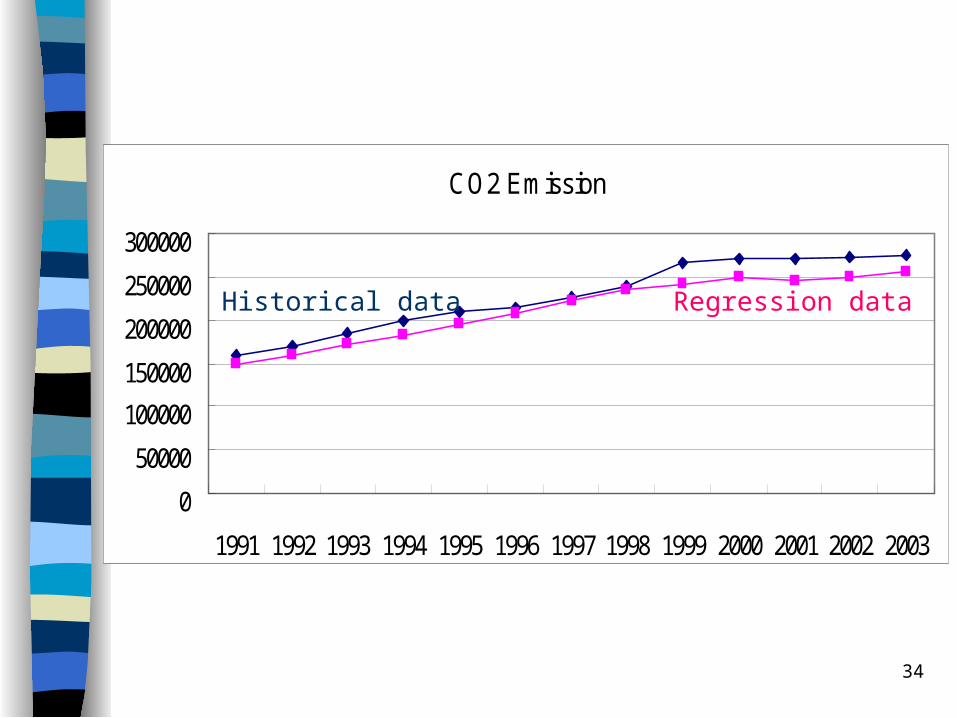
CO2 Emission
0
50000
100000
150000
200000
250000
300000
1991 1992 1993 1994 1995 1996 1997 1998 1999 2000 2001 2002 2003
Historical data Regression data
35
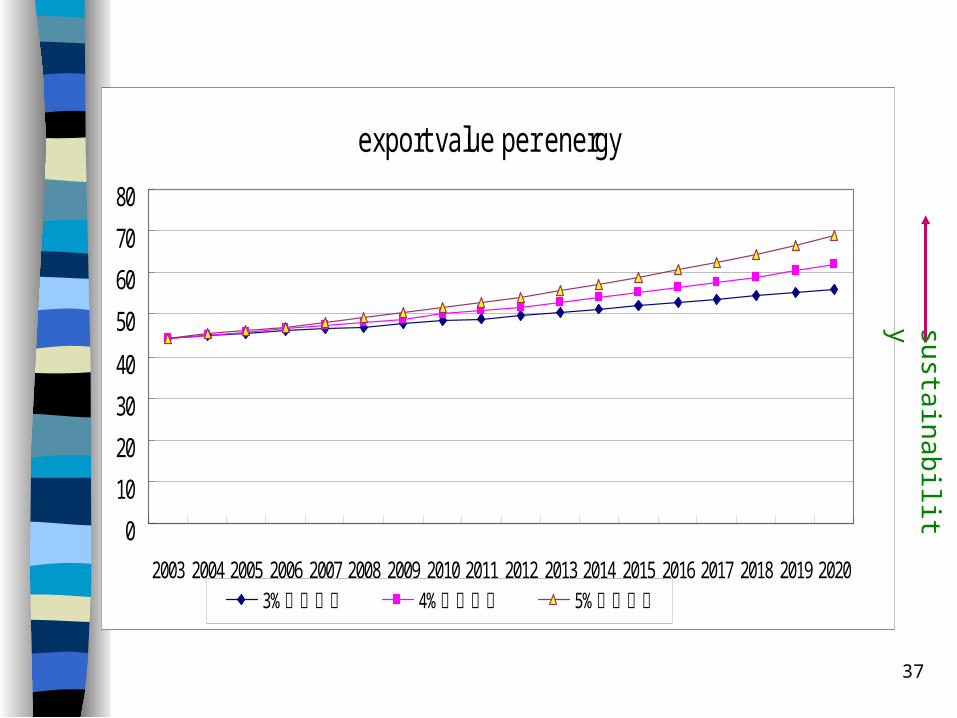
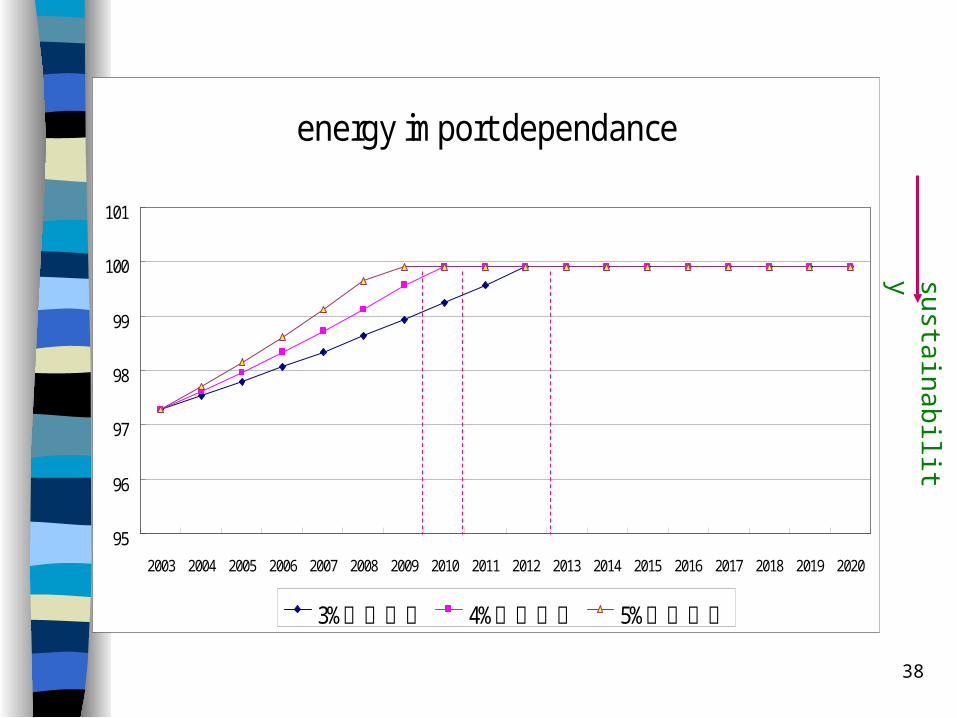
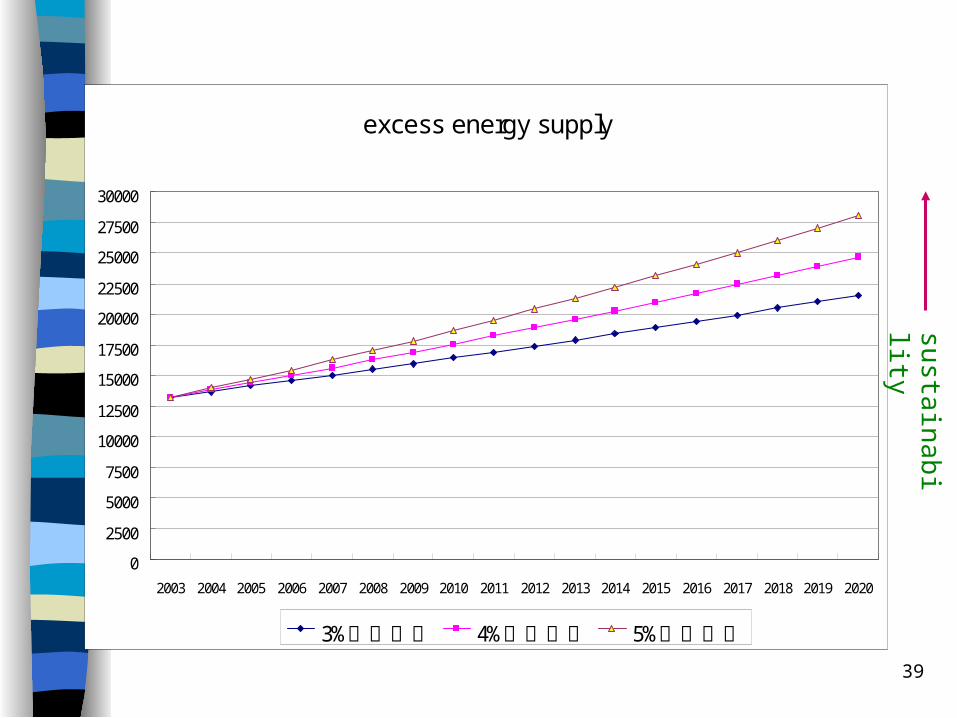
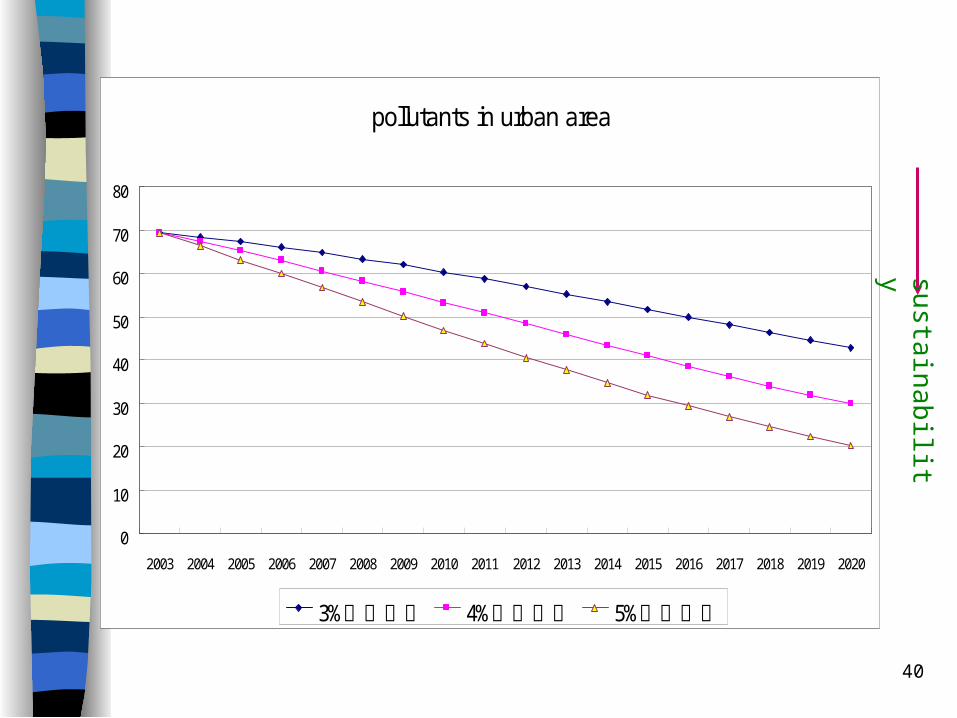
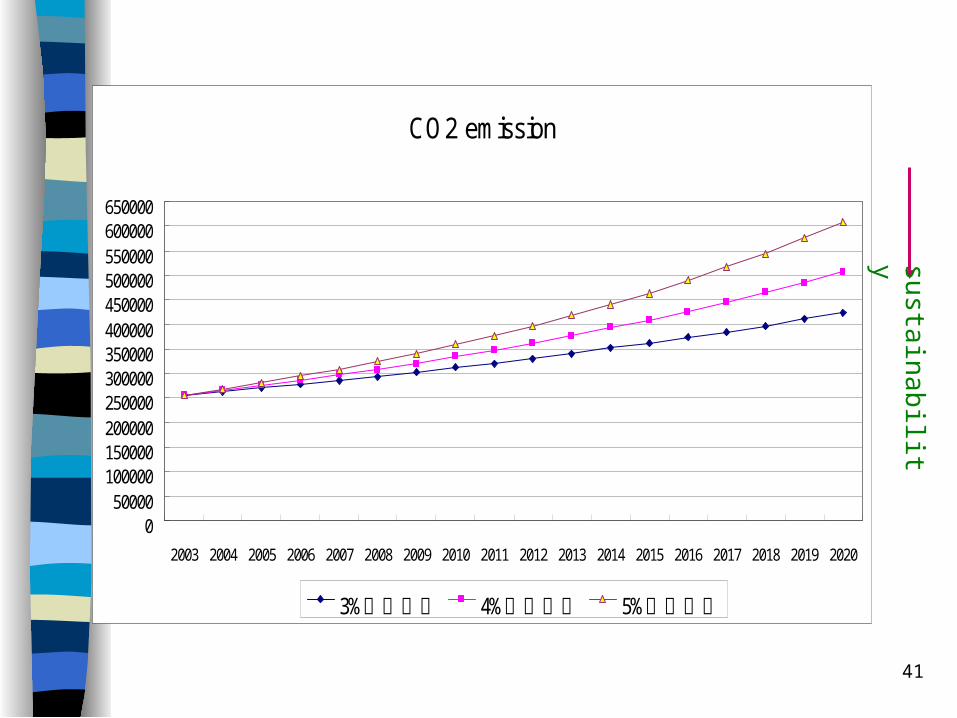
Simulation: GDP per capita Growth(3%,4%,5%)
36
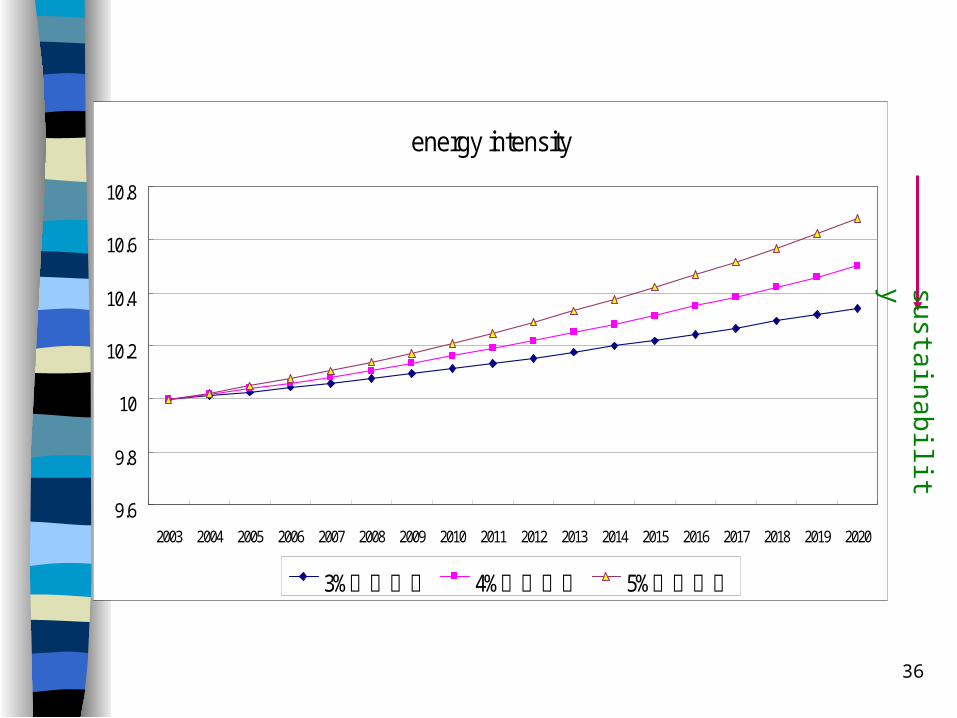
energy intensity
9.6
9.8
10
10.2
10.4
10.6
10.8
2003 2004 2005 2006 2007 2008 2009 2010 2011 2012 2013 2014 2015 2016 2017 2018 2019 2020
3%成長預測 4%成長預測 5%成長預測
sustainab
ility
37
export value per energy
0
10
20
30
40
50
60
70
80
2003 2004 2005 2006 2007 2008 2009 2010 2011 2012 2013 2014 2015 2016 2017 2018 2019 20203%成長預測 4%成長預測 5%成長預測
sustainab
ility
38
energy import dependance
95
96
97
98
99
100
101
2003 2004 2005 2006 2007 2008 2009 2010 2011 2012 2013 2014 2015 2016 2017 2018 2019 2020
3%成長預測 4%成長預測 5%成長預測
sustainab
ility
39
excess energy supply
0
2500
5000
7500
10000
12500
15000
17500
20000
22500
25000
27500
30000
2003 2004 2005 2006 2007 2008 2009 2010 2011 2012 2013 2014 2015 2016 2017 2018 2019 2020
3%成長預測 4%成長預測 5%成長預測
sustainab
ility
40
pollutants in urban area
0
10
20
30
40
50
60
70
80
2003 2004 2005 2006 2007 2008 2009 2010 2011 2012 2013 2014 2015 2016 2017 2018 2019 2020
3%成長預測 4%成長預測 5%成長預測
sustainab
ility
41
CO2 emission
050000
100000150000200000250000300000350000400000450000500000550000600000650000
2003 2004 2005 2006 2007 2008 2009 2010 2011 2012 2013 2014 2015 2016 2017 2018 2019 2020
3%成長預測 4%成長預測 5%成長預測
sustainab
ility
42
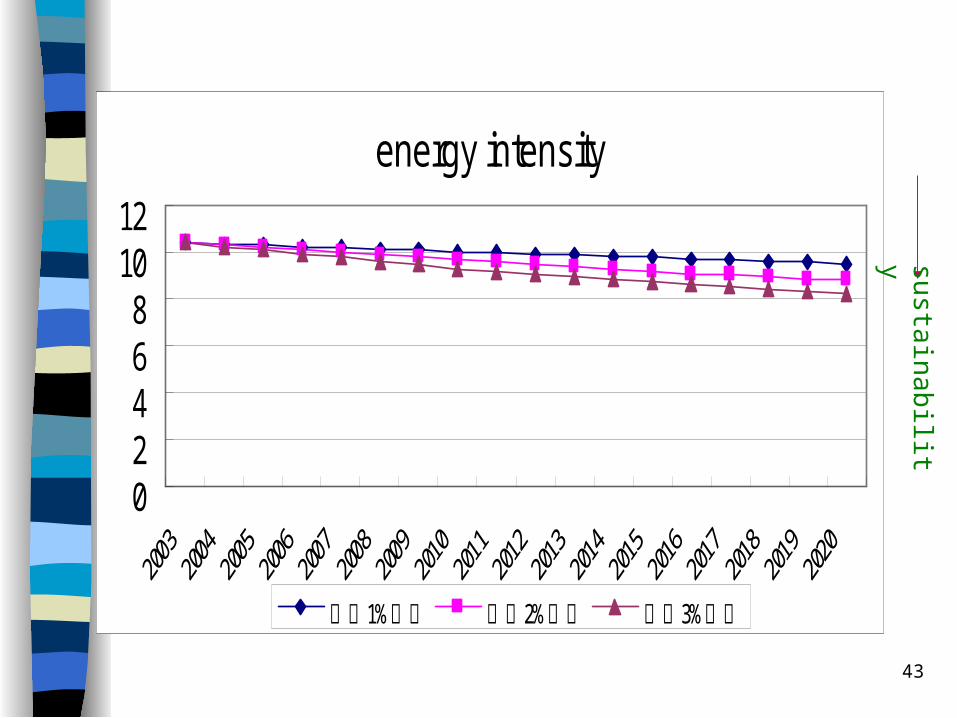
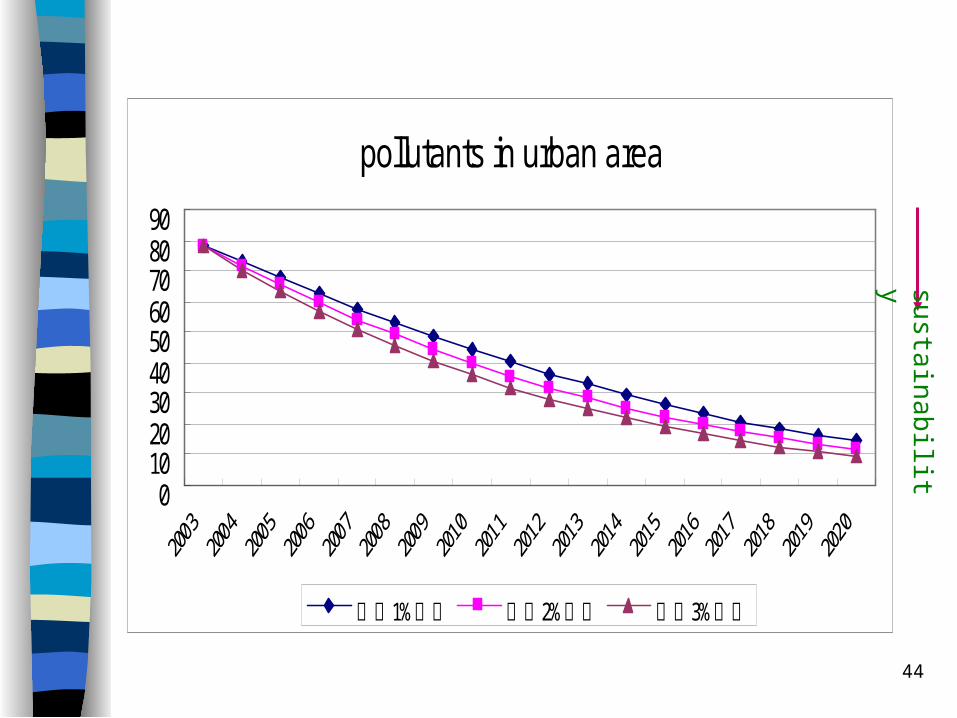
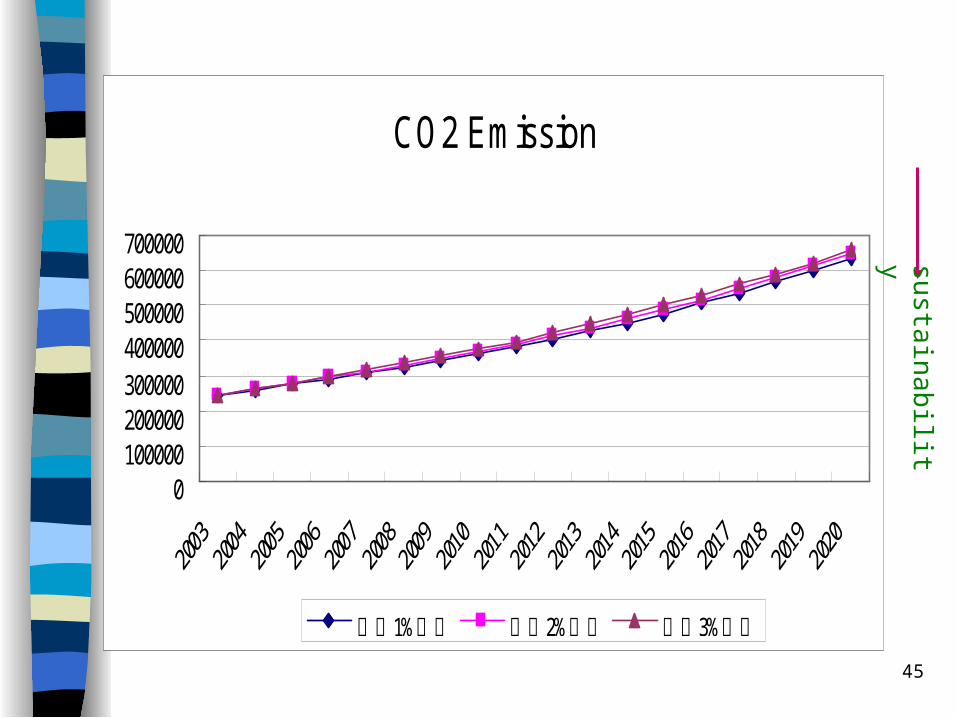
Policy Simulation: Energy Intensity Reduction (by energy intensive sector )(1%,2%,3%) ,and hold GDP per capita growth 4% as well
43
energy intensity
02468
1012
1%下降 預測 2%下降 預測 3%下降 預測
sustainab
ility
44
pollutants in urban area
0102030405060708090
1%下降 預測 2%下降 預測 3%下降 預測
sustainab
ility
45
CO2 Emission
0100000200000300000400000500000600000700000
1%下降 預測 2%下降 預測 3%下降 預測
sustainab
ility
46
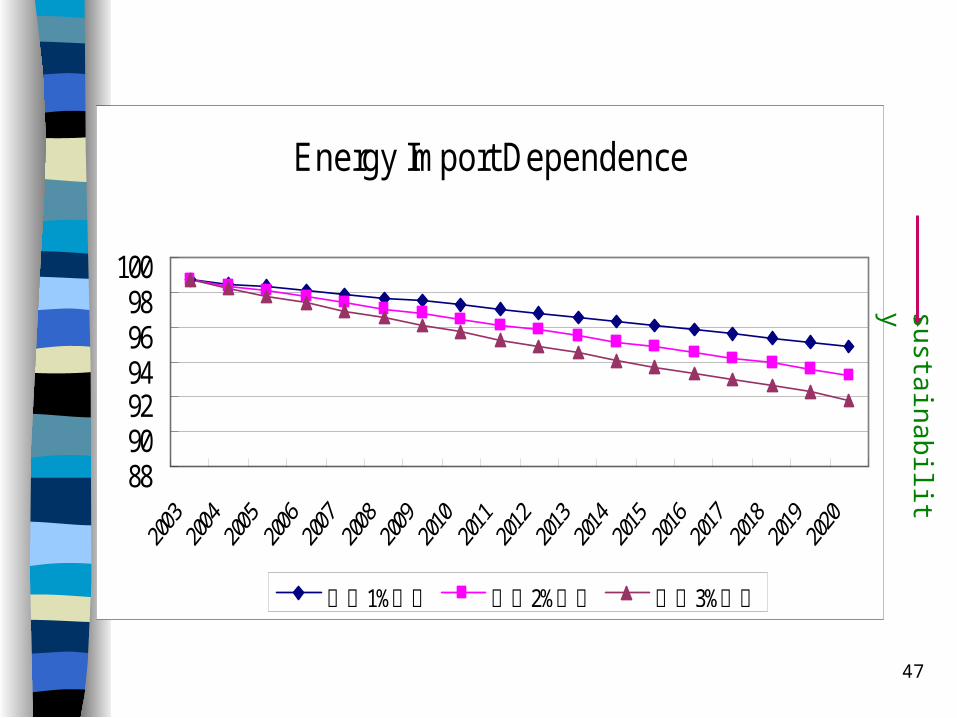
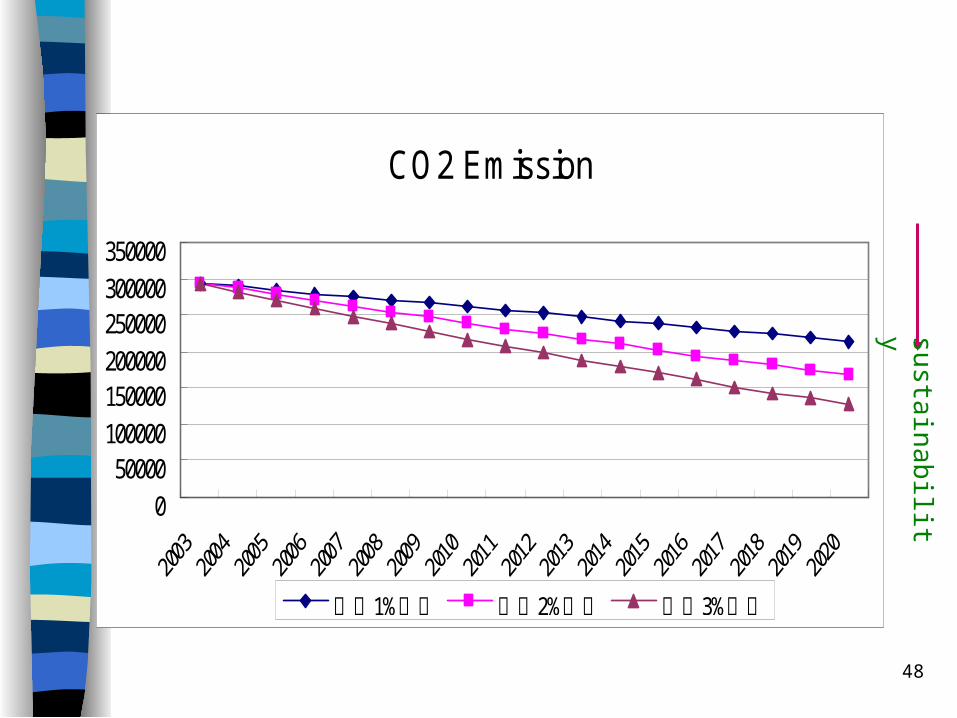
Policy Simulation: Energy per Capita Reduction (1%,2%,3%),and hold GDP per capita growth 4% as well
47
Energy Import Dependence
889092949698
100
1%下降 預測 2%下降 預測 3%下降 預測
sustainab
ility
48
CO2 Emission
050000
100000150000200000250000300000350000
1%下降 預測 2%下降 預測 3%下降 預測
sustainab
ility
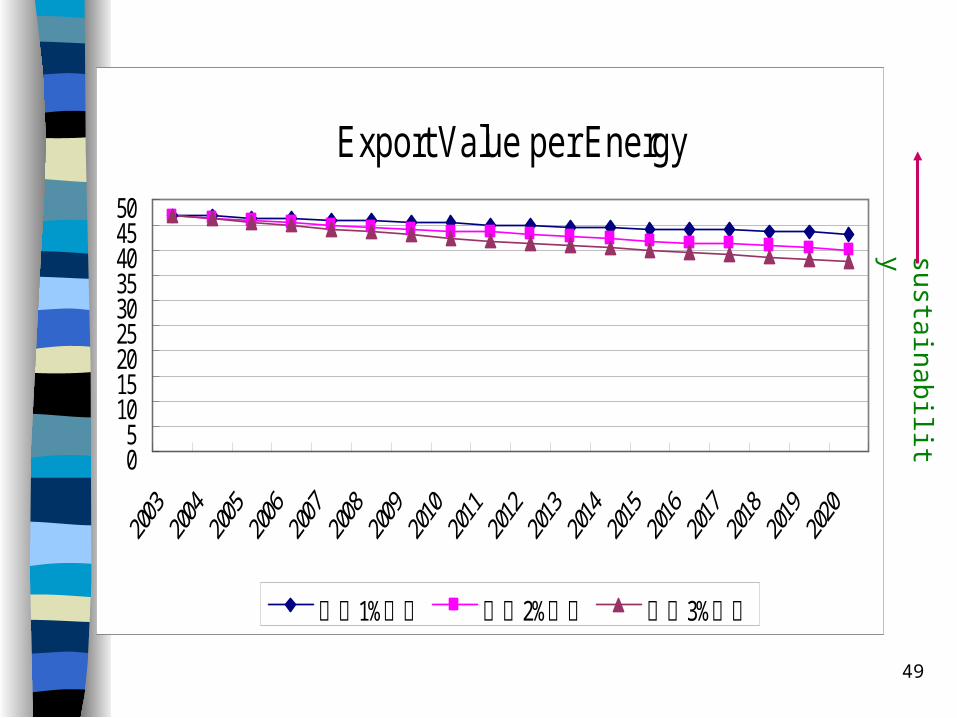
49
Export Value per Energy
05
101520253035404550
1%下降 預測 2%下降 預測 3%下降 預測
sustainab
ility
50
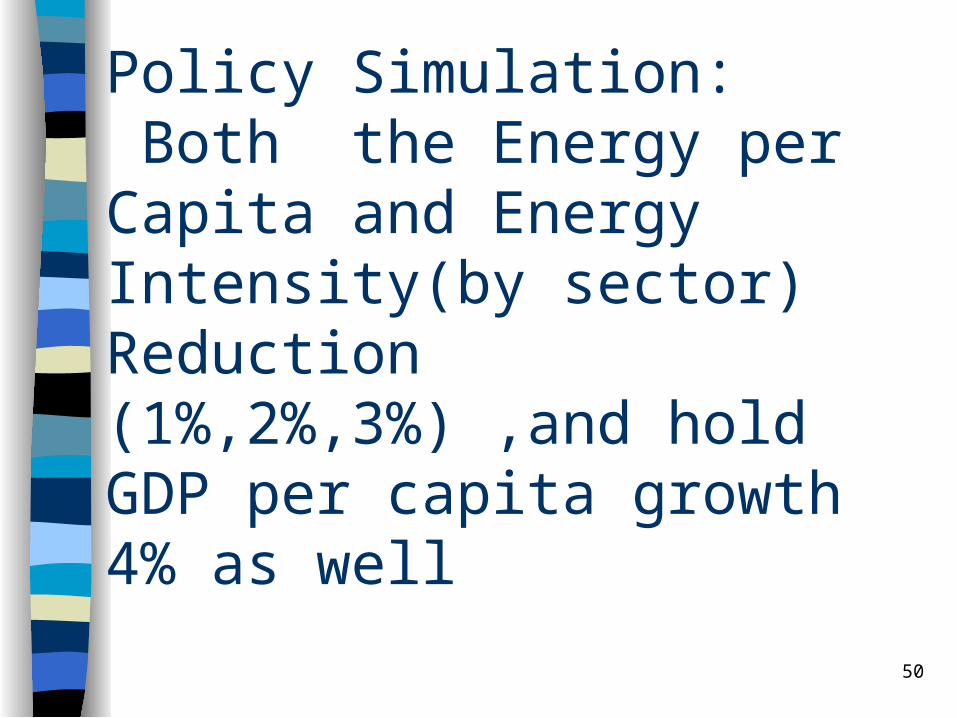
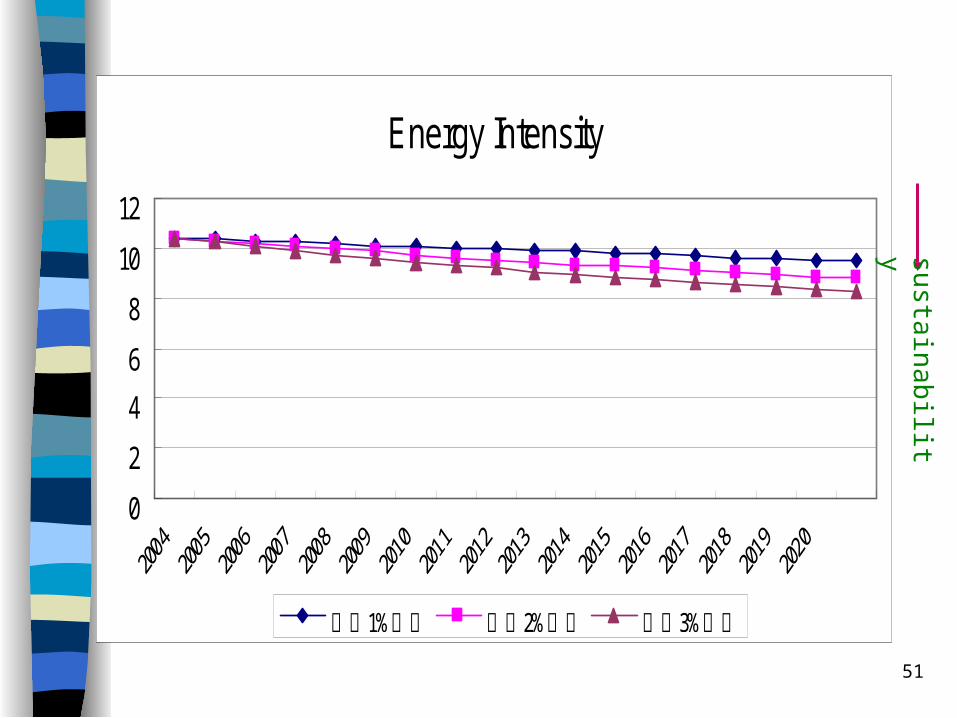
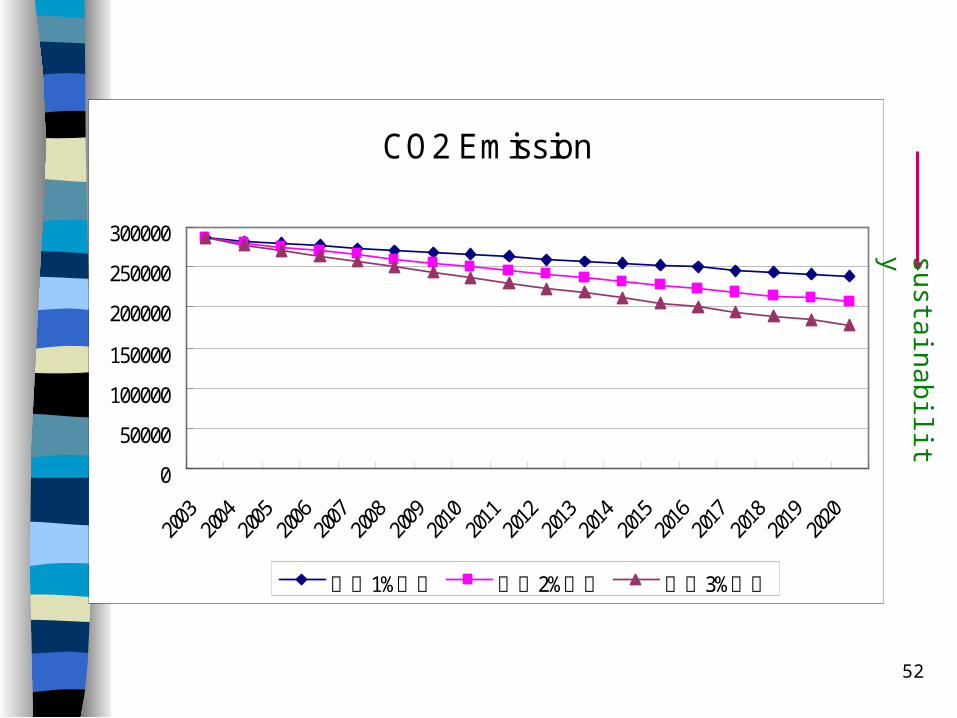
Policy Simulation: Both the Energy per Capita and Energy Intensity(by sector) Reduction (1%,2%,3%) ,and hold GDP per capita growth 4% as well
51
Energy Intensity
0
2
4
6
8
10
12
1%下降 預測 2%下降 預測 3%下降 預測
sustainab
ility
52
CO2 Emission
0
50000
100000
150000
200000
250000
300000
1%下降 預測 2%下降 預測 3%下降 預測
sustainab
ility
53
Conclusion
Sustainable Energy Development is the biggest priority of national sustainable development
Both energy policy and energy development are moving towards the sustainability pathway, but not on the path yet.
Enhancing green energy consumption is a policy priority in the future
54
Conclusion(Cont’)
TISED system regression model indicates that
1. Energy intensity,export value per energy,energy import dependence, excess energy supply and CO2 emissions will couple with GDP per capita growth
2. Pollutants in urban area will decouple with GDP per capita growth
55
Conclusion(Cont’)
Reduce both the energy intensity of energy intensive industry and energy per capita will improve energy intensity of economy-wide, air pollution, CO2 emissions, as well as energy import dependence, which are two of the key sustainable energy policies and measures in the future.

56
Thank You for Your Attention!