1 chemical identity - circabc - welcome · molecular structure nn ch3s n nhch2ch3 nhc(ch3)3 ......
TRANSCRIPT

Terbutryn EQS dossier 2011
1
TERBUTRYN
This EQS dossier was prepared by the Sub-Group on Review of the Priority Substances List (under Working Group E of the Common Implementation Strategy for the Water Framework Directive).
The dossier was reviewed by the Scientific Committee on Health and Environmental Risks (SCHER), which commented that it did not agree with the use of an additional assessment factor of 10 for the marine AA-QS and MAC-EQS. Reference has been made to the TGD-EQS to explain this use. Explanation has also been added regarding the non-use of a different endpoint to derive the marine MAC-QS.
1 CHEMICAL IDENTITY
Common name Terbutryn
Chemical name (IUPAC) 2-(Ethylamino)-4-(tert-butylamino)-6-(methylthio)-1,3,5-triazine
Synonym(s) N-(1,1-Dimethylethyl)-N'-ethyl-6-(methylthio)-1,3,5-triazine-2,4-diamine
Chemical class (when available/relevant) Triazine
CAS number 886-50-0
EU number 212-950-5
Molecular formula C10H19N5S
Molecular structure N N
NCH3S
NHCH2CH3
NHC(CH3)3
Molecular weight (g.mol-1) 241.36
2 EXISTING EVALUATIONS AND REGULATORY INFORMATION
Annex III EQS Dir. (2008/105/EC) Not Included
Existing Substances Reg. (793/93/EC) Not listed
Pesticides(91/414/EEC) Not included in Annex I
Biocides (98/8/EC)
In review for Annex I listing (RMS Slovakia; supported uses PT 7: Film preservatives, main use in paints; PT 9: Polymer preservatives, main use in sealing bands around windows; PT10: Masonry preservatives, main use in cement-based material)
PBT substances Does not fulfil PBT criteria
Substances of Very High Concern (1907/2006/EC) No
POPs (Stockholm convention) No

Terbutryn EQS dossier 2011
2
Other relevant chemical regulation (veterinary products, medicament, ...) Information / No
Endocrine disrupter Available information / Not investigated
Terbutryn EQS dossier 2011
3
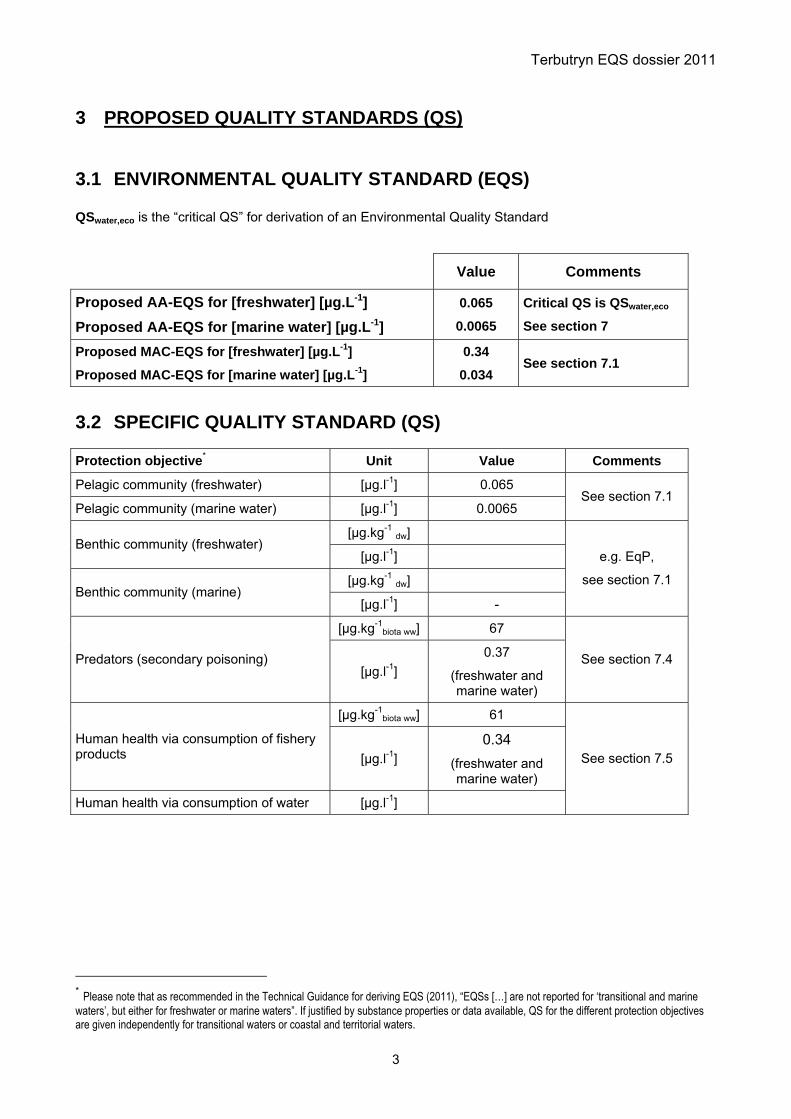
3 PROPOSED QUALITY STANDARDS (QS)
3.1 ENVIRONMENTAL QUALITY STANDARD (EQS)
QSwater,eco is the “critical QS” for derivation of an Environmental Quality Standard
Value Comments
Proposed AA-EQS for [freshwater] [µg.L-1] Proposed AA-EQS for [marine water] [µg.L-1]
0.065
0.0065
Critical QS is QSwater,eco
See section 7
Proposed MAC-EQS for [freshwater] [µg.L-1]
Proposed MAC-EQS for [marine water] [µg.L-1]
0.34
0.034 See section 7.1
3.2 SPECIFIC QUALITY STANDARD (QS)
Protection objective* Unit Value Comments
Pelagic community (freshwater) [µg.l-1] 0.065
Pelagic community (marine water) [µg.l-1] 0.0065 See section 7.1
[µg.kg-1 dw] Benthic community (freshwater)
[µg.l-1]
[µg.kg-1 dw] Benthic community (marine)
[µg.l-1] -
e.g. EqP,
see section 7.1
[µg.kg-1biota ww] 67
Predators (secondary poisoning) [µg.l-1]
0.37
(freshwater and marine water)
See section 7.4
[µg.kg-1biota ww] 61
Human health via consumption of fishery products [µg.l-1]
0.34 (freshwater and marine water)
Human health via consumption of water [µg.l-1]
See section 7.5
* Please note that as recommended in the Technical Guidance for deriving EQS (2011), “EQSs […] are not reported for ‘transitional and marine waters’, but either for freshwater or marine waters”. If justified by substance properties or data available, QS for the different protection objectives are given independently for transitional waters or coastal and territorial waters.

Terbutryn EQS dossier 2011
4
4 MAJOR USES AND ENVIRONMENTAL EMISSIONS
4.1 USES AND QUANTITIES
Terbutryn is a selective herbicide and a triazine compound. It is absorbed by the roots and foliage and acts as an inhibitor of photosynthesis ([http://pmep.cce.cornell.edu/profiles/extoxnet/pyrethrins-ziram/terbutryn-ext.html).
Terbutryn is no longer registered in the EU under Annex I of 91/414/EEC, but it still has biocidal uses.
4.2 ESTIMATED ENVIRONMENTAL EMISSIONS
No information available.
5 ENVIRONMENTAL BEHAVIOUR
5.1 ENVIRONMENTAL DISTRIBUTION
Master reference 25 - 58 mg.L-1 at 20°C HVBG, 2002
25 mg.L-1 at 20°C Industrieverband Agrar, 1990; BCPC, 1983; US EPA, 2008 Water solubility (mg.L-1)
22 mg.L-1 at 20°C Vogue et al., 1994; BCPC, 2002 Volatilisation
1.3 x 10⁻⁴ Pa at 20°C Industrieverband Agrar, 1990; Mensink and Linders, 1991
2.7 x 10⁻⁴ Pa at 20 °C Mensink and Linders, 1991 Vapour pressure (Pa)
6.3 x 10⁻⁴ Pa at 40 °C Mensink and Linders, 1991 Henry's Law constant (Pa.m3.mol-1) 1.5 x 10⁻³ (calculated) BPCP, 2002
Adsorption The mean measured Koc of 663 L.kg-1 (log Koc 2.8) is used for derivation of quality standards. 2000 PPDB, 2009 663 (average Kom 390 L.kg-1, range 195-880 L.kg-1, n=8) Mensink and Linders, 1991
Organic carbon – water partition coefficient (KOC) (L.kg-1)
609 (calculated) US EPA, 2008 Suspended matter – water partition coefficient(Ksusp-water)
log Kp,susp = 1.8
Bioaccumulation The BCF value of 181 L.kg-1 on fish is used for derivation of quality standards.
Octanol-water partition coefficient (Log Kow)
3.48 (experimental) 3.50 (estimated, ClogP) 3.65 3.74 (experimental) 3.77 (calculated)
BioLoom, 2006 Bioloom, 2006 PPDB, 2009 US EPA, 2008 US EPA, 2008
10-12 (see note below) Mensink and Linders, 1991 41 (calculated) US EPA, 2008
BCF
82 (calculated; upper trophic US EPA, 2008
Terbutryn EQS dossier 2011
5
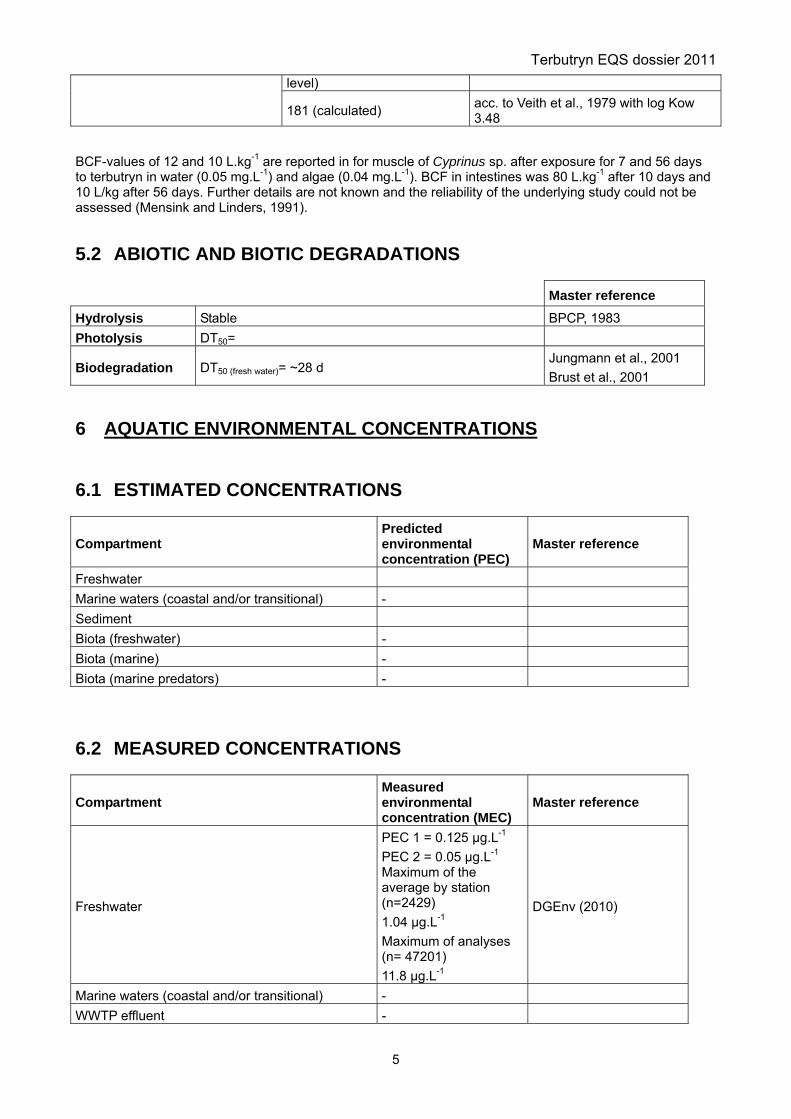
level)
181 (calculated) acc. to Veith et al., 1979 with log Kow 3.48
BCF-values of 12 and 10 L.kg-1 are reported in for muscle of Cyprinus sp. after exposure for 7 and 56 days to terbutryn in water (0.05 mg.L-1) and algae (0.04 mg.L-1). BCF in intestines was 80 L.kg-1 after 10 days and 10 L/kg after 56 days. Further details are not known and the reliability of the underlying study could not be assessed (Mensink and Linders, 1991).
5.2 ABIOTIC AND BIOTIC DEGRADATIONS
Master reference Hydrolysis Stable BPCP, 1983 Photolysis DT50=
Biodegradation DT50 (fresh water)= ~28 d Jungmann et al., 2001 Brust et al., 2001
6 AQUATIC ENVIRONMENTAL CONCENTRATIONS
6.1 ESTIMATED CONCENTRATIONS
Compartment Predicted environmental concentration (PEC)
Master reference
Freshwater Marine waters (coastal and/or transitional) - Sediment Biota (freshwater) - Biota (marine) - Biota (marine predators) -
6.2 MEASURED CONCENTRATIONS
Compartment Measured environmental concentration (MEC)
Master reference
Freshwater
PEC 1 = 0.125 µg.L-1 PEC 2 = 0.05 µg.L-1 Maximum of the average by station (n=2429) 1.04 µg.L-1 Maximum of analyses (n= 47201) 11.8 µg.L-1
DGEnv (2010)
Marine waters (coastal and/or transitional) - WWTP effluent -

Terbutryn EQS dossier 2011
6
PEC 1 = - PEC 2 = 25 µg.kgdw
-1 Maximum of the average by station (n=1086) 25 µg.kgdw
-1
DGEnv (2010)
Maximum of analyses (n=1786) 25 µg.kgdw
-1
DGEnv (2010)
Sediment
Biota
Biota (marine predators)
7 EFFECTS AND QUALITY STANDARDS
7.1 ACUTE AND CHRONIC AQUATIC ECOTOXICITY
Detailed toxicity data are presented in Annex I.
Several sources were used to retrieve ecotoxicity data. Syngenta provided original study reports on algae, daphnids, fish and aquatic macrophytes. The report of Mensink and Linders (1991) that was prepared for authorisation of terbutryn as plant protection product in the Netherlands was consulted, as well as the German report on water quality standards by Nendza (2003). The EPA ecotox database was searched for additional data, and references with potentially sensitive endpoints were retrieved where possible. In addition, the open literature was screened via SCOPUS, available via www.scopus.com. All studies were evaluated for their reliability in view of their use for quality standard derivation.
Chemical analysis of test concentrations is lacking in a lot of the (older) studies. Terbutryn is hydrolytically stable, degradation in water is relatively slow and the compound is not volatile. In addition, water solubility is relatively high and sorption relatively low. Stability of test concentrations was demonstrated in some tests and from this it may be concluded that endpoints based on nominal concentrations may be used. However, in one algae test there was a decline of test concentrations (Shabana and Abou-Waly, 1995). Rapid uptake of terbutryn by algae was demonstrated by Gonzalez-Barreiro et al. (2006) and Rioboo et al. (2007), and this may have caused a decline in concentrations during the test. From the data of Shabana and Abou-Waly (1995) there appears to be a trend towards a decreased decline in concentrations at higher test levels. It may be possible that uptake by algae, and thus depletion from the test medium, is reduced at higher exposure levels due to toxicity. This implies that decreasing test concentrations over time do not necessarily relate to inadequate exposure.
In view of the above, it was decided to accept endpoints based on nominal concentrations with Ri 2, if the other aspects of the study do not give rise to concern with respect to quality.

Terbutryn EQS dossier 2011
7
ACUTE EFFECTS Master reference
Bacteria (µg.L-1)
Marine Vibrio fischeri / 15 min. EC50: 13b bioluminescence
Gaggi et al., 1995
Anabaena flos-aqua / 7 d EC50: 3.4 dry weight
Mensink and Linders, 1991
Cyanobacteria (µg.L-1)
Freshwater Nostoc muscorum / 7 d EC50: 107a growth rate
Shabana and Abou-Waly, 1995
Chlorella vulgaris / 48 h EC50: 13b
growth rate Rioboo et al., 2002
Pseudokirchneriella subcapitata / 96 h EC50 : 3.4 growth ratea; geometric mean 3.3, 3.6
Grade, 1997; Okamura et al., 2000
Freshwater
Lemna gibba / 6 d EC50: 17.6 growth ratea; most relevant duration
Ward, 1982
Sediment Myriophyllum aquaticum / 14 d EC50: 2.0 mg.kgdw
-1 sediment Gonsior, 2009
Dunaliella tertiolecta / 96 h EC50 : 3.1 cell number
Gaggi et al., 1995
Algae & aquatic plants (µg.L-1)
Marine Skeletonema costatum / 9 d EC50: 0.91 dry weight
Mensink and Linders, 1995
Freshwater
Daphnia magna / 48 h EC50 : 5259 immobilisation/mortality; geometric mean 7100, 2660, 7700
Marchini et al., 1988; Vilkas, 1977; LeBlanc, 1982a
Marine Artemia salina / 24 h EC50: 22 immobilisation
Gaggi et al., 1995
Crustacea (µg.L-1)
Sediment no data available Oligochaeta (µg.L-1)
Freshwater Lumbriculus variegatus / 96 h LC50: 23700
Brust et al., 2001
Danio rerio / 96 h LC50: 5710
Plhalova et al., 2009
Lepomis macrochirus / 96 h LC50: 2720
Mayer and Ellersieck, 1987 Freshwater
Oncorhynchus mykiss / 96 h LC50 : 950 geometric mean 820, 1100
Mayer and Ellersieck, 1987; LeBlanc, 1982b
Fish (µg.L-1)
Marine no data available

Terbutryn EQS dossier 2011
8
a: growth rate is preferred if more endpoints are available for one species b: most sensitive endpoint or test duration CHRONIC EFFECTS Master reference
Cyanobacteria (µg.L-1)
Freshwater Nostoc muscorum / 7 d EC10: 35a growth rate
Shabana and Abou-Waly, 1995
Chlorella vulgaris / 48 h EC10: 11b
growth rate Rioboo et al., 2002
Pseudokirchneriella subcapitata / 96 h NOEC: 0.65 growth ratea
Grade, 1997 Freshwater
Lemna gibba / 6 d EC10: 6.3 growth ratea; most relevant duration
Ward, 1982
Sediment
Myriophyllum aquaticum / 14 d NOEC: 0.977 mg.kgdw
-1 sediment (corresponding pore water concentration 22 µg.L-1)
Gonsior, 2009
Algae & aquatic plants (µg.L-1)
Marine no data available
Freshwater Daphnia magna / 21d NOEC : 1300 mortality/reproduction
LeBlanc, 1982a
Marine no data available
Crustacea (µg.L-1)
Sediment no data available Danio rerio / 21 d NOEC: 200 length
Plhalova et al., 2009
Oncorhynchus mykiss / 21d NOEC : 150 mortality (see notes below)
Ritter, 1990 Freshwater
Pimephales promelas / 34 d NOEC: 840 ELS
Surprenant, 1987
Fish (µg.L-1)
Marine no data available a: growth rate is preferred if more endpoints are available for one species b: most sensitive endpoint or test duration In previous versions of this dossier, there was discussion on the validity of the NOEC for Oncorhynchus mykiss from the study by Ritter (1990). A NOEC of 9 µg.L-1was reported, as well as a NOEC of 0.15 mg.L-1. It was reported that INERIS (2009) considered this study not reliable. The study was reviewed again for the purpose of this dossier. The study was assigned Ri 2 because of fluctuations in the measured concentrations, but still considered reliable for QS-derivation. The previously used NOEC of 9 µg.L-1, however, is not taken forward, because this is based on clinical signs which are not necessarily related to population effects. Instead, the NOEC for mortality of 150 µg.L-1 is adopted.

Terbutryn EQS dossier 2011
9
7.2 OTHER STUDIES
Three (semi-)field studies are available in which the effects of terbutryn on algae and organisms depending on algae as a food source were studied. See Annex II for summaries and evaluation.
Brust et al. (2001) used indoor artificial streams to study the effects of terbutryn on aufwuchs (mainly periphytic algae Ulothrix sp. and Cladophora sp. and bacillariophyceae Achnanthes sp., Nitzschia sp.) and bacillariophyceae (Achnanthes sp., Nitzschia sp.) and detritivores (Lumbriculus variegatus) in a 72-days experiment. Effects on aufwuchs biomass were present at the lowest test concentration of 0.6 µg.L-1nominal. Initial measured concentrations at this test level were 0.43 µg.L-1. Effects on population growth of L. variegatus were present at the next higher concentration, this was considered to be a secondary effect due to food limitation. Concentrations gradually decreased with a DT50 of 28.2 days. Biomass increase in the control was exponential over 50 days, which is considered as the relevant period to express effects. Starting from 0.43 µg.L-1, the time-weighted average concentration over 50 days is 0.25 µg.L-1. The NOEC for aufwuchs is thus < 0.25 µg.L-1, the NOEC for population growth of L. variegatus is 0.25 µg.L-1.
Goldsborough and Robinson (1983) and Gurney and Robinson (1989) used field enclosures in a marsh on the southern end of Lake Manitoba, Canada, to study the effects of terbutryn on freshwater marsh periphyton. Both studies were consistent in showing effects on algae communities at a nominal initial test concentration of 10 µg.L-1. Actual concentrations over the full study are not known. Both studies have deficiencies in experimental set-up and/or reporting, the study of Goldsborough and Robinson (1983) can be used as supporting information.
In another non-standard study, Rioboo et al. (2007) studied population development of the rotifer Brachionus sp. after feeding with terbutryn-exposed algae. Chlorella vulgaris were exposed to 12.5, 100 and 500 nM terbutryn (3.0, 24 and 124 µg.L-1) for 24 hours, after which they were used as exclusive food source for Brachionus in a 5-days renewal test. After five days, rotifers were fed non-exposed algae for two days to study recovery. Algae removed 90% of the terbutryn from the exposure medium, while cell integrity was not affected. Population growth rate of Brachionus was significantly decreased and generation time significantly increased when fed algae exposed to 3.0 and 24 µg.L-1. Population growth was absent when fed on algae exposed to 124 µg.L-1, animals did not survive beyond four days. After returning to herbicide-free algae, recovery was observed in the 3.0 and 24 µg.L-1 treatments, but not in rotifers that had been fed algae exposed to 124 µg.L-1.
7.3 DERIVATION OF THE QS-WATER
There are too few data to perform a meaningful statistical comparison and there are no further indications (spread of the data, read-across, expert judgement) of a difference in sensitivity between freshwater and saltwater organisms. Therefore, the data sets may be combined for QS derivation.
7.3.1 MAC-QSfreshwater, eco For derivation of the MACfreshwater, eco, acute toxicity values are available for bacteria, cyanobacteria, algae, macrophyta, crustacea, oligochaeta and fish. The lowest endpoint is the EC50 of 0.91 µg.L-1. for Skeletonema costatum. The test duration of 9 days, however, is considered too long for derivation of the MAC-QSfreshwater,
eco. In addition, the endpoint dry weight is probably not representative of growth rate after prolonged testing. This also holds for the 7-days test with Anabaena flos-aquae. The 96-h EC50 of 3.1 µg.L-1 for cell number of the marine algal species Dunaliella tertiolecta is almost identical to the 72-h EC50 of 3.4 µg.L-1 for growth rate of the green algae Pseudokirchnerialla subcapitata; the latter is based on a study with a higher reliabiability index..Terbutryn is a herbicide and the potentially most sensitive species groups (algae, macrophyta) are represented in the dataset. The aquatic macrophyte Lemna gibba is less sensitive than algae. In addition, information from a sediment-spiked water/sediment study with the macrophyte Myriophyllum aquaticum was available. At the level of the NOEC (0.977 mg.kgdw
-1 sediment), corresponding pore water concentrations were 22 µg.L-1. This indicates that algae are indeed the most sensitive species group. Therefore, an assessment factor of 10 can be applied to the more reliable lowest endpoint (3.4 µg.L-1) and the MAC-QSfreshwater, eco is 0.34 µg.L-1. This value is a factor of 10 lower than the concentration that induced effects on Brachionus sp. fed on short-term exposed algae (Rioboo, 2007 ; see above).
7.3.2 MAC-QSsaltwater, eco Terbutryn is a herbicide and the potentially most sensitive species groups (algae, macrophyta) are represented in the dataset. There are, however, no acute data for additional typically marine species. The
Terbutryn EQS dossier 2011
10
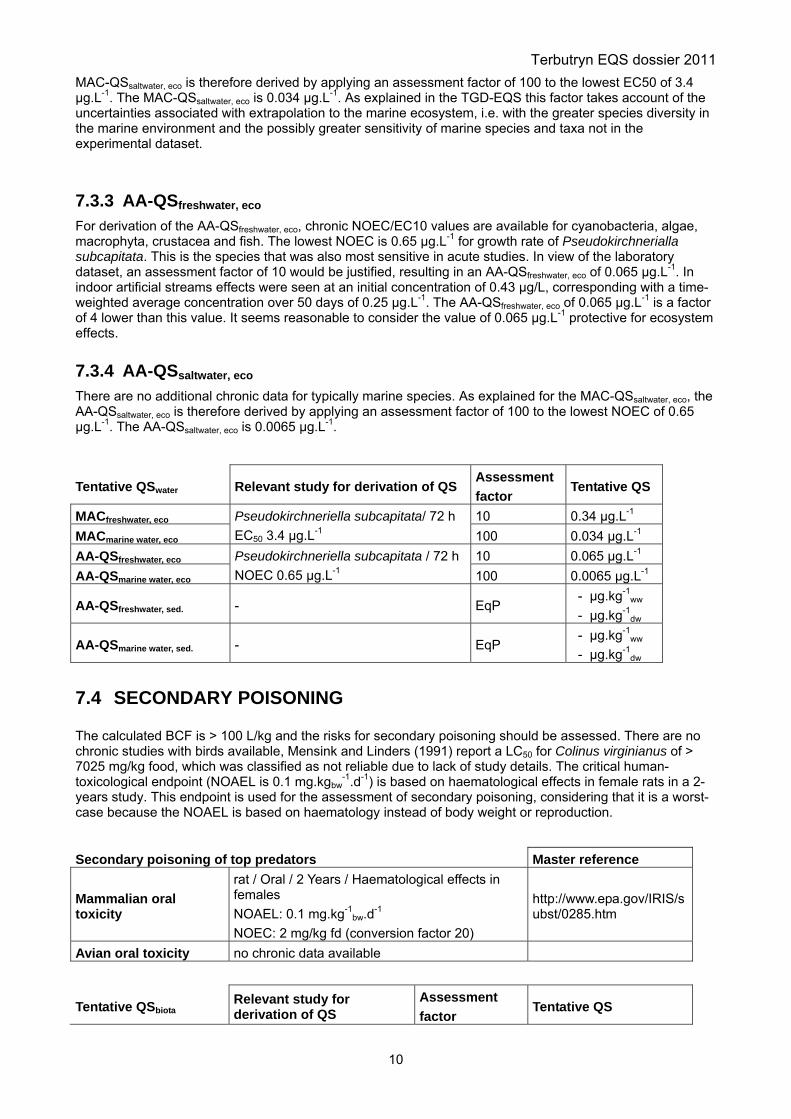
MAC-QSsaltwater, eco is therefore derived by applying an assessment factor of 100 to the lowest EC50 of 3.4 µg.L-1. The MAC-QSsaltwater, eco is 0.034 µg.L-1. As explained in the TGD-EQS this factor takes account of the uncertainties associated with extrapolation to the marine ecosystem, i.e. with the greater species diversity in the marine environment and the possibly greater sensitivity of marine species and taxa not in the experimental dataset.
7.3.3 AA-QSfreshwater, eco For derivation of the AA-QSfreshwater, eco, chronic NOEC/EC10 values are available for cyanobacteria, algae, macrophyta, crustacea and fish. The lowest NOEC is 0.65 µg.L-1 for growth rate of Pseudokirchnerialla subcapitata. This is the species that was also most sensitive in acute studies. In view of the laboratory dataset, an assessment factor of 10 would be justified, resulting in an AA-QSfreshwater, eco of 0.065 µg.L-1. In indoor artificial streams effects were seen at an initial concentration of 0.43 µg/L, corresponding with a time-weighted average concentration over 50 days of 0.25 µg.L-1. The AA-QSfreshwater, eco of 0.065 µg.L-1 is a factor of 4 lower than this value. It seems reasonable to consider the value of 0.065 µg.L-1 protective for ecosystem effects.
7.3.4 AA-QSsaltwater, eco There are no additional chronic data for typically marine species. As explained for the MAC-QSsaltwater, eco, the AA-QSsaltwater, eco is therefore derived by applying an assessment factor of 100 to the lowest NOEC of 0.65 µg.L-1. The AA-QSsaltwater, eco is 0.0065 µg.L-1.
Tentative QSwater Relevant study for derivation of QS Assessment factor
Tentative QS
MACfreshwater, eco 10 0.34 µg.L-1 MACmarine water, eco
Pseudokirchneriella subcapitata/ 72 h EC50 3.4 µg.L-1 100 0.034 µg.L-1
AA-QSfreshwater, eco 10 0.065 µg.L-1 AA-QSmarine water, eco
Pseudokirchneriella subcapitata / 72 h NOEC 0.65 µg.L-1 100 0.0065 µg.L-1
AA-QSfreshwater, sed. - EqP - µg.kg-1
ww - µg.kg-1
dw
AA-QSmarine water, sed. - EqP - µg.kg-1
ww - µg.kg-1
dw
7.4 SECONDARY POISONING
The calculated BCF is > 100 L/kg and the risks for secondary poisoning should be assessed. There are no chronic studies with birds available, Mensink and Linders (1991) report a LC50 for Colinus virginianus of > 7025 mg/kg food, which was classified as not reliable due to lack of study details. The critical human-toxicological endpoint (NOAEL is 0.1 mg.kgbw
-1.d-1) is based on haematological effects in female rats in a 2-years study. This endpoint is used for the assessment of secondary poisoning, considering that it is a worst-case because the NOAEL is based on haematology instead of body weight or reproduction.
Secondary poisoning of top predators Master reference
Mammalian oral toxicity
rat / Oral / 2 Years / Haematological effects in females NOAEL: 0.1 mg.kg-1
bw.d-1
NOEC: 2 mg/kg fd (conversion factor 20)
http://www.epa.gov/IRIS/subst/0285.htm
Avian oral toxicity no chronic data available
Tentative QSbiota Relevant study for derivation of QS
Assessment factor
Tentative QS

Terbutryn EQS dossier 2011
11
Biota NOEC: 2 mg.kg-1biota ww 30
67 µg.kg-1biota ww
corresponding to 0.37 µg.L-1 (freshwater/saltwater)
7.5 HUMAN HEALTH
Human health via consumption of fishery products Master reference
Mammalian oral toxicity
rat / Oral / 2 Years / Hematologic effects in females NOAEL : 0.1 mg.kg-1
bw.d-1 (RfD : 0.001 mg.kg-1
bw.d-1)
US EPA/IRIS (2010)
CMR no
Tentative QSbiota, hh Relevant study for derivation of QSbiota, hh
Assessment Factor
Tentative QSbiota, hh
Human health RfD: 1 µg.kg-1bw.d-1
61 µg.kg-1
biota ww
corresponding to 0.34 µg/L (BCF 181 L/kg)
Human health via consumption of drinking water Master reference Existing drinking water standard(s) 0.1 µg.L-1 (preferred regulatory standard) Directive 98/83/EC
Any guideline

Terbutryn EQS dossier 2011
12
8 BIBLIOGRAPHY, SOURCES AND SUPPORTIVE INFORMATION
This list also contains references that are included in Annex I from which endpoints are not taken forward for QS-derivation.
Abou-Waly H, Shabana EF. 1983. Recovery of Nostoc muscorum previously exposed to some triazine and phenylurea herbicides
BCPC. 1983. The Pesticide Manual. The British Crop Protection Council, UK.
BCPC. 2002. The e-Pesticide Manual, version 2.2. The British Crop Protection Council, UK.
BioByte. 2006. BioLoom [computer program]. version 1.0 (ClogP 4.0). Claremont, CA, USA: BioByte Corporation.
Brust K, Licht O, Hultsch V, Jungmann D, Nagel R. 2001. Effects of terbutryn on aufwuchs and Lumbriculus variegatus in artificial indoor streams. Environ Toxicol Chem 20, 2000-2007.
DGEnv. 2010. WISE, Substances factsheet of chemical pollutants : Terbutryn
European Commission (2011). TGD-EQS: Technical Guidance for deriving Environmental Quality Standards. Common Implementation Strategy for the Water Framework Directive Guidance Document No 27.
PPDB. 2009. The Pesticide Properties Database (PPDB) developed by the Agriculture & Environment Research Unit (AERU), University of Hertfordshire, funded by UK national sources and the EU-funded FOOTPRINT project (FP6-SSP-022704).
François DL, Robinson GGC. 1990. Indices of triazine toxicity in Chlamydomonas geitleri. Aquat Toxicol 16, 205-228.
Gaggi C, Sbrilli G, Hasab el Naby AM, Bucci M, Duccini M, Bacci E. 1995. Toxicity and hazard ranking of s-triazine herbicides using MICROTOX®, two green algal species and a marine crustacean. Environ. Toxicol. Chem., 14, 1065-1069.
Gonsior. 2009. Terbutryn - Growth Inhibition of Myriophyllum aquaticum in a Water/Sediment System. Niefern-Öschelbronn/Pforzheim, Germany: eurofins-GAB GmbH. Report nr. S09-00090. Data provided by Syngenta.
González-Barreiro O, Rioboo C, Herrero C, Cid A. 2006. Removal of triazine herbicides from freshwater systems using photosynthetic microorganisms. Environ Pollut 144, 266-271.
Goldsborough LG, Robinson GGC. 1983. The effect of two triazine herbicides on the productivity of freshwater marsh periphyton. Aquat Toxicol 4, 95-112.
Grade R. 1997. Growth inhibition test of GS 14260 tech. to green algae (Selenastrum capricornutum) under static conditions. Basle, Switzerland: Novartis Crop Protection. Project nr. 961714. Data provided by Syngenta.
Gurney SE, Robinson GGC. 1989. The influemce of two triazine herbicides on the productivity, biomass and community composition of freshwater marsh periphyton. Aquat Bot 36, 1-22.
Hernando MD, De Vettori S, Martinez Bueno MJ, Fernández-Alba AR. 2007. Toxicity evaluation with Vibrio fischeri test of organic chemicals used in aquaculture. Chemosphere 68, 724-730.
HVBG. 2002. GESTIS Gefahrstoffdatenbank. http://www.hvbg.de/. Hauptverband der gewerblichen Berufsgenossenschaften, Sankt Augustin, Germany
Industrieverband Agrar eV. 1990. Wirkstoffe in Pflanzenschutz- und Schädlingsbekämpfungsmitteln. BLV Verlagsgesellschaft, München, Germany.
INERIS. 2009 Implementation of requirements on Priority substances within the Context of the Water Framework Directive, Contract N° 07010401/2008/508122/ATA/D2, Prioritisation process: compilation of comments made from July 2008 till April 2009. INERIS - Institut national de l’environnement industriel et des risques (unpublished)
Jungmann D, Brust K, Hultsch V, Licht O, Mählmann J, Schmidt J, Nagel R. 2001. Stellenwert von Ökosystemtests bei der ökologischen Risikobewertung gefährlicher Stoffe in Oberflächengewässern. Teil II: Wirkung des Herbizides Terbutryn. Umweltbundesamt, Berlin, UBA-FB 000261/2.
Terbutryn EQS dossier 2011
13
Kosanke GJ, Schwippert WW, Beneke TW. 1988. The impairment of mobility and development in freshwater snails (Physa fontinalis and Lymnea stagnalis) caused by herbicides. Comp Biochem Physiol Vol 90C, 373-379.
LeBlanc GA. 1982a. Acute toxicity of terbutryn to the water flea (Daphnia magna). Wareham, USA : Springborn Life Sciences. Report nr. #BW-82-7-1241, submitted to Ciba-Geigy. Data provided by Syngenta.
LeBlanc GA. 1982b. The chronic toxicity of terbutryn technical to Rainbow trout (Salmo gairdneri). Wareham, USA : Springborn Life Sciences. Report nr. #BW-82-8-1241, submitted to Ciba-Geigy. Data provided by Syngenta.
Marchini S, Passerini L, Cesareo D, Tosato ML. 1988. Herbicidal triazines: Acute toxicity on daphnia, fish, and plants and analysis of its relationship with structural factors. Ecotox. Environ. Saf., 16, 148-157.
Mayer FL., Ellersieck MR. 1986. Manual of acute toxicity: Interpretation and data base for 410 chemicals and 66 species of freshwater animals. U.S. Department of the Interior Fish and Wildlife Service Resource Publication 160, Washington, DC.
Mensink H, Linders J. 1991. Adviesrapport 88/678801/171. Terbutryne (definitieve versie M-88). National institute of public health and environmental protection. Bilthoven, The Netherlands.
Nendza M. 2003. Entwicklung von Umweltqualitätsnormen zum Schutz aquatischer Biota in Oberflächengewässern. Luhnstedt, Germany: Analytisches Laboratorium für Umweltuntersuchungen und Auftragsforschung Bestimmung und Bewertung von Umweltdaten. Förderkennzeichen (UFOPLAN) 202 24 276
Okamura H, Aoyama I, Liu D, Maguire RJ, Pacepavicius GJ, Lau YL. 2000. Fate and toxicity of the new antifouling compound Irgarol 1051 in the aquatic environment. Wat Res 34, 3523-3530.
Plhalova L, Macova S, Haluzova I, Slaninova A, Delozelova P, Marsalek P, Pistekova V, Bedanova I, Voslarova E, Svobodova Z. 2009. Terbutryn toxicity to Danio rerio: effects of subchronic exposure on fish growth. Neuroendocrin Let 30 (suppl 1), 242-247.
Rioboo C, González, O, Herrero C, Cid A. 2002. Rioboo Physiological response of freshwater microalga (Chlorella vulgaris) to triazine and phenylurea herbicides. Aquat Toxicol 59, 225-235.
Rioboo C, Prado R, Herrero C, Cid A. 2007. Population growth study of the rotifer Brachionus sp. fed with triazine-exposed microalgae. Aquat Toxicol 83, 247-253.
Ritter. 1990. Terbutryn technical GS 14260: 21-day prolonged toxicity study in Rainbow trout under flow-through conditions. Itingen, Switzerland: RCC Umweltchemie. Project nr. 227237. Report submitted to Cina-Geigy. Data provided by Syngenta.
Shabana EF, Abou-Waly H. 1995. Growth and some physiological aspects of nostoc muscorum in response to mixtures of two triazine herbicides. Bull Environ Contam Toxicol 54, 273-280.
Surprenant DC. 1987. The toxicity of terbutryn technical to fathead minnow (Pimephales promelas) embryos and larvae. Wareham, USA : Springborn Life Sciences. Report nr. 87-10-2526, submitted to Ciba-Geigy. Data provided by Syngenta.
US EPA. 2008. EPI Suite™ [computer program]. version 4.0. Washington, DC, U.S.A.: U.S. Environmental Protection Agency (EPA) Office of Pollution Prevention Toxics and Syracuse Research Company (SRC).
US EPA. 2010. Integrated Risk Information System http://www.epa.gov/IRIS/subst/0285.htm
Vilkas AG. Acute toxicity of terbutryn FL 761552 to the water flea Daphnia magna straus. Tarrytown, USA : Union Carbide Environmental Services. Project nr. 11506-04-02. Data provided by Syngenta.
Vogue, P. A., Kerle, E. A., Jenkins, J. J. (1994). OSU Extension Pesticide Properties Database. http://ace.orst.edu/info/npic/ppdmove.htm
Ward S. 1982. The effect of terbutryn to duckweed, Lemna gibba. Pensacola, FL, USA: EG&G Bionomics. Report nr. BP-82-8-80, submitted to Ciba-Geigy. Data provided by Syngenta.

04/12/2011 Terbutryn_28sep10_NL.doc
14
Annex I. Detailed aquatic toxicity data
Legend to column headings A test water analysed Y(es)/N(o) Test type S(tatic), R(enewal), F(low through) Test compound a.s. = active substance Purity refers to purity of active substance or content of active in formulation Test water am = artificial medium; rw = reconstituted water; d(t)w = deionised/dechlorinated/distilled (tap)water; nw = natural water; tw = tap water T temperature Ri Reliability index according to Klimisch et al. (1997); asterisk indicates citation Reference see Section 8 of main report
Acute toxicity to freshwater organisms Species Species A Test Test Purity Test pH T Hardness Exp. Criterion Test Value Ri Notes Reference properties type compound water CaCO3 time endpoint [%] [°C] [mg/L] [mg/L] cyanobacteria Anabaena flos-aqua 6 d old culture,
2E4 cells/mL Y S terbutryn 96.6 am 24 7 d EC50 dry weight 3.4 2 1 Mensink and Linders, 1991
Nostoc muscorum S terbutryn 98 25 7 d EC50 chlorophyll a 5.16 2 2 Abou-Waly and Shabana, 1993 Nostoc muscorum Y S terbutryn 99.9 25 3 d EC50 growth rate 544 2 3 Shabana and Abou-Waly, 1995 Nostoc muscorum Y S terbutryn 99.9 25 7 d EC50 growth rate 107 2 3 Shabana and Abou-Waly, 1995 algae Chlamydomonas geitleri 4000 cells/mL N S terbutryn 99.9 am 23 EC50 growth rate 4.8 3 4 Francois and Robinson, 1990 Chlamydomonas geitleri 4000 cells/mL N S terbutryn 99.9 am 23 EC50 final yield 7.2 3 4 Francois and Robinson, 1990 Chlorella vulgaris 3 d old culture;
9E6 cells/mL N S terbutryn ag am 18 48 h EC50 growth rate 13 2 5 Rioboo et al., 2002
Chlorella vulgaris 3 d old culture; 9E6 cells/mL
N S terbutryn ag am 18 96 h EC50 growth rate 23 2 5 Rioboo et al., 2002
Chlorella vulgaris 3 d old culture; 9E6 cells/mL
N S terbutryn ag am 18 24 h EC50 growth rate < 6 2 6 Gonzalez-Barreiro et al., 2006
Pseudokirchneriella subcapitata
Y S terbutryn rw 7.7 100 96 h EC50 biomass 2.7 2 7 Gaggi et al., 1995
Pseudokirchneriella subcapitata
1E4 cells/mL N S terbutryn 98 am 25 72 h EC50 growth rate 3.3 2 8 Okamura et al., 2000
Pseudokirchneriella subcapitata
1E4 cells/mL N S terbutryn 98 am 25 72 h EC50 biomass 2.0 2 8 Okamura et al., 2000
Pseudokirchneriella subcapitata
10800 cells/mL Y S terbutryn 97.4 rw 7.9-8.0 23 30.3 72 h EC50 growth rate 3.6 1 9 Grade, 1997
Pseudokirchneriella subcapitata
10800 cells/mL Y S terbutryn 97.4 rw 7.9-8.0 23 30.3 72 h EC50 biomass 1.7 1 9 Grade, 1997
Pseudokirchneriella subcapitata
5 d old culture, 2E4 cells/mL
Y S terbutryn 96.6 am 24 7 d EC50 dry weight 13.1 2 1 Mensink and Linders, 1991

04/12/2011 Terbutryn_28sep10_NL.doc
15
Species Species A Test Test Purity Test pH T Hardness Exp. Criterion Test Value Ri Notes Reference properties type compound water CaCO3 time endpoint [%] [°C] [mg/L] [mg/L] Synechococcus elongatus
3 d old culture; 9E6 cells/mL
N S terbutryn ag am 18 24 h EC50 growth rate 3.3 3 10 Gonzalez-Barreiro et al., 2006
crustacea Daphnia magna < 24 h old N S terbutryn ≥ 96 dtw 8.4 21 250 48 h EC50 immobilisation 7100 2 11 Marchini et al., 1988 Daphnia magna < 20 h old N S terbutryn nw 7.6 17 36 48 h LC50 mortality 2660 2 12 Vilkas, 1977 Daphnia magna < 20 h old N S terbutryn ag nw 7.6 17 36 48 h LC50 mortality 2700 2* 13 Mensink and Linders, 1991 Daphnia magna terbutryn 48 h LC50 mortality 2660 2* 14 PPDB, 2009 Daphnia magna < 24 h old N S terbutryn 94 rw 7.9-8.3 22 160 48 h LC50 mortality 7700 2 15 LeBlanc, 1982a Daphnia magna < 24 h old N S terbutryn 94 nw 7.9-8.3 22 160 48 h LC50 mortality 7700 2* 16 Mensink and Linders, 1991 oligochaeta Lumbriculus variegatus N S terbutryn 98.8 rw 96 h LC50 mortality 23700 2 17 Brust et al., 2000 Lumbriculus variegatus N S terbutryn 98.8 rw 96 h EC50 deformation 16500 2 17 Brust et al., 2000 macrohpyta Lemna gibba Y S terbutryn 96.6 am 24 14 d EC50 frond production 16 3 18 Ward, 1982 Lemna gibba Y S terbutryn 96.6 am 24 6 d EC50 growth rate 17.6 2 18,19 Ward, 1982 Lemna gibba Y S terbutryn 96.6 am 24 12 d EC50 growth rate 15.9 2 18,19 Ward, 1982 Lemna gibba Y S terbutryn 96.6 am 24 14 d EC50 growth rate 15.8 3 18,19 Ward, 1982 pisces Carassius auratus terbutryn 96 h LC50 mortality 1400 4 14 BCPC, 2002 Carassius auratus terbutryn 96 h LC50 mortality 1400 4* 14 Nendza, 2003 Danio rerio juv. 30 mm, 0.3 g N R terbutryn 8.1-8.5 23 96 h LC50 mortality 5710 2 20 Plhalova et al., 2009 Lepomis macrochirus terbutryn 96 h LC50 mortality 1300 4 14 BCPC, 2002 Lepomis macrochirus terbutryn 96 h LC50 mortality 1300 4 14 Nendza, 2003 Lepomis macrochirus 1.3 g N S terbutryn 80 7.1 18 44 96 h LC50 mortality 2720 2 21 Mayer & Ellersieck, 1986 Lepomis macrochirus terbutryn 96 h LC50 mortality 4000 4 14 BCPC, 1983 Lepomis macrochirus N S product 80 nw 96 h LC50 mortality 4500 3 22 Mensink and Linders, 1991 Oncorhynchus mykiss 0.8 g N S terbutryn 80 7.1 13 44 96 h LC50 mortality 820 2 21 Mayer & Ellersieck, 1986 Oncorhynchus mykiss 0.65 g, 43 mm Y S terbutryn 96.6 rw 7.8 12 46 96 h LC50 mortality 1100 2 23 LeBlanc, 1982b Oncorhynchus mykiss terbutryn 96 h LC50 mortality 1100 4* 14 Nendza, 2003 Oncorhynchus mykiss terbutryn 96 h LC50 mortality 1100 4* 14 PPDB, 2009 Oncorhynchus mykiss terbutryn 96 h LC50 mortality 1100 4* 14 BCPC, 2002 Oncorhynchus mykiss terbutryn 96 h LC50 mortality 1800 4 14 BCPC, 1983 Oncorhynchus mykiss N S product 80 nw 96 h LC50 mortality 3500 3 24 Mensink and Linders, 1991
NOTES 1 solvent acetone, solvent control included; reported source could not be checked, details from summary; dry weight probably not considered representative for growth rate after prolonged testing 2 endpoint recalculated from reported data;tablehead refers to "applied measured concentrations", but the methods section does not refer to analytical measurements 3 endpoint recalculated from reported data; based on nominal concentrations; measured concentrations on t=7 were 23-49% of nominal; growth rate based on chlorophyll a content 4 endpoint based on nominal concentrations; solvent methanol (max. 0.05%), solvent control included; test duration not clear; reported as 3 days in EPA ecotox database; text states that growth curves were made from 6-12
datapoints, with 2 cell counts daily duration could be 3-6 days; read from figure: <10% effect at 0.01 µM 5 endpoint recalculated from reported data; endpoint based on nominal concentrations; solvent methanol (max. 0.05%), solvent control included 6 endpoint based on nominal concentrations; solvent methanol (max. 0.05%), solvent control included; 60% effect at lowest test concentration; no growth at 6 µg/L and higher; only three concentrations tested 7 solvent acetone (0.5 mg/L), solvent control included;stability of test compound confirmed in preliminary 96 h algal test; endpoint based on nominal concentrations 8 endpoint based on nominal concentrations; solvent DMSO 9 measured concentration at start and end >80% of nominal, except for 3 samples; endpoint based on mean measured 10 endpoint recalculated from reported data; endpoint based on nominal concentrations; solvent methanol (max. 0.05%), solvent control included; only 3 concentrations tested 11 according to OECD 202; stock analysed 12 endpoint based on nominal concentrations; solvent acetone, solvent control included 13 endpoint based on nominal concentrations; solvent acetone, solvent control included; remark by authors that LC50 is approximate value most likely refers to 24 h value (> 5.6 mg/L) 14 (primary) source unknown 15 endpoint based on nominal concentrations; solvent DMF (max. 0.5 mL/L), solvent control included 16 endpoint based on nominal concentrations; solvent DMF 17 endpoint based on nominal concentrations; tested in multiwell plates

04/12/2011 Terbutryn_28sep10_NL.doc
16
18 endpoint recalculated from reported data; solvent acetone (10 µL/L), solvent control included; initial measured concentrations 87-92% of nominal; endpoint based on initial measured; frond production at 9.1 µg/L is inhibited by 8-34% as compared to solvent control during days 0-12, stimulation by 10% after 14 days; this indicates recovery between 12- and 14 days; final frond number is therefore not appropriate and growth rate should be used
19 duration of Lemna test according to OECD 221 is 7 days; average specific growth rate in solvent control over 0-6 days is 0.26 (doubling time 2.7 days), which is close to validity criterion of OECD 221 (0.275/d; 2.5 days); control growth rate over 0-9 and 0-12 days is lower (3.2-3.0/d); recalculcated EC50 for growth rate over 0-6 days is considered to be most appropriate endpoint from this study
20 endpoint based on nominal concentrations; solvent DMSO (0.1%), solvent control included; according to OECD 203; test concentrations reported as 82-88% of measured initial; author confirmed that mean measured were >80% of nominal (pers. comm. L. Plhalova, 23-06-2010)
21 endpoint based on nominal concentrations 22 endpoint based on nominal concentrations; classified as not reliable by Mensink and Linders, 1991; reported source could not be checked, details from summary 23 solvent DMF (max. 0.5 mL/L), solvent control included; concentrations measured at t=0 are 62-72% of nominal, procedural recovey average 80% (71-92%); endpoint based on initial measured 24 endpoint based on nominal concentrations; reported source could not be checked, details from summary
Acute toxicity to marine organisms Species Species A Test type Test Purity Test pH T Salinity Exp. Criterion Test Value Ri Notes Ref properties compound water time endpoint [%] [°C] [‰] [mg as/L] bacteria Vibrio fischeri Y S terbutryn 15 15 min EC50 bioluminescence 13 2 1 Gaggi et al, 1995 Vibrio fischeri N S terbutryn ag 15 5 min EC50 bioluminescence > 6800 2 2 Hernando et al., 2007 Vibrio fischeri N S terbutryn ag 15 15 min EC50 bioluminescence > 6800 2 2 Hernando et al., 2007 Vibrio fischeri N S terbutryn ag 15 30 min EC50 bioluminescence > 6800 2 2 Hernando et al., 2007 algae Dunaliella tertiolecta Y S terbutryn nw 96 h EC50 cell number 3.1 2 3 Gaggi et al, 1995 Skeletonema costatum 5 d old culture, 2E4 cells/mL Y S terbutryn 96.6 am 20 9 d EC50 dry weight 0.91 2 4 Mensink and Linders, 1991 crustacea Americamysis bahia Y S terbutryn 96 h EC50 mortality 740 4 5 Nendza, 2003 Artemia salina 2-3rd instar larvae Y S terbutryn 25 24 h EC50 immobilisation 22 2 6 Gaggi et al, 1995
NOTES 1 Microtox test; solvent acetone (0.5 mg/L), solvent control included; endpoint based on nominal concentrations; stability of test compound confirmed in preliminary 96 h algal test 2 Microtox test; endpoint based on nominal concentrations; solvent DMSO (2%), solvent control included 3 solvent acetone (0.5 mg/L), solvent control included; endpoint based on nominal concentrations; stability of test compound confirmed in preliminary 96 h algal test
4 solvent methanol (max. 0.05%), solvent control included; solvent acetone, solvent control included; endpoint based on measured concentrations; reported source could not be checked, details from summary; dry weight probably not considered representative for growth rate after prolonged testing
5 primary source unknown; Ri 1 according to German ETOX-database 6 Artoxkit test; solvent acetone (0.5 mg/L), solvent control included; endpoint based on nominal concentrations; stability of test compound confirmed in preliminary 96 h algal test;
Chronic toxicity to freshwater organisms Species Species A Test Test Purity Test pH T Hardness Exp. Criterion Test Value Ri Notes Reference properties type compound water CaCO3 time endpoint [%] [°C] [mg/L] [mg/L] cyanobacteria Nostoc muscorum log-phase S terbutryn 98 am 25 7 d EC10 chlorophyll a after 7 d 0.17 2 1 Abou-Waly and Shabana,
1993 Nostoc muscorum Y S terbutryn 99.9 am 25 3 d EC10 growth rate 321 2 2 Shabana and Abou-Waly,
1995 Nostoc muscorum Y S terbutryn 99.9 am 25 7 d EC10 growth rate 35 2 2 Shabana and Abou-Waly,
1995 algae Chlamydomonas geitleri
4000 cells/mL N S terbutryn 99.9 am 23 NOEC growth rate 2.4 3 3 Francois and Robinson, 1990

04/12/2011 Terbutryn_28sep10_NL.doc
17
Species Species A Test Test Purity Test pH T Hardness Exp. Criterion Test Value Ri Notes Reference properties type compound water CaCO3 time endpoint [%] [°C] [mg/L] [mg/L] Chlamydomonas geitleri
4000 cells/mL N S terbutryn 99.9 am 23 NOEC final yield 2.4 3 3 Francois and Robinson, 1990
Chlorella vulgaris 3 d old culture; 9E6 cells/mL
N S terbutryn ag am 18 48 h EC10 growth rate 11 2 4 Rioboo et al., 2002
Chlorella vulgaris 3 d old culture; 9E6 cells/mL
N S terbutryn ag am 18 96 h EC10 growth rate 16 2 4 Rioboo et al., 2002
Pseudokirchneriella subcapitata
10800 cells/mL Y S terbutryn 97.4 rw 7.9-8.0 23 30.3 72 h NOEC growth rate 0.65 1 5 Grade, 1997
Pseudokirchneriella subcapitata
10800 cells/mL Y S terbutryn 97.4 rw 7.9-8.0 23 30.3 72 h NOEC biomass 0.4 1 5 Grade, 1997
Synechococcus elongatus
3 d old culture; 9E6 cells/mL
N S terbutryn ag am 18 24 h NOEC growth rate < 6.0 2 6 Gonzalez-Barreiro et al., 2006
macrohpyta Lemna gibba Y S terbutryn 96.6 am 24 14 d EC10 frond production 15 3 7 Ward, 1982 Lemna gibba Y S terbutryn 96.6 am 24 6 d EC10 growth rate 6.3 2 7,8 Ward, 1982 Lemna gibba Y S terbutryn 96.6 am 24 12 d EC10 growth rate 7.0 2 7,8 Ward, 1982 Lemna gibba Y S terbutryn 96.6 am 24 14 d EC10 growth rate 12.5 3 7,8 Ward, 1982 crustacea Daphnia magna Y F terbutryn 94 rw 7.9-8.3 22 160 21 d NOEC mortality 1300 1 9 LeBlanc, 1982a Daphnia magna Y R terbutryn 94 nw 7.9-8.3 22 160 21 d NOEC mortality 1300 1* 10 Mensink and Linders, 1991 Daphnia magna Y R terbutryn 21 d NOEC mortality 1300 1* 11 Nendza, 2003 mollusca Lymnea stagnalis eggs, < 24 h N S terbutryn ag 9 d LC100 mortality 2400 3 12 Kosanke et al., 1988 pisces Danio rerio juv. 20 d, 9 mg Y R terbutryn 8.0-8.5 23 28 d NOEC length 200 2 13 Plhalova et al., 2009 Oncorhynchus mykiss 0.6 g, 39 mm; 0.1 g/L Y F terbutryn 100 tw 7.1-8.2 14.5-16 21 d NOEC clinical signs 9 2 14,15 Ritter, 1990 Oncorhynchus mykiss 0.6 g, 39 mm; 0.1 g/L Y F terbutryn 100 tw 7.1-8.2 14.5-16 21 d NOEC mortality 150 2 14 Ritter, 1990 Oncorhynchus mykiss 0.6 g, 39 mm; 0.1 g/L Y F terbutryn 100 tw 7.1-8.2 14.5-16 21 d NOEC length, weight ≥ 600 2 14 Ritter, 1990 Oncorhynchus mykiss F 21 d NOEC sublethal effects 9 4* 11 Nendza, 2003 Pimephales promelas fertilised eggs Y F terbutryn 97.3 nw 7 25 26-36 34 d NOEC growth 840 1 16 Surprenant, 1987
NOTES 1 endpoint recalculated from reported data; tablehead refers to "applied measured concentrations", but the methods section does not refer to analytical measurements 2 endpoint recalculated from reported data; based on nominal concentrations; measured concentrations on t=7 were 23-49% of nominal; growth rate based on chlorophyll a content 3 endpoint based on nominal concentrations; solvent methanol (max. 0.05%), solvent control included; test duration not clear; reported as 3 days in EPA ecotox database; text states that growth curves were made from 6-12
datapoints, with 2 cell counts daily duration could be 3-6 days; read from figure: <10% effect at 0.01 µM 4 endpoint recalculated from reported data; endpoint based on nominal concentrations; solvent methanol (max. 0.05%), solvent control included 5 measured concentration at start and end >80% of nominal, except for 3 samples; endpoint based on mean measured 6 endpoint based on nominal concentrations; solvent methanol (max. 0.05%), solvent control included; 60% effect at lowest test concentration; only three concentrations tested, not possible to calculate reliable EC10 7 endpoint recalculated from reported data; solvent acetone (10 µL/L), solvent control included; initial measured concentrations 87-92% of nominal; endpoint based on initial measured; frond production at 9.1 µg/L is inhibited by
8-34% as compared to solvent control during days 0-12, stimulation by 10% after 14 days; this indicates recovery between 12- and 14 days; final frond number is therefore not appropriate and growth rate should be used 8 duration of Lemna test according to OECD 221 is 7 days; average specific growth rate in solvent control over 0-6 days is 0.26 (doubling time 2.7 days), which is close to validity criterion of OECD 221 (0.275/d; 2.5 days);
control growth rate over 0-9 and 0-12 days is lower (3.2-3.0/d); recalculcated EC50 for growth rate over 0-6 days is considered to be most appropriate endpoint from this study 9 solvent DMF (16 µL/L), solvent control included; mean measured concentrations 48-74% of nominal, endpoint based on mean measured 10 reported source could not be checked, details from summary; authors report endpoint as MATC, this should read NOEC 11 primary source unknown; Ri 1 according to German ETOX-database 12 endpoint based on nominal concentrations; details on test system and conditions not reported 13 endpoint based on nominal concentrations; solvent DMSO (0.1%), solvent control included; according to OECD 215; test concentrations reported as 82-88% of measured initial; author confirmed that mean measured were
>80% of nominal (pers. comm. L. Plhalova, 23-06-2010)
14 endpoint based on nominal concentrations; solvent Tween (0.001%), solvent control included; analysis of samples from 0.009, 0.015 and 2.4 mg/L on day 0, 12 and 21; 68-106% of nominal at t=0, 90-92% at t=12 and 98/134% at t=21, overall average 95% of nominal
15 clinical signs at 0.15 mg/L: hypoactivity 30-50%, remaining at bottom/top of tank 10-30%; clinical signs are not considered appropriate endpoint for EQS-derivation 16 solvent acetone 99 uL/L, solvent control included; measured concentrations 80-85% of nominal; endpoint based on measured concentrations

04/12/2011 Terbutryn_28sep10_NL.doc
18

04/12/2011 Terbutryn_28sep10_NL.doc
19
Annex II. Summary of non-standard studies
Reference Brust K, Licht O, Hultsch V, Jungmann D, Nagel R. 2001. Effects of terbutryn on aufwuchs and Lumbriculus variegatus in artificial indoor streams. Environ Toxicol Chem 20, 2000-2007.
Species; Population; Community
algae, Lumbriculus variegatus
Test Method indoor artificial stream System properties 3.7 m long, flow rate 0.2 m/s Compound terbutryn 98.8% pure Exposure regime 0, 0.6, 6, 60 and 600 µg/L Analysed Yes Temperature [°C] 14-14.5 pH range 8.4-8.5 Hardness [mg CaCO3/L]
Not reported
Exposure time single Criterion NOEC Test endpoint biomass of aufwuchs (periphytic algae, bacteria, fungi) Value [µg/L] < 0.25 µg/L (50-d TWA at 0.6 µg/L nominal; 0.43 µg/L measured initial) GLP No Guideline No Notes This study is most likely the same experiment as referred to in Nendza,
2003 as Jungmann, D., Brust, K., Hultsch, V., Licht, O., Mählmann, J., Schmidt, J., Nagel, R. (2001). Stellenwert von Ökosystemtests bei der ökologischen Risikobewertung gefährlicher Stoffe in Oberflächengewässern. Teil II: Wirkung des Herbizides Terbutryn. Umweltbundesamt, Berlin, UBA-FB 000261/2.e
Ri 2
Description Experimental system
Artificial indoor streams were set-up in a greenhouse 20 days before application.
04/12/2011 Terbutryn_28sep10_NL.doc
20
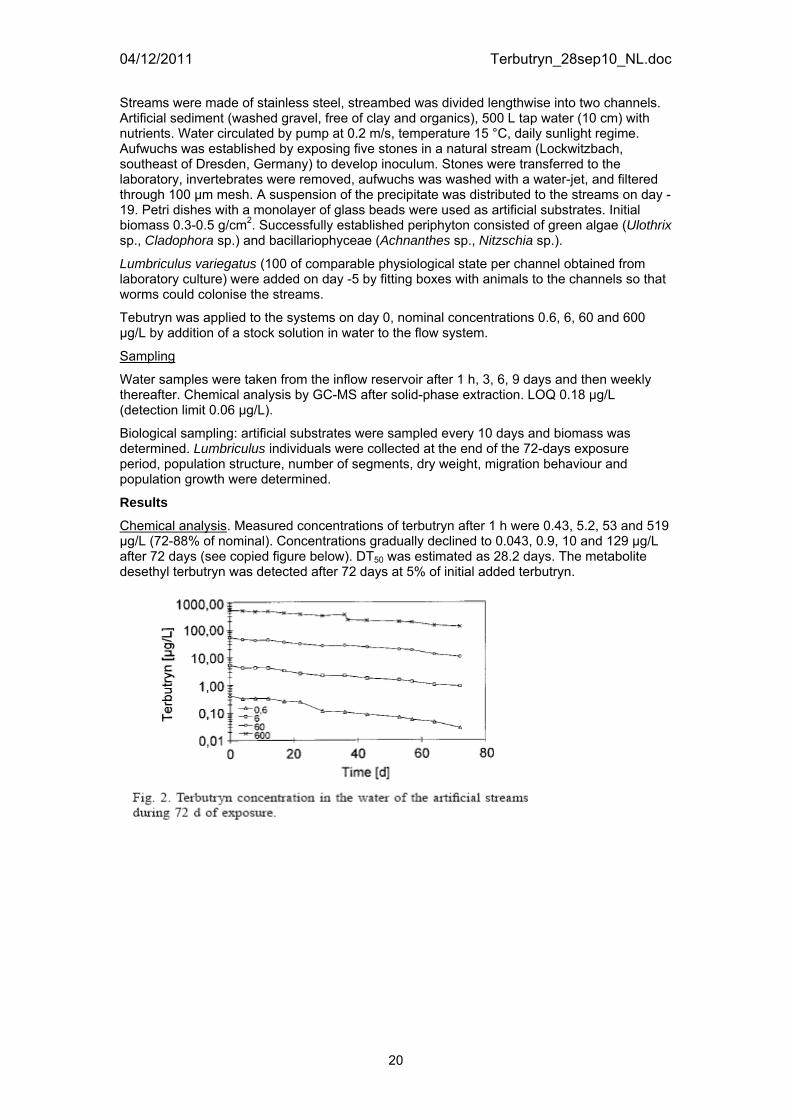
Streams were made of stainless steel, streambed was divided lengthwise into two channels. Artificial sediment (washed gravel, free of clay and organics), 500 L tap water (10 cm) with nutrients. Water circulated by pump at 0.2 m/s, temperature 15 °C, daily sunlight regime. Aufwuchs was established by exposing five stones in a natural stream (Lockwitzbach, southeast of Dresden, Germany) to develop inoculum. Stones were transferred to the laboratory, invertebrates were removed, aufwuchs was washed with a water-jet, and filtered through 100 µm mesh. A suspension of the precipitate was distributed to the streams on day -19. Petri dishes with a monolayer of glass beads were used as artificial substrates. Initial biomass 0.3-0.5 g/cm2. Successfully established periphyton consisted of green algae (Ulothrix sp., Cladophora sp.) and bacillariophyceae (Achnanthes sp., Nitzschia sp.).
Lumbriculus variegatus (100 of comparable physiological state per channel obtained from laboratory culture) were added on day -5 by fitting boxes with animals to the channels so that worms could colonise the streams.
Tebutryn was applied to the systems on day 0, nominal concentrations 0.6, 6, 60 and 600 µg/L by addition of a stock solution in water to the flow system.
Sampling
Water samples were taken from the inflow reservoir after 1 h, 3, 6, 9 days and then weekly thereafter. Chemical analysis by GC-MS after solid-phase extraction. LOQ 0.18 µg/L (detection limit 0.06 µg/L).
Biological sampling: artificial substrates were sampled every 10 days and biomass was determined. Lumbriculus individuals were collected at the end of the 72-days exposure period, population structure, number of segments, dry weight, migration behaviour and population growth were determined.
Results
Chemical analysis. Measured concentrations of terbutryn after 1 h were 0.43, 5.2, 53 and 519 µg/L (72-88% of nominal). Concentrations gradually declined to 0.043, 0.9, 10 and 129 µg/L after 72 days (see copied figure below). DT50 was estimated as 28.2 days. The metabolite desethyl terbutryn was detected after 72 days at 5% of initial added terbutryn.

04/12/2011 Terbutryn_28sep10_NL.doc
21
Physico-chemical characteristics. Nitrite-N, nitrate-N and ammonia-N were increased at 60 and 600 µg/L, as were ortho-phosphate-P and silicon-Si. No differences in oxygen, temperature, and pH, higher conductivity at 6 µg/L and higher.
Biological observations.
Aufwuchs. Control biomass of aufwuchs increased to 4.3 mg/cm2 on day 50, and declined thereafter. At 0.6 µg/L, the maximum level of 2.4 mg/cm2 was reached on day 40. No increase of biomass was found at 6 (max. 0.6 mg/cm2 on day 30), 60 and 600 µg/L (decrease to 0.1 mg/cm2 by day 19).
Worms. See table from paper copied below. Total number of worms after 72 days was 1221 in the control, 1333 at 0.6 µg/L (+0.7%) and was 609 at 6 µg/L (-50%), 275 at 60 µg/L (-78%) and 241 at 600 µg/L (-81%). Reproduction occurred in all streams and different developmental stages could be observed. A concentration-related decrease was observed for the parameters number of large worms, incomplete small worms, complete small worms, dry weight/worm. No clear effect on the number of segments per worm. The numbers of worms that were retrieved on the meshes of the artificial streams, which is an indication of population stress, increased with increasing concentrations from 0.8% in the control to 10% in at 600 µg/L. Worms were observed on the meshes as from day 59.

04/12/2011 Terbutryn_28sep10_NL.doc
22
There was a clear correlation between the biomass development of aufwuchs and the number of worms, indicating that the effect on worms was due to limitations in food. This is supported by the observed decline in dry weight per worm.
Conclusions of the author
Authors report a LOEC for aufwuchs of 0.6 µg/L nominal, corresponding to 0.43 µg/L based on initial measured. The NOEC for worms is reported as 0.6 µg/L nominal, the EC50 as 6 µg/L. Effects in the artificial streams are observed at much lower concentrations than the acute LC50 of 23.7 mg/L and EC50 for deformation of 16.5 mg/L obtained from a laboratory test (see Annex 1).
Remarks
The following criteria are used to evaluate the reliability and relevance of this (semi)field study:
1. Does the test system represent a realistic freshwater community? No, the system represents a simple food-web, consisting of algae and detritivores.
2. Is the description of the experimental set-up adequate and unambiguous? Yes, details about the test system, biological and chemical sampling are reported.
3. Is the exposure regime adequately described? Yes, results of chemical sampling were presented in the text and in a figure. The reported DT50 is considered reliable and can be used to calculate time-weighted average concentrations.
4. Are the investigated endpoints sensitive and in accordance with the working mechanism of the compound? Yes. From the laboratory data it appears that algae are the potentially most sensitive species group.
The authors do not discuss the development of aufwuchs biomass in the control over time. The decline that is seen from day 50 onwards is most likely due to the increased worm populations. Algae growth rate is apparently not high enough to make up for the increased food demand. The fact that at 0.6 µg/L this point is reached 10 days earlier is consistent with this. Population development of worms at 0.6 µg/L is not affected as compared to the control, while aufwuchs biomass is likely to be directly affected as well. In this way, the disruption of the equilibrium between worm population growth and food availability is enhanced by exposure of terbutryn. The difference in aufwuchs development over time between 0.6 µg/L and the control is therefore considered as a treatment related effect.
From the study it can be concluded that the NOEC for algae is lower than 0.43 µg/L (initial measured). Since terbutryn was present for a considerable period of time, the study is considered suitable for derivation of the AA-EQS. The 50 days period in which the control showed exponential growth should be considered for the evaluation of effects. Using the DT50 of 28.2 days, the time-weighted average concentration over 50 days is 0.25 µg/L.

04/12/2011 Terbutryn_28sep10_NL.doc
23
The result NOEC < 0.25 µg/L for aufwuchs and NOEC 0.25 µg/L for population growth of Lumbriculus variegatus is used for EQS-derivation.
Reference Goldsborough LG, Robinson GGC. 1983. The effect of two triazine
herbicides on the productivity of freshwater marsh periphyton. Aquat Toxicol 4, 95-112.
Species; Population; Community
periphyton
Test Method outdoor enclosures System properties 60 cm water depth Compound terbutryn > 98% pure Exposure regime 0, 0.01, 0.1 and 1.0 mg/L Analysed Yes Temperature [°C] 14-24.7 pH range Not reported Hardness [mg CaCO3/L]
Not reported
Exposure time single Criterion NOEC Test endpoint chlorophyll a, carbon assimilation Value [µg/L] < 10 µg/L GLP No Guideline No Notes Ri 2 (supportive only) Description
Experimental system
Littoral enclosures were set up in the Blind Channel of the Delta Marsh, southern end of Lake Manitoba. Enclosures (made of PVC-sheets, 300 L) were placed into water of ca. 60 cm depth, embedded into sediments to 45 cm. Submersed macrophytes were removed to minimise variation between enclosures. Acrylic rods were placed into the enclosures for periphytal algal colonisation. Teburtryn (0.01, 0.1 and 1 mg/L) was applied by suspension of gauze sacs with the appropriate solutions into the water, mixing was enhances by squeezing the sacs at regular time intervals during 2 days. One enclosure per treatment. Colonised substrates were sampled as from 9 days after treatment and at weekly intervals for 5 weeks thereafter. Periphyton was sampled for determination of chlorophyll a and for use in carbon assimilation experiments.
Water was sampled daily and analysed for dissolved silicon and ammonia. Terbutryn concentrations were analysed by UV-spectrophotometry. DO, light extinction and temperature were monitored weekly.
Results
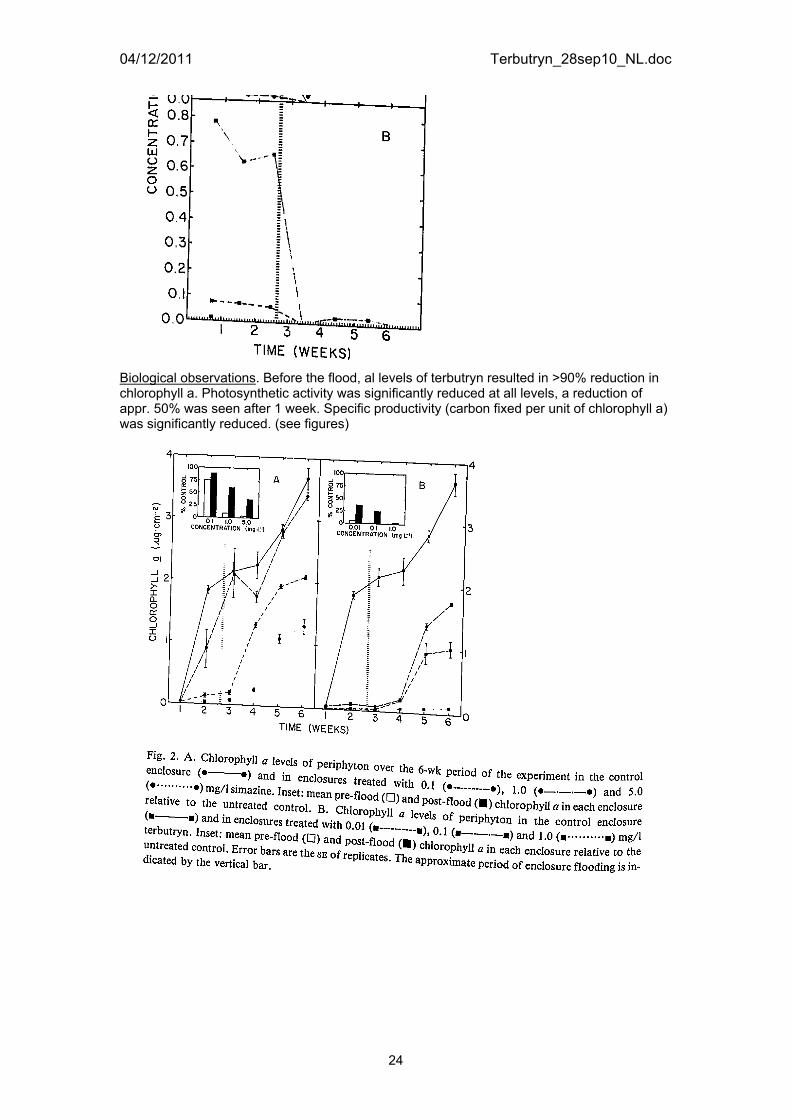
Chemical analysis. Measured concentrations of terbutryn were in agreement with nominal at the start of the experiment. The lowest level of 0.01 mg/L was below the limit of detection. After 18 days, enclosures were immersed due to a strong north wind, and concentrations fell below the LOD (see figure).
04/12/2011 Terbutryn_28sep10_NL.doc
24
Biological observations. Before the flood, al levels of terbutryn resulted in >90% reduction in chlorophyll a. Photosynthetic activity was significantly reduced at all levels, a reduction of appr. 50% was seen after 1 week. Specific productivity (carbon fixed per unit of chlorophyll a) was significantly reduced. (see figures)

04/12/2011 Terbutryn_28sep10_NL.doc
25
Recovery of all parameters was observed after the flooding had caused a drop in terbutryn levels. At the highest exposure level, water concentrations of terbutryn increased again after 5 weeks, causing a decrease in productivity. Ammonia and silicon concentrations increased as a result of decreased productivity.

04/12/2011 Terbutryn_28sep10_NL.doc
26
Conclusions of the author
Authors report that the minimum effective concentration of terbutryn is < 0.01 mg/L, but conclude that the long-term impact after a single dosage may be minimal.
Remarks
The following criteria are used to evaluate the reliability and relevance of this (semi)field study:
1. Does the test system represent a realistic freshwater community? No, the system only covers algae.
2. Is the description of the experimental set-up adequate and unambiguous? Yes/No. The test system and chemical analysis is briefly described, biological sampling is reported adequately. Only one replicate enclosure per treatment.
3. Is the exposure regime adequately described? No, results are only presented in figures, The LOD is not adequate for the lowest treatment level. The data for the two higher treatment levels indicate that initial measured concentrations were in agreement with nominal and that concentrations remain more or less constant for 2.5 weeks.
4. Are the investigated endpoints sensitive and in accordance with the working mechanism of the compound? Yes. From the laboratory data it appears that algae are the potentially most sensitive species group.
The results indicate that strong effects on algae are to be expected after exposure to 10 µg/L and higher. Terbutryn remains present in the water phase over a longer time period, which makes this study not suitable for derivation of a MAC-QS. Furthermore, in view of the remarks above, this study can only be used as supporting information.
Reference Gurney SE, Robinson GGC. 1989. The influemce of two triazine herbicides on the productivity, biomass and community composition of freshwater marsh periphyton. Aquat Bot 36, 1-22.
Species; Population; Community
periphyton
Test Method outdoor enclosures System properties water volume 320 L, surface area/volume ratio ca. 5.2 Compound terbutryn technical grade Exposure regime 0, 0.01 mg/L Analysed Yes (end of study) Temperature [°C] Not reported pH range Not reported Hardness [mg CaCO3/L]
Not reported
Exposure time single Criterion NOEC Test endpoint chlorophyll a, carbon assimilation Value [µg/L] < 10 µg/L GLP No Guideline No Notes Ri 3

04/12/2011 Terbutryn_28sep10_NL.doc
27
Description
Experimental system
Littoral enclosures were set up in the Blind Channel of the Delta Marsh, southern end of Lake Manitoba. Enclosures (made of PVC-sheets, 120 cm high, Ø 76 cm, n=2) were placed into water. Systems were telescoping enclosures, modified from Goldsborough and Robinson (1983, see above), that allowed for 50 cm fluctuation in water level. Submersed macrophytes were absent at the time of placement, but vegetation had to be removed occasionally from the control to minimise variation between enclosures. Acrylic rods (n=84) were placed into one of the two replicate enclosures at 23 cm depth in the sediment for colonisation of haptobenthic algae. Enclosures without rods were used to sample herpobenthic (sediment living) periphyton. Teburtryn was applied six days later. Pre-weighed terbutryn was placed in a gauze sac and suspended in each enclosure. Haptobenthic algae were sampled between 28 May 1984 and 21 August 1984 on nine sampling days, eight of them after herbicide application. Colonised substrates (n=4) were removed and sub-sampled. Algae samples were removed for chlorophyll a determination. On six of the nine sampling days, algae cell counts were made and identified. Herpobenthic communities were sampled from within a 11-cm diameter PVC coring cylinder. One sediment sample was taken on each of the nine sampling days. Three cellulose tissue traps (4 cm2) were used to determine carbon assimilation and one as dark assimilation control.
Water was sampled three times a week and analysed for DO, silicon, ammonia and total reactive phosphorous (TRP). Terbutryn concentrations were analysed by UV-spectrophotometry, LOD was too high, final concentrations were determined using GLC 86 days after herbicide application (91 days after set-up).
Results
Chemical analysis. Measured concentrations of terbutryn after 86 days were in agreement 0.005 and 0.00315 mg/L (5 and 3 µg/L, 50 and 32% of nominal), indicating relatively high persistence in the water column.
Biological observations. Photosynthetic activity (measured as carbon assimilation) of haptobenthic algae was decreased for ca. 2 weeks, between 30 and 53 days a stimulation as compared to the control was present followed by a sharp decline on day 60 and a stimulus on day 84. Overall mean assimilation rate was 99% of the control. Carbon assimilation in the herpobenthic enclosures was always decreased as compared to the control (see figure). Mean assimilation rate was 27% of the control. Similar patterns were found for chlorophyll a content.

04/12/2011 Terbutryn_28sep10_NL.doc
28
Terbutryn did not result in consistent decrease of cell density of haptobenthic algae, but biovolume was severely decreased (see figure). Differences in biovolume appeared to be related in to differences in species composition. Where the control was dominated by relatively large Chlorophyta taxa, terbutryn treatments were dominated by Bacillariophyta taxa. Mean biovolume per cell was 3050 µm3 in the control and 216 µm3 in the terbutryn treatment.

04/12/2011 Terbutryn_28sep10_NL.doc
29
DO in the treated enclosures was generally lower than in the control, dissolved ammonia was substantially higher. TRP followed a similar trend as ammonia. Increased TRP and ammonia are probably related with the inhibition of algae, that normally intercept nutrients. Recovery of haptobenthic algae after 30 days caused a decrease in nutrients. Nutrient status seems to be a secondary effect. PRC-analysis was used to evaluate the relationship between nutrient concentrations and carbon assimilation, there was no statistically significant relationship in the terbutryn treatment. Silicon concentrations were roughly similar to the control. Comparison of DO, TRP, ammonia and silicon concentrations in the enclosures with those from the adjacent marsh were indicative of an enclosure effect. Authors propose that differences are due to the fact that sediment within the enclosures is less vulnerable to disturbance.
Conclusions of the author
Authors conclude that the effects of terbutryn are complex and that physiological and structural endpoints should be considered. Depending on the spatial location, algae communities may respond differently. Although functional response of haptobenthic algae recovers within about two weeks, secondary effects on nutrient conditions have a longer impact.
Remarks
The following criteria are used to evaluate the reliability and relevance of this (semi)field study:

04/12/2011 Terbutryn_28sep10_NL.doc
30
1. Does the test system represent a realistic freshwater community? No, the system only covers algae.
2. Is the description of the experimental set-up adequate and unambiguous? Yes/No. The test system and chemical analysis is briefly described, biological sampling is reported more in details but not fully clear. Only one replicate enclosure.
3. Is the exposure regime adequately described? No, chemical analysis results are only presented briefly. The LOD is not adequate and measured concentrations are available for the end of the study only.
4. Are the investigated endpoints sensitive and in accordance with the working mechanism of the compound? Yes. From the laboratory data it appears that algae are the potentially most sensitive species group.
The results indicate that strong effects on algae are to be expected after exposure to 10 µg/L. Final concentrations after 86 days were 3 and 5 µg/L, the actual exposure concentration at the start of the test and in between is not known. Terbutryn remains present in the water phase over a longer time period, which makes this study not suitable for derivation of a MAC-QS. Furthermore, in view of the remarks above, a reliable endpoint for AA-QS derivation cannot be derived from this study.