r&d trends - industrieverband agrar | are also in development in china, however as none of these...
TRANSCRIPT

R&D trends for chemical crop protection products and the position of the European Market
A consultancy study undertaken for ECPA
Phillips McDougall, September 2013
PhillipsMcDougallAGROCHEMICAL & BIOTECHNOLOGY CONSULTANTS

A Consultancy Study undertaken by:
Phillips McDougall Ltd.Suite 2, Vineyard Business Centre, Saughland, Pathhead, Midlothian, EH7 5XP, United KingdomTel: +44 1875 320 611Fax: +44 1875 320 [email protected]
2
Contents
Summary 3
Introduction 4
Factors Affecting Agrochemical R&D Expenditure 4
Companies involved in New Active Ingredient Research 4
The cost of bringing a new Active Ingredient to the market 6
Breakdown of R&D Budgets 7
Swing of Overall R&D Expenditure toward Seeds and Traits 8
New GM Trait introductions 8
New Agrochemical Active Ingredient Introductions Since 1950 10
Agrochemical Active Ingredients in Development 10
Market Development 11
European Crop Protection Market Development 12
Cereal Fungicide Introductions 13
Regulatory Environment 14
R&D Trends 15
Breakdown of R&D Investment 16
Share of Crop Protection R&D Focussed on Europe 16
Key Factors Affecting R&D Investment for the European Market 17
Discussion 18
Appendix 1: Product introductions 1980-1989 19
Appendix 2: Product introductions 1990-1999 20
Appendix 3: Product introductions 2005-2014 21
On behalf of:
ECPA 6 Avenue E. Van Nieuwenhuyse,1160 Brussels,BelgiumTel: +32 2 663 15 [email protected]
PhillipsMcDougallAGROCHEMICAL & BIOTECHNOLOGY CONSULTANTS

3
Overview of research and development • The number of companies
involved in the research and development of new agrochemical active ingredients worldwide has halved, from 34 companies in 1995 to 17 in 2012.
• Between 1995 and 2005, the cost of bringing a new active ingredient to market has risen from $152 million to $256 million.
• Since 2010 the total R&D expenditure devoted to seeds and traits R&D has exceeded that for agrochemicals.
• In 2000 there were 70 new active ingredients in the development pipeline; in 2012 there were only 28.
Market development
• Between 2003 and 2011 Europe was the leading regional agrochemical market worldwide; in 2012 it was overtaken by Asia.
• The European agrochemical market in terms of growth and sophistication is divided between EU-15, new EU-12 and East European markets.
• The focus of R&D is on the high value EU-15 markets. However, the EU-15 has recorded the slowest growth of all the regional agrochemical markets worldwide.
Decreased R&D investment for the European market
• The global share of new agrochemicals focussed on the European market has fallen from 33.3% in the 1980s to 21.3% in the 1990s to 16.4% in the 2005-14 period.
• The share of crop protection R&D investment attributable to products being developed for the European market has fallen from 33.3% in the 1980s to 25.0% in the 1990s to 7.7% in the 2005-14 period.
• The key reasons behind the reduction in R&D investment in crop protection products for the European market are:-- The mature nature of the EU-15 market- The non-acceptance of GM technology- The harsh regulatory environment
• European farmers have far less new technology to drive agricultural production than their competitors in other regions of the world.
Summary
Background to the report
Phillips McDougall has been asked to investigate recent trends in research and development in the crop protection sector, specifically as it influences the level of investment in and focus on the European market.
Methodology
The analysis presented in this report is based on the following sources of information:
Global market information developed and published by Phillips McDougall in the AgriService since 1999, a global analysis of the Agrochemical and GM trait industries, containing market data back to 1980. The AgriService is subscribed to by all the leading Crop Protection companies and Investment Banks worldwide. All data is presented at the ex-manufacturer level, i.e. from companies to the first step of distribution, or direct to farmers in some instances.
3

4
new active ingredient from discovery through to market introduction. The majority of these small companies do not have the financial capability of bearing such costs; as a result the major way for products developed by these companies to get to market is for the product, the company or both, to be acquired by one of the major companies in the industry.
A number of analogues of existing chemistry are also in development in China, however as none of these has a complete GLP (Good Laboratory Practice) data package, then any company licencing in any of this technology would have to repeat many of the studies required for registration, but under GLP conditions. The cost of this would be similar to the development costs (Figure 1), as a result, to date, only one product from this source has been brought forward for development outside China, and this is by a US based company.
Agriculture is a global industry, but a number of regional factors affect the focus of R&D, including commercial market development or the opportunity for innovation. These are related to the key crops grown in a region, the corresponding pest weed and disease control requirements and the level of control offered by existing products on the market.
Companies involved in new Active Ingredient research
Table 1 shows that worldwide the number of companies involved in the research and development of new active ingredients has halved from 35 companies in 1995, to 18 in 2012. This has affected competition in the new product area and the diversity of products that have been developed.
In addition, there are a number of small, often start-up companies involved in technology development. Figure 1 shows the cost of bringing a
In the recent past there have been a number of major factors that have affected R&D into conventional chemical crop protection products. This has been due to a variety of factors, from an increasingly harsh regulatory environment to the increasing costs of bringing a new product to market (Table 1).
Factors Affecting Agrochemical R&D Expenditure
• Harsh regulatory environment• Increasing cost of new active
ingredient R&D• Industry consolidation
- Fewer companies involved• Increasing expenditure to defend
off-patent molecules- Development of defining technologies
> Formulations> Seed treatments
• Shift in R&D expenditure to seeds and GM traits
Introduction
4

5
Year Europe USA Japan
2012 Bayer Dow AgroSciences Sumitomo Chemical
Syngenta DuPont Ishihara
BASF Chemtura Nihon Nohyaku
Isagro Otsuka
Mitsui Chemical
Kumiai
Hokko
Meiji Seika
Nippon Soda
Agro Kanesho
Nissan
Number of companies 2012 4 3 11
Table 1: Companies involved in New Active Ingredient Research
Year Europe USA Japan
1995 Bayer Dow Sumitomo Chemical
Hoechst Eli Lilly Ishihara
Schering DuPont Nihon Nohyaku
Rhone Poulenc Cyanamid Otsuka
BASF Uniroyal (Chemtura) Mitsui Toatsu
Ciba Geigy Valent Sankyo
Sandoz Monsanto Hodogaya
Zeneca FMC Chugai
Rohm & Haas Kumiai
Merck Hokko
Abbott Meiji Seika
Nippon Soda
Agro Kanesho
Shionogi
Takeda
Nissan
Number of companies 1995 8 11 16

6
As development costs are so high, it is a major decision by the company whether to progress a potential new active ingredient from the research phase into development. Once started this investment has been committed, as many studies cannot be halted once started. To progress a product into development the company must have a reasonable certainty that it will achieve registration, and also of commercial success once introduction has been achieved. It is now most unusual for a product entering development to not progress to market introduction.
Between 1995 and 2005, the cost of bringing a new active ingredient to market has risen on average by 68.4%, research costs have risen by 18.0%, but development costs by 117.9%. Research relates to chemical synthesis and product discovery as well as screening to prove activity, initial toxicology and environmental chemistry screens will also be undertaken to ensure sufficient safety of the potential product. Development relates predominantly to the studies required to achieve registration, clearly this is where the greatest increase in cost has occurred.
The increased cost of bringing a new Active Ingredient to the market
Figure 1 shows the average of the expenditure of all the major R&D driven companies to bring a new active ingredient to the market. The most recent data is based on the 2005-2008 timeframe as each of the major companies introduced a significant product in that period, so each would have data on which to base its response to the questionnaire.
Figure 1: The increasing cost of bringing a new Active Ingredient to the market*
32 41 42
3044 32
10
91118
20 3618
25
54
18
18
32
13
16
24
13
11
25
0
50
100
150
200
250
300
1995 2000 2005-8
Registration
Environmental Chemistry
Toxicology
Field Trials
Chemistry
Tox/Env Chemistry
Biology
Chemistry
$m
Research 72
Research 85
Research 94
Development 67
Development 146
Development 79
Total $152 m.
Total $256 m.
Total $184 m.
* Results of a study undertaken for ECPA and CropLife America

7
development including usage in mixtures with other active ingredients and in seed treatments. All of these form part of post patent product sales protection strategies.
As the rate of new product introduction slows, it is evident that a greater proportion of the R&D budget was expected to be spent on trying to maximize the sales of products when they suffer patent expiry, rather than on new active ingredient research.
active ingredients was expected to fall from 32.5% to 29.6% (although in actual dollar terms this is a 15% increase). The share of expenditure due to Development of new active ingredients was expected to rise from 23.3% to 24.9%, in line with the increasing requirements of regulatory bodies (in actual dollar terms a rise of 35%). Of greater significance was the intended increase in post launch development, from 31.1% to 31.4% (up 28% in actual dollar terms).
Post launch development relates to further introductions in minor country or crop markets, new formulation
Breakdown of R&D Budgets 2007 and expectation for 2012
Whilst the first part of the study covered the cost of bringing a new active ingredient to market, the second part covered the current breakdown of the R&D budget and how this was expected to alter in the future.
Between 2007 and 2012 (Figure 2), total agrochemical R&D expenditure of the major companies was expected to increase by 26.4% to $2.94 billion. However, the share of this expenditure on the research of new
Figure 2: Breakdown of R&D budgets 2007 and expectation for 2012 (study performed in 2008)*
2007 (actual)
Total = $2,328 million
2012 (expected)
Total = $2,943 million
* Results of a study undertaken for CropLife America
32.5%
1.8%
23.3%
31.1%
11.3% Research of new Active Ingredients
Development of Generics
Development of new Active Ingredients
Post launch development
Product Monitoring / Stewardship
29.6%
1.9%
24.9%
31.4%
12.2% Research of new Active Ingredients
Development of Generics
Development of new Active Ingredients
Post launch development
Product Monitoring / Stewardship

8
to be controlled by conventional chemical crop protection technology. The easiest and most labour efficient means of doing this is by treating the seed.
Although seed treatment is also widely used in Europe on conventional crops, the focus for new developments has been seed treatment for crops containing GM traits, which has again drawn R&D investment away from European markets.
but also that the development of agrochemicals to provide a complete offering around the GM seed also draws agrochemical R&D investment away from the EU market.
Timeline for new GM Trait introductions
Currently the key focus for GM trait adoption (Figure 4) has been in the Americas, principally the USA, Argentina, Canada and Brazil, although increasing acceptance in Asian markets is anticipated.
It is evident that the development of the seed treatment market has coincided with the adoption of GM seed, with farmers wishing to protect high priced GM seed from the minute that it is planted. The GM traits incorporated into the plant will only protect against some insect pests, with other pests and disease needing
Swing of Overall R&D Expenditure toward Seeds and Traits
Figure 3 shows the R&D expenditure of the leading agrochemical companies, which are now also the leading companies in the Seeds industry. It clearly shows that R&D investment in the seeds and traits area is growing at a faster rate than for agrochemicals, with the total R&D spend on seeds and traits exceeding that on agrochemicals since 2010.
The driving force behind the increase in seeds R&D is the development of new GM traits, a technology that has only been accepted in the EU in the most limited way. The adoption of GM technology also has an impact on the requirements for chemical crop protection on these crops. The impact of this is not only that GM trait development draws R&D investment away from the EU market,
Figure 3: Swing of overall R&D expenditure towards seeds and traits
US
$ m
illio
n
0
500
1000
1500
2000
2500
3000
3500
4000
2000 2001 2002 2003 2004 2005 2006 2007 2008 2009 2010 2011 2012
Agchem
Seed Traits

9
Figure 4: Timeline of new GM trait introductions
0
50
100
150
200
250
300
350
400
450
1995
1996
1997
1998
1999
2000
2001
2002
2003
2004
2005
2006
2007
2008
2009
2010
2011
2012
Planted area of GM crops (Acres m.)
Cultivance SoybeanPowercore MaizeSmartStax Refuge Advanced MaizeOptimum AcreMax MaizeOptimum AcreMax Xtra MaizeOptimum Intrasect Xtra MaizeOptimum TRIsect MaizePlenish SoybeanGenuity SmartStax RIB Complete MaizeGenuity VT Double Pro RIB Complete MaizeAgrisure Viptera 3220 MaizeAgrisure 3122 Maize
LL Canola
RR CanolaRR SoybeanBollgard CottonRR CottonLL Maize
YieldGard MaizeRR Bollgard Cotton
RR Maize
RR YieldGard MaizeHerculex I MaizeYieldGard Corn RootwormBollgard II Cotton
RR/Bollgard II CottonLL CottonWideStrike Cotton
RR YieldGard Plus MaizeHerculex RW MaizeAgrisure GT Maize
RR Flex CottonHerculex XTRA MaizeRR Flex Bollgard II Cotton
Agrisure RW MaizeYieldGard VT Triple MaizeGenuity RR Sugarbeet
Agrisure 3000GT
LL SoybeanRR2Yield Soybean
Genuity VT Double ProGenuity VT Triple ProGenuity SmartStaxSmartStax
Optimum AcreMax I MaizeOptimum AcreMaxRW MaizeOptimum Intrasect MaizeAgrisure Viptera 3110 MaizeAgrisure Viptera 3111 MaizeAgrisure ArtesianEnogen Maize
9

10
New Agrochemical Active Ingredient Introductions Since 1950
Figure 6 clearly shows that worldwide the number of new introductions per year has been in a trend of decline since 1997.
Agrochemical Active Ingredients in Development
Figure 5 shows a more concerning pattern, in that the number of new active ingredients in development has shown a more significant fall. In 2000, there were 70 new active ingredients in the development pipeline, in 2012 there were only 28.
Figure 5: Agrochemical Active Ingredients in development
Figure 6: Agrochemical Active Ingredient introductions since 1950
0
10
20
30
40
50
60
70
80
1999 2000 2001 2002 2003 2004 2005 2006 2007 2008 2009 2010 2011 2012
No. of Active Ingredients in development
A.I.
s in
dev
elop
men
t
No.
of p
rodu
cts
0
5
10
15
20
25
1950
1952
1954
1956
1958
1960
1962
1964
1966
1968
1970
1972
1974
1976
1978
1980
1982
1984
1986
1988
1990
1992
1994
1996
1998
2000
2002
2004
2006
2008
2010
2012
No. Active ingredients introduced

11
Regional Chemical Crop Protection Market Development
In 2012, Asia overtook Europe to become the largest regional market worldwide. Table 2 clearly shows that the greatest market expansion in value terms in both the last 5 and 10 year periods has occurred in the developing markets of Asia and Latin America.
The growth of the NAFTA market has been held back by the shift to GM solutions for crop protection (Figure 7).
Compound annual growth rate of the regional crop protection markets
The European market for conventional chemical crop protection products divides between three
Market Development
Figure 7: Regional chemical crop protection market development
2012 / 2007 2012 / 2002
Asia 9.8 7.1
Latin America 13.2 12.2
Europe 3.3 6.4
NAFTA 4.2 1.9
Middle East & Africa 5.7 6.4
World 7.2 6.5
Table 2: Compound annual growth rate of the regional crop protection markets (% p.a.)
distinct areas, the developed, mature EU-15 markets, the developing new members of the EU where market development is assisted by increasing investment in agriculture (the new EU-12), and then the non-EU European countries, which include
the developed Swiss and Norwegian markets (although these are relatively mature with limited growth potential), but more importantly the rapidly developing markets in Russia, the Ukraine and other East European countries.
0
2000
4000
6000
8000
10000
12000
14000
NAFTA $m
LAM $m
Asia $m
Europe $m
MEA $m
US
$ m
illio
ns

12
European crop protection market by sector
In Figure 8 it can clearly be seen that the greatest growth in the European crop protection markets has been recorded by the ‘Rest’ of Europe, predominantly Russia and the Ukraine, followed by the ‘New’ EU-12, led by Poland, the Czech Republic and Hungary. Less growth has been recorded by the developed EU-15 markets (Table 3).
European Crop Protection Market by Crop 2012
The key European market for crop protection products, and the main focus for R&D, is cereals (Figure 9). The next major crop is maize; however R&D in this area has been reduced due to the shift of this market in the Americas to genetic solutions. The next major row crop is oilseed rape, however few agrochemicals are developed specifically for use on the crop, most being adaptations of products developed for use on other
crops. The other leading crops are all in the diverse fruit & vegetables sector.
From an R&D perspective, the driver of new product development for the EU-15 markets is improved solutions for existing problems, particularly where pest, weed or disease resistance has become an issue. Generally the level of technical sophistication is not as high in the new EU-12 markets, although increasing investment and
farmer wealth is driving market development toward newer, more efficacious products. The lesser developed markets generally utilise more basic solutions based on products that have been on the market for some time.
A good example of this is the cereal fungicide sector, a key focus for new active ingredient development for the European market, where the level of market sophistication relates directly to how recently the major products utilised have been introduced and adopted (Table 4).
2012 / 2007 2012 / 2002
EU 15 2.8 1.7
New EU 12 6.2 4.2
Rest of Europe 14.8 10.1
Table 3: Compound annual growth rate of the European crop protection market (% p.a.)
Figure 8: European crop protection market by sector
0
1000
2000
3000
4000
5000
6000
7000
8000
2000 2001 2002 2003 2004 2005 2006 2007 2008 2009 2010 2011 2012
EU15 €m New EU12 €m Rest of Europe €m
€ m
illio
ns

13
Figure 9: European crop protection market by crop 2012
Cereal Fungicide Introductions
The inference from the analysis presented above is that the focus for new product development in Europe is cereals for the major developed markets in the EU-15, however in the European market it is these country markets that have recorded the least growth over the last five and ten year periods. Figure 8 shows that the European market
has enjoyed periods of strength in 2008 and again in 2011 and 2012. These times correspond with periods when the global price of cereals was strong, predominantly due to poor global harvests in the previous years, resulting from poor weather conditions.
The relatively low growth in the EU-15 countries, coupled with the susceptibility of the market to
weather impacts and cereal prices, limits its attraction as a focus for R&D investment. When this is taken into account alongside the current regulatory regime in the EU, the risks involved in new active ingredient development for the EU market result in an environment where investment will be limited.
Level of sophistication Major products (date of introduction) Country
Basic mancozeb (1943), chlorothalonil (1963),carbendazim (1973)
Early development 1st generation triazoles: propiconazole (1980), triadimenol (1980) Bulgaria, Romania
Developing 3rd generation triazoles: cyproconazole (1988), tebuconazole (1988), epoxiconazole (2003) Russia, Ukraine
Highly developed Strobilurins: kresoxim (1996), azoxystrobin (1997), trifloxystrobin (2000), pyraclostrobin (2002) Czech Republic, Poland, Slovakia, Croatia
Advanced SDHI products: bixafen (2010), isopyrazam (2010), sedaxane (2011), fluopyram (2012), penflufen (2012)
France, Germany, UK
Table 4: Cereal fungicide introductions
35.6%
11%11.9%
8.7%
8.5%
4.7%
4.5% 5.1%
3.3%6.7%
Cereals
Other F&V
Maize
Vine
Rape
Potato
Pome Fruit
Sugarbeet
Sunflower
Others

14
Regulatory Environment
Principles of 1107/2009
The key issue from the new regulation (1107/2009) governing the registration and re-registration of agrochemical products in the EU, is that the criteria for approval is now governed by an initial assessment of hazard in addition to the assessment of risk. This effectively negates scientifically based argument regarding the relative toxicity of substances.
A product will not achieve registration or re-registration if it is deemed to be mutagenic, carcinogenic, or potentially in the future, an endocrine disruptor, regardless of the level of the offending compound that may be encountered. Under the previous legislation, if the expected exposure level that may be encountered following correct application was minimal and well within safety limits, then the risk was deemed acceptable
and the active ingredient could be registered or re-registered.
Under 1107/2009, any exposure, regardless of level, is deemed unacceptable when a substance triggers the hazard criteria and the product will not be registered, or it will be refused re-registration.
This situation is expected to have a further negative impact on the number of active ingredients that are likely to be developed for the EU market. As stated above, a key decision for companies developing new active ingredients is whether to progress the products from research into development, as the development stage is where the greatest level of expenditure has to be made.
Under the previous criteria, if the product under development was deemed to be mutagenic or
carcinogenic, then an assessment of potential exposure could be made and if this was within safety limits then the product may well progress into development, on the understanding that the potential risk was acceptable and that registration would probably be achieved. Under the new criteria, and with the level of investment required to take a new active ingredient through the development process, if there is the slightest concern regarding the product under development and there is a possibility that following development registration will not be achieved, then it is most unlikely that a company would progress such a product into the development process. The eventual inclusion of endocrine disruption into these criteria is likely to result in even fewer products entering development.
33.3%
66.7%
Europe Rest of world
14

15
Research and Development
Trend Analysis
A review of new active ingredients introduced to the market and those in R&D has been made to ascertain the focus of research and development on products for the European market. The number of products introduced between 1980 and 1989 has been
compared with the ten year period from 2005 through to 2014 (both products introduced and those in R&D) (Table 5).
Between the 1980s and the 2005 to 2014 period, the number of active ingredients introduced and in development has fallen by 40.7%,
in line with the falling number of products in development highlighted earlier in this report. However, the proportion of these active ingredients focussed on the European market has fallen from 33.3% to only 16.4% between these two periods, a decline of 70.7% (Figure 10).
Region 1980 - 1989 1990 - 1999 2005 - 2014
Worldwide 123 128 73
Europe 41 40 12
Share Europe (%) 33.3 31.3 16.4
Table 5: Regional focus of Active Ingredients introduced and those in development
Figure 10: Share of Active Ingredients introduced or in development
1980 - 1989Total = 123 Active Ingredients
1990 - 1999Total = 128 Active Ingredients
2005 - 2014Total = 73 Active Ingredients
33.3%
66.7%
Europe Rest of world
31.3%
68.7%
Europe Rest of world
16.4%
83.6%
Europe Rest of world
16
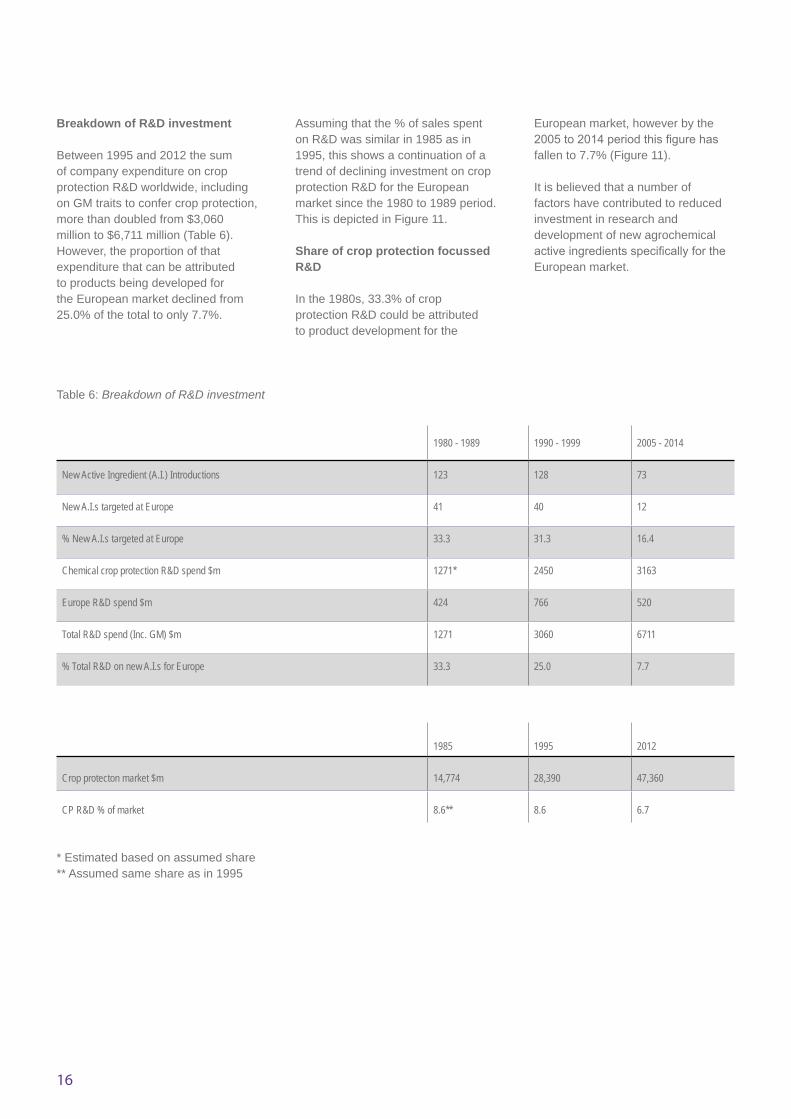
Breakdown of R&D investment
Between 1995 and 2012 the sum of company expenditure on crop protection R&D worldwide, including on GM traits to confer crop protection, more than doubled from $3,060 million to $6,711 million (Table 6). However, the proportion of that expenditure that can be attributed to products being developed for the European market declined from 25.0% of the total to only 7.7%.
Assuming that the % of sales spent on R&D was similar in 1985 as in 1995, this shows a continuation of a trend of declining investment on crop protection R&D for the European market since the 1980 to 1989 period. This is depicted in Figure 11.
Share of crop protection focussed R&D
In the 1980s, 33.3% of crop protection R&D could be attributed to product development for the
European market, however by the 2005 to 2014 period this figure has fallen to 7.7% (Figure 11).
It is believed that a number of factors have contributed to reduced investment in research and development of new agrochemical active ingredients specifically for the European market.
1980 - 1989 1990 - 1999 2005 - 2014
New Active Ingredient (A.I.) Introductions 123 128 73
New A.I.s targeted at Europe 41 40 12
% New A.I.s targeted at Europe 33.3 31.3 16.4
Chemical crop protection R&D spend $m 1271* 2450 3163
Europe R&D spend $m 424 766 520
Total R&D spend (Inc. GM) $m 1271 3060 6711
% Total R&D on new A.I.s for Europe 33.3 25.0 7.7
Table 6: Breakdown of R&D investment
1985 1995 2012
Crop protecton market $m 14,774 28,390 47,360
CP R&D % of market 8.6** 8.6 6.7
* Estimated based on assumed share ** Assumed same share as in 1995

17
Key Factors Affecting R&D Investment for the European Market
• Mature nature of EU-15 markets• Attraction of developing markets
driven by volume growth• Non acceptance of GM seed• Shift in investment to seeds &
traits R&D for non-European markets
• Investment in agrochemical R&D to support the GM seed sector
• Harsh European regulatory environment
• Re-registration procedure from 1991
• Hazard based assessment from 2011
Figure 11: Share of crop protection R&D focussed on Europe
The overall impact of this is that the European farmers have far less new technology to drive agricultural production than their competitors in other regions of the world. The European farmer cannot utilise GM seed technology and whilst in the 1980s and 1990s was enjoying a rate of new agrochemical introduction of 4.1 and 4.0 per annum, in the 2005 to 2104 timeframe this rate will fall to 1.2 per annum.
0
5
10
15
20
25
30
35
1980
1981
1982
1983
1984
1985
1986
1987
1988
1989
1990
1991
1992
1993
1994
1995
1996
1997
1998
1999
2000
2001
2002
2003
2004
2005
2006
2007
2008
2009
2010
2011
2012
2013
2014
%%
17

18
Discussion
The analysis has shown that the number of active ingredients being developed and introduced, with their primary target being the European crop protection market, is in decline.
On a global basis, the number of agrochemicals in development is falling, primarily due to fewer companies being involved, a greater focus by these companies on the seeds and traits area and a greater share of R&D investment being spent on defending products as they come off patent, including seed treatment and formulation technologies. Despite this, the rate of decline in the number of introductions focussed specifically on the European market is greater than that on a global basis.
For eight years in the 2000s, Europe was the largest regional agrochemical market worldwide, being overtaken by Asia in 2012. At this level the market should have been attracting a high level of agrochemical R&D interest, particularly as the adoption of GM crops in the region has been very limited. However, the reverse is true.
Analysis of the European market shows that the majority of the growth in agrochemical sales in the region has been driven by East European markets and the new EU-12. These markets are not as sophisticated as those in the EU-15, often relying on
existing chemistries rather than the most recent technology. Growth in East European and EU-12 markets is a mix of greater intensity of product usage as farmer wealth increases and a trading up to more advanced higher priced agrochemicals, but seldom the most recent introductions. As a result, these countries have not been drivers for R&D investment.
The focus for new agrochemical R&D in Europe has been the high value but more mature EU-15 markets, however the growth in sales of agrochemicals in these countries has been far less significant. The maturity of these markets and the intensity of agricultural production results in resistance development by pests, weeds and diseases being a key factor, which makes them open to the acceptance of new technology to solve these problems.
Much of the growth that has been recorded in these countries can be attributed to value from the adoption of newer, higher priced agrochemicals. Over the last five years, in dollar terms, the EU-15 market has grown by only 1.5% p.a., slower than any of the other regional markets. As a result, despite the need for new technology to combat weed, pest and disease resistance, the chance for commercial success in the EU-15 is limited.
This weak commercial environment coupled with the severe regulatory requirements, which now include an initial evaluation of hazard, leads to a situation where the risk to the R&D company in developing active ingredients for the European market is now supressing innovation. The initial risk being that a high level of expenditure has to be made to develop a new active ingredient, however if registration is not achieved then this investment is lost. Secondly, the limited financial return from new active ingredient introductions, reducing the potential to recover this investment in R&D.
The non-acceptance of GM technology and the harsh regulatory environment has resulted in the focus of R&D no longer being on European markets, with the result that the share of global crop protection investment in R&D focussed on products for use in European markets has fallen from 33.3% in the 1980s to only 7.7% in the 2005 to 2014 period.
Agriculture and agrochemicals are global industries, in no other country outside the EU is the agrochemical registration system so severely regulated by hazard based assessment.
The potential for successful registration and commercial return is at less risk in non-EU, hence when R&D projects are being prioritised within companies, the focus for investment is likely to be outside the EU.
18

19
Appendix 1
No. Year Sector Active Indredient Region Crop 1 - 1980 Fungicide propiconazole Europe Cereals2 - 1980 Fungicide triadimenol Europe Cereals3 - 1980 Fungicide prochloraz Europe Cereals4 - 1980 Fungicide fenpropimorph Europe Cereals5 - 1980 Fungicide fuberidazole Europe Cereals6 - 1980 Fungicide diclobutrazol Europe Cereals7 - 1980 Herbicide benfuresate Europe Cereals8 - 1981 Fungicide fenitropan Europe Cereals9 - 1982 Fungicide benalaxyl Europe F&V10 - 1983 Fungicide oxadixyl Europe F&V11 - 1983 Fungicide penconazole Europe F&V12 - 1983 Insecticide clofentezine Europe Apples13 - 1984 Fungicide flutriafol Europe Cereals14 - 1984 Herbicide metsulfuron Europe Cereals15 - 1984 Herbicide isoxaben Europe Cereals16 - 1984 Insecticide fluvalinate Europe many17 - 1984 Insecticide furathiocarb Europe many18 - 1985 Fungicide fenpropidin Europe Cereals19 - 1985 Herbicide fluroxypyr Europe Cereals20 - 1985 Herbicide diflufenican Europe Cereals21 - 1985 Herbicide tribenuron Europe Cereals22 - 1985 Herbicide flurochloridone Europe Sunflower23 - 1985 Insecticide fenoxycarb Europe F&V24 - 1986 Fungicide flusilazole Europe Cereals25 - 1986 Fungicide hexaconazole Europe F&V26 - 1986 Fungicide chlozolinate Europe F&V27 - 1986 Fungicide pyrifenox Europe F&V28 - 1986 Herbicide tralkoxydim Europe Cereals29 - 1986 Herbicide imazamethabenz Europe Cereals30 - 1986 Herbicide ethiozin Europe Cereals31 - 1986 Herbicide fluoroglycofen Europe Cereals32 - 1987 Fungicide triflumizole Europe Cereals33 - 1987 Herbicide triasulfuron Europe Cereals34 - 1987 Herbicide aclonifen Europe Sunflower35 - 1987 Herbicide cycloxidim Europe BL crops36 - 1988 Fungicide tebuconazole Europe Cereals37 - 1988 Fungicide myclobutanil Europe Cereals38 - 1988 Fungicide cyproconazole Europe Cereals39 - 1988 Fungicide fenpiclonil Europe Cereals40 - 1988 Herbicide prosulfocarb Europe Cereals41 - 1989 Fungicide difenoconazole Europe F&V42 - 1982 Herbicide fomesafen Americas Soybean43 - 1983 Other flumetralin Americas Tobacco44 - 1980 Insecticide fenpropathrin Asia many45 - 1983 Herbicide anilofos Asia Rice46 - 1984 Herbicide bensulfuron Asia Rice47 - 1984 Herbicide pretilachlor Asia Rice48 - 1984 Insecticide buprofezin Asia Rice49 - 1986 Herbicide mefenacet Asia Rice50 - 1986 Herbicide bromobutide Asia Rice51 - 1987 Herbicide cinmethylin Asia Rice52 - 1988 Fungicide pencycuron Asia Rice53 - 1988 Fungicide diniconazole Asia Cereals54 - 1988 Herbicide quinclorac Asia Rice55 - 1988 Herbicide clomeprop Asia Rice56 - 1988 Other uniconazole Asia Rice57 - 1980 Insecticide cyfluthrin Global many58 - 1981 Herbicide sethoxydim Global BL crops59 - 1982 Herbicide chlorsulfuron Global Cereals60 - 1983 Insecticide alpha-cypermethrin Global many61 - 1984 Insecticide lambda-cyhalothrin Global Many62 - 1985 Herbicide quizalofop Global BL crops
No. Year Sector Active Indredient Region Crop
63 - 1985 Insecticide abamectin Global Many64 - 1985 Insecticide cyromazine Global F&V65 - 1985 Insecticide hexythiazox Global F&V66 - 1985 Other paclobutrazol Global F&V67 - 1986 Herbicide glufosinate Global Many68 - 1986 Insecticide esfenvalerate Global Many69 - 1986 Insecticide bifenthrin Global Many70 - 1986 Insecticide teflubenzuron Global Many71 - 1988 Fungicide fluazinam Global Potato72 - 1988 Herbicide primisulfuron Global Maize73 - 1988 Insecticide cadusafos Global F&V74 - 1989 Herbicide flazasulfuron Global F&V75 - 1989 Insecticide chlorfluazuron Global F&V76 - 1989 Insecticide flufenoxuron Global F&V77 - 1980 Fungicide mepronil Japan Rice78 - 1980 Herbicide naproanilide Japan Rice79 - 1980 Herbicide butamifos Japan F&V80 - 1981 Fungicide probenazole Japan Rice81 - 1981 Insecticide flucythrinate Japan F&V82 - 1984 Fungicide flutolanil Japan Rice83 - 1984 Fungicide iminoctadine Japan Rice84 - 1984 Fungicide methasulfocarb Japan Rice85 - 1984 Herbicide bilanafos Japan non-crop86 - 1985 Herbicide dimepiperate Japan Rice87 - 1985 Herbicide pyrazoxyfen Japan Rice88 - 1986 Fungicide pyroquilon Japan Rice89 - 1986 Insecticide etofenprox Japan Rice90 - 1986 Insecticide fenothiocarb Japan F&V91 - 1986 Insecticide bensultap Japan Rice92 - 1987 Fungicide tolclofos-methyl Japan F&V93 - 1987 Fungicide diclomezine Japan Rice94 - 1987 Herbicide esprocarb Japan Rice95 - 1987 Insecticide benfuracarb Japan Rice96 - 1987 Insecticide cycloprothrin Japan Rice97 - 1987 Other heptopargil Japan Rice98 - 1987 Other inabenfide Japan Rice99 - 1988 Fungicide tecloftalam Japan Rice100 - 1988 Fungicide oxolinic acid Japan Rice101 - 1989 Fungicide pefurazoate Japan F&V102 - 1989 Insecticide pyraclofos Japan F&V103 - 1989 Other triapenthenol Japan Rice104 - 1980 Herbicide fluazifop NAFTA soybean105 - 1980 Herbicide propyzamide NAFTA F&V106 - 1981 Herbicide fluridone NAFTA non-crop107 - 1982 Herbicide sulfometuron NAFTA non-crop108 - 1984 Herbicide fenoxaprop NAFTA Soybean109 - 1984 Herbicide lactofen NAFTA Soybean110 - 1985 Herbicide acetochlor NAFTA Maize111 - 1985 Herbicide thifensulfuron NAFTA Soybean112 - 1985 Herbicide imazapyr NAFTA Soybean113 - 1985 Herbicide chlorimuron NAFTA Soybean114 - 1985 Other amidochlor NAFTA many115 - 1986 Herbicide haloxyfop NAFTA Soybean116 - 1986 Herbicide imazaquin NAFTA Soybean117 - 1986 Herbicide clomazone NAFTA Soybean118 - 1986 Insecticide tralomethrin NAFTA many119 - 1987 Herbicide imazethapyr NAFTA Soybean120 - 1987 Herbicide clethodim NAFTA Soybean121 - 1988 Insecticide flucycloxuron NAFTA mites122 - 1989 Insecticide hexaflumuron NAFTA F&V123 - 1988 Insecticide tefluthrin USA Maize
Focus of products introduced between 1980 and 1989

20
Appendix 2
No. Year Sector Active Indredient Region Crop
1 - 1990 Herbicide propaquizafop Europe BL Crops2 - 1991 Herbicide quinmerac Europe BL Crops3 - 1990 Herbicide amidosulfuron Europe Cereals4 - 1992 Fungicide bromuconazole Europe Cereals5 - 1997 Herbicide carfentrazone Europe Cereals6 - 1999 Herbicide cinidon-ethyl Europe Cereals7 - 1991 Herbicide clodinafop Europe Cereals8 - 1994 Fungicide cyprodinil Europe Cereals9 - 1992 Fungicide dimethomorph Europe Cereals10 - 1993 Fungicide epoxiconazole Europe Cereals11 - 1992 Herbicide ethoxyfen Europe Cereals12 - 1991 Fungicide fenbuconazole Europe Cereals13 - 1994 Fungicide fludioxonil Europe Cereals14 - 1998 Herbicide flufenacet Europe Cereals15 - 1997 Herbicide flupyrsulfuron Europe Cereals16 - 1994 Fungicide fluquinconazole Europe Cereals17 - 1997 Herbicide flurtamone Europe Cereals18 - 1996 Fungicide kresoxim-methyl Europe Cereals19 - 1993 Fungicide metconazole Europe Cereals20 - 1994 Herbicide metosulam Europe Cereals21 - 1994 Others prohexadione Europe Cereals22 - 1997 Fungicide quinoxyfen Europe Cereals23 - 1997 Fungicide spiroxamine Europe Cereals24 - 1991 Fungicide tetraconazole Europe Cereals25 - 1992 Others trinexapac-ethyl Europe Cereals26 - 1992 Fungicide triticonazole Europe Cereals27 - 1991 Insecticide acrinathrin Europe F&V28 - 1997 Insecticide diflovidazin Europe F&V29 - 1998 Fungicide famoxadone Europe F&V30 - 1992 Insecticide fenazaquin Europe F&V31 - 1999 Insecticide novaluron Europe F&V32 - 1991 Herbicide rimsulfuron Europe Maize33 - 1990 Herbicide sulcotrione Europe Maize34 - 1994 Insecticide pymetrozine Europe Potato35 - 1992 Herbicide triflusulfuron Europe Sugarbeet36 - 1990 Fungicide diethofencarb Europe Vine37 - 1999 Fungicide ethaboxam Europe Vine38 - 1999 Fungicide fenhexamid Europe Vine39 - 1995 Fungicide mepanipyrim Europe Vine40 - 1993 Fungicide pyrimethanil Europe Vine41 - 1996 Herbicide quizalofop-p-tefuryl Americas BL Crops42 - 1992 Herbicide flupoxam Americas Cereals43 - 1999 Others cyclanilide Americas Cotton44 - 1995 Insecticide diafenthiuron Americas Cotton45 - 1998 Others fluthiacet Americas cotton46 - 1996 Herbicide pyrithiobac Americas Cotton47 - 1991 Fungicide acibenzolar Americas F&V48 - 1998 Others aminoethoxyvinyl glycine Americas F&V49 - 1999 Insecticide bifenazate Americas F&V50 - 1993 Insecticide methoxyfenozide Americas F&V51 - 1992 Insecticide tebufenozide Americas F&V52 - 1994 Herbicide thiazopyr Americas F&V53 - 1993 Insecticide chlorethoxyfos Americas Maize54 - 1993 Herbicide diflufenzopyr Americas Maize55 - 1999 Herbicide dimethenamid Americas Maize56 - 1997 Herbicide isoxaflutole Americas Maize57 - 1997 Herbicide nicosulfuron Americas Maize58 - 1996 Herbicide prosulfuron Americas Maize59 - 1996 Insecticide tebupirimfos Americas Maize60 - 1999 Herbicide cloransulam-methyl Americas Soybean61 - 1991 Herbicide diclosulam Americas Soybean62 - 1996 Herbicide flumetsulam Americas Soybean63 - 1996 Herbicide flumiclorac-pentyl Americas Soybean64 - 1995 Herbicide flumioxazin Americas Soybean65 - 1991 Herbicide imazamox Americas Soybean
No. Year Sector Active Indredient Region Crop
66 - 1996 Herbicide oxasulfuron Americas Soybean67 - 1993 Herbicide sulfentrazone Americas Soybean68 - 1994 Herbicide imazapic Americas Sugarcane69 - 1997 Insecticide halofenozide Americas Turf70 - 1999 Insecticide indoxacarb Asia Cotton71 - 1998 Insecticide etoxazole Asia F&V72 - 1991 Insecticide fenpyroximate Asia F&V73 - 1998 Insecticide flubrocythrinate Asia F&V74 - 1992 Fungicide flusulfamide Asia F&V75 - 1993 Insecticide halfenprox Asia F&V76 - 1994 Fungicide imibenconazole Asia F&V77 - 1991 Insecticide milbemectin Asia F&V78 - 1995 Insecticide nitenpyram Asia F&V79 - 1999 Herbicide pyraflufen-ethyl Asia F&V80 - 1992 Insecticide tebufenpyrad Asia F&V81 - 1999 Insecticide acequinocyl Asia F&V82 - 1996 Insecticide chlorfenapyr Asia Many83 - 1995 Insecticide pyrimidifen Asia Many84 - 1995 Insecticide pyriproxyfen Asia Many85 - 1997 Herbicide azimsulfuron Asia Rice86 - 1990 Herbicide benzofenap Asia Rice87 - 1997 Herbicide bispyribac-sodium Asia Rice88 - 1997 Herbicide cafenstrole Asia Rice89 - 1997 Fungicide carpropamid Asia Rice90 - 1990 Herbicide cinosulfuron Asia Rice91 - 1995 Herbicide cumyluron Asia Rice92 - 1997 Herbicide ethoxysulfuron Asia Rice93 - 1994 Herbicide etobenzanid Asia Rice94 - 1992 Fungicide ferimzone Asia Rice95 - 1997 Fungicide furametpyr Asia Rice96 - 1994 Herbicide halosulfuron Asia Rice97 - 1993 Herbicide imazosulfuron Asia Rice98 - 1994 Fungicide ipconazole Asia Rice99 - 1996 Herbicide oxadiargyl Asia Rice100 - 1998 Herbicide pentoxazone Asia Rice101 - 1999 Herbicide profoxydim Asia Rice102 - 1990 Herbicide pyrazosulfuron Asia Rice103 - 1996 Herbicide pyribenzoxim Asia Rice104 - 1990 Herbicide pyributicarb Asia Rice105 - 1996 Herbicide pyriminobac-methyl Asia Rice106 - 1992 Insecticide silafluofen Asia Rice107 - 1994 Herbicide thenylchlor Asia Rice108 - 1997 Fungicide thifluzamide Asia Rice109 - 1997 Herbicide cyclosulfamuron Asia Rice110 - 1996 Herbicide cyhalofop-butyl Asia Rice111 - 1997 Herbicide sulfosulfuron Global Cereals112 - 1999 Fungicide iprovalicarb Global F&V113 - 1995 Insecticide spinosad Global F&V114 - 1998 Insecticide emamectin benzoate Global F&V115 - 1993 Insecticide alanycarb Japan F&V116 - 1996 Insecticide acetamiprid Global Many117 - 1997 Fungicide azoxystrobin Global Many118 - 1993 Insecticide fipronil Global Many119 - 1991 Insecticide imidacloprid Global Many120 - 1993 Insecticide lufenuron Global Many121 - 1990 Insecticide pyridaben Global Many122 - 1999 Insecticide thiamethoxam Global Many123 - 1992 Insecticide zeta-cypermethrin Global Many124 - 1991 Insecticide fosthiazate Global Potato125 - 1990 Herbicide ethametsulfuron NAFTA Canola126 - 1995 Herbicide butroxydim S. Hemis’ Sunflower127 - 1990 Herbicide dithiopyr USA Turf128 - 1994 Insecticide triazamate USA Cereals
Focus of products introduced between 1990 and 1999

21
Appendix 3
No. Year Sector Active Indredient Region Crop
1 - 2005 Fungicide proquinazid Europe Cereals2 - 2006 Herbicide topramezone Europe Maize3 - 2006 Herbicide pethoxamid Europe Maize4 - 2007 Fungicide meptyldinocap Europe F&V5 - 2007 Herbicide orthosulfamuron Europe Rice6 - 2010 Fungicide bixafen Europe Cereals7 - 2010 Fungicide valifenalate Europe F&V8 - 2010 Fungicide isopyrazam Europe Cereals9 - 2011 Fungicide sedaxane Europe Seed Treatment10 - 2012 Fungicide fluxapyroxad Europe Many11 - 2012 Fungicide fluopyram Europe Many12 - 2012 Fungicide penflufen Europe Seed Treatment13 - 2011 Herbicide indaziflam Americas Sugarcane, Turf14 - 2005 Insecticide amidoflumet Asia non crop15 - 2005 Insecticide dimefluthrin Asia non crop16 - 2006 Fungicide enestroburin China F&V17 - 2006 Fungicide Jun Si Qi China F&V18 - 2008 Fungicide fenamistrobin China Rice19 - 2009 Fungicide pyraoxystrobin China F&V20 - 2005 Herbicide penoxsulam Global Rice21 - 2005 Insecticide spiromesifen Global Mites22 - 2005 Other florchlorfenuron Global F&V23 - 2006 Fungicide fluopicolide Global F&V24 - 2006 Herbicide pinoxaden Global Cereals25 - 2007 Fungicide mandipropamid Global F&V26 - 2007 Herbicide tembotrione Global Maize27 - 2007 Herbicide pyroxsulam Global Cereals28 - 2010 Fungicide ametoctradin Global F&V29 - 2010 Insecticide dimethyl disulfide Global Fumigant30 - 2012 Insecticide sulfoxaflor Global Sucking pest31 - 2012 Insecticide cyantraniliprole Global F&V32 - 2014 Insecticide flupyradifurone Global F&V33 - 2007 Insecticide metaflumizone Global Lepidoptera34 - 2007 Insecticide flubendiamide Global Lepidoptera35 - 2008 Insecticide spirotetramat Global Sucking pests36 - 2008 Insecticide chlorantraniliprole Global Lepidoptera37 - 2005 Herbicide MTB-951 Japan Rice38 - 2006 Herbicide triaziflam Japan Rice
No. Year Sector Active Indredient Region Crop
39 - 2007 Fungicide orysastrobin Japan Rice40 - 2007 Insecticide cyflumetofen Japan F&V41 - 2008 Fungicide amisulbrom Japan F&V42 - 2009 Fungicide penthiopyrad Japan Vegetables, Turf43 - 2009 Herbicide propyrisulfuron Japan Rice44 - 2009 Herbicide pyrimisulfan Japan Rice45 - 2009 Herbicide pyraclonil Japan Rice46 - 2009 Insecticide imicyafos Japan F&V47 - 2009 Insecticide cyenopyrafen Japan F&V48 - 2010 Fungicide isotianil Japan Rice49 - 2010 Insecticide lepimectin Japan F&V50 - 2010 Insecticide pyrifluquinazon Japan F&V51 - 2011 Fungicide pyriofenone Japan F&V52 - 2012 Fungicide pyribencarb Japan F&V53 - 2012 Fungicide fenpyrazamine Japan F&V54 - 2012 Herbicide metazosulfuron Japan Rice55 - 2013 Fungicide isofetamid Japan F&V56 - 2013 Insecticide flometoquin Japan F&V57 - 2013 Insecticide pyflubumide Japan Mites58 - 2014 Insecticide afidopyropen Japan Sucking pest59 - 2005 Herbicide flucetosulfuron Korea Rice60 - 2005 Insecticide bistrifluron Korea F&V61 - 2008 Herbicide metamifop Korea Rice62 - 2005 Insecticide ethiprole NAFTA F&V63 - 2005 Insecticide noviflumuron NAFTA Termites64 - 2005 Insecticide iodomethane NAFTA Fumigant65 - 2006 Herbicide aminopyralid NAFTA Range and Pasture66 - 2007 Herbicide pyrasulfotole NAFTA Cereals67 - 2009 Herbicide thiencarbazone NAFTA Maize, Cereals68 - 2009 Herbicide saflufenacil NAFTA Many69 - 2011 Herbicide aminocyclopyrachlor NAFTA Range and Pasture70 - 2011 Herbicide pyroxasulfone NAFTA Maize, Soybean71 - 2007 Insecticide spinetoram USA F&V72 - 2008 Herbicide tefuryltrione USA Rice, Cereals73 - 2010 Insecticide Bacillus firmis USA Maize, Cotton
Focus of products introduced from 2005 and by 2014

22
Notes

23
R&D trends for chemical crop protection products and the position of the European Market
September 2013