1 chapter i:introduction mis 214 2014/2015 spring
TRANSCRIPT

1
Chapter I:Introduction
MIS 2142014/2015 Spring
2
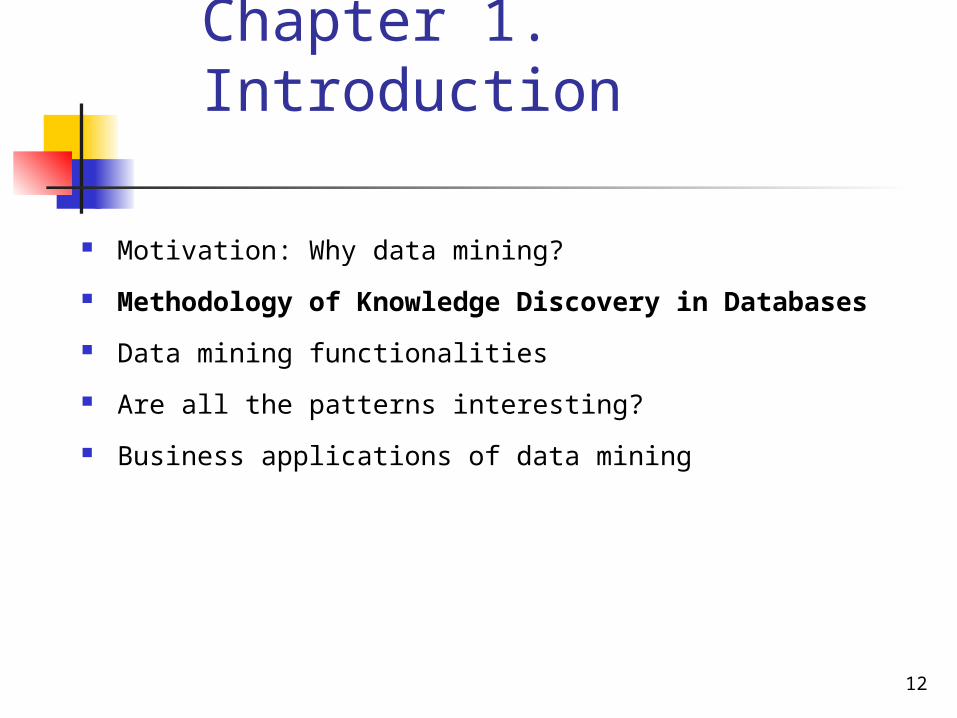
Chapter 1. Introduction
Motivation: Why data mining?
Methodology of Knowledge Discovery in Databases
Data mining functionalities
Are all the patterns interesting?
Business applications of data mining
3
Motivation: “Necessity is the Mother of Invention”
Data explosion problem Automated data collection tools and mature database
technology lead to tremendous amounts of data stored in databases, data warehouses and other information repositories
Need to convert such data into knowledge and information Applications
Business management Production control Market analysis Engineering design Science exploration
4
Evolution of Database Technology (1)
Data collection, database creation Data management
data storage and retrieval database transaction processing
Data analysis and understanding Data mining and data warehousing
5
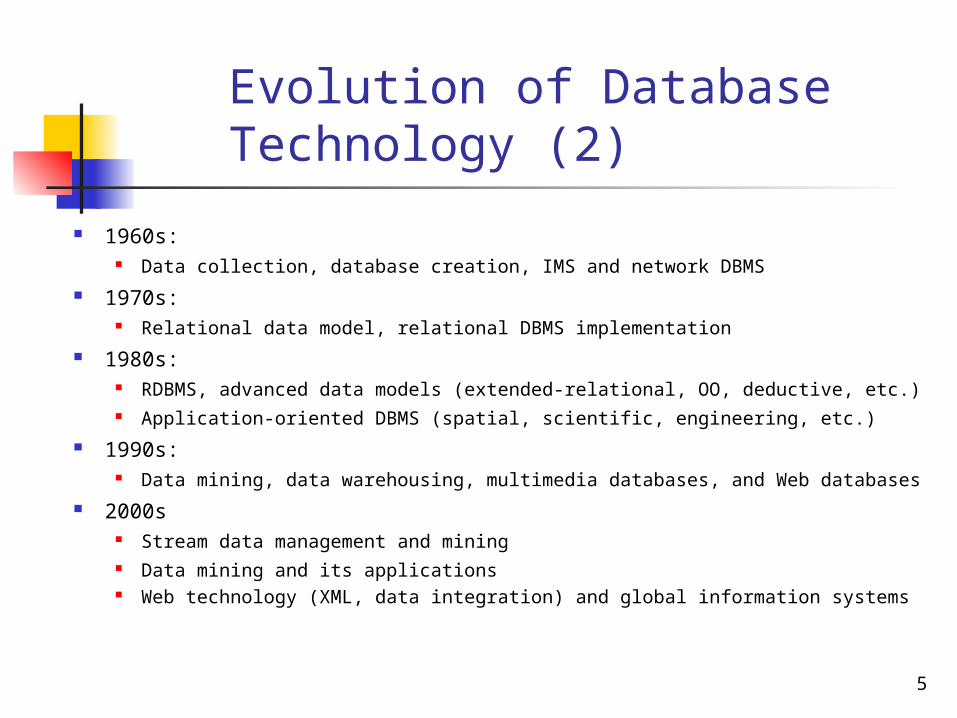
Evolution of Database Technology (2)
1960s: Data collection, database creation, IMS and network DBMS
1970s: Relational data model, relational DBMS implementation
1980s: RDBMS, advanced data models (extended-relational, OO, deductive, etc.) Application-oriented DBMS (spatial, scientific, engineering, etc.)
1990s: Data mining, data warehousing, multimedia databases, and Web
databases 2000s
Stream data management and mining Data mining and its applications Web technology (XML, data integration) and global information systems
6
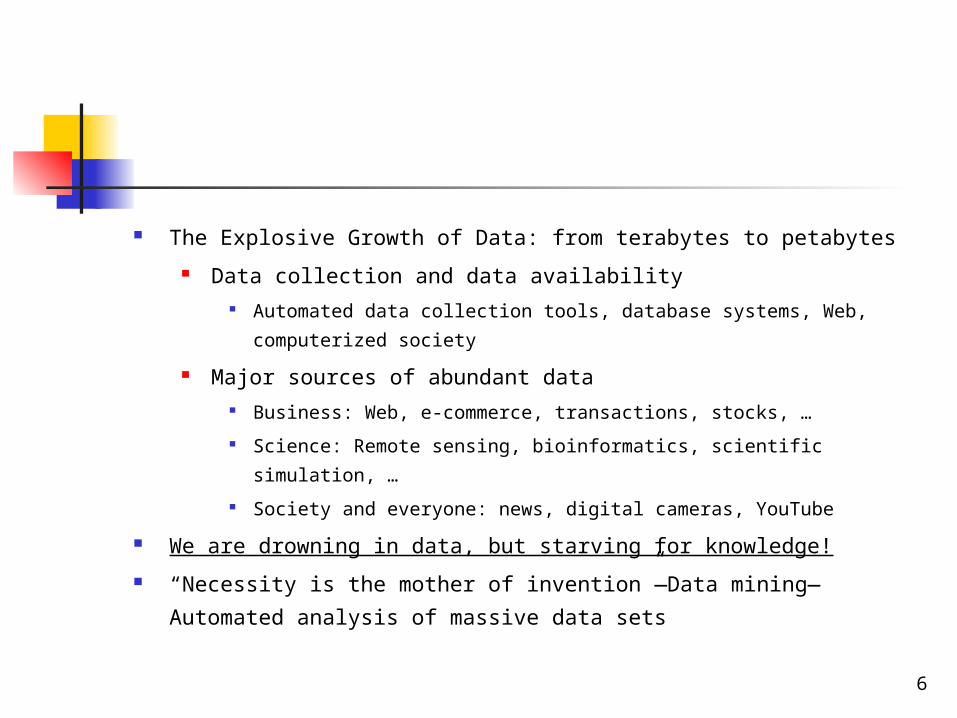
The Explosive Growth of Data: from terabytes to petabytes
Data collection and data availability Automated data collection tools, database systems, Web, computerized
society
Major sources of abundant data Business: Web, e-commerce, transactions, stocks, …
Science: Remote sensing, bioinformatics, scientific simulation, …
Society and everyone: news, digital cameras, YouTube
We are drowning in data, but starving for knowledge!
“Necessity is the mother of invention”—Data mining—Automated
analysis of massive data sets
7
Developments in computer hardware
Powerful and affordable computers Data collection equipment Storage media Communication and networking
8
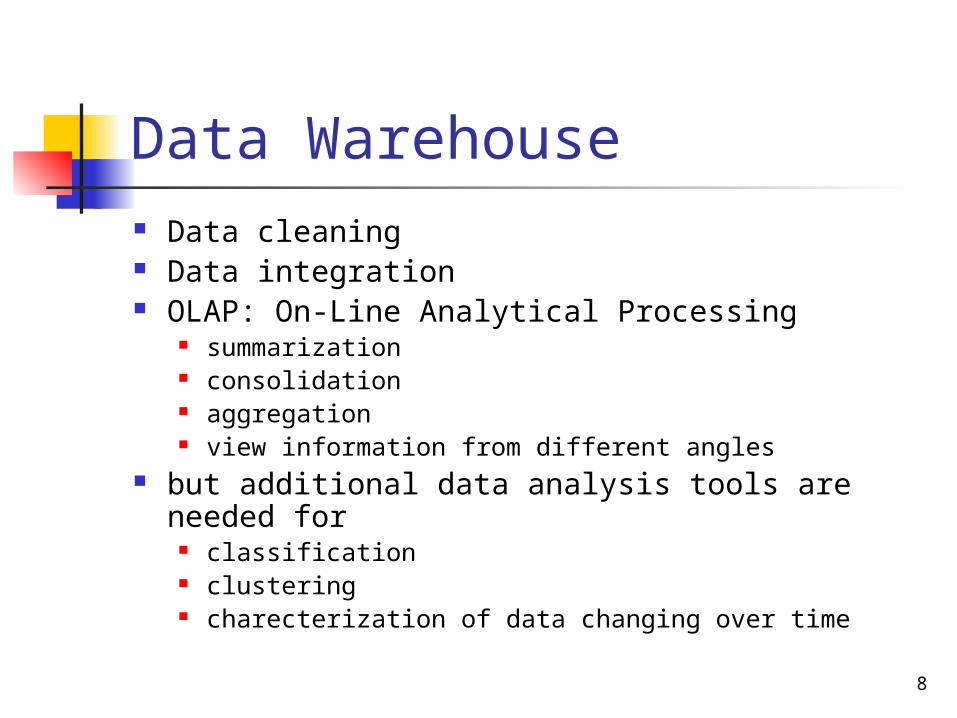
Data Warehouse Data cleaning Data integration OLAP: On-Line Analytical Processing
summarization consolidation aggregation view information from different angles
but additional data analysis tools are needed for classification clustering charecterization of data changing over time
9
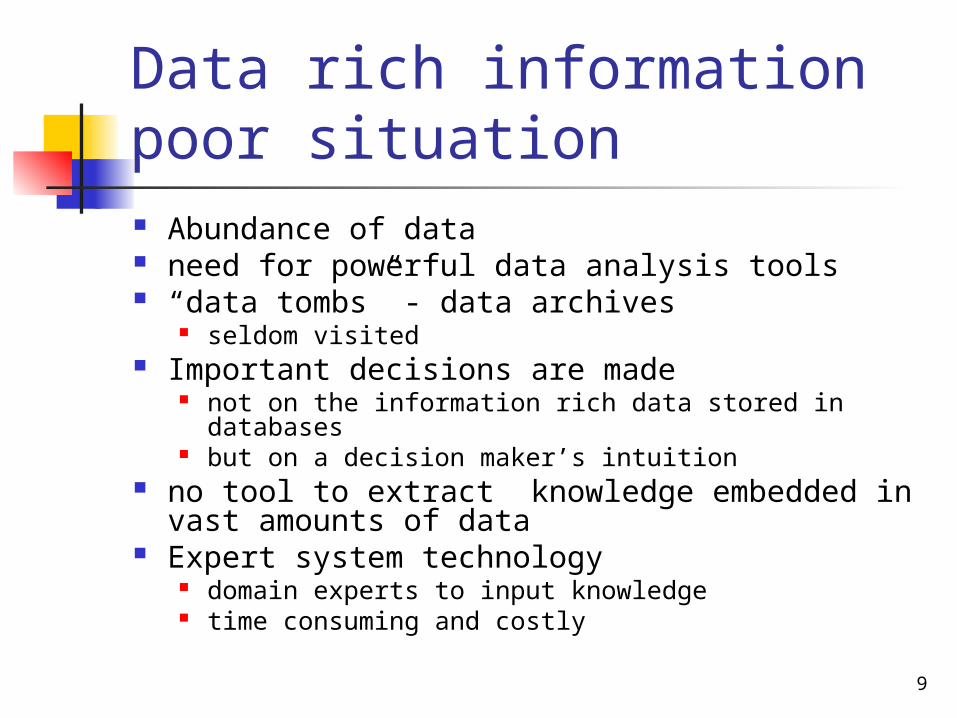
Data rich information poor situation Abundance of data need for powerful data analysis tools “data tombs” - data archives
seldom visited Important decisions are made
not on the information rich data stored in databases but on a decision maker’s intuition
no tool to extract knowledge embedded in vast amounts of data
Expert system technology domain experts to input knowledge time consuming and costly
10
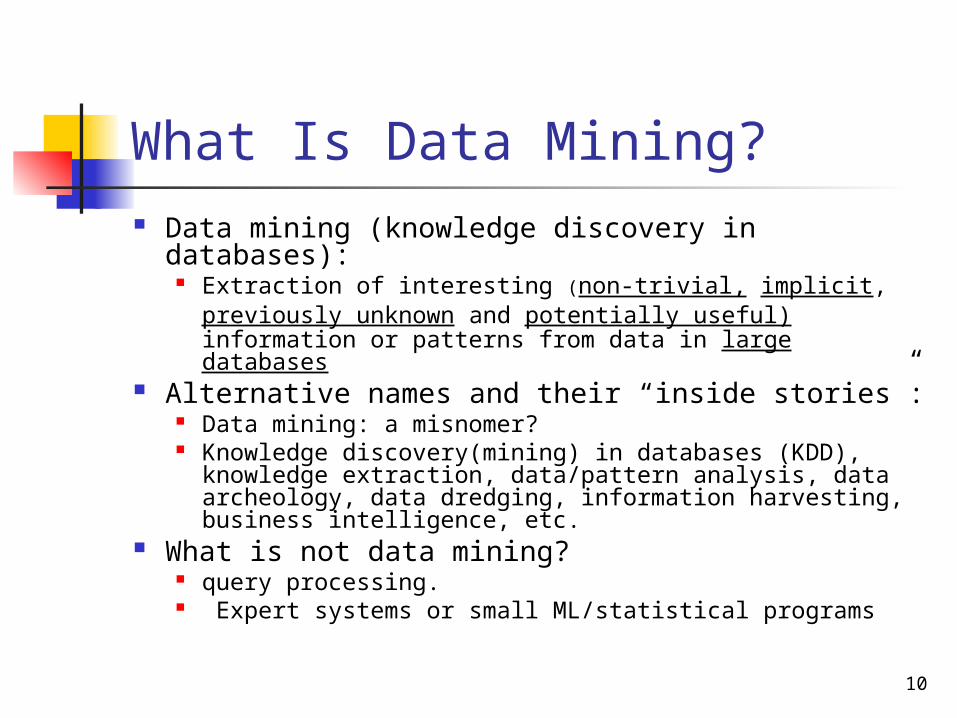
What Is Data Mining? Data mining (knowledge discovery in
databases): Extraction of interesting (non-trivial, implicit,
previously unknown and potentially useful) information or patterns from data in large databases
Alternative names and their “inside stories”: Data mining: a misnomer? Knowledge discovery(mining) in databases (KDD),
knowledge extraction, data/pattern analysis, data archeology, data dredging, information harvesting, business intelligence, etc.
What is not data mining? query processing. Expert systems or small ML/statistical programs
11
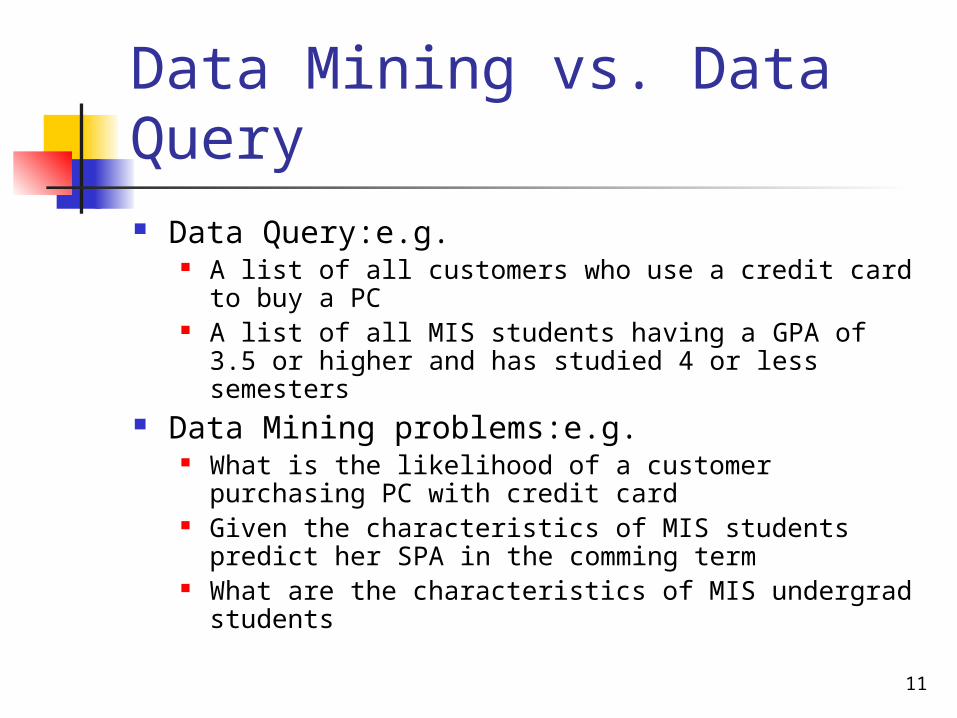
Data Mining vs. Data Query Data Query:e.g.
A list of all customers who use a credit card to buy a PC
A list of all MIS students having a GPA of 3.5 or higher and has studied 4 or less semesters
Data Mining problems:e.g. What is the likelihood of a customer purchasing PC
with credit card Given the characteristics of MIS students predict her
SPA in the comming term What are the characteristics of MIS undergrad
students
12
Chapter 1. Introduction
Motivation: Why data mining?
Methodology of Knowledge Discovery in Databases
Data mining functionalities
Are all the patterns interesting?
Business applications of data mining
13
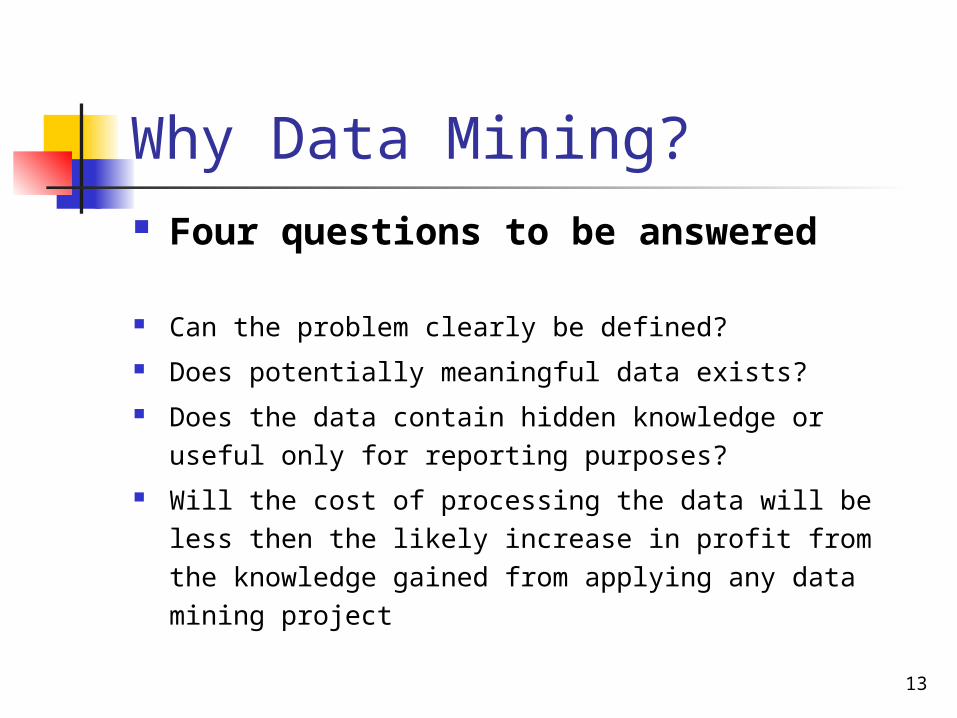
Why Data Mining? Four questions to be answered
Can the problem clearly be defined? Does potentially meaningful data exists? Does the data contain hidden knowledge or useful only
for reporting purposes? Will the cost of processing the data will be less then the
likely increase in profit from the knowledge gained from applying any data mining project
14
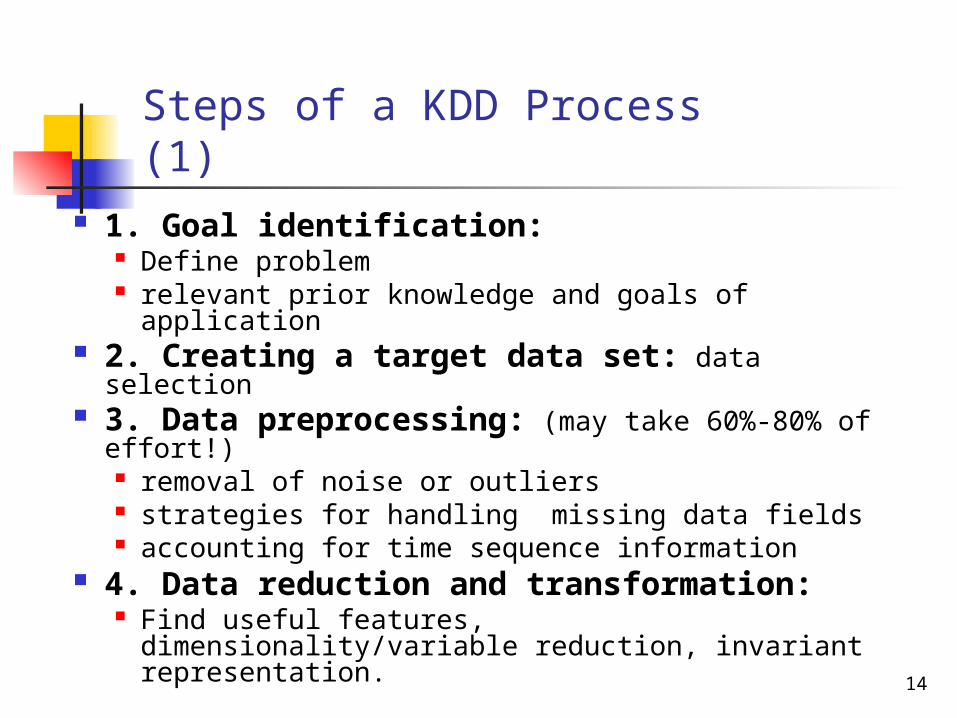
Steps of a KDD Process (1)
1. Goal identification: Define problem relevant prior knowledge and goals of
application 2. Creating a target data set: data
selection 3. Data preprocessing: (may take 60%-80%
of effort!) removal of noise or outliers strategies for handling missing data fields accounting for time sequence information
4. Data reduction and transformation: Find useful features, dimensionality/variable
reduction, invariant representation.
15
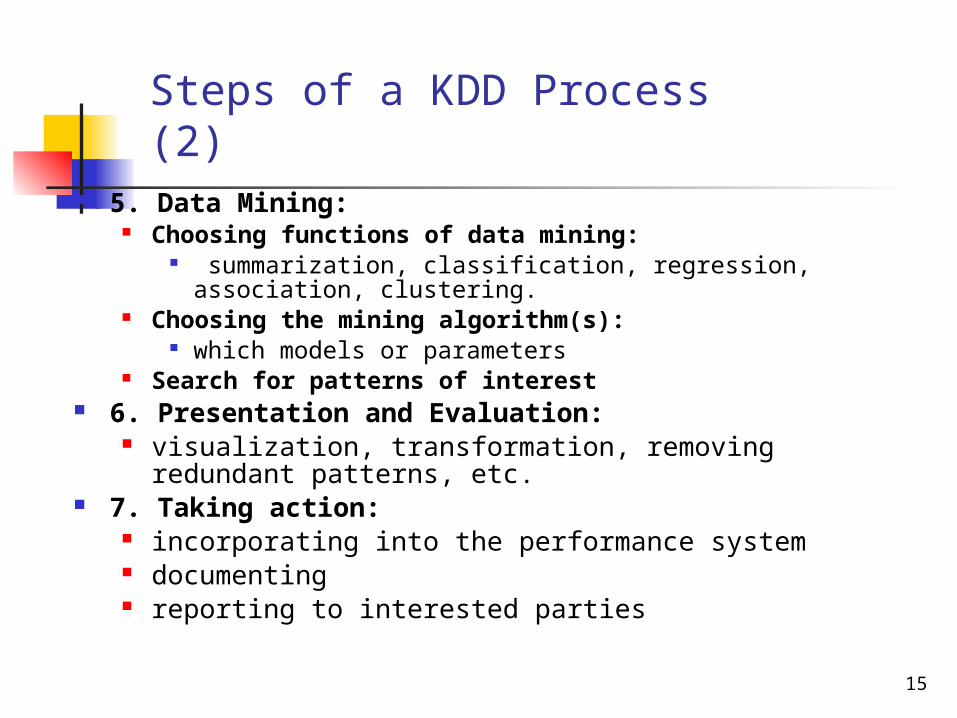
Steps of a KDD Process (2)
5. Data Mining: Choosing functions of data mining:
summarization, classification, regression, association, clustering.
Choosing the mining algorithm(s): which models or parameters
Search for patterns of interest 6. Presentation and Evaluation:
visualization, transformation, removing redundant patterns, etc.
7. Taking action: incorporating into the performance system documenting reporting to interested parties
16
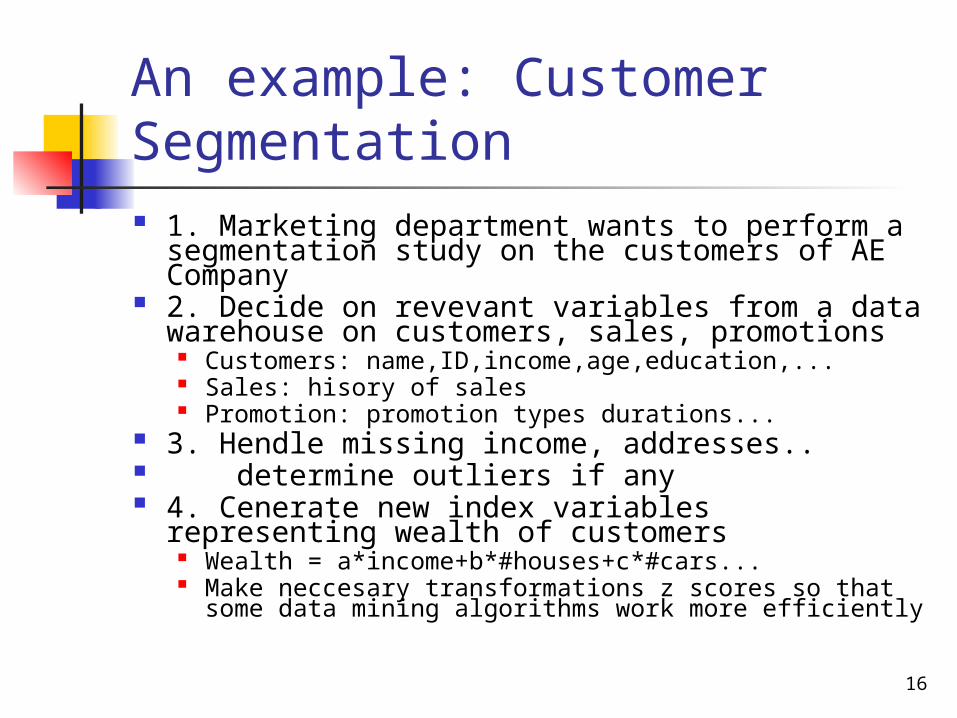
An example: Customer Segmentation 1. Marketing department wants to perform a
segmentation study on the customers of AE Company
2. Decide on revevant variables from a data warehouse on customers, sales, promotions
Customers: name,ID,income,age,education,... Sales: hisory of sales Promotion: promotion types durations...
3. Hendle missing income, addresses.. determine outliers if any 4. Cenerate new index variables representing
wealth of customers Wealth = a*income+b*#houses+c*#cars... Make neccesary transformations z scores so that some
data mining algorithms work more efficiently
17
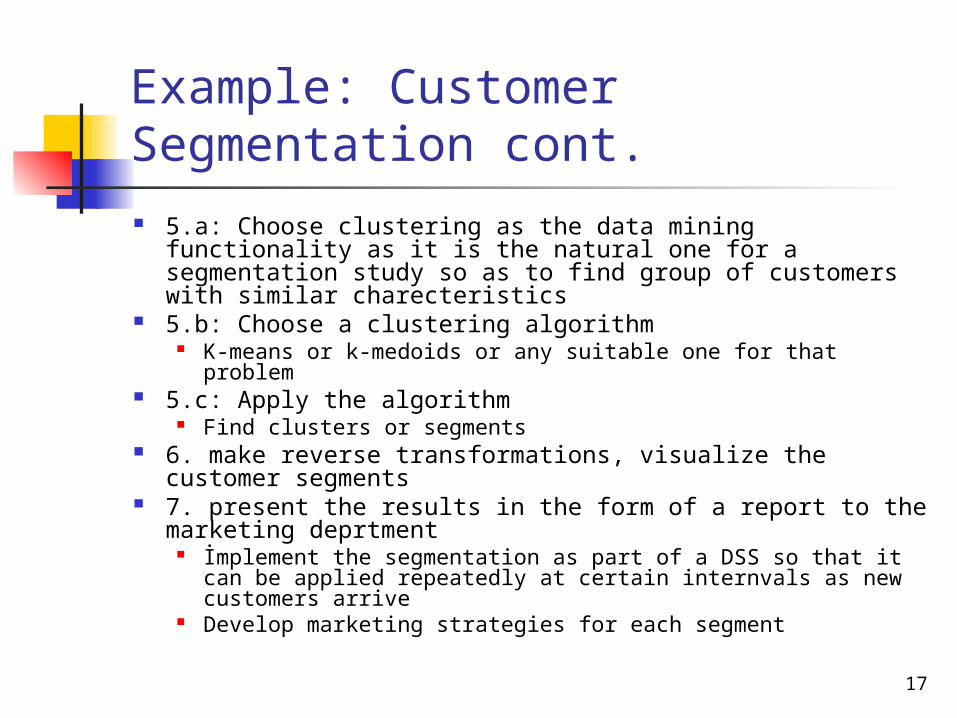
Example: Customer Segmentation cont. 5.a: Choose clustering as the data mining functionality
as it is the natural one for a segmentation study so as to find group of customers with similar charecteristics
5.b: Choose a clustering algorithm K-means or k-medoids or any suitable one for that problem
5.c: Apply the algorithm Find clusters or segments
6. make reverse transformations, visualize the customer segments
7. present the results in the form of a report to the marketing deprtment
İmplement the segmentation as part of a DSS so that it can be applied repeatedly at certain internvals as new customers arrive
Develop marketing strategies for each segment
18
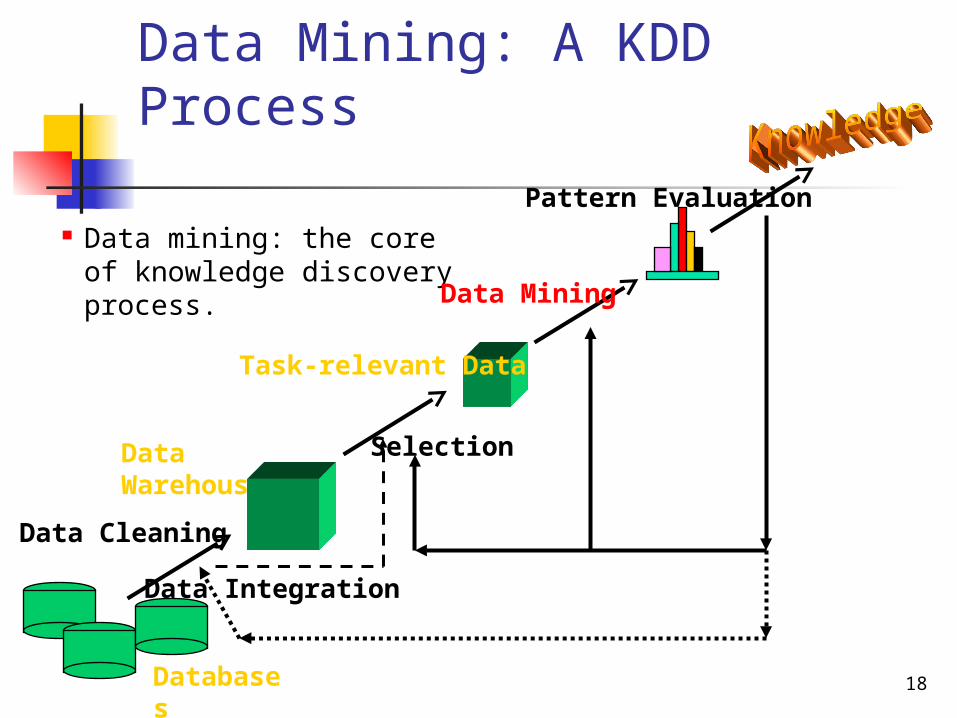
Data Mining: A KDD Process
Data mining: the core of knowledge discovery process.
Data Cleaning
Data Integration
Databases
Data Warehouse
Task-relevant Data
Selection
Data Mining
Pattern Evaluation
19April 19, 2023
Data Mining: Concepts and Techniques 19
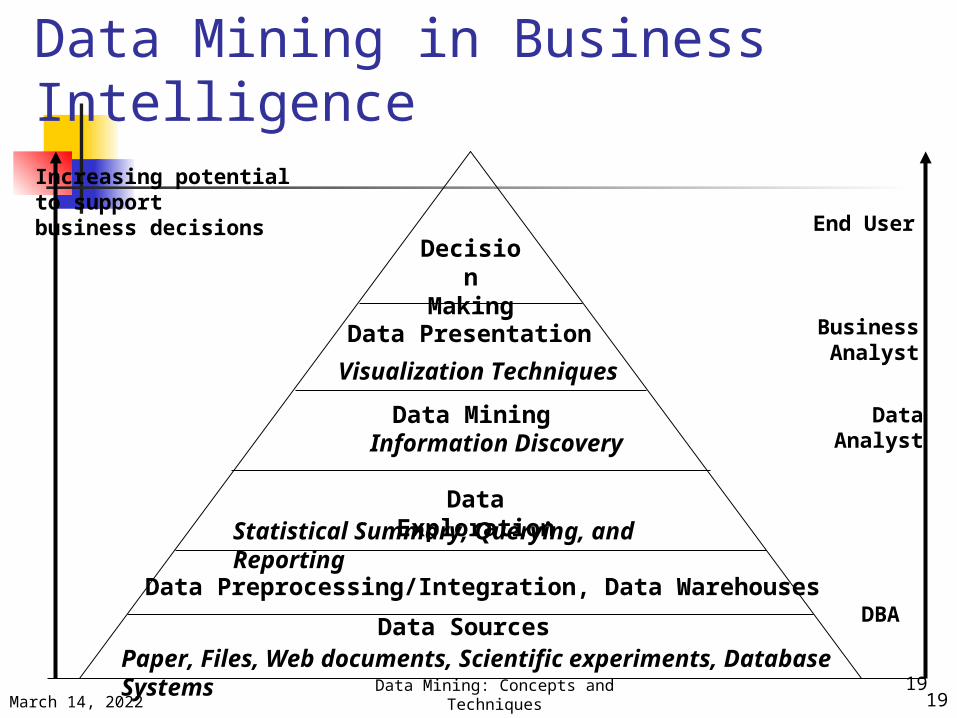
Data Mining in Business Intelligence
Increasing potentialto supportbusiness decisions End User
Business Analyst
DataAnalyst
DBA
Decision
MakingData Presentation
Visualization Techniques
Data MiningInformation Discovery
Data ExplorationStatistical Summary, Querying, and Reporting
Data Preprocessing/Integration, Data Warehouses
Data SourcesPaper, Files, Web documents, Scientific experiments, Database Systems
20
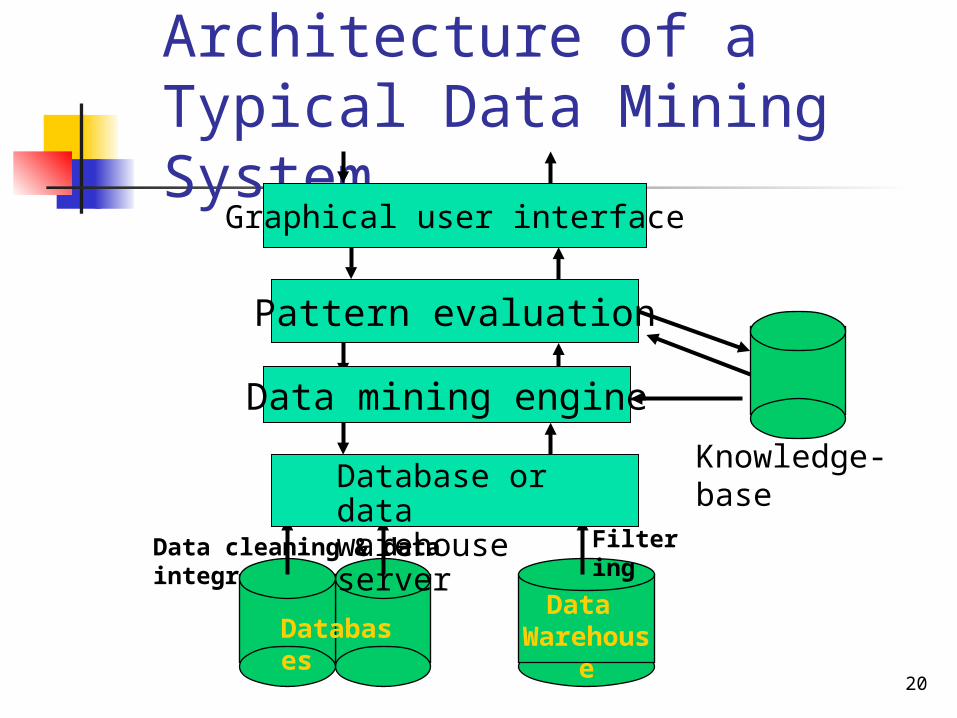
Architecture of a Typical Data Mining System
Data Warehouse
Data cleaning & data integration Filtering
Databases
Database or data warehouse server
Data mining engine
Pattern evaluation
Graphical user interface
Knowledge-base
21
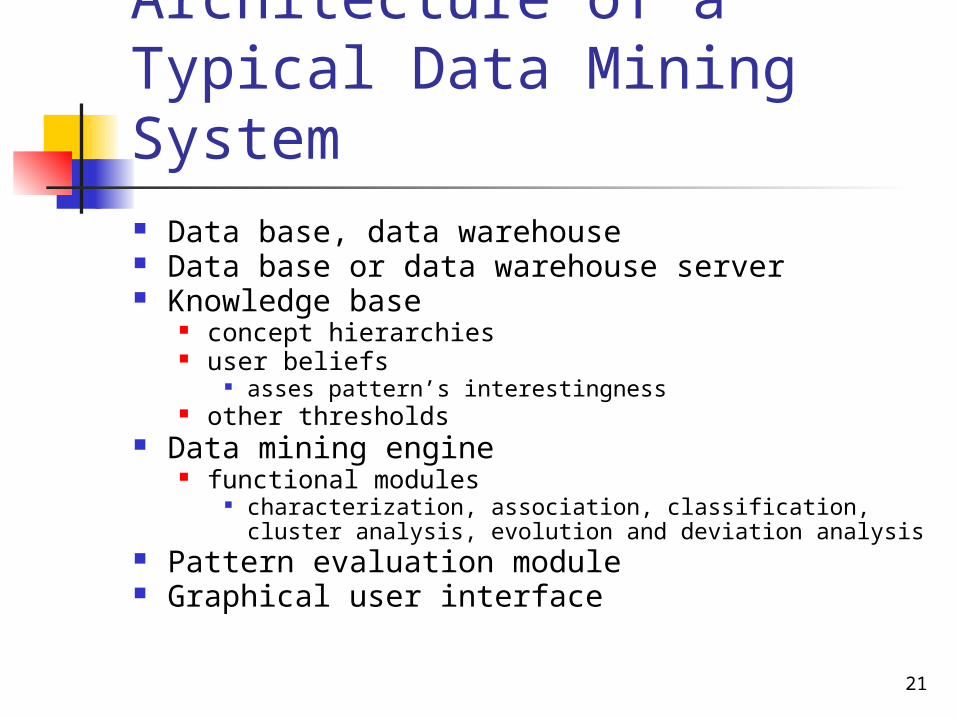
Architecture of a Typical Data Mining System Data base, data warehouse Data base or data warehouse server Knowledge base
concept hierarchies user beliefs
asses pattern’s interestingness other thresholds
Data mining engine functional modules
characterization, association, classification, cluster analysis, evolution and deviation analysis
Pattern evaluation module Graphical user interface
22
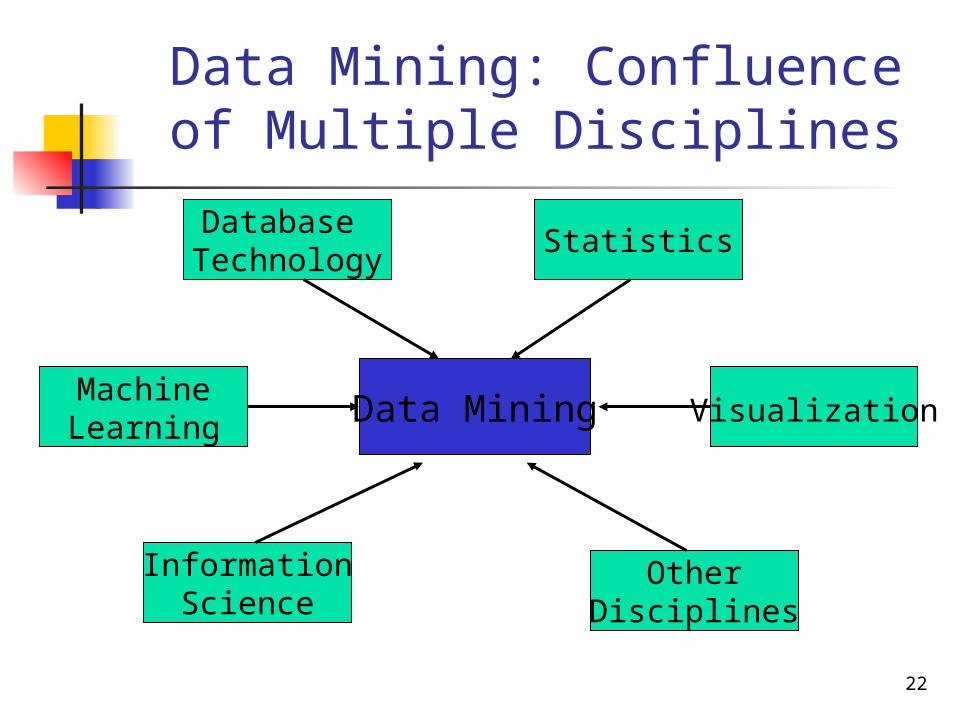
Data Mining: Confluence of Multiple Disciplines
Data Mining
Database Technology
Statistics
OtherDisciplines
InformationScience
MachineLearning Visualization
23April 19, 2023
Data Mining: Concepts and Techniques 23
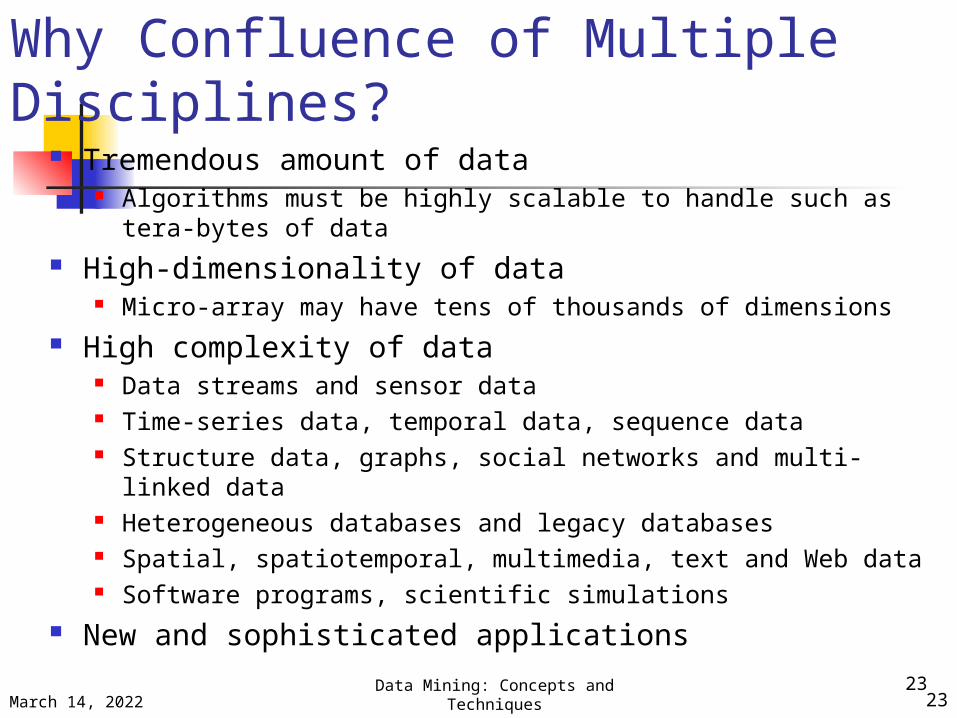
Why Confluence of Multiple Disciplines?
Tremendous amount of data Algorithms must be highly scalable to handle such as tera-
bytes of data High-dimensionality of data
Micro-array may have tens of thousands of dimensions High complexity of data
Data streams and sensor data Time-series data, temporal data, sequence data Structure data, graphs, social networks and multi-linked
data Heterogeneous databases and legacy databases Spatial, spatiotemporal, multimedia, text and Web data Software programs, scientific simulations
New and sophisticated applications
24
Efficient and Scalable Techniques
For an algorithm to be efficient and scalable
its running time should be predictable and acceptable
How Parallel and distributed algorithms Sampling from databases
25
Chapter 1. Introduction
Motivation: Why data mining?
Methodology of Knowledge Discovery in Databases
Data mining functionalities
Are all the patterns interesting?
Business applications of data mining
26
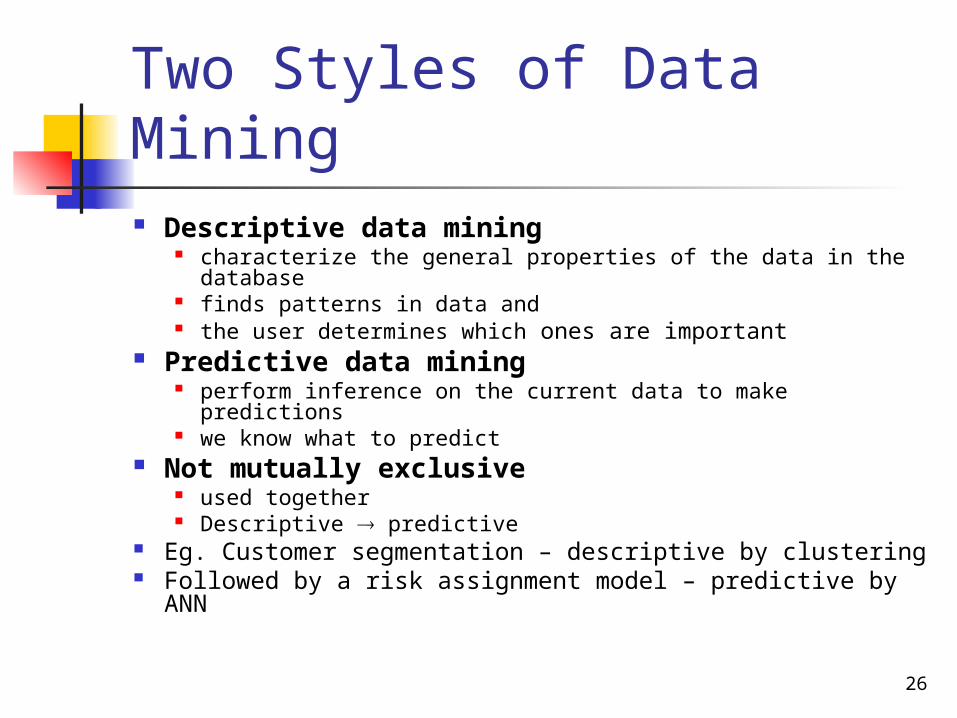
Two Styles of Data Mining Descriptive data mining
characterize the general properties of the data in the database
finds patterns in data and the user determines which ones are important
Predictive data mining perform inference on the current data to make predictions we know what to predict
Not mutually exclusive used together Descriptive predictive
Eg. Customer segmentation – descriptive by clustering Followed by a risk assignment model – predictive by
ANN
27
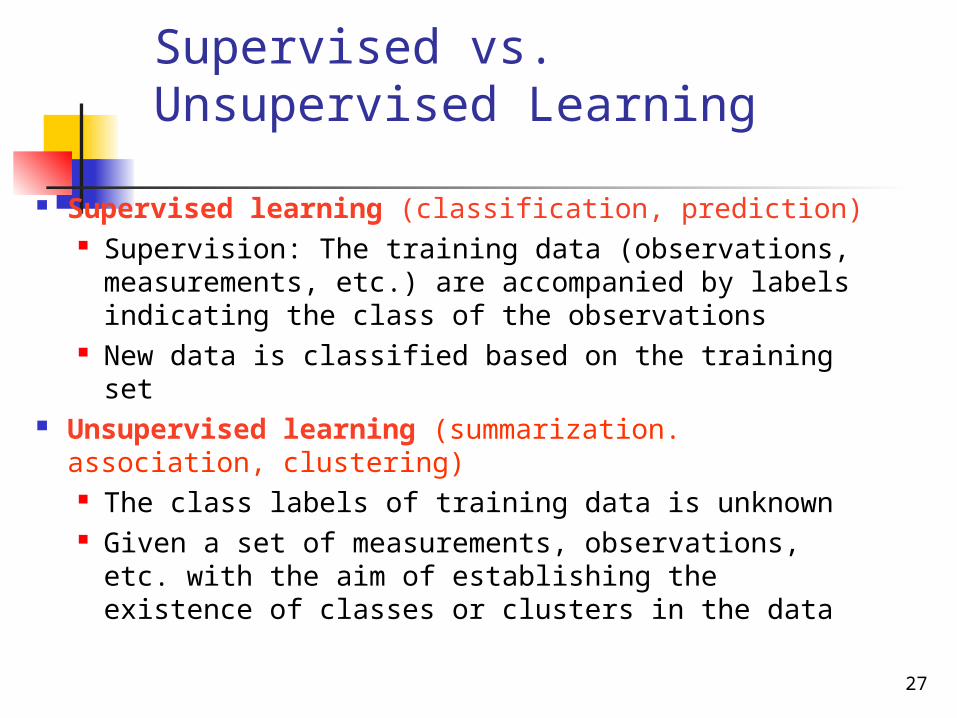
Supervised vs. Unsupervised Learning
Supervised learning (classification, prediction) Supervision: The training data (observations,
measurements, etc.) are accompanied by labels indicating the class of the observations
New data is classified based on the training set Unsupervised learning (summarization.
association, clustering) The class labels of training data is unknown Given a set of measurements, observations,
etc. with the aim of establishing the existence of classes or clusters in the data
28
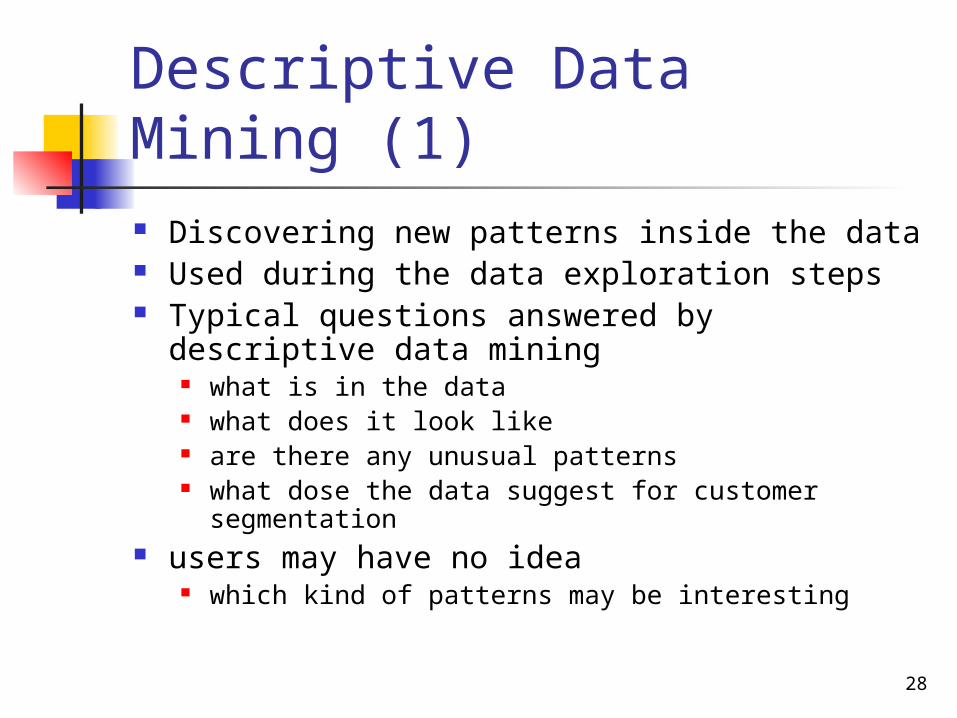
Descriptive Data Mining (1) Discovering new patterns inside the data Used during the data exploration steps Typical questions answered by descriptive
data mining what is in the data what does it look like are there any unusual patterns what dose the data suggest for customer
segmentation users may have no idea
which kind of patterns may be interesting
29
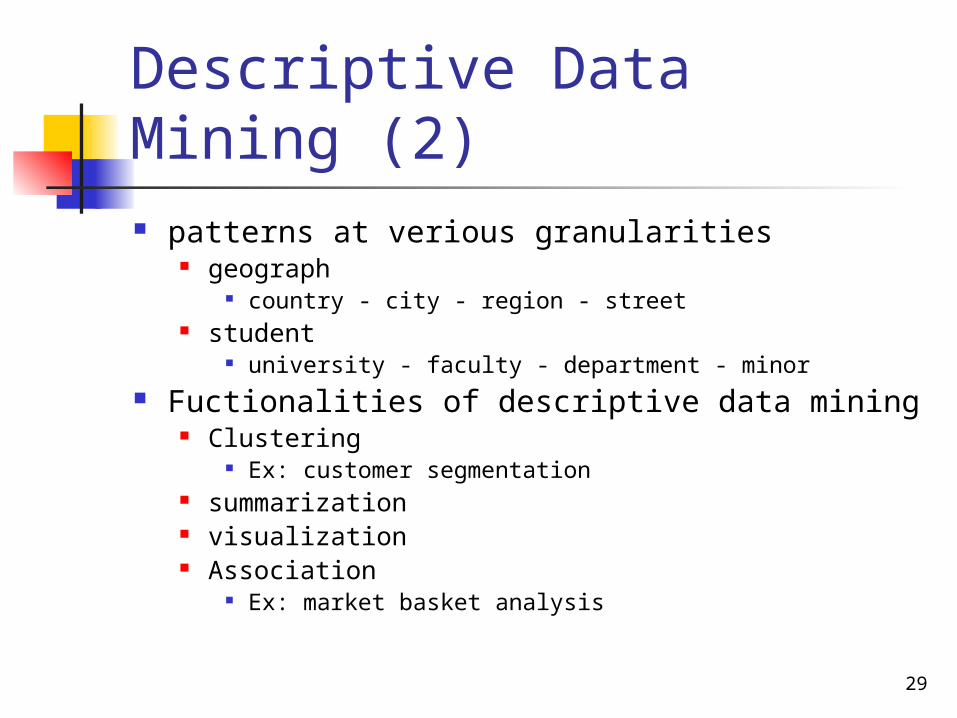
Descriptive Data Mining (2) patterns at verious granularities
geograph country - city - region - street
student university - faculty - department - minor
Fuctionalities of descriptive data mining Clustering
Ex: customer segmentation summarization visualization Association
Ex: market basket analysis
30
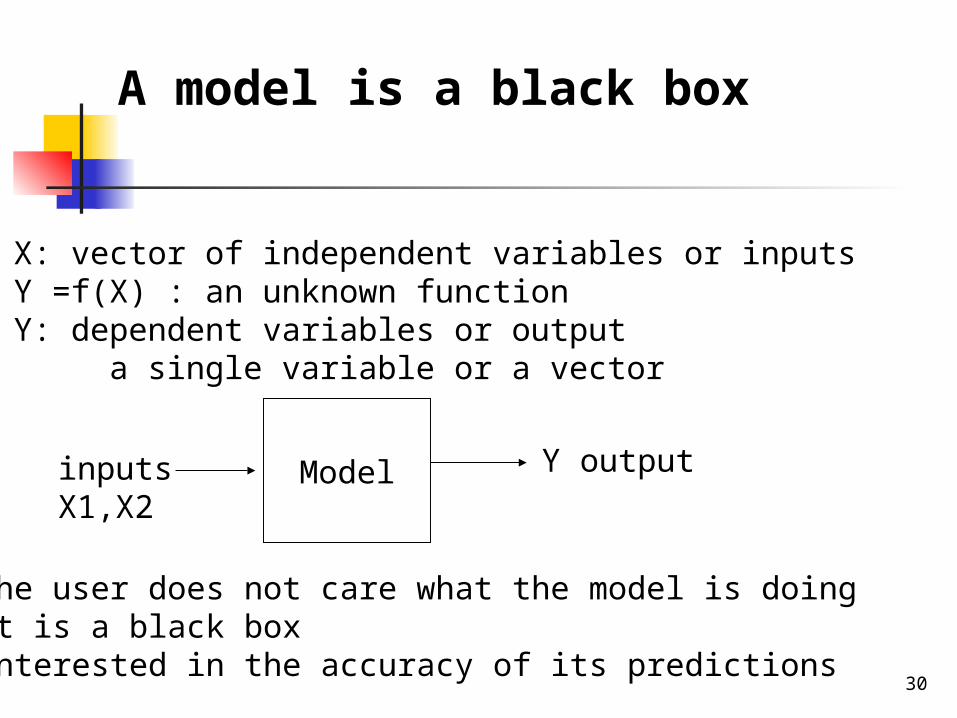
Model Y outputinputsX1,X2
The user does not care what the model is doingit is a black boxinterested in the accuracy of its predictions
X: vector of independent variables or inputsY =f(X) : an unknown functionY: dependent variables or output a single variable or a vector
A model is a black box
31
Predictive Data Mining (1) Using known examples the model is
trained the unknown function is learned from data
the more data with known outcomes is available the better the predictive power of the model
Used to predict outcomes whose inputs are known but the output values are not realized yet
Never %100 accurate
32
Predictive Data Mining (2)
The performance of a model on past data is not important to predict the known outcomes
Its performance on unknown data is much more important
33
Typical questions answered by predictive models Who is likely to respond to our next offer
based on history of previous marketing campaigns
Which customers are likely to leave in the next six months
What transactions are likely to be fraudulent based on known examples of fraud
What is the total amount spending of a customer in the next month
34
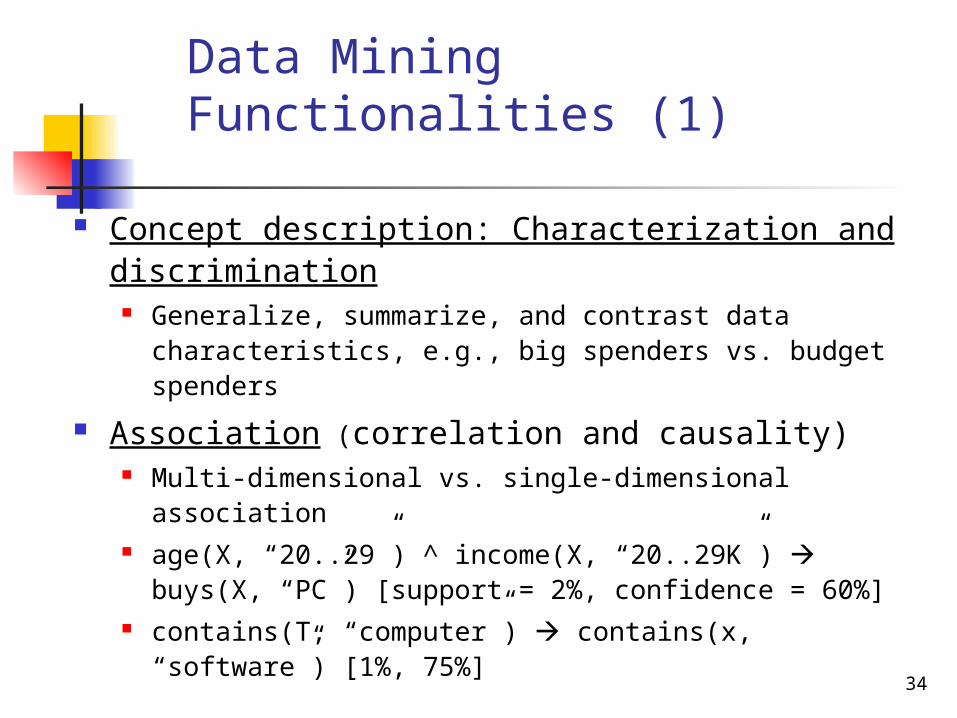
Data Mining Functionalities (1)
Concept description: Characterization and discrimination
Generalize, summarize, and contrast data characteristics, e.g., big spenders vs. budget spenders
Association (correlation and causality) Multi-dimensional vs. single-dimensional association age(X, “20..29”) ^ income(X, “20..29K”) buys(X, “PC”)
[support = 2%, confidence = 60%] contains(T, “computer”) contains(x, “software”) [1%,
75%]
35
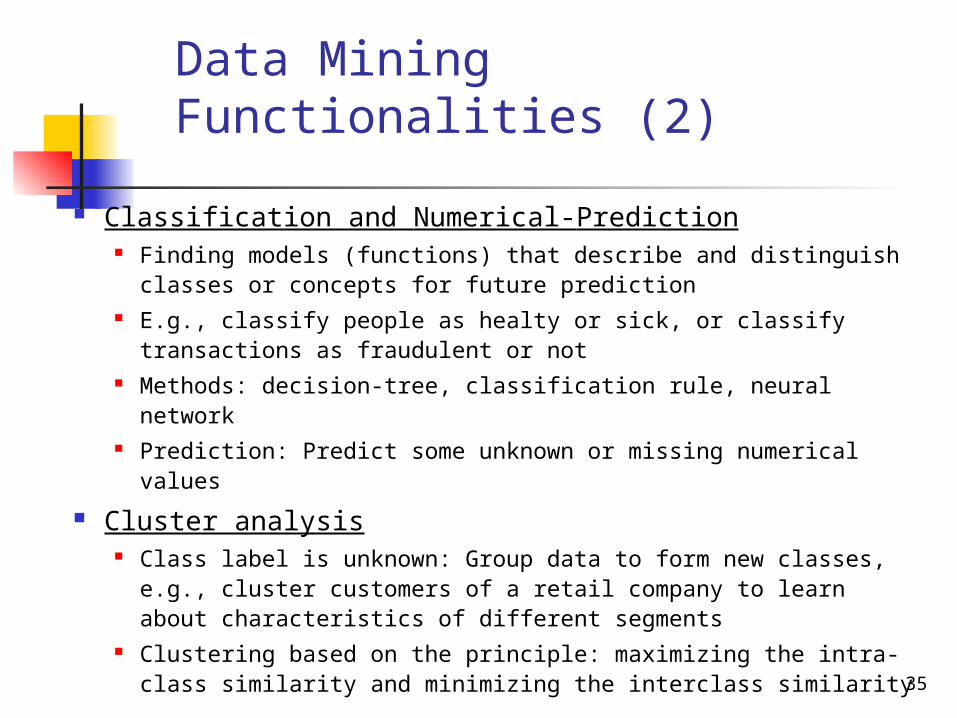
Data Mining Functionalities (2)
Classification and Numerical-Prediction Finding models (functions) that describe and distinguish
classes or concepts for future prediction E.g., classify people as healty or sick, or classify transactions
as fraudulent or not Methods: decision-tree, classification rule, neural network Prediction: Predict some unknown or missing numerical
values
Cluster analysis Class label is unknown: Group data to form new classes,
e.g., cluster customers of a retail company to learn about characteristics of different segments
Clustering based on the principle: maximizing the intra-class similarity and minimizing the interclass similarity
36
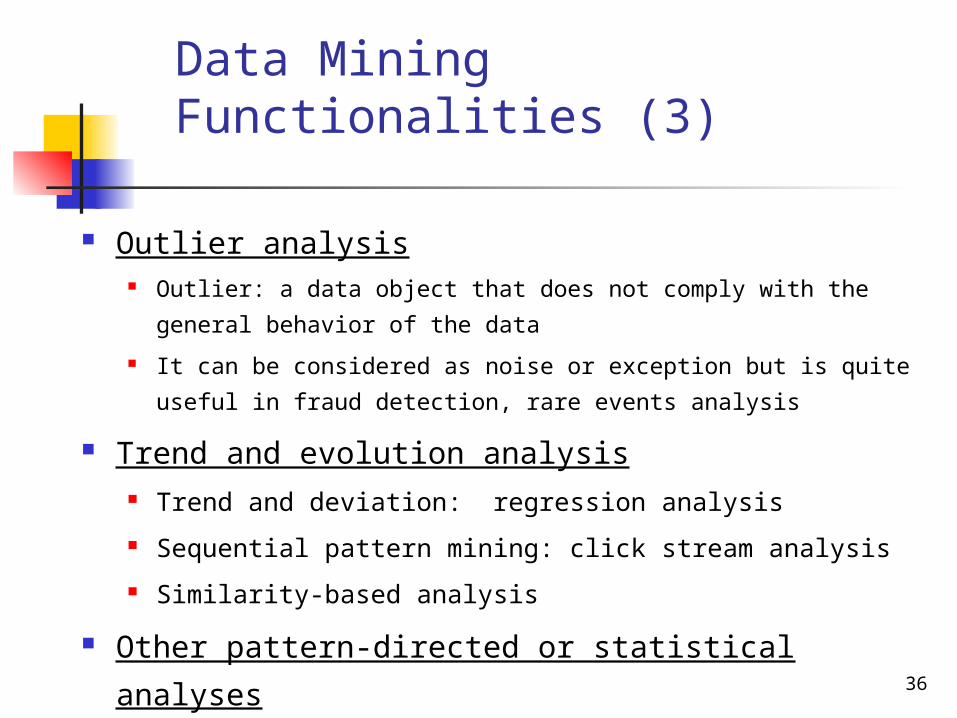
Data Mining Functionalities (3)
Outlier analysis Outlier: a data object that does not comply with the general
behavior of the data
It can be considered as noise or exception but is quite useful
in fraud detection, rare events analysis
Trend and evolution analysis Trend and deviation: regression analysis
Sequential pattern mining: click stream analysis
Similarity-based analysis
Other pattern-directed or statistical analyses
37
Concept Description Characterization Discerimination Data
classes or concpets
classes of items for sale computers, printers
concepts of customers: bigSpenders BudgetSpenders
38
Data Characterization Summarization the data of the class under
study (target class) Methods
SQL queries OLAP roll up -operation
user-controlled data summarization along a specified dimension
attribute oriented induction without step by step user interraction
the output of characterization pie charts, bar chars, curves, multidimensional data
cube, or cross tabs in rule form as characteristic rules
39
Characterization example
Description summarizing the characteristics of customers who spend more than $1000 a year at AllElecronics age, employment, income drill down on any dimension
on occupation view these according to their type of employment
40
Data Discrimination Comparing the target class with one or a
set of comparative classes (contrasting classes) these classes can be specified by the use
database queries methods and output
similar to those used for characterization include comparative measures to distinguish
between the target and contrasting classes
41
Discrimination examples Example 1:Compare the general features of software products
whose sales increased by %10 in the last year (target class) whose sales decreased by at least %30 during the same period
(contrasting class) Example 2: Compare two groups of AE customers
I) who shop for computer products regularly (target class) more than two times a month
II) who rarely shop for such products (contrasting class) less than three times a year
The resulting description: %80 of I group customers
university education ages 20-40
%60 of II group customers seniors or young no university degree
42
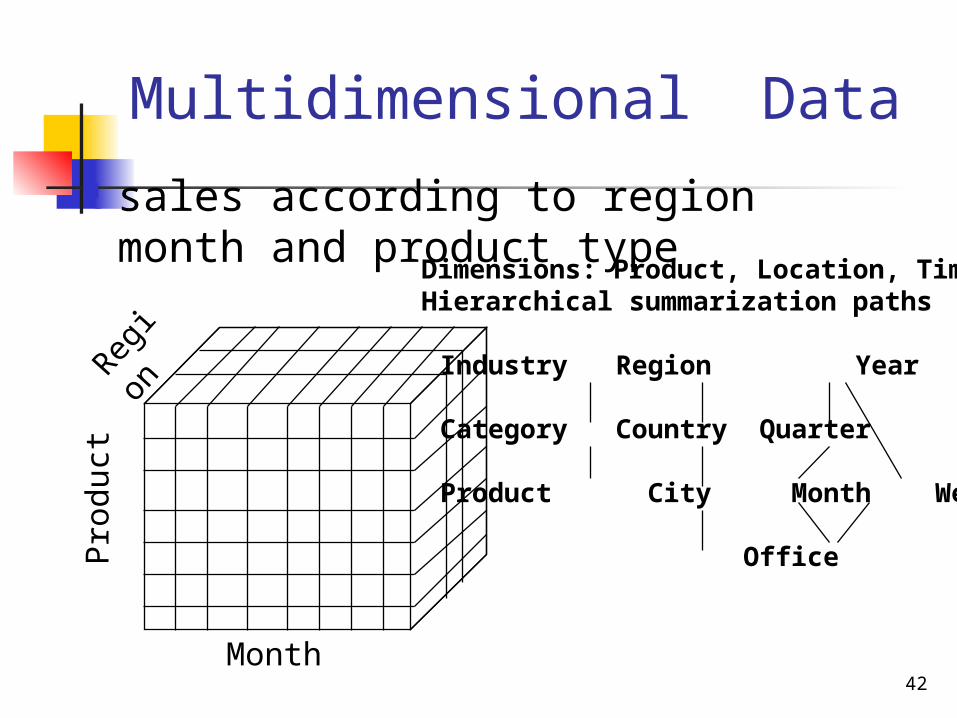
Multidimensional Data sales according to region month and
product type
Product
Region
Month
Dimensions: Product, Location, TimeHierarchical summarization paths
Industry Region Year
Category Country Quarter
Product City Month Week
Office Day
43
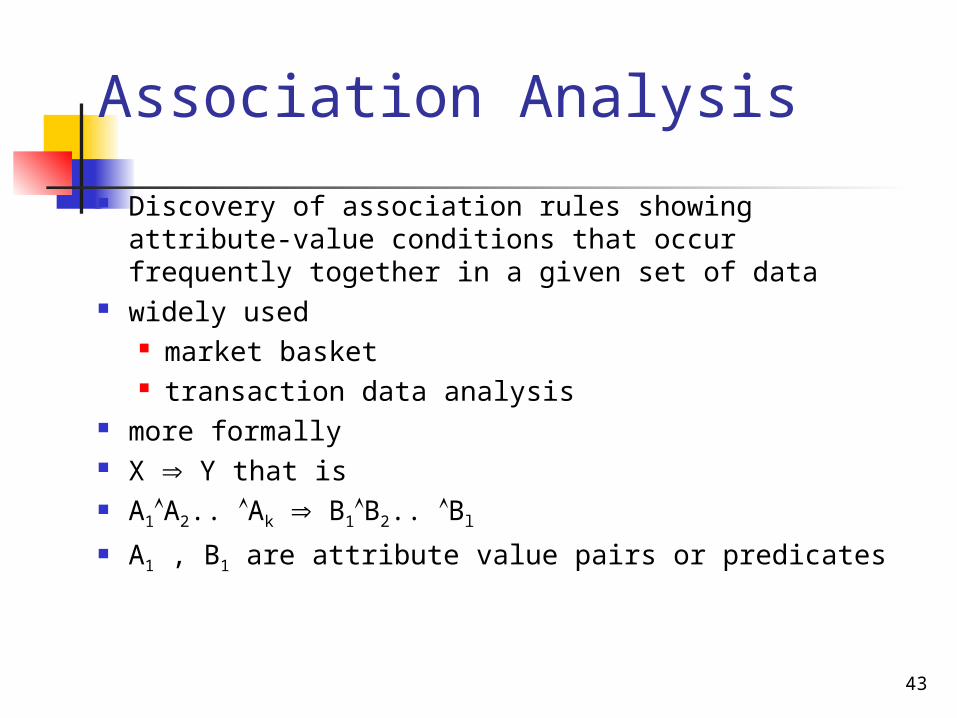
Association Analysis
Discovery of association rules showing attribute-value conditions that occur frequently together in a given set of data
widely used market basket transaction data analysis
more formally X Y that is A1A2.. Ak B1B2.. Bl
A1 , B1 are attribute value pairs or predicates
44
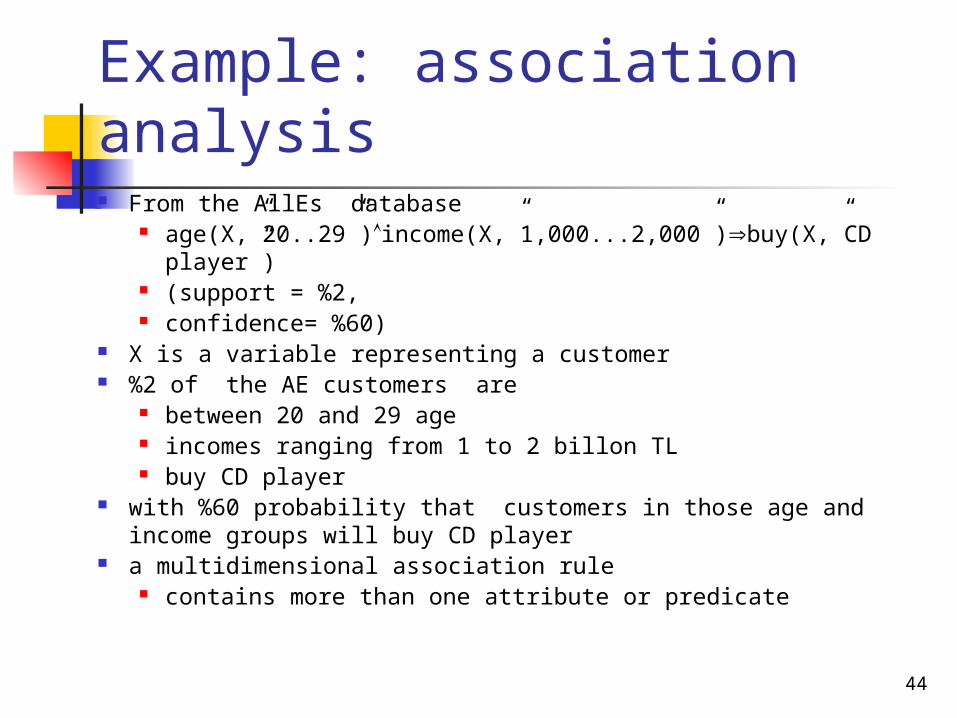
Example: association analysis From the AllEs database
age(X,”20..29”)income(X,”1,000...2,000”)buy(X,”CD player”)
(support = %2, confidence= %60)
X is a variable representing a customer %2 of the AE customers are
between 20 and 29 age incomes ranging from 1 to 2 billon TL buy CD player
with %60 probability that customers in those age and income groups will buy CD player
a multidimensional association rule contains more than one attribute or predicate
45
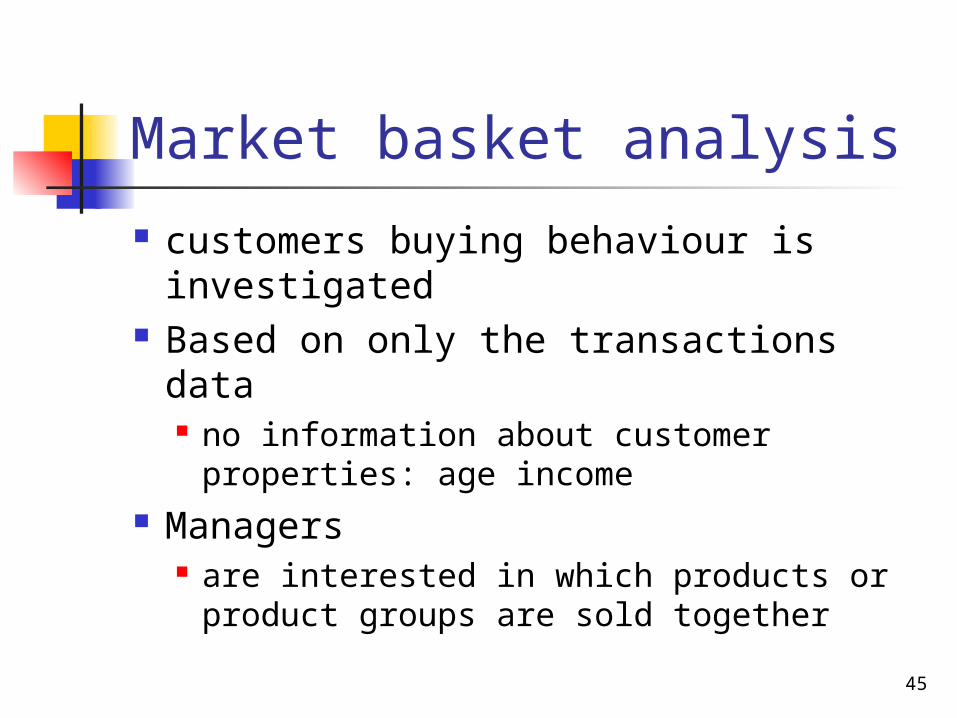
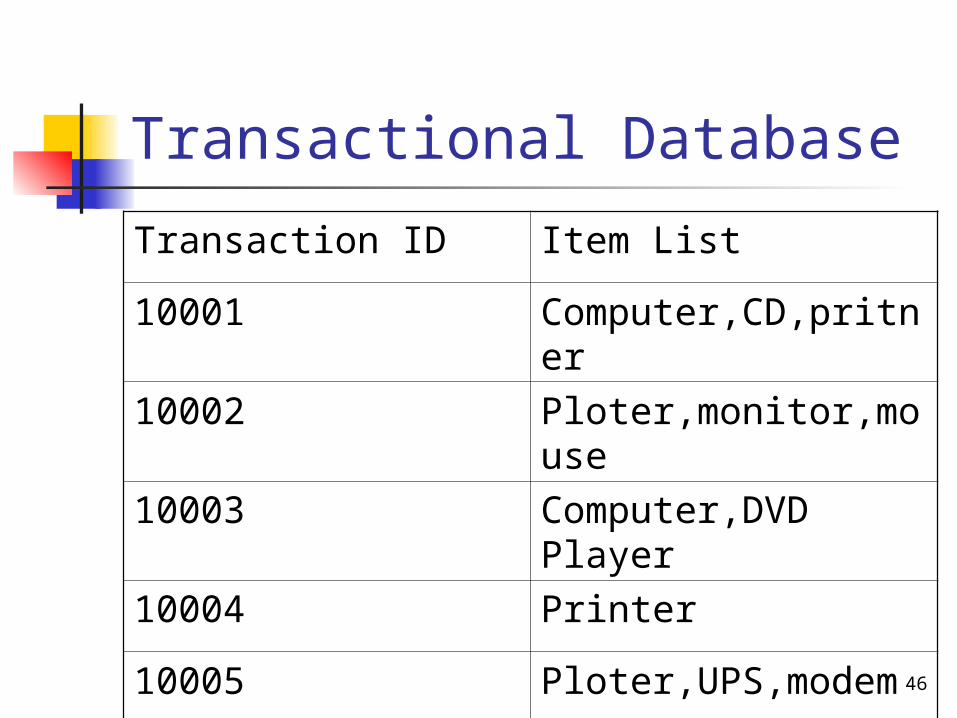
Market basket analysis
customers buying behaviour is investigated
Based on only the transactions data no information about customer
properties: age income Managers
are interested in which products or product groups are sold together
46
Transactional Database
Transaction ID Item List
10001 Computer,CD,pritner
10002 Ploter,monitor,mouse
10003 Computer,DVD Player
10004 Printer
10005 Ploter,UPS,modem
47
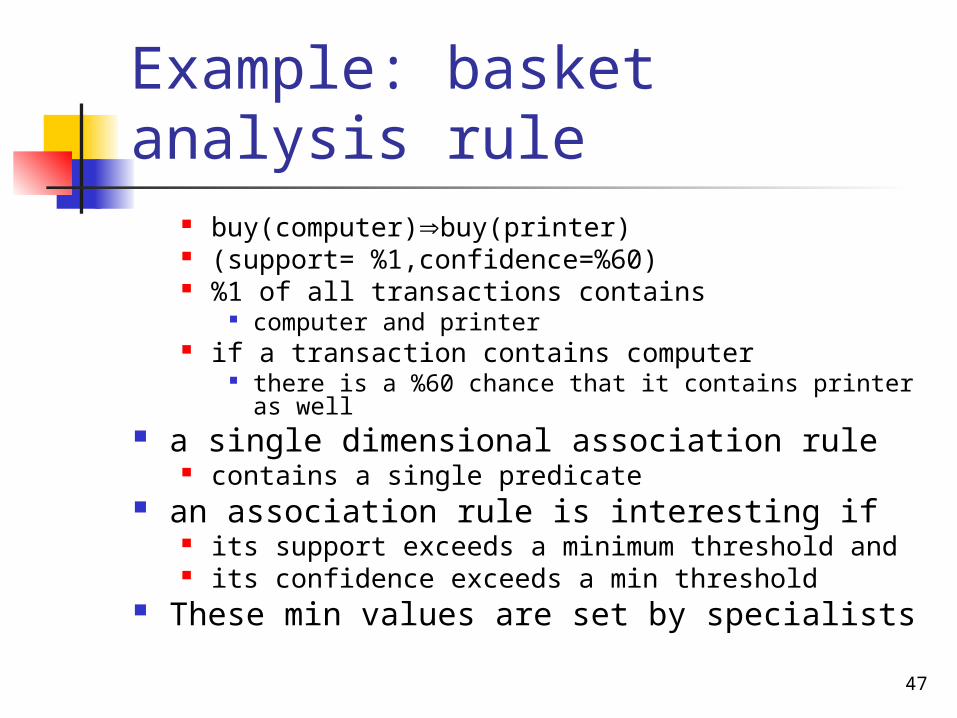
Example: basket analysis rule
buy(computer)buy(printer) (support= %1,confidence=%60) %1 of all transactions contains
computer and printer if a transaction contains computer
there is a %60 chance that it contains printer as well a single dimensional association rule
contains a single predicate an association rule is interesting if
its support exceeds a minimum threshold and its confidence exceeds a min threshold
These min values are set by specialists
48
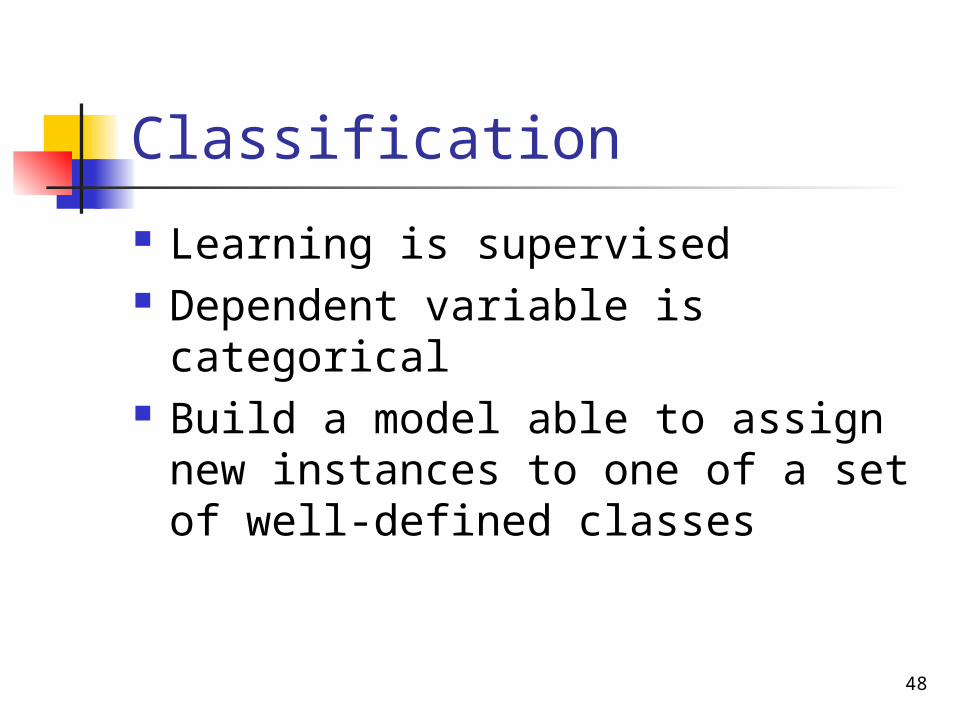
Classification
Learning is supervised Dependent variable is categorical Build a model able to assign new
instances to one of a set of well-defined classes
49
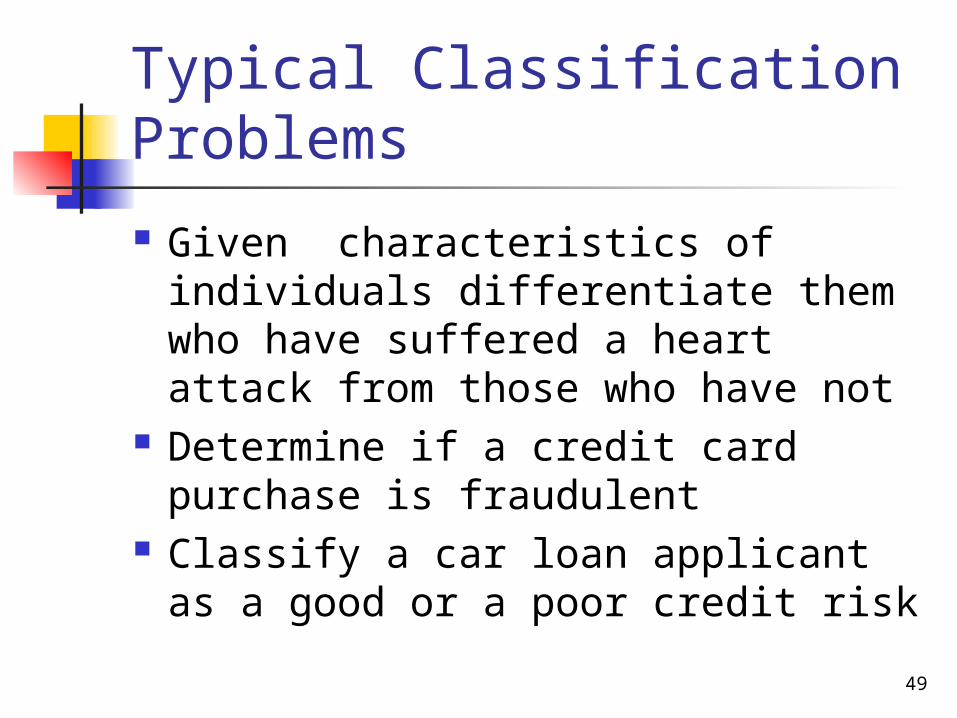
Typical Classification Problems
Given characteristics of individuals differentiate them who have suffered a heart attack from those who have not
Determine if a credit card purchase is fraudulent
Classify a car loan applicant as a good or a poor credit risk
50
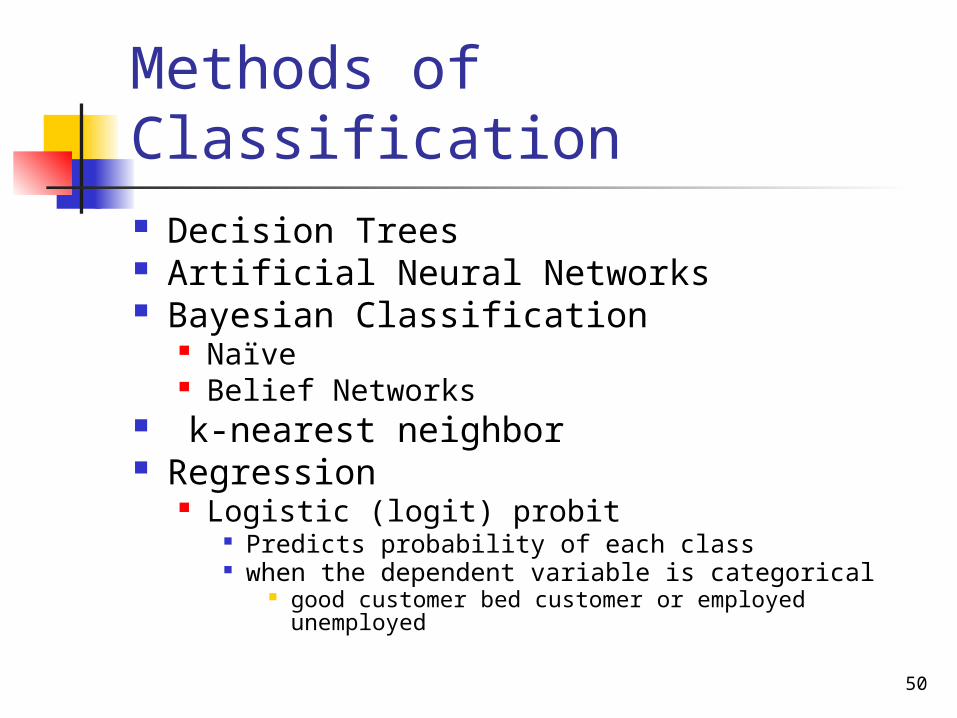
Methods of Classification Decision Trees Artificial Neural Networks Bayesian Classification
Naïve Belief Networks
k-nearest neighbor Regression
Logistic (logit) probit Predicts probability of each class when the dependent variable is categorical
good customer bed customer or employed unemployed
51
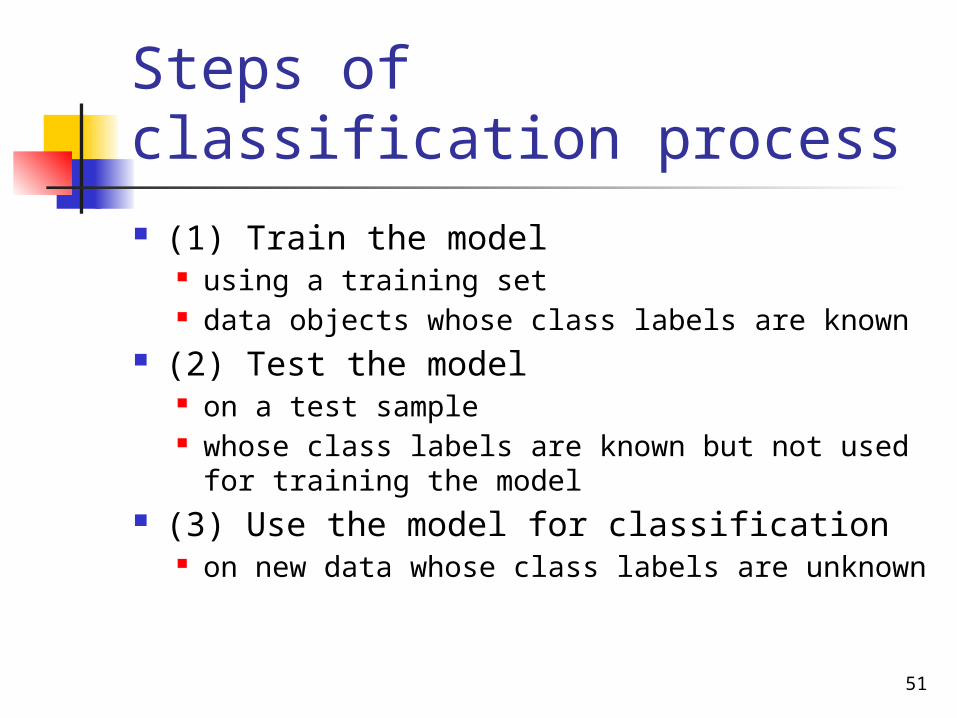
Steps of classification process (1) Train the model
using a training set data objects whose class labels are known
(2) Test the model on a test sample whose class labels are known but not used for
training the model (3) Use the model for classification
on new data whose class labels are unknown
52
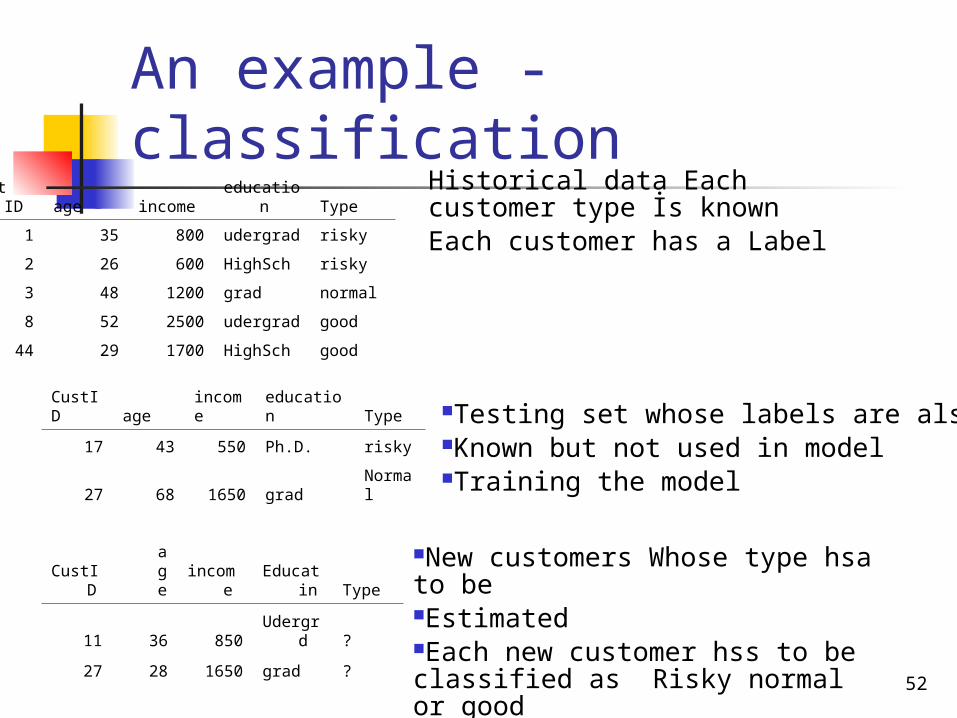
An example - classificationCust ID age income
education Type
1 35 800 udergrad risky
2 26 600 HighSch risky
3 48 1200 grad normal
8 52 2500 udergrad good
44 29 1700 HighSch good
CustID
age
income
Educatin Type
11 36 850Udergr
d ?
27 28 1650 grad ?
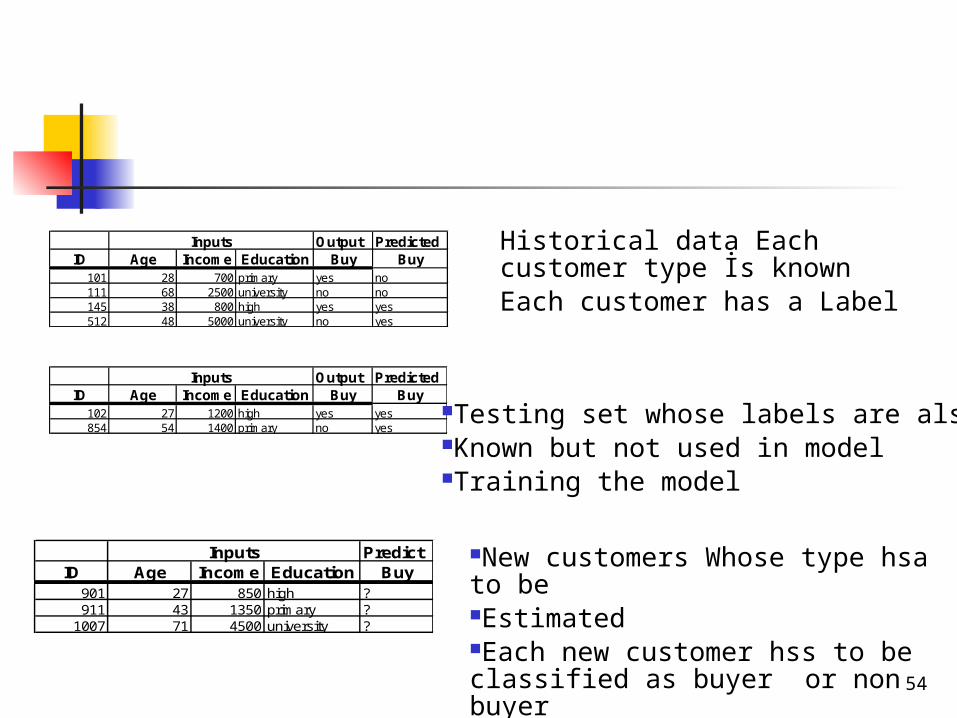
Historical data Each customer type İs known Each customer has a Label
New customers Whose type hsa to beEstimatedEach new customer hss to be classified as Risky normal or good
CustID
age
income education Type
17 43 550 Ph.D. risky
27 68 1650 gradNormal
Testing set whose labels are alsoKnown but not used in modelTraining the model
53
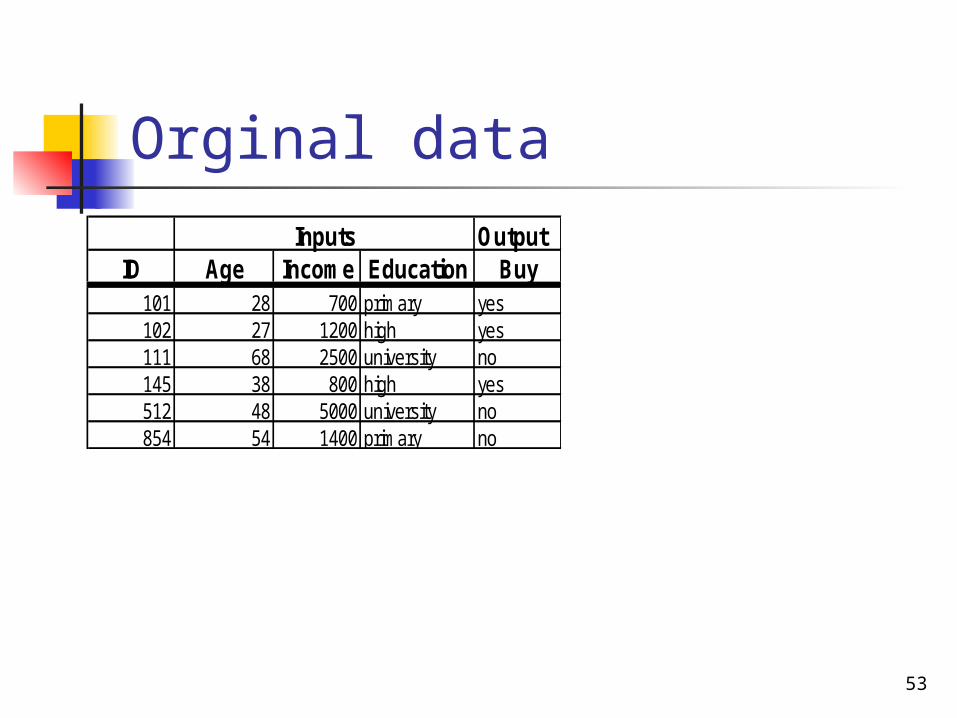
Orginal dataInputs Output
ID Age Income Education Buy101 28 700 primary yes102 27 1200 high yes111 68 2500 university no145 38 800 high yes512 48 5000 university no854 54 1400 primary no
54
Inputs Output PredictedID Age Income Education Buy Buy
101 28 700 primary yes no111 68 2500 university no no145 38 800 high yes yes512 48 5000 university no yes
Inputs Output PredictedID Age Income Education Buy Buy
102 27 1200 high yes yes854 54 1400 primary no yes
Inputs PredictID Age Income Education Buy
901 27 850 high ?911 43 1350 primary ?
1007 71 4500 university ?
Historical data Each customer type İs known Each customer has a Label
Testing set whose labels are alsoKnown but not used in modelTraining the model
New customers Whose type hsa to beEstimatedEach new customer hss to be classified as buyer or non buyer
55
An example – classification cont. Based on historical data develop a
classification model Decision tree, neural network, regression ...
Test the performance of the model on a portion of the historical data
İf accuricy of the model is satisfactory Use the model on the new customers
11 and 27 to assign a type the these new customers
56
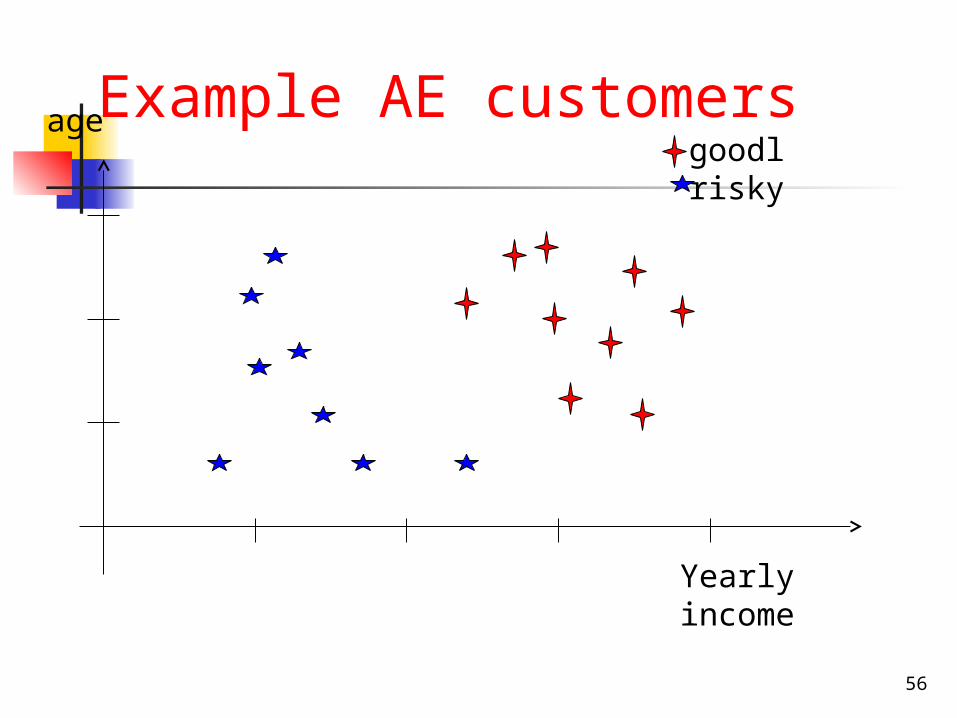
Example AE customers
Yearly income
agegoodlrisky
57
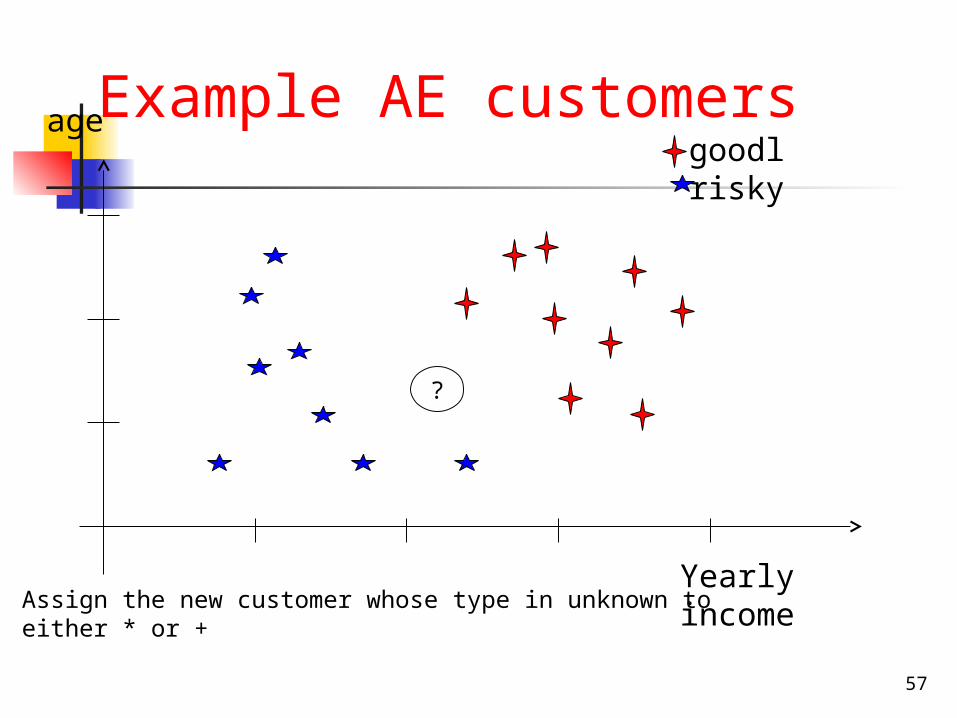
Example AE customers
Yearly income
agegoodlrisky
?
Assign the new customer whose type in unknown to either * or +
58
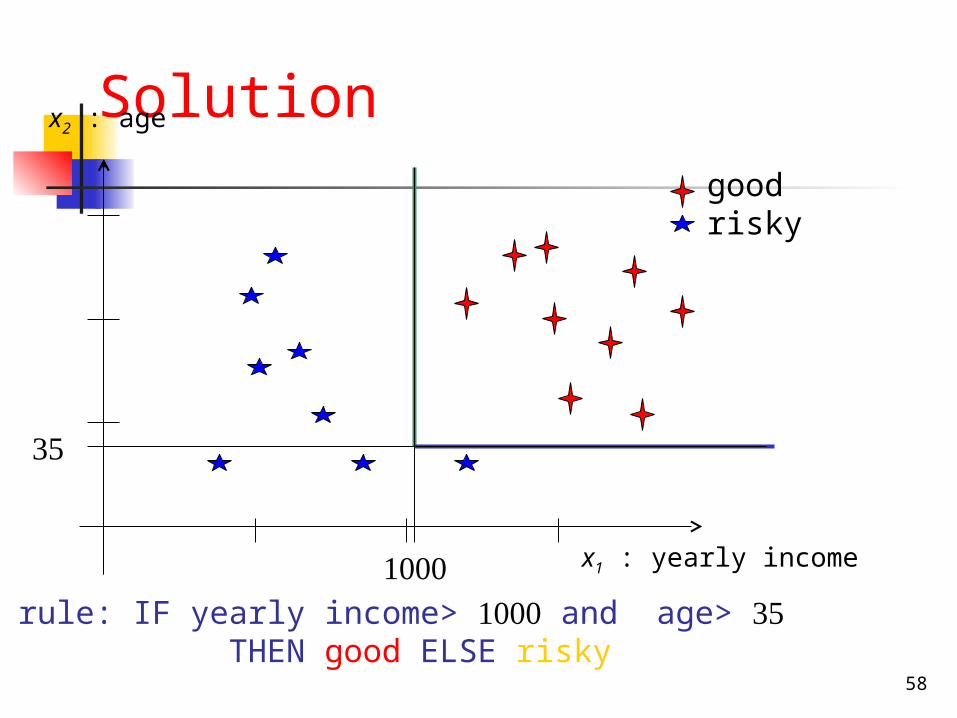
Solution
rule: IF yearly income> and age> THEN good ELSE risky
x2 : age
x1 : yearly income
goodrisky
59
Credit Card Promotion Policy Credit card companies
Promotional offerings with their monthly credit card billing
Offers provide the opportunity to purchase items such as magazines, …
A data mining study Predict individual behaviour What is the likelihood of an individual towards taking
the advantage of promotions based on individual characteristics, credit history.. Expected reduction in postage; paper and processing
costs for the credit card company
60
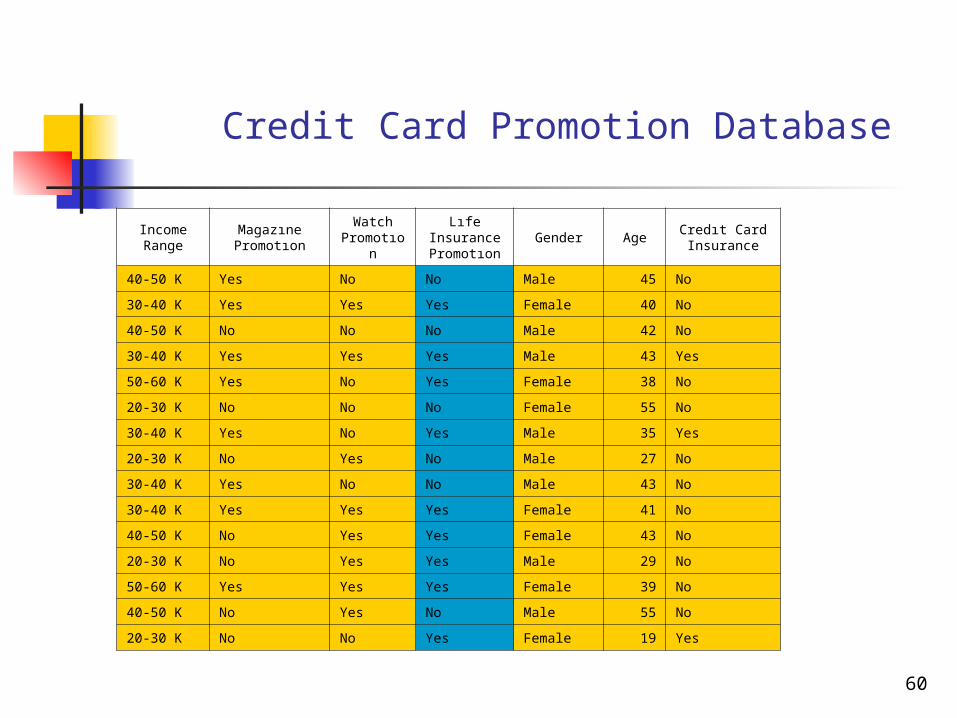
Income Range
Magazıne Promotıon
Watch Promotıon
Lıfe Insurance Promotıon
Gender AgeCredıt Card Insurance
40-50 K Yes No No Male 45 No
30-40 K Yes Yes Yes Female 40 No
40-50 K No No No Male 42 No
30-40 K Yes Yes Yes Male 43 Yes
50-60 K Yes No Yes Female 38 No
20-30 K No No No Female 55 No
30-40 K Yes No Yes Male 35 Yes
20-30 K No Yes No Male 27 No
30-40 K Yes No No Male 43 No
30-40 K Yes Yes Yes Female 41 No
40-50 K No Yes Yes Female 43 No
20-30 K No Yes Yes Male 29 No
50-60 K Yes Yes Yes Female 39 No
40-50 K No Yes No Male 55 No
20-30 K No No Yes Female 19 Yes
Credit Card Promotion Database
61
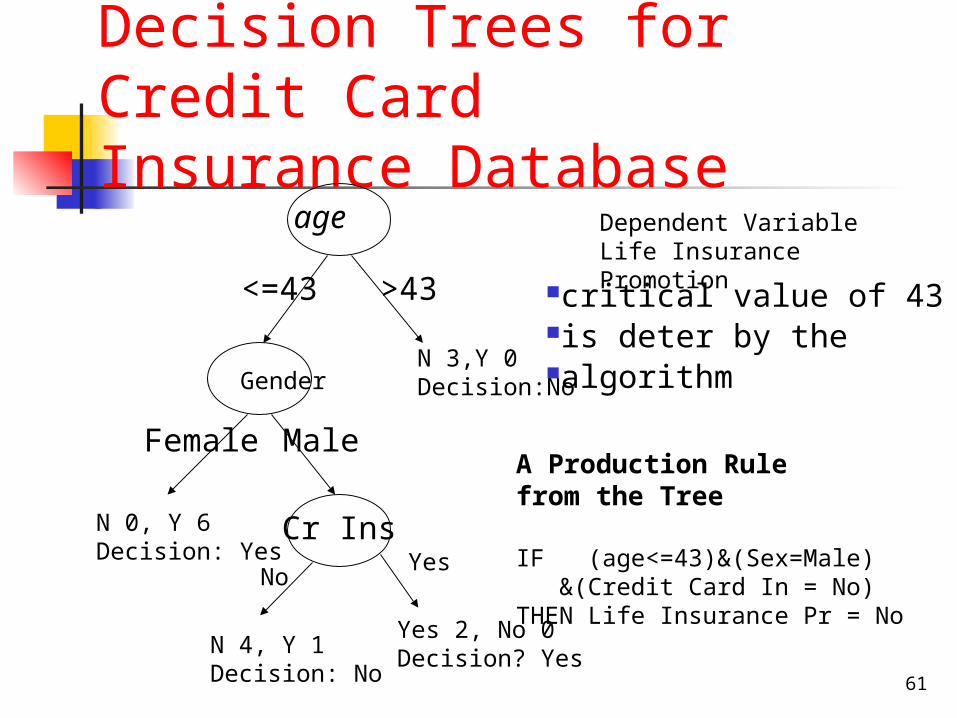
Decision Trees for Credit Card Insurance Database
age
Cr Ins
<=43
Male
>43
Female
critical value of 43is deter by the algorithm
N 3,Y 0Decision:NoGender
N 0, Y 6Decision: Yes Yes
No
N 4, Y 1Decision: No
Yes 2, No 0Decision? Yes
Dependent VariableLife Insurance Promotion
A Production Rule from the Tree
IF (age<=43)&(Sex=Male) &(Credit Card In = No)THEN Life Insurance Pr = No
62
Artificial Neural Networks
Set of interconnected nodes designed to imitate the functioning of the human brain
Feed-forward network Supervised learner model
63
For the promotion example
Encode all variables Assign a numerical value even for
qualitative variables such as sex Say X1 represent gender When
Male X1 =1 Female X1 =0
64
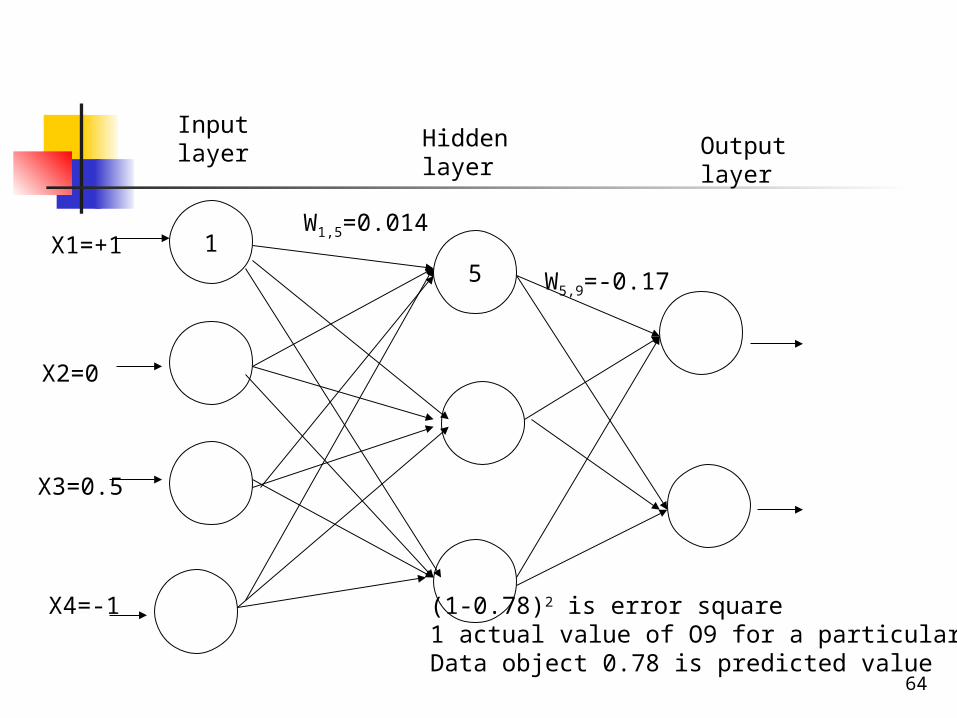
15
X1=+1
X2=0
X3=0.5
X4=-1
Inputlayer
Hiddenlayer
Outputlayer
W1,5=0.014
W5,9=-0.17
(1-0.78)2 is error square 1 actual value of O9 for a particular Data object 0.78 is predicted value
65
Weights updating
Weights between nodes are adjusted so as to reduce error
Details of the training process for neural networks are not important for the time being
66
Numerical-Prediction
Similar to classification Output is a continuous variable Estimation: current value Prediction: future outcome rather
then current behavior
67
Typical Numerical Prediction Problems
Estimate the salary of an individual who owns a sports car
Predict next week`s closing price for the IMKB100 index
Forecast next days temperature
68
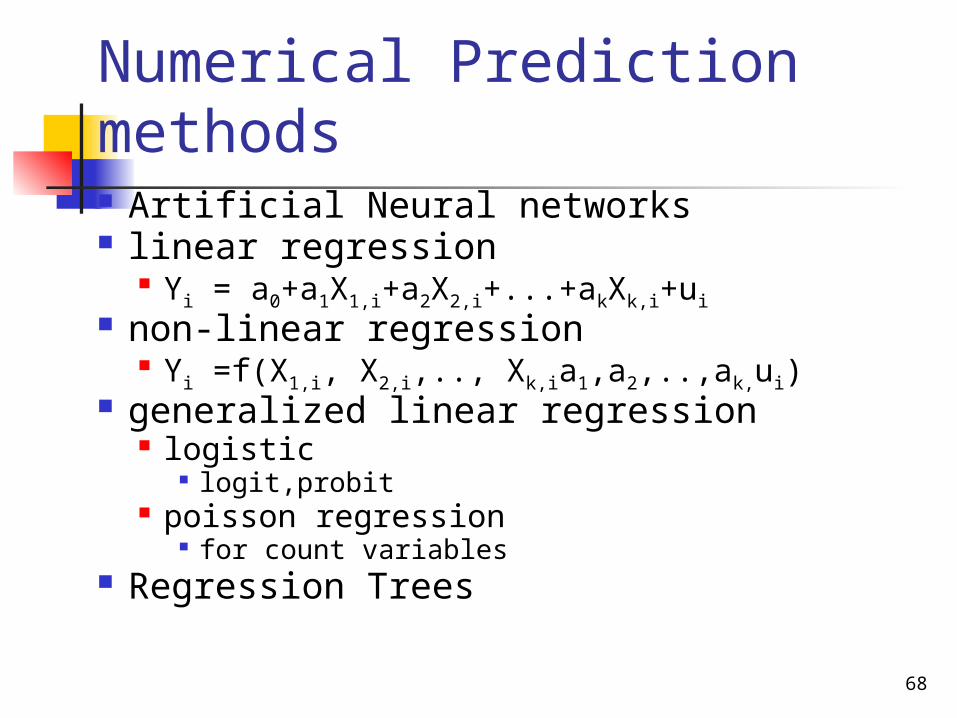
Numerical Prediction methods Artificial Neural networks linear regression
Yi = a0+a1X1,i+a2X2,i+...+akXk,i+ui non-linear regression
Yi =f(X1,i, X2,i,.., Xk,ia1,a2,..,ak,ui) generalized linear regression
logistic logit,probit
poisson regression for count variables
Regression Trees
69
Example:Prediction and Classification Classification is used to classify
customers applying for credit cards known class labels: risky,reliable when a new customer applies looking at her
charecteristics income age education wealth region ...
Customer class is predicted Prediction: The monthly expense of a
new customer ( a real continuous variable ) is predicted based on personal information independent variables
income education wealth profession ... Some are numeric some categorical
70
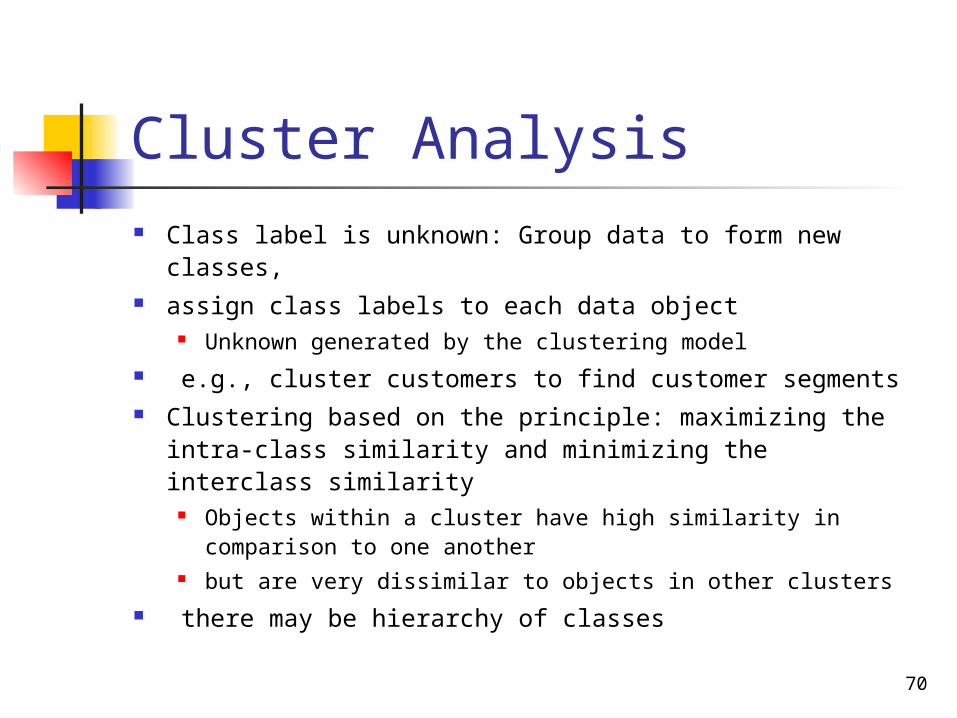
Cluster Analysis Class label is unknown: Group data to form new classes, assign class labels to each data object
Unknown generated by the clustering model e.g., cluster customers to find customer segments Clustering based on the principle: maximizing the intra-
class similarity and minimizing the interclass similarity Objects within a cluster have high similarity in comparison
to one another but are very dissimilar to objects in other clusters
there may be hierarchy of classes
71
Example: Clustering
Can be performed on AE customer data
to identify homogenous subpopulations of customers
represent individual target groups for marketing
72
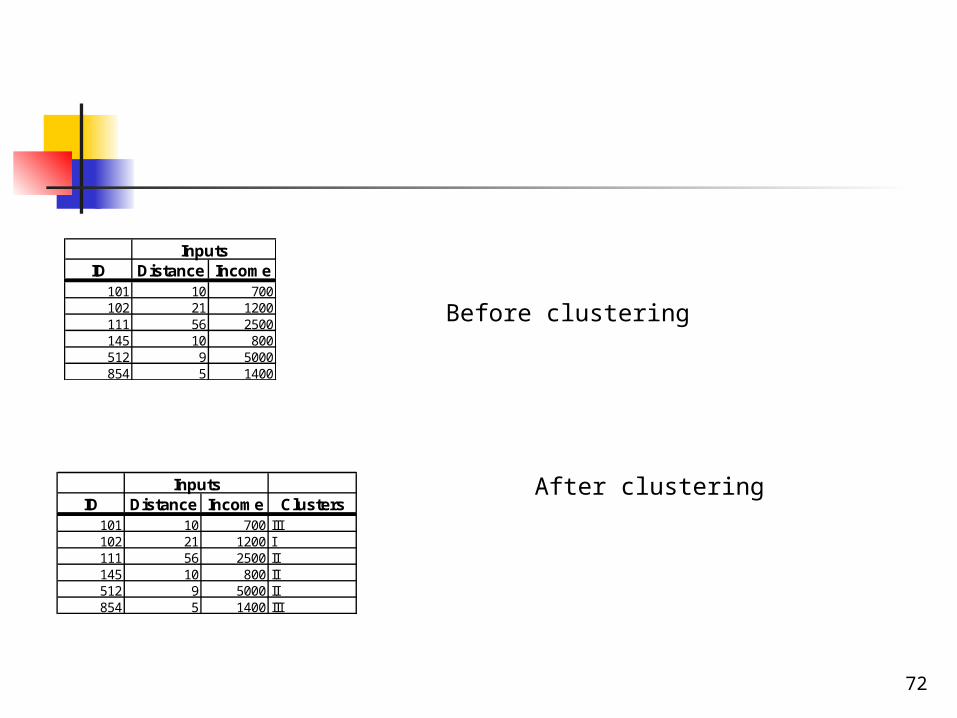
InputsID Distance Income
101 10 700102 21 1200111 56 2500145 10 800512 9 5000854 5 1400
InputsID Distance Income Clusters
101 10 700 III102 21 1200 I111 56 2500 II145 10 800 II512 9 5000 II854 5 1400 III
Before clustering
After clustering
73
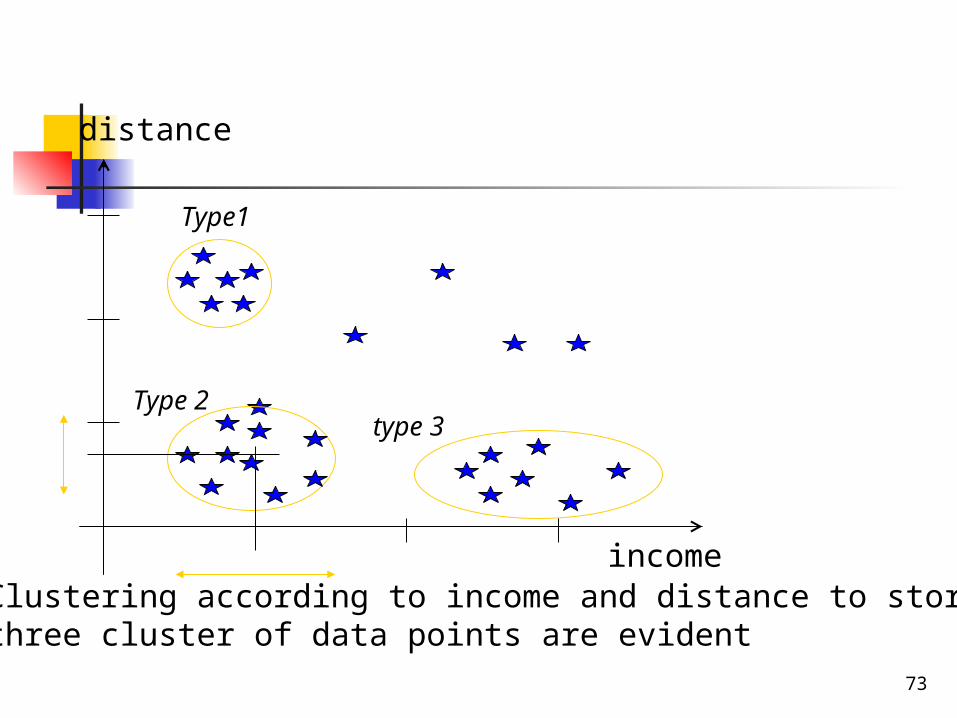
income
distance
Type1
Type 2type 3
Clustering according to income and distance to storethree cluster of data points are evident
74
Outlier Analysis
Outlier: a data object that does not comply with the
general behavior of the data
It can be considered as noise or exception but is quite
useful in fraud detection, rare events analysis
DECTECED using statistical tests
distance measures
visually inspecting the data
Examples:
75
Reasons for outliers
Measurement errors coding errors
age is entered as 999 nature of data
salary of the general manager is much more higher than the other employees
in crisis the interest rate was in the order of 1000s
76
Evolution Analysis
Describes and models regularities or trends for objects
whose behavior changes over time
Distinct features include Trend and deviation: time-series data analysis
Sequential pattern mining, periodicity analysis
Similarity-based analysis
Example Stock market predictions: future stock prices
for overall stocks: indexes or individual company stocks
77
Sequential Pattern Analysis Determine sequential patterns in data Based on time sequence of actions Similar to associations
Relationship is based on time Example 1: buy CD player today buy CD within
one week Example 2: In what sequence web pages of an
e-business company are accessed %70 percents of visitors follows
A B C or A D B C or A E B C He then determines to add a link directly from page
A to page C
78
Chapter 1. Introduction
Motivation: Why data mining?
Methodology of Knowledge Discovery in Databases
Data mining functionalities
Are all the patterns interesting?
Business applications of data mining
79
Are All the “Discovered” Patterns Interesting?
A data mining system/query may generate thousands of
patterns, not all of them are interesting.
Are all patterns interesting? Typically not -only a small fraction of patterns are interesting
to any given user
Interestingness measures: A pattern is interesting if it is easily understood by humans,
valid on new or test data with some degree of certainty,
potentially useful,
novel, or
validates some hypothesis that a user seeks to confirm
80
Objective vs. subjective interestingness measures:
Objective: Objective: based on statistics and structures of
patterns, e.g., support, X Y P(X Y):probability of a transaction contains
both X and Y confidence, degree of certainty of the detected
association P(Y I X) the conditional probability : the probability
that a transaction containing X also contains Y thresholds - controlled by the user ex: rules that do not satisfy a confidence threshold of
%50 are uninteresting Subjective: based on user’s belief in the data, e.g.,
unexpectedness, novelty, actionability, etc.
81
Chapter 1. Introduction
Motivation: Why data mining?
Methodology of Knowledge Discovery in Databases
Data mining functionalities
Are all the patterns interesting?
Business Applications of data mining
82
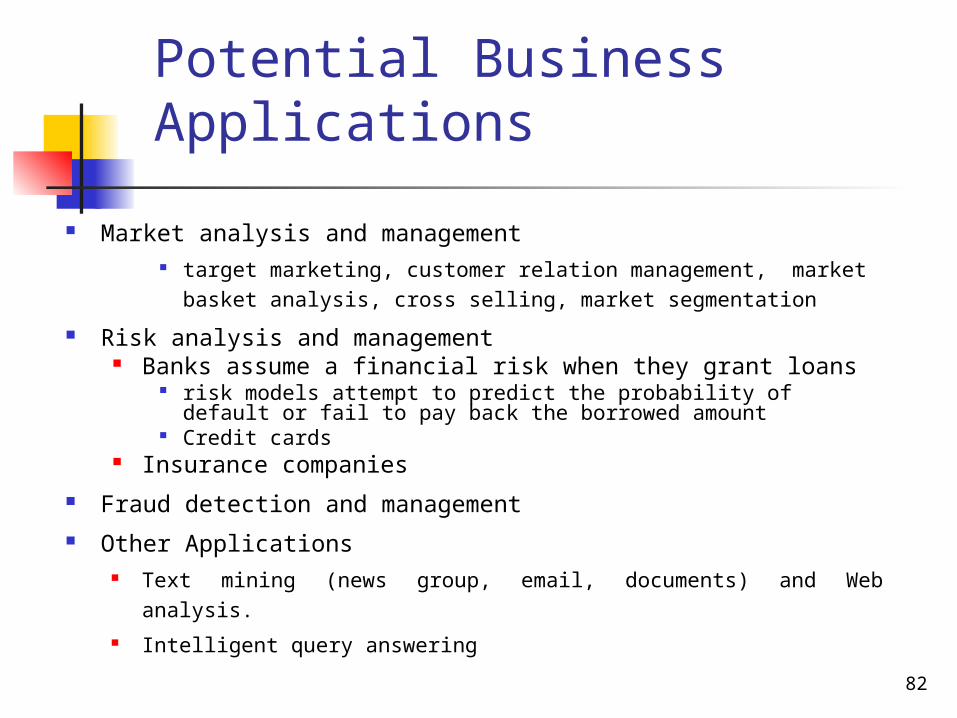
Potential Business Applications
Market analysis and management target marketing, customer relation management, market
basket analysis, cross selling, market segmentation
Risk analysis and management Banks assume a financial risk when they grant loans
risk models attempt to predict the probability of default or fail to pay back the borrowed amount
Credit cards Insurance companies
Fraud detection and management Other Applications
Text mining (news group, email, documents) and Web analysis. Intelligent query answering
83
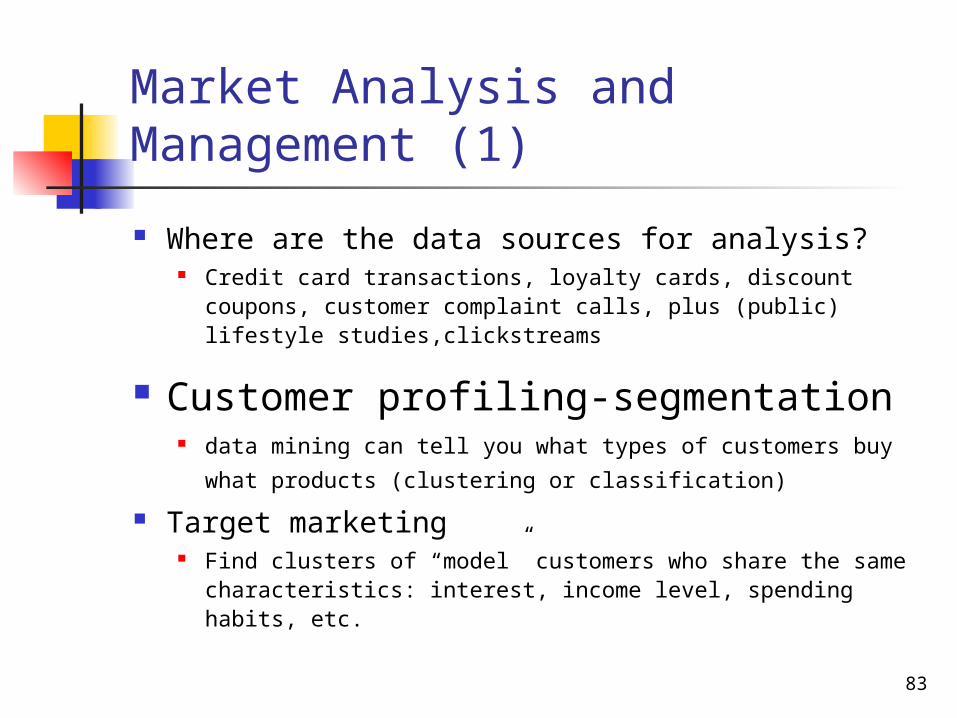
Market Analysis and Management (1)
Where are the data sources for analysis? Credit card transactions, loyalty cards, discount coupons,
customer complaint calls, plus (public) lifestyle studies,clickstreams
Customer profiling-segmentation data mining can tell you what types of customers buy what
products (clustering or classification)
Target marketing Find clusters of “model” customers who share the same
characteristics: interest, income level, spending habits, etc.
84
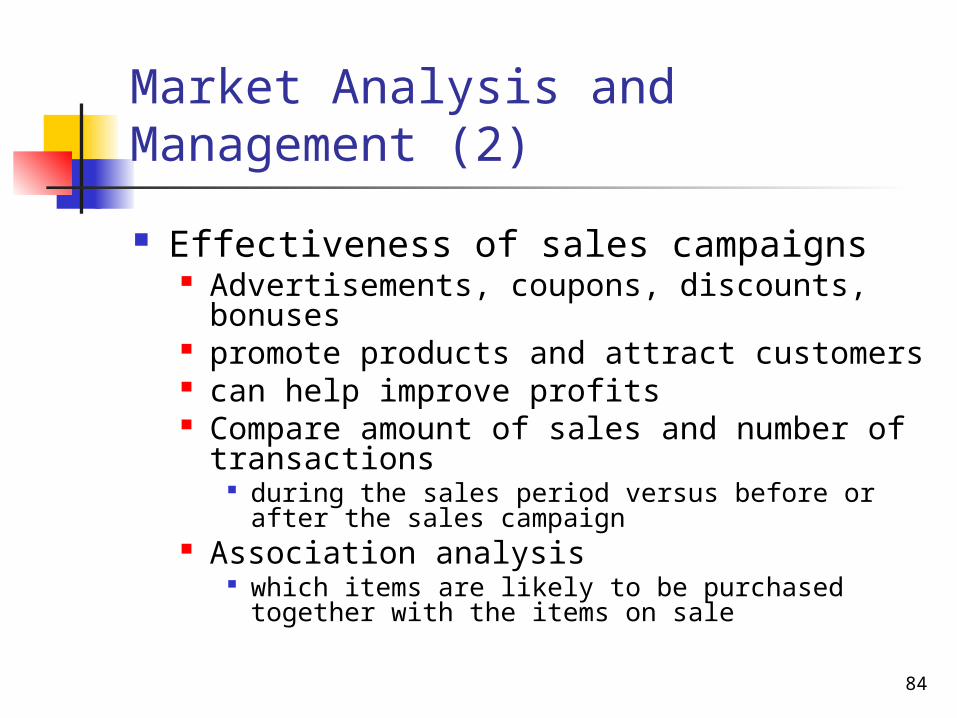
Market Analysis and Management (2)
Effectiveness of sales campaigns Advertisements, coupons, discounts,
bonuses promote products and attract customers can help improve profits Compare amount of sales and number of
transactions during the sales period versus before or after the
sales campaign Association analysis
which items are likely to be purchased together with the items on sale
85
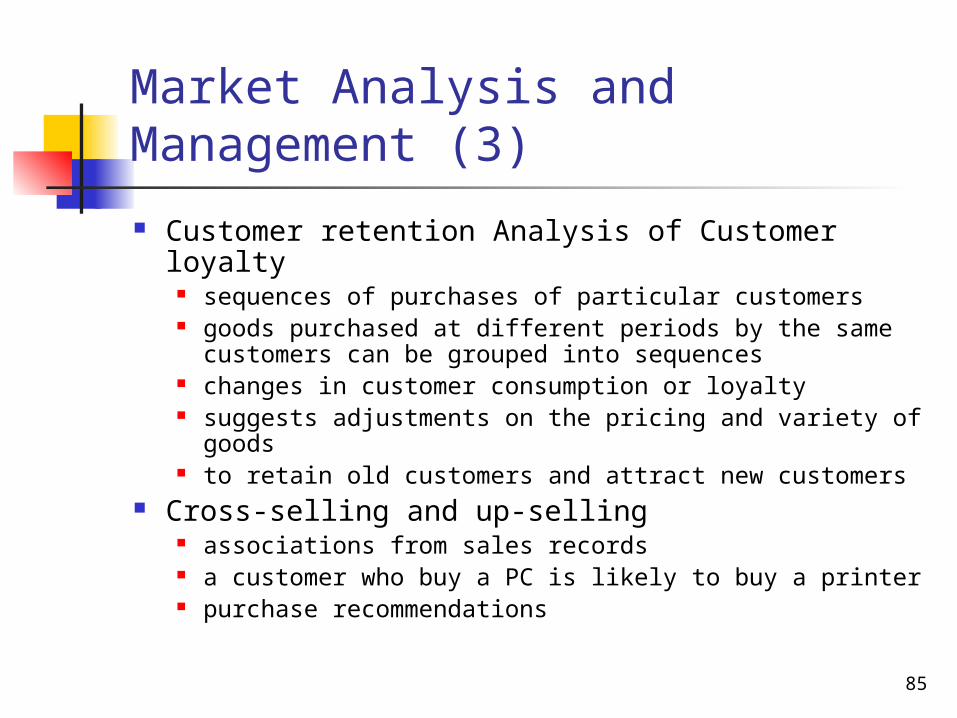
Market Analysis and Management (3)
Customer retention Analysis of Customer loyalty sequences of purchases of particular customers goods purchased at different periods by the same
customers can be grouped into sequences changes in customer consumption or loyalty suggests adjustments on the pricing and variety of
goods to retain old customers and attract new customers
Cross-selling and up-selling associations from sales records a customer who buy a PC is likely to buy a printer purchase recommendations
86
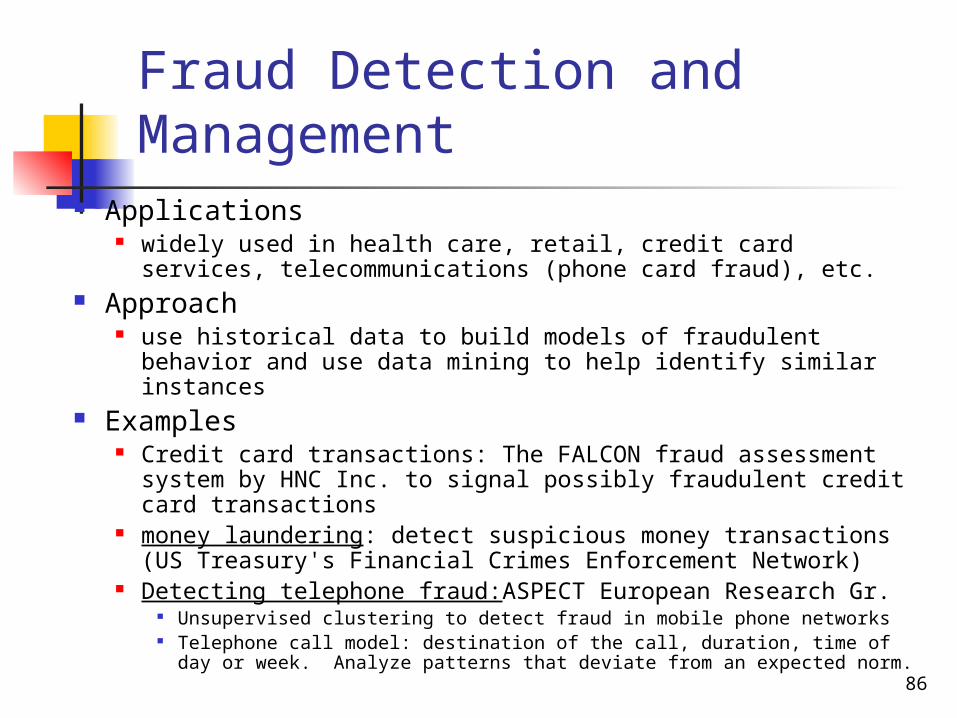
Fraud Detection and Management
Applications widely used in health care, retail, credit card services,
telecommunications (phone card fraud), etc. Approach
use historical data to build models of fraudulent behavior and use data mining to help identify similar instances
Examples Credit card transactions: The FALCON fraud assessment
system by HNC Inc. to signal possibly fraudulent credit card transactions
money laundering: detect suspicious money transactions (US Treasury's Financial Crimes Enforcement Network)
Detecting telephone fraud:ASPECT European Research Gr. Unsupervised clustering to detect fraud in mobile phone networks Telephone call model: destination of the call, duration, time of day or
week. Analyze patterns that deviate from an expected norm.
87
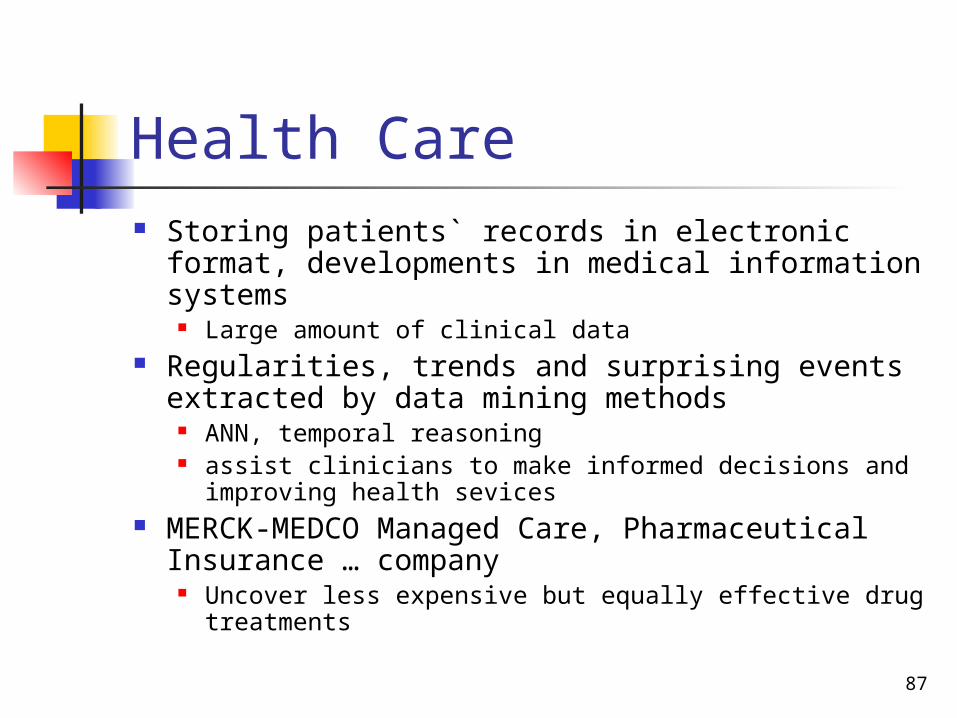
Health Care Storing patients` records in electronic format,
developments in medical information systems Large amount of clinical data
Regularities, trends and surprising events extracted by data mining methods
ANN, temporal reasoning assist clinicians to make informed decisions and
improving health sevices MERCK-MEDCO Managed Care, Pharmaceutical
Insurance … company Uncover less expensive but equally effective drug
treatments

88
Financial Data Analysis Financial data
complete, reliable, high quality Loan payment prediction and
customer credit policy analysis
89
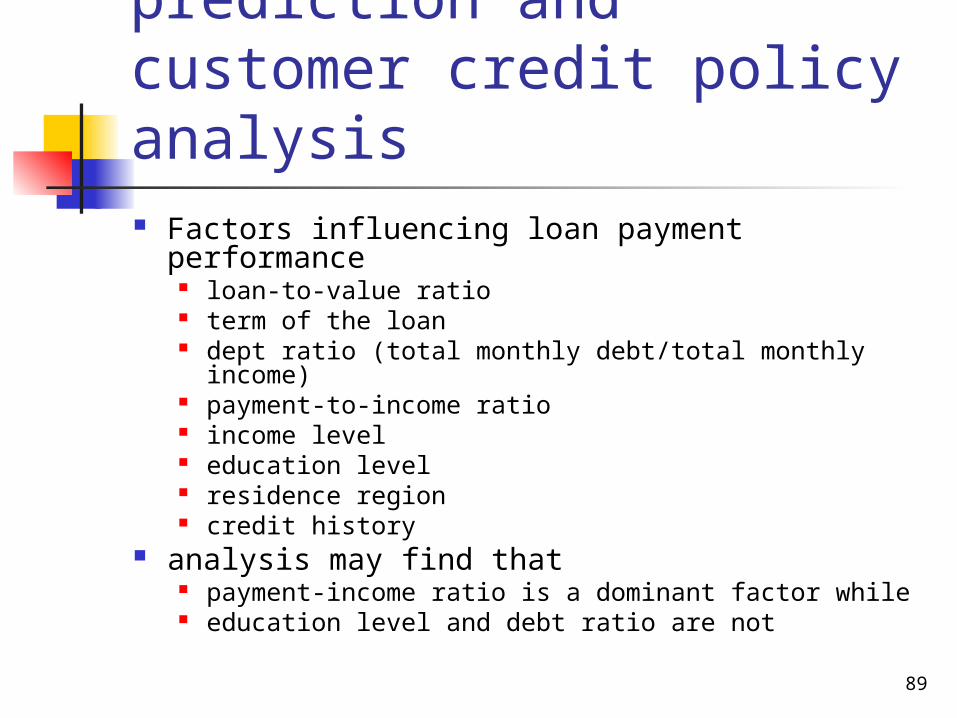
Loan payment prediction and customer credit policy analysis Factors influencing loan payment performance
loan-to-value ratio term of the loan dept ratio (total monthly debt/total monthly income) payment-to-income ratio income level education level residence region credit history
analysis may find that payment-income ratio is a dominant factor while education level and debt ratio are not
90
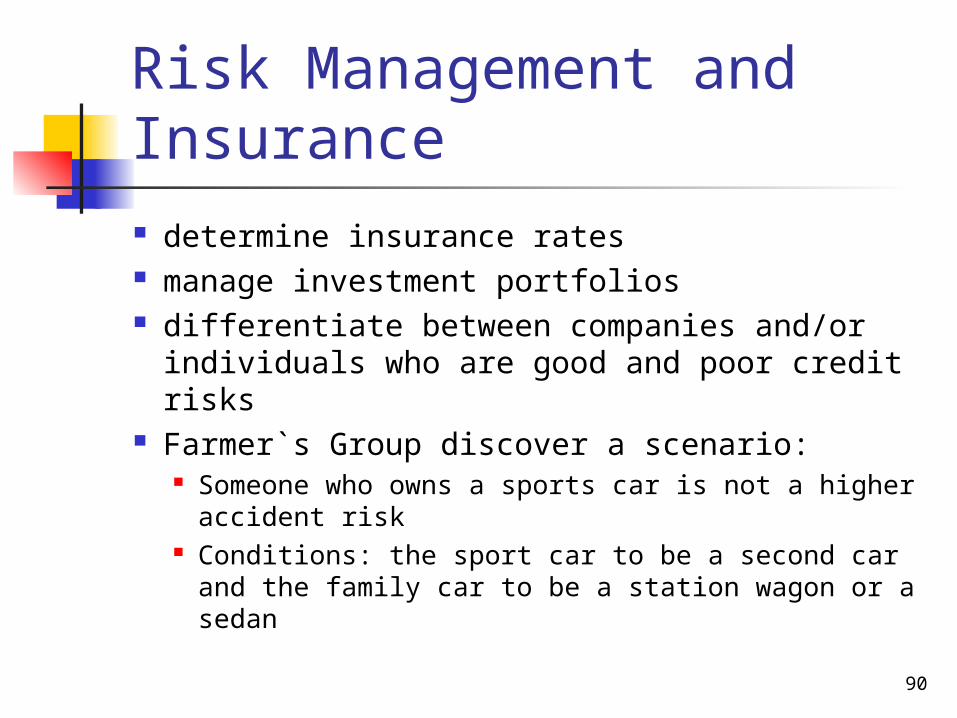
Risk Management and Insurance determine insurance rates manage investment portfolios differentiate between companies and/or
individuals who are good and poor credit risks
Farmer`s Group discover a scenario: Someone who owns a sports car is not a higher
accident risk Conditions: the sport car to be a second car and
the family car to be a station wagon or a sedan
91
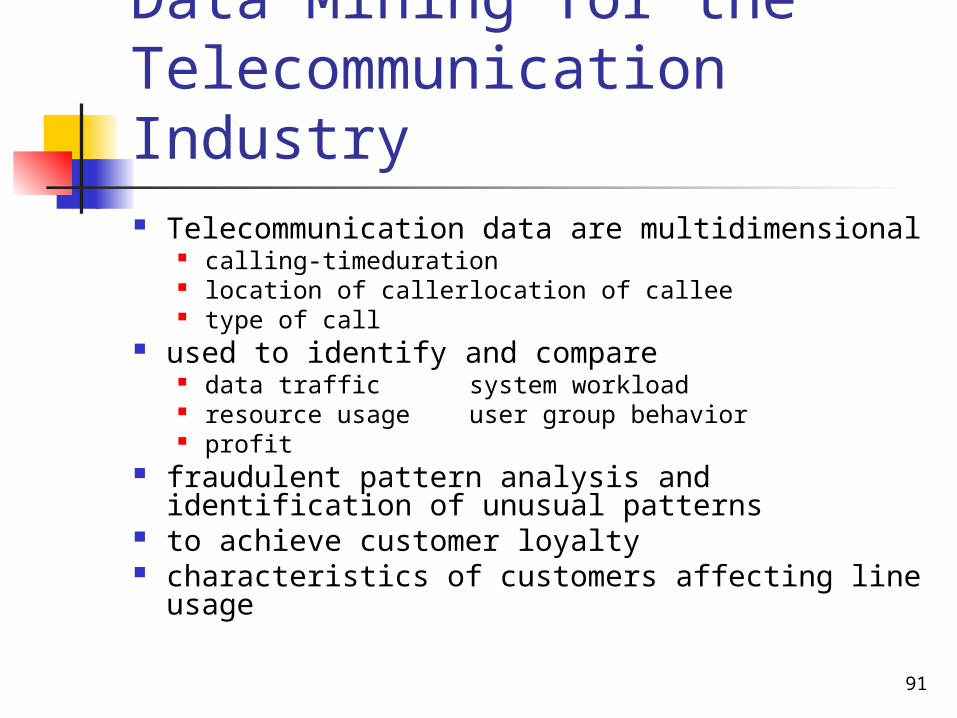
Data Mining for the Telecommunication Industry Telecommunication data are multidimensional
calling-time duration location of caller location of callee type of call
used to identify and compare data traffic system workload resource usage user group behavior profit
fraudulent pattern analysis and identification of unusual patterns
to achieve customer loyalty characteristics of customers affecting line
usage
92
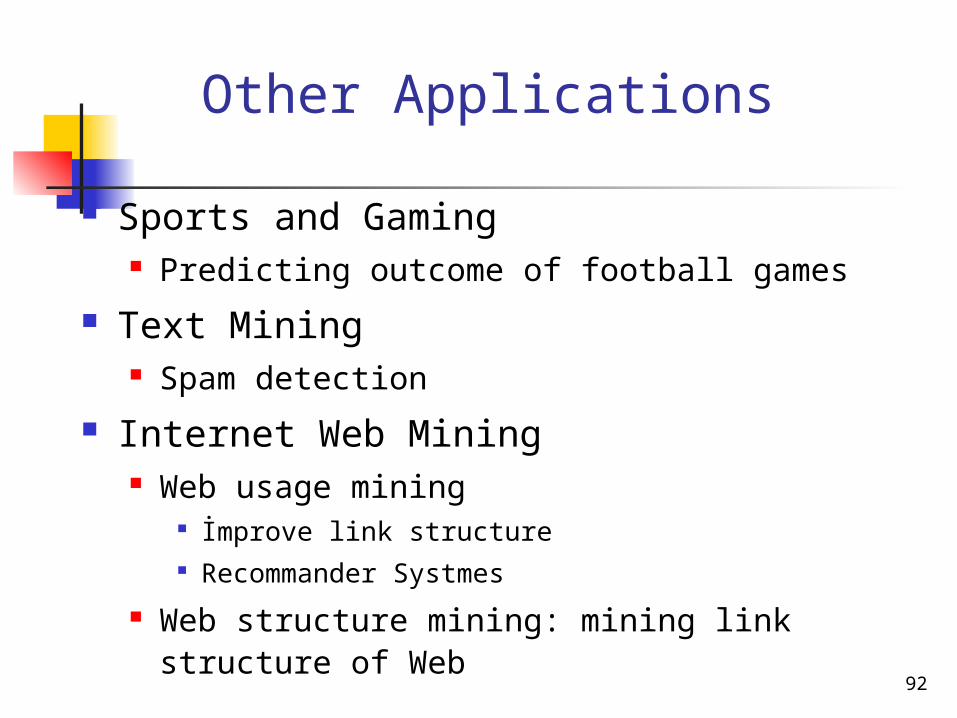
Other Applications
Sports and Gaming Predicting outcome of football games
Text Mining Spam detection
Internet Web Mining Web usage mining
İmprove link structure Recommander Systmes
Web structure mining: mining link structure of Web
93
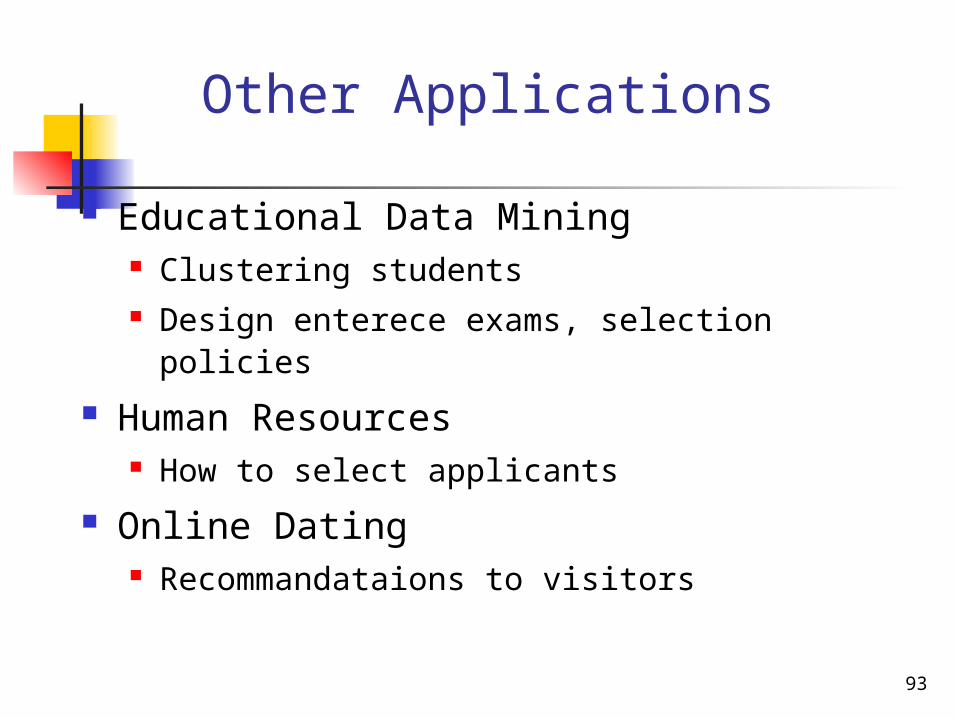
Other Applications
Educational Data Mining Clustering students Design enterece exams, selection policies
Human Resources How to select applicants
Online Dating Recommandataions to visitors
94
Summary
Data mining: discovering interesting patterns from large amounts of data
A natural evolution of database technology, in great demand, with wide applications
A KDD process includes data cleaning, data integration, data selection, transformation, data mining, pattern evaluation, and knowledge presentation
Mining can be performed in a variety of information repositories Data mining functionalities: characterization, discrimination,
association, classification, clustering, outlier and trend analysis, etc.
Classification of data mining systems Major issues in data mining