1 chapter 1 purpose and significance · chapter 1 purpose and significance ... and each crystal...
TRANSCRIPT

1
CHAPTER 1
PURPOSE AND SIGNIFICANCE
Digital and computer based management of radiographs have been used for
several years, yet there are few published studies related to the application of this
technology in dentistry. Much of the information regarding digitizing and display
parameters and technology comes from studies involving digital subtraction
radiology. Unfortunately, the nature of this research precludes any ability to quantify
the resolution necessary for primary interpretation of digitized conventional film.
Additionally, dentistry is moving away from traditional measures such as sensitivity,
specificity and Positive Predictive Value (PPV) to more modern methods of
evaluating diagnostic tests that are consistent with medicine and medical radiology.
Correct evaluation of diagnostic tests has been occurring only sporadically in
dentistry because of the unfamiliarity with Receiver Operating Characteristic (ROC)
analysis, and the difficulty in setting up and performing these investigations. The
lack of information on diagnostic performance with digital radiographs, and more
importantly, the need to introduce new diagnostic performance based analytical
techniques is becoming paramount with the expanding number of digital radiography
systems being introduced to the clinical practice of dentistry.
1.1 Significance
Computer use in dental practice is expanding beyond the traditional roles of
office management, patient scheduling and insurance billing. New clinical
applications of computers in dentistry are becoming available, and many of these new

2
applications employ in image based information, with the attendant high demand
placed on computer systems to manage this information. Radiology is one such
application and has received a increased of attention since the introduction of the first
completely digital image receptor in the U.S. in 1989. However, until digital image
receptors are in place, there is the need for converting existing film based images into
digital form as a transition to a completely electronic patient record. Currently, there
is an interest in using scanned radiographs for transmission over phone lines
(teleradiology) for remote specialty consultation, insurance claims, and aggregate
databases for outcomes research. All of these efforts require digital imagery.
In a recent American Association of Endodontists communiqué1, one third of
the members surveyed identified new imaging techniques as an area that will impact
the practice of endodontics in the future. The technology now exists for a completely
electronic filmless image, yet the dental community has not embraced this
technology. The electronic patient record faces several obstacles. These include
diagnostic validity and performance comparable to film, and the medico-legal
concerns with manipulation of digital and scanned film images. The legal issues can
be addressed with through technological means such as write-one disk drives
(WORMs), CD-ROMs and off-site archival and escrow, while diagnostic concerns
require scientific evaluation.
For an electronic office, a mechanism for electronic archiving of existing film
images is mandatory. Of great concern is the diagnostic accuracy of the digitized
images, especially if these images will replace the traditional radiograph for primary
diagnosis. Images of diagnostic quality can be digitized with medical technology,
but their extremely high resolution requires data storage requirements that are not
compatible or cost effective with PC based systems common in dental offices.

3
1.2 Objectives
These concerns make it necessary to examine this important issue with
technology which is practical for use in a private practice setting. The purpose of this
investigation was to compare the diagnostic accuracy of interpreting radiographs
digitized using a commercially viable, inexpensive image digitization and display
system to that of the original film, and to introduce to the dental profession to ROC
analytical techniques for characterizing the diagnostic performance of the new
imaging modalities being developed.
The null hypothesis to be tested was that the diagnostic accuracy of plain film
radiographs (PF) is different from film digitized images digitized (FD) scanned,
displayed and read as described in this study.
4
CHAPTER 2
DIGITAL IMAGE TECHNOLOGY AND TERMINOLOGY
2.1 Grains versus Pixels
An image on dental film is composed of a random arrangement of the silver
crystals in the emulsion (Figure 1). When observed under a magnifying glass, the
"grain" of the emulsion can be seen. This grain is caused by the silver crystals having
a measurable size, and each crystal having a certain darkness or lightness different
from the crystals surrounding it. This is also why the slower D-Speed (Ultra-Speed)
film "looks better" than E-Speed (Ekta-Speed)--the grains or crystals are larger in E-
Speed. The phenomenon also exists in photography--fast film vs. slow film. A
digital image is not composed of randomly placed grains of silver crystals, but instead
is composed of structured, ordered, "grains" called pixels (Figure 2). A pixel is the
digital equivalent of a silver crystal. A pixel is a single dot in a digital image; it has a
location, and a color or gray level represented inside the computer by a number
(Figure 3). The idea that an image can be represented by a number is at the heart of
digital imaging. Numbers can be added, subtracted, multiplied, divided, compared,
printed, and sent over the telephone by the computer. This process permits the
operator to adjust an image that is underexposed (its numbers are too low) to be
brightened by adding and multiplying to obtain a better appearance.

5
Figure 1--Random Arrangement of Silver Crystals in Film

6
Figure 2--Ordered Arrangement of Pixels in a Digital Image

7
Figure 3--Computer Representation of a Digital Image

8
2.2 Direct Digital Radiography
Direct Digital Radiography is the direct replacement of film with an
electronic image receptor or sensor connected to a computer. In traditional dental
radiography, just as in the days of 16mm home movies, film is used to capture an
image on an emulsion. In the last 10-15 years the film in a 16mm movie camera has
been replaced by an electronic chip called a CCD (charge coupled device) resulting
in what we now call video camcorder. This CCD technology used in camcorders has
been adapted for use in intraoral cameras, scanners such as the one under
investigation, and direct digital radiography. All of these technologies share the same
underlying operating principles.
Direct digital radiography has several benefits over our current film based
systems. No darkroom or processing equipment is needed. Infection control
procedures are reduced, and duplicates are instantly made with absolutely no loss in
image quality. Additionally, the sensitivity of the receptors and the digital nature of
the image permits reduction of the patient's x-ray exposure to less than 50% of
conventional E-Speed film with total image fidelity. Exposure can be further
decreased to less than 20% if image quality is slightly compromised. Patients greatly
appreciate the reduced x-rays. Computers can be used to store and enhance the
image, or transmit it over a telephone line to an insurance company, or a to colleague
for instant consultation.
2.3 Indirect Digital Radiography
Until the transition to these direct digital devices is complete, it would be
advantageous to “scan in” existing film into the computer and indirectly create a
digital image with most of the benefits mentioned above. With the direct digital
radiography systems mentioned above, the image is generated and captured directly
9
into the computer--hence the name direct digital radiography. Indirect digital
radiography digitizes an existing regular dental radiograph. The end result in both
examples is a digital radiograph inside the computer--one directly captured off the
sensor, the other indirectly captured from the film image. While using an intraoral
camera to digitize and display a single periapical is quick and easy, it is not practical
for a 20 film complete mouth radiographs or building an electronic dental record.
Commercially available scanners used in desktop publishing can be equipped with
transparency adapters, and are more practical, but the image quality is low.
Radiographs present scanning difficulties because they have an extremely wide
optical density range--i.e. the black can be very black, and the white can be very
white with a wide range of gray in-between.
The medical community has tackled this problem by using laser scanners such
as the Lumisys (Sunnyvale, CA) laser scanner. Chest images have been among the
most widely studied, with very encouraging results2. However, chest images are
generally low in resolution, have very low spatial frequencies (slow changes of the
gray levels) present, and large areas of the film contain no diagnostic information.
Intraoral dental images are exactly the opposite, with extremely high resolution, high
spatial frequencies (sharp edges between restorative materials and other oral
structures) with small, fine details, and the entire film generally contains important
diagnostic information. These disparities clearly point to the need to characterize
dental images separately, if we wish to gain an understanding about the effect
digitization has on diagnostic performance in dental radiography. Additionally, while
the image quality of these medical digitizers and scanners is stunning, they are
$20,000-$100,000 devices--clearly not cost effective in the dental setting.

10
XRS Corporation (Torrance, CA), and TAU Corporation (Los Gatos) are
jointly pioneering the area of radiograph scanning. XRS is developing patented
technology to scan in medical and dental radiographs with a low cost CCD based
scanner that should be cost effective in the dental environment. TAU is developing
the software that runs the scanner and automatically locates and identifies images. As
this investigation will show, image quality from these devices is exceptional. These
low cost scanners coupled with traditional PC hardware can finally pave the way for
cost effective (<$4000 for scanner, software and computer) remote consultation with
specialists across town, or across the world.
2.4 Spatial Resolution
As might be gathered from Figure 2, pixels also have a size and shape,
usually square, but sometimes rectangular. The size of the pixel determines the
graininess or maximum spatial resolution of the system, just as the size of the silver
crystal grain size determines the graininess of a film system. In dental systems, pixel
sizes are measured in microns (µm), with most direct (filmless) digital radiography
systems such as the Trophy RadioVisioGraphy (RVG) (Marietta, GA) or Schick
Computed Dental Radiography (CDR) (Long Island City, NY) systems having
approximately 50µm pixels. Using some mathematical transformations and a theorem
given by Nyquist, we can calculate the maximum possible spatial resolution of these
50µm systems measured as 10 line pairs per mm (lp/mm). Clearly, smaller pixels are
better for resolution which leads to higher lp/mm. No system on the market has the
resolution of dental film (~15 lp/mm), but as will be discussed later, the
commercially available systems do appear to have adequate resolution for diagnosis
of dental disease, and the resolutions continue to improve.

11
There is a great deal of emphasis on spatial resolution, both in direct and
indirect digital radiography systems. Vendors of digital systems are constantly
having shouting matches about who has the highest “resolution.” While spatial
resolution is an important parameter, and is needed at a certain level to discern the
dental structures, interpretation of dental radiographs is generally a contrast
discrimination process, not a spatial discrimination process. In a sense, digitizing a
radiograph with high spatial resolution solves the easy problem; the hard problem is
capturing all of the gray levels of the image.
2.5 Gray Scale Resolution
Again, thinking of a pixel as a container for a number, it becomes reasonable
to have a maximum number a pixel can hold; this determines its depth. The silver
crystal equivalent would be the maximum darkness obtainable by the crystal.
Typically, with digital dental radiography systems, the range of numbers for a pixel
vary from 0 to 255 (this is called 8 bits per pixel; 28 = 256). Thus there are 256
individual “steps” of gray in an 8 bit pixel going from 0 (black) to 255 (white). This
is the pixels gray scale resolution.
The reason for using 256 gray levels, or 8 bits, instead of 100 or 1000 is
because computers are structured around bytes, which are made up of 8 bits. There is
nothing magic about 256 gray levels, just as there is nothing magic about the number
10--humans just happen to have ten fingers, so our entire numbering system is
structured around 10. As is works out, there are other numbers such as 256 which fit
well within the computers structure, just as 100 or 1000 fit well into our decimal
structure. Another number commonly used for gray levels is 4096 (212 = 4096). This
is what most medical CT scanners and MRI units use when performing their

12
evaluations. As technological advances occur, the gray level resolutions used in
dental imaging devices will probably increase similar to these medical devices.

13
CHAPTER 3
BAYES THEOREM AND ROC ANALYSIS
Many of the concepts and ideas behind the design, statistical model and
analytic techniques used in this investigation are new to dentistry and require review.
This chapter will introduce these conceptsand ideas in order to give insight into the
importance of Bayes’ theorem and the tremendous impact it has on clinical decision
making. The concept of a binormal distribution of a potential patient population
(disease free and diseased) will be presented as ROC analysis is introduced. ROC
will be shown to be a replacement to sensitivity, specificity and Positive Predictive
Value, and the most accurate way for evaluating diagnostic tests.
3.1 Bayesian Analysis
In evaluating a patient who presents on a Friday afternoon complaining of
pain in the upper right quadrant, and is concerned about getting cancer, the clinician
must determine which tests (percussion, palpation, cold/heat, radiographic etc.)
should be used to establish the diagnosis. Do the tests change if the patient gives a
history of a deep restoration placed last week? Does the diagnostic process change if
the area is edentulous? Swollen? Tingling?
Before selecting our diagnostic tests it is important to recognize that the
patient presents with a constellation of signs, symptoms and medical/dental history
findings which suggest a tentative differential diagnosis. Suppose the 23 y.o. patient
had a deep MOD amalgam on tooth #3 placed last week, and complains of sensitivity
to cold. For purposes of illustration, one might assign the likelihood of cancer at

14
<1%, and the likelihood of irreversible pulpitis at >80%. In contrast, suppose the
patient is a 72 y.o. smoker, and in addition to pain, reports a numb sensation under his
malfitting bilateral distal extension removable partial denture, and a history of lung
cancer. One might rate the likelihood of cancer at >80%, and irreversible pulpitis at
<1%. These are the prior probabilities3 that have been determined before performing
any diagnostic tests, and are only loosely linked to the actual disease prevalence.
Before treating disease entities, clinicians like to have a certain level of
confidence--their action threshold3--about the presence of pathosis. Additionally,
before ruling out a specific disease clinicians would like the probability of the disease
to be below their exclusion threshold3. Generally speaking, the worse the pathosis
and more invasive the treatment, the higher the action threshold and the lower the
exclusion threshold. Suppose one institutes root canal therapy when one is are 95%
confident of irreversible pulpitis. Patient #1 requires another 15% to get a posterior
probability3 above the to the action threshold of 95%. A test with moderate
sensitivity and specificity∗ such as a cold test will be enough to move over the action
threshold. Even if tooth #3 gives only a somewhat lingering response, root canal
therapy may still be initiated. For Patient #2 a hemimaxillectomy may be required so
the action threshold should be high, perhaps 99%, and given the history, the exclusion
threshold should be low, <0.5% because of the life threatening nature of the disease.
In other words, the posterior probability (probability after the test) needs to be above
99% or below .5%. A highly sensitive and highly specific diagnostic test such as a
biopsy is required. In fact, if the prior probability is high enough (the patient is also
∗ Sensitivity refers to the percentage of patients with disease who have
abnormal findings at examination, whereas specificity describes the percentage of patients without disease who have normal findings4.

15
an alcoholic and has a past history of cancer) that even if the biopsy comes back
negative, a second biopsy may be taken to confirm negativity (increase specificity) to
move below the exclusion threshold.
By way of example, the important lesson to be learned from Bayes’ Theorem
is that the prior probability (or pretest clinical assessment) plays as important a role as
the sensitivity and specificity of the diagnostic test in determining the posterior
probability (the probability that the patient with a positive test truly has the disease)3.
The impact this has on ROC studies manifests in the amount of information given to
the observer as he is evaluating the diagnostic test. If observers are told that 70% of
the cases have disease and 30% are disease free, he will “self correct” in an attempt to
hit this 70% level. This is also why Positive Predictive Value (PPV) is not a good
measure of the diagnostic test; it is a measure of the diagnostic test plus the a priori
information.
3.2 Binormal Distribution
Diagnostic tests and ROC analysis proceed from an underlying assumption of
a binormal distribution of the diagnostic test value being measured--one normal curve
describing the range of normal values and one normal curve describing the range for
abnormal values such as might be obtained from a cold test on a tooth (Figure 4).
There is always some degree of overlap between the normal and abnormal ranges, but
better tests will decrease the amount of overlap (Figure 5). At what point along this
range of test values--the decision criteria3 (or positivity criteria) --will the
determination that the patient has disease be made (Figure 6)? If the decision is made
too early, an inaccurate diagnosis resulting in treatment of patients without disease
will be made (false positives--gaining sensitivity but losing specificity). If the
determination is made later, the trade off will be missing some disease for the sake of

16
Figure 4--Binormal Distribution

17
Figure 5--Binormal Curves of Poor and Good Diagnostic Tests

18
Figure 6--Binormal Curves with Different Decision Points

19
not overtreating (false negatives--gaining specificity but losing sensitivity). It is this
fluidity in the ability to vary the decision criteria that makes ROC so much more
powerful than simply reporting sensitivity and specificity.
3.3 ROC Analysis
Receiver operating characteristic analysis essentially answers the question:
What are the tradeoffs between sensitivity and specificity as the decision criteria is
varied? In other words, if detecting 90% of the patients with true disease is required,
how many disease free patients will be erroneously diagnosed with disease? What if
95% detection is required? How many more disease free patients will be
overdiagnosed? Intuitively, this tradeoff makes sense when looking at the extremes:
to detect 100% of the disease (100% sensitivity), just diagnose everyone with the
disease. Conversely, if overtreatment is to be avoided at all costs (100% specificity),
treat no one. While sensitivity, specificity, Positive Predictive Value (PPV) and
Negative Predictive Value (NPV) have been extensively used in the past, it is no
longer appropriate to think of a single sensitivity and specificity for a diagnostic test
such as a radiograph or electric pulp tester. ROC allows a continuum of sensitivity
and specificity tradeoffs as the decision criteria is moved to include or exclude more
disease based on a diagnostic test. Sensitivity and specificity can be quoted the same
for Test #1 and Test #2 at a certain point, but the overall diagnostic performance of
the two tests (as measured by Az) is different (Figure 8). Instead of reporting
sensitivity and specificity, ROC reports the Az--the area under the
sensitivity/specificity curve (Figure 7). A perfect test has an Az of 1.0, while flipping a
coin has an Az of 0.50--a 50/50 chance of making the correct diagnosis based on a
random guess. Using ROC, we can now compare two tests on their overall diagnostic
performance across the sensitivity/specificity spectrum without regard to the decision

20
Figure 7--Area Under the ROC Curve (Az)

21
Figure 8--Tradeoffs Between Sensitivity and Specificity
22
ROC allows an investigator to account for a continuum of radiologic
interpretations when calculating sensitivity and specificity for a diagnostic test and
avoids the inaccuracies that arise from assuming that imaging findings are absolutely
normal or abnormal4.
3.3.1 Indications for ROC Analysis
ROC analysis is a general tool for evaluating and comparing diagnostic tests.
Indications for ROC study design include comparing different very different
diagnostic tests such as bitewing radiography versus direct inspection with a dental
explorer for detecting proximal caries5. ROC is also useful in comparing different
applications of the same type of test, such as film digitized radiography vs. plain film
radiography for detecting periradicular radiolucencies. Further still, ROC can
evaluate permutations to diagnostic tests such as sampling frequency of film
digitized image vs. original images6.
3.3.2 Study Design
The most statistically powerful way to design an ROC study is to have the
same r readers read the same c cases in all m modalities under investigation with no
re-reading of cases7. Since the initial interest digitization of film for viewing on a
computer monitor is aimed at “proving” no difference between the digital modalities
and film, using a statistically powerful test makes the results more convincing. Stated
differently, a weak statistical test may miss a real difference between two modalities
and erroneously conclude that no difference exists, whereas a powerful test might
identify a difference.

23
3.3.3 Selection of Cases
There are two commonly used methods for developing a suite of cases that
can be used for ROC analysis--both have advantages and disadvantages. Real clinical
disease can be used, or artificial disease can be produced on specimens. Using real
disease exactly models the clinical situation with respect to variety, appearance and
realism. Problems with using real disease are determining the true extent of the
disease process, and knowing with certainty that a case is disease free. Additionally,
establishing the Gold Standard (truth) for real disease often involves using one of
more of the diagnostic tests being evaluated. This may preclude demonstration that
the new or experimental technique is better than the conventional technique. Disease
entities depicted for interpretation should be of the more subtle and difficult variety,
or early stage disease. Another alternative is to use artificially generated disease as
was done in the Fukart and Dove8 study. The advantages are the ability to determine
the true extent of the lesions, and ascertain true disease free status. A second
advantage, is that the new technique is measure by an independent yardstick, so the
opportunity to outperform the old technique is possible. This is one reason why many
of the original investigations with digital subtraction radiology used an in vitro
model. The in vitro model with experimentally generated lesions provided an
independent means of determining truth to which both subtraction and conventional
radiographs could be compared. The disadvantage is often the lack of variety and the
sometimes artificial appearance of round or bur shaped defects.
No matter how disease is modeled, individual disease entities must be
independent from each other. For instance, if an ROC study was to compare the
ability of film and digital radiography to detect interproximal caries, adjacent
interproximal surfaces should not be counted as independent cases. This is because

24
of the increased likelihood of caries on two adjacent interproximal surfaces. If the
distal surface of tooth #13 has obvious decay, the mesial surface of tooth #14 will be
more likely to have decay than if the distal surface of tooth #13 was caries free. The
lesions are not independent. This aspect of independence is especially problematic in
periodontics because of the usually generalized nature of the disease, and confounded
by the increasing tendency in periodontics for site-specific diagnosis. Optimally, only
one diseased area should be present in each film, because the presence of disease in
one area sensitizes us to look for disease in other areas. A reasonable compromise to
both of these problems is to avoid using adjacent interproximal areas.
The most important factor in selecting cases is emphasizing subtle and
difficult to detect pathosis. As the case interpretation difficulty moves from easy and
obvious to subtle and difficult, evaluators will have a more difficult time detecting
pathosis. Clearly, if all cases contain gross pathosis, sensitivity for all tests will be
100%, and no demonstrable differences in performance will be detected between the
diagnostic tests (Figure 9). This single factor can grossly skew a study resulting in
extremely high Az values not representative of the real diagnostic performance of the
test. It often is the case that subtle pathosis is early pathosis. Recalling the binormal
(two curves) distribution discussed earlier, diseases may be staged with the later
stages having measured test values increasingly larger than normals. This fits the
general model of dental disease, where caries is staged into depths I-IV, periodontal
diagnoses are mild, moderate, severe etc. The impact this has is that sensitivity as
specificity are actually functions of time and both will change as the disease
progresses from incipient to severe3. Additionally, detecting differences between
different modalities becomes a matter of comparing two very high Az values with
dubious chances of obtaining a statistically significant difference.

25
Figure 9--Changes to ROC Curves vs. Lesion Subtlety
26
3.3.4 Grading of Cases--Establishing the Gold Standard
ROC relies on an independent determination of truth--normality or
abnormality--for each case. This is the Gold Standard to which all readers are
compared. With artificially generated lesions, there can be no argument as to the
presence or absence of lesions, and the Gold Standard is generally determined
independently by direct observation or modification of the tissue specimen. With real
disease, the accepted method for determining truth is generally biopsy. Unfortunately
in dentistry, the luxury of removing en bloc sections of patients for research purposes
is not an option. Thus the truth of the case often relies on at least one of the imaging
tests being evaluated. This is generally done by convening a Delphi Panel--experts in
the field--with all available tests, clinical information, dental/medical history,
operation notes, and complete treatment records including recall examinations. Two
to four experts generally constitute the Delphi Panel. The panel reviews cases, and
must come to complete, unanimous agreement for the case to be included in the case
set. If there is irreconcilable dissension, the case must be discarded.
In cases relevant to dentistry, film would serve along with the other
information as the Gold Standard. This has the effect of biasing the study against the
other modality. The other modality must prove equal to film.
3.3.5 Evaluation and Evaluators
Residents often make the best evaluators. Recalling that the experimental
question would like to answer the efficacy of the diagnostic test as it applies to all
readers, having experts be the readers would not represent the larger population of
readers. Evaluators should not be given any information about the clinical case or the
number of pathologic or normal cases. We wish to evaluate the diagnostic test alone,
not the diagnostic test plus the a priori component (which is actually the PPV). The

27
examples given earlier shows how strong an influence the case history and patient
presentation factors have on our selection and interpretation of tests.
The standard evaluation utilizes a five point scale that easily maps good
clinical decision making processes and the covers the diagnostic spectrum. The five
categories are:
Definitely Present
Probably Present
Possibly Present
Probably Absent
Definitely Absent
While there are other scales, and even a continuous range ROC analysis, these
five categories cover the diagnostic spectrum well without getting into the semantic
subtleties that more categories or continuous range ROC bring.
3.3.6 Analysis of Data
CORROC and its derivatives have been the standard for ROC curve
estimation and difference testing with two modalities7. CORROC analysis attempts
to correlate decisions made by each individual reader in both of the modalities by a
method called maximum likelihood9. Since the reader is reading the same case from
both modalities, if they are diagnostically equivalent, the decisions should be
correlated. This type of analysis permits conclusions to be made on the performance
of each reader across the two modalities in the cases studied. If multiple readers are
used, each reader is treated like a separate experiment--the CORROC methodology
does not permit generalization to the population that the readers are supposed to
represent. In other words, CORROC Az values calculated for each reader are
independent tests of significance, and should not be averaged to get a single test of

28
significance. While there are techniques for combining these individual Az values,
the Multiple Reader Multiple Cases (MRMC) method described below allows and
tests for generalization to the population of readers. With multiple modalities, is
becomes tempting to average Az values across readers for each modality, then
perform multiple paired t-tests. This practice is to be avoided. Since the real reason
ROC is done is to "report an index of performance of a diagnostic system with a
sample of cases, a sample of observers, and a sample of readings is not to tell the
journal readership how well it performed in this particular sample that was studied,
but to provide and estimate of how it would perform 'on the average' in those cases
and observers and readings that were not studied.10" A new method that permits
drawing these broader conclusions is needed.
3.3.7 Multiple Reader Multiple Cases
The problem with CORROC analysis is that the same readers read the same
cases which precludes “averaging” individual Az values because of the dependency
generated by the case set. Maybe there are a few readers that perform much better
than others, or a few cases that everyone misses. CORROC analysis will not detect
these possible contributions to Az. What is needed is a way to detect if the
differences in Az values are due to the a true difference in modalities, or the readers,
or the cases as we pool the readers.
To detect these differences, a statistical technique call jackknifing is used.
The way that jackknifing works is by removing each response data value one at a
time, and recomputing Az with that one data element removed. In the case of ROC
analysis, the following steps are taken to jackknife the cases:
1. Compute Az for each reader in each modality (as is done with CORROC)

29
2. Remove case #1 and re-compute Az for each reader in each modality. The
difference between the Az calculated in 1.) and this Az is the contribution
from case #1.
3. Replace case #1, remove case #2 and re-compute Az.
4. Replace case #2, remove case #3 and re-compute Az.
5. and so on until all cases have been removed and replaced exactly one time.
6. Compare the Az values with ANOVA for statistically significant
differences.
The same steps of rotating the readers in and out, and recomputing Az
jackknifes the readers. The data generated from jackknifing are called pseudovalues.
They are real data points and may be thought of as if they were directly measured. It
is this transformed data generated by the jackknifing procedure that is fed into an
ANOVA to look for statistically significant effects (Table 5).
The ability to rigorously pool the data from different readers has several
positive effects with direct implications for evaluating diagnostic performance. In the
general case where demonstrating of no difference between modalities is desired,
MRMC analysis provides us with a sharper, statistically more powerful tool than
CORROC analysis. Clearly, with a blunt instrument, no differences will be
discernible. Yet if a powerful statistical test demonstrates no difference, the results
are more convincing. Another benefit of MRMC analysis is better estimation of the
true Az, with tighter confidence intervals. This allows us to say what the upper and
lower bounds of the true Az might be with greater precision.

30
CHAPTER 4
REVIEW OF THE LITERATURE
4.1 Endodontics--Interpretation
There is an abundance of literature dating back more than 30 years evaluating
the ability to detect bony change and make consistent “diagnoses” and interpretations
of endodontic pathosis from radiographs. The classic work done Bender and
Seltzer11,12 determined in an artificial lesion study of cadaver mandibles that
cancellous changes cannot be detected radiographically. In a later in vitro study,
Bender13 determined the percentage mineral loss needed to produce a radiolucent
lesion. The investigation used three observers, who were unanimously able to detect
rarefactions with greater than 7.1% bone loss. Yet at the lowest detectable level of
6.6% mineral bone loss, there was disagreement between the observers.
Goldman14,15, in two studies designed to test inter and intra-observer consistency in
determining endodontic failure, found than six of six examiners agreed on the
“diagnosis” only 50% of the time, and agreed with themselves (on a later date) only
75% of the time. Later work by Zachariasen and Scott16 confirmed this in an inter and
intra-examiner study evaluating the ability to determine endodontic failure. They
concluded that there was substantial inter and intra-examiner disagreement. They
also concluded that this difference is independent of radiographic density, anatomic
location of the treated teeth, technical compatibility of films, or length of time
between post-operative and recall radiographs. While some of these studies included
graded evaluator responses, none of them used ROC analytical techniques. This does
31
not invalidate the literature in general. Conclusions that can be drawn from these
studies indicate that interpretation of endodontic radiographs is problematic, with
surprisingly advanced pathosis needed for a detectable signal. There is also
substantial evidence for inter and intra examiner variability, which can be explained
somewhat by the examiners positivity criteria and his frame of mind during
interpretation--Bayesian concepts.
Digital techniques have been used in endodontics in an attempt to gain more
quantitative measures of periradicular changes. Fujita17 used a Fuji (Tokyo, Japan)
digital image processing system to determine if periapical interpretation could be
improved. They found that the 100µm pixel size was too large and often caused loss
of information, yet low contrast images were improved by the system. Orstavik18
applied another commercially available digital image processing system to periapical
radiography. They concluded that the system was suitable for quantitative and
unbiased gray level measurements and could be used for assessing apical
periodontitis. even though the system also had some problems with gray scale
(gamma correction) matching of images in digital subtraction radiography.
Kullendorf and Grondahl19 in an in vitro ROC study found that digital subtraction
radiography had superior diagnostic performance in smaller lesions (subtle lesions),
yet there was no difference in larger lesions (obvious lesions). Importantly, observers
were able to detect lesions in cancellous bone with the subtraction technique. Later,
Kravitz and Tyndall20 applied the subtraction technique to an in vitro root resorption
model using ROC analysis. They found that digital subtraction radiography was
superior to conventional radiography for detecting resorptive defects.

32
4.2 Periodontics--Interpretation
The periodontal community was one of the first to embrace digital
radiography. Consequently, a great body of work based on digital subtraction
radiography and digital image analysis has been accumulating over the past 15
years21,22,23,24,25. The generally chronic nature of periodontal disease and is apparent
slow or bursty clinical progress coupled with high variability in clinically detecting
change lead investigators to re-examine radiography for detecting bony change. The
bulk of this research and the digitizing technologies have been based entirely on the
technology available to the clinician and researcher. This has been for the most part,
TV based (RS-170 or NTSC) analog video systems. These systems make good
research tools because of their flexibility and low cost, but they are cumbersome to
use in clinical practice because they are unable to digitize an entire examination, need
constant adjustment to optimally capture an image, and require a large work space.
The image processing algorithms employed by this research generally results in an
image that is used as an adjunct to traditional intraoral radiographs, not as a
replacement for primary interpretation tasks. Thus the need for equivalence in
diagnostic performance has not been investigated. In fact, the digital subtraction
studies generally improve upon the performance of film in order to detect bone loss
earlier26,27.
There are several studies characterizing the radiographic appearance of
periodontal disease with accompanying recommendations for classification into
different disease stages. Hull28 used a measurement of 3mm from the CEJ to the
alveolar crest for indicating early periodontitis. Others have implied that thinning of
the alveolar crest or loss of cortication as a very early indicator of the disease
process29. This type of observation has been called into question by later investigators

33
such as Greenstein30, who reported than there was no correlation between the
presence of crestal lamina dura with the presence or absence of clinical inflammation,
or more importantly, attachment loss. Mann31 fortified this position by finding no
evidence of a relationship between thinning of the trabeculae or lack of crestal
cortication and attachment loss. Loss of bony support appears to be the only reliable
indicator of early periodontitis, yet it does not generally occur until sometime after
the loss of soft tissue attachment32,33. The radiographic appearance of different types
of lesions was investigated in an in-vitro study by Rees34. Importantly for this
investigation, they determined that interproximal and furcation lesions can be
identified with a high degree of accuracy, while buccal and lingual lesions were
extremely difficulty to detect.
4.3 Analog/Digital Comparisons--Analytic Technique
The existing work has limitations making clinical application difficult.
Kassebaum35, in a 1989 ROC study, used a Kodak Ektascan system to digitize images
for caries detection, panoramic radiography and periapical endodontic radiography.
This Ektascan system used was video based, thus it is not practical for use in a dental
setting. It was also unclear from the study if cases selected for evaluation exhibited
subtle, moderate or gross abnormalities. The presence of gross abnormalities would
skew the study and show the digital systems to be comparable to film. Furthermore,
small sample sizes were used making what appeared to be differences in diagnostic
performance not statistically significant. Possibly because of the small sample size
and the apparent lack of emphasis on subtle cases, they found no statistical difference
between highest digital resolution and film. This finding is surprising when one
considers the 200µm pixel size of the highest resolution yields a maximal (Nyquist)
resolution of <3 line pairs per millimeter (lp/mm). It may also be that spatial

34
resolution is not as important as previously thought--contrast resolution may be more
important.
A great deal of effort has been spent on evaluating the technical merits of the
new digital radiographic systems. A sampling of the literature reveals a number of
articles which have characterized the resolution of digital radiographic sensors. Benz
and Mouyen36 describe the technical characteristics of the RVG 32000 system
reporting 11 lp/mm in ZHR mode and greater sensitivity to x-rays than film. The
Visulix/VIXA system was evaluated by Molteni quantitatively for dose reduction and
qualitatively for resolution. He concluded that the system had adequate resolving
power. Nelvig and Wing37 evaluated the Sens-a-Ray system, stating greater than 10
lp/mm resolving power, and concluded that the system produced images of diagnostic
quality at one-half to one-third of the exposure needed for E-speed film. A later
article by McDonnell and Price38 compared Sens-A-Ray to D and E-speed film with
respect to resolution, image quality and speed. They concluded that Sens-A-Ray had
10 lp/mm, was faster, and had greater contrast at low exposures than film. More
recent work by Welander and McDavid39 evaluates four digital intraoral sensors using
the modulation transfer function (MTF) as the measure of image resolution, and is
careful to avoid claims of diagnostic performance. While the technical merits of the
different systems are interesting, and serve as an important starting point for
comparison, conclusions about diagnostic quality images, adequate image quality and
adequate resolution contained in some of these articles may be unsubstantiated.
It is perhaps more important to note from these investigations the continued
emphasis placed on spatial resolution, which is only one of many parameters that
characterize a digital systems technical performance. Dental radiographic
interpretation generally relies on differentiation of subtle differences in contrast

35
between diseased and adjacent normal areas. Very rarely are physically small details
needed. Dental film interpretation is generally thought to be a contrast discrimination
problem, not a spatial discrimination problem. With this in mind, further technical
characterization of imaging systems should evaluate contrast resolution at least as
diligently as spatial resolution.
Other investigators, including Yokota & Miles40 and Sanderink & Huiskens41
have attempted to compare film with direct digital images. Yokota and Miles40
evaluate the diagnostic potential of RadioVisioGraphy (RVG) for detecting periapical
lesions using a five point confidence scale. Instead of using ROC analysis, they
averaged the coded scores and performed an Analysis of Variance (ANOVA) which
lead them to conclude that normal images were better on film, medullary lesions were
better on RVG, and no difference was detected if cortical perforation had occurred.
The results are interesting, but the lack of ROC analysis leaves the diagnostic
performance of these two systems in question. The Sanderink and Huiskens study
used four commercially available sensors for determining root canal length in an
ROC design. They concluded that RVG normal mode and Sens-A-Ray produced
acceptable images (Az > .95) with size 15 files, while RVG archive mode, Flash Dent
and Visulix/VIXA had Az less than 0.95. All digital systems had Az less than 0.95
with size 10 files. While ROC analysis is clearly a step in the right direction, the
authors averaged Az values obtained from different evaluators, then apparently
proceed to perform multiple paired t-tests for significance. While averaging the
coded response scores has been done in the past with most ROC studies in dentistry
in an attempt to get an “average” Az, value, the practice is statistically questionable.
This is because while each observer is independent, there is only one case set--in
effect, only one sample. This single case set introduces a dependency into the study

36
that precludes “pooling” or averaging the individual Az values. Additionally, an
ANOVA should be the statistical test used to compare between more than two groups
of interval data; multiple paired t-tests greatly increase the likelihood of incorrectly
finding significance.
In another ROC study comparing D speed, E speed and the Regam Sens-A-
Ray, Furkart and Dove8 found no significant differences in Az between these imaging
modalities for detecting artificial periodontal bone lesions. Importantly, lesion size
was grouped into small and large lesions and separately analyzed. Lesion size is
important, for even the poorest sensor is able to detect gross pathologic changes.
Unless cases selected models the clinical case set, or subtlety is broken out and
analyzed separately as in this effort, all ROC studies should heavily emphasize
difficult and subtle pathosis.
Part of the problem in characterizing diagnostic performance stems from a
lack of understanding by researchers on how to evaluate diagnostic tests. A recent
editorial by Douglas42 in the Journal of Dental Research on this topic completely
misses ROC and places emphasis on sensitivity, specificity, positive predictive value
(PPV) and negative predictive value (NPV) as the basic diagnostic parameters. The
reply by Bratthall43, while illuminating very important areas such as sampling,
causality and etiology, still fails to take in account a priori probabilities, the tradeoff
between sensitivity and specificity as the decision criteria is varied, and the concept
of an action threshold3. The cover article of December 1993 JADA44 “Digital
Radiology: Facts and Fictions,” fails to mention ROC and drew heated replies from
the radiologic and clinical community. The authors, in their reply, state that
sensitivities and specificities need to be studied. In this day and age, reporting
isolated sensitivities and specificities for a diagnostic test is an anachronism.

37
CHAPTER 5
MATERIALS AND METHODS
5.1 Case Selection
5.1.1 Endodontics
One hundred sixteen patient records from the archives of the University of
Iowa College of Dentistry, Department of Endodontics constituted the patient case
set. From these 116 patients, 128 radiographs depicting normal and abnormal
periradicular findings were selected. These 128 radiographs were evaluated by a
Delphi panel consisting of three endodontists who unanimously agreed on the
presence or absence of findings in three categories of endodontic interest for each
tooth: periradicular radiolucent areas of endodontic origin; pulpal space calcifications
including calcific metamorphosis, radiographic canal obliteration, and pulp stones;
resorptions including cervical, internal, and external replacement resorptions (but not
root end inflammatory or orthodontic type resorption). Clinical findings recorded in
the patient record as well as additional radiographs present in the patient chart were
used by the Delphi panel to confirm the presence or absence of pathosis. The Delphi
panel then classified these three radiographic findings tooth-by-tooth into categories
of normal, subtle, moderate and obvious, denoting the “ease” with which the finding
was detectable on the radiograph (Table 1). If there was any disagreement in any
category on a particular tooth in a radiograph, that tooth was omitted from the study.
This procedure was repeated to determine the Gold Standard for the 274 cases
obtained for evaluation.

38
Table 1--Findings Distribution in Endodontics
Finding Type Number of Findings Percentage of Findings
Normal 624 76%
Subtle 87 11%
Moderate 76 9%
Severe 35 4%
Total Findings 822 100%

39
5.1.2 Periodontics
Twenty seven patient records from the archives of the University of Iowa
College of Dentistry constituted the patient case set. From these 27 patients, 57
radiographs depicting normal and abnormal periodontal findings were selected.
These 57 radiographs were evaluated by a Delphi panel consisting of three
periodontists who unanimously agreed on the presence or absence of findings in three
categories of periodontal interest for each tooth surface: bone loss of periodontal
origin; furcation involvement; calculus. Clinical findings as recorded in the patient
record as well as additional radiographs present in the patient chart were used by the
Delphi panel to confirm the presence or absence of pathosis. The Delphi panel then
classified these three radiographic findings in a site specific manner into categories of
normal, mild, moderate and severe denoting the “ease” with which the finding was
detectable on the radiograph (Table 2). If there was any disagreement in any category
on any particular site in a radiograph, that site was omitted from the study. This
procedure was repeated to determine the Gold Standard for the 180 sites were
obtained for evaluation.
A major problem in the periodontics model is independence of the disease
process across interproximal sites. In contrast with endodontics, which is highly
localized with relatively poor correlation of disease between adjacent teeth,
periodontal interproximal bone loss often affects teeth with adjacent interproximal
areas. A compromise was struck between requiring an exorbitant number of
radiographs needed for evaluation, the dependent nature of the disease process, and
the clinical desire to evaluate bone loss in a site specific manner similar to clinical
practice. From the 180 sites graded by the Delphi panel, adjacent interproximal sites
were discarded from data set leaving 128 sites for analysis.

40
Table 2--Findings Distribution in Periodontics
Finding Type Number of Findings Percentage of Findings
Normal 325 64%
Mild 79 15%
Moderate 70 14%
Severe 38 7%
Total Findings 512 100%

41
5.2 Digitization and Display
The general philosophy of the digitization and display systems used was to
model equipment that would be inexpensive, available “off-the-shelf”, and functional
in the unique dental setting. The systems generally available in medicine for
digitizing radiographs far exceed the price points that dental professionals would be
willing to pay. A system had to be developed that 1) made use of inexpensive PC
based hardware common on dental offices; 2) used a Graphical User Interface (GUI)
for storage, retrieval, display and manipulation of the images; 3) could be “added-in”
to leverage additional functionality from an existing office PC; 4) could make use of
an inexpensive flatbed scanner for easy management of the variety of images
generated in the dental setting; 5) automated or semi-automated image acquisition
front-end for front office clerical or other non-clinical personal who may not be able
to judge image quality.
5.2.1 Digitization Procedure and Equipment
The images were removed from the mounts and digitized by an XRS
(Torrance, CA) DxII flatbed charge-coupled device (CCD) scanner with extended
optical density range and custom firmware, and TigerScan™ (TAU Corp. Los Gatos,
CA) software. In essence, this firmware/software combination extended the useful
optical density range of the CCD from 0.1 to 3.1 by capturing two 8 bit images (one
“light” and one “dark”) in a single pass of the head. The two 8 bit images were
reassembled using a two dimensional lookup table into a single 8 bit image for
storage and display purposes. Scanning spatial resolution was held constant at
300dpi. This scanning resolution resulted in 476×360 pixel images for size 2 film in
“landscape” orientation, and was chosen because it was the maximum possible
resolution obtainable from the scanner. No attempt was made to optimize any

42
digitization parameters to obtain the best possible scan. This was done to more
accurately model the clinical use of the scanning subsystem where non-clinical
personnel may be the actual device operators using an automated algorithm.
5.2.2 Display Procedure and Equipment
A Gateway (North Sioux City, SD) 486-66MHz PC with 16MB RAM, 1GB
storage, ATI ULTRA video board and CrystalScan™ 15” monitor running Microsoft
® (Redmond, WA) Windows™ 3.1 and TigerView™ (TAU Corp., Los Gatos, CA)
image management and display software was used to view the digital images on the
screen. The display subsystem was always run in 1024×768×256 color mode which
allowed all images to be displayed in full spatial resolution. Yet this video
board/video display combination effectively uses only a 6 bit RAMDAC resulting in
64 distinct levels of gray. This is typical of PC based video display subsystems
running Microsoft Windows in 256 color mode, and represents the maximum number
of gray levels generally available on an inexpensive PC. To allow more subtle gray
scale discrimination, a Window and Level control was provided in the TigerView
display software to allow the full 8 bits dynamic range to be brought into the display
range. The only other tools allowed were a variable 2× - 4× pixel replication zoom
and digital crosshair ruler. The workstation and software were always operated by
the PI to alleviate any possible viewer frustration and increase focus on the
interpretation task.
Film images were displayed on a maskable viewbox, with a magnifying glass
and millimeter ruler available. Both film and digital images were viewed in a
darkened room.

43
5.3 Evaluators
In Endodontics, six evaluators with advanced training in endodontics were
used. In order of increasing experience in endodontics these individuals included one
second year resident, one private practice endodontist, one board eligible faculty
member, two endodontic dental scientists, and one board certified faculty member.
In Periodontics five evaluators with advanced training in periodontics were
used. In order of increasing experience in periodontics these individuals included two
second year residents, two board eligible faculty members, and one board certified
faculty member.
5.4 Evaluation Procedure
Evaluators were given a orientation to the study design and the research
question to be addressed. This was done to familiarize evaluators to the responses
used in ROC analysis which are generally unknown in dentistry. Example images
were reviewed demonstrating the variety and subtlety of pathosis for interpretation.
Evaluators were not informed of the number or percentage of pathologic cases.
Evaluators were not given specific criteria upon which to base their interpretations,
but were instructed to report their confidence based on their training and general
clinical experience as would be the case if this technology were in actual use.
Two viewing sessions separated by 5 weeks were used. Three evaluators
interpreted all of the digital images in their first session, while the other three
interpreted all of the film images. At the second session 5 weeks later, evaluators
were re-familiarized with the procedure, and the modality was reversed. Thus all
reviewers interpreted all cases for all three with both modalities. Before the start of
the digital session, evaluators were familiarized with the tools available on digital

44
image workstation (window/level, zoom, digital ruler) and were instructed to request
them from the PI when desired.
During the sessions, observers were asked to determine if the findings in each
category of each case were normal or abnormal, and indicate their degree of
confidence in this decision using a five point confidence scale: Definitely Absent;
Probably Absent; Possibly Present; Probably Present; Definitely Present. It was
emphasized to the reviewers that providing a diagnosis was not required, or
appropriate since clinical information, other diagnostic tests and patient presentation
factors were withheld.
5.5 Analysis of Data--ROC Analytical Technique
The experimental design was essentially a single reader with multiple cases.
Multiple readers are defined as replications of the same experiment. Thus traditional
ROC analysis such as CORROC9 applied to each reader requires the null hypothesis
to be tested for each reader and does not permit generalization to the population from
which the readers was drawn7. A multiple reader multiple case (MRMC) ROC
analysis developed by Dorfman and Berbaum7 was performed separately on each
strata of cases as graded by the Delphi panels (subtle, moderate and obvious in
endodontics; mild, moderate and severe in periodontics). This type of analysis
permits generalization to the population of readers from which this particular set of
readers was drawn. This generalization answers the more broad question: is there a
difference in PF and FD for all readers represented by this sample of readers as
opposed to CORROC analysis, which would answer the question with only the
specific readers tested. This is important, because as discussed above, there are
definite inter-evaluator differences which may interplay with the selection of cases
and modalities, possibly influencing the results. This analysis has additional benefits
45
including better estimation of the area under the curve (Az) with tighter confidence
intervals (ci), and greater statistical power for the same sample size as compared with
CORROC7. Maximum statistical power is desirable in this experiment because the
interest is in detecting any possible differences between FD and PF that may impact
diagnostic performance before making conclusions that FD performs comparably to
PF.
5.6 Data Analysis--Endodontics
The 822 findings were collapsed by using the most severe finding across the
three pathologies for each case. For instance, if tooth #21 had no resorptions,
moderate periapical radiolucency and subtle calcification it would be coded as
moderate. It was decided that the most obvious or severe finding present in that
particular case would indicate to the evaluator to the possibility of other pathosis on
that case, thus the overall case would be most conservatively rated by its most severe
disease process. In order to be coded as a normal case, all findings for all pathologies
for the case must be normal. The breakdown from this collapsing of cases in
endodontics is shown in Table 3.
5.7 Data Analysis--Periodontics
The 512 findings were collapsed by using the most severe finding across the
three pathologies at each site. For instance, if tooth #19 had no radiographic evidence
of a furcation involvement, mild periodontal bone loss, but moderate calculus, it
would be coded as moderate. As with the endodontics model, it was decided that the
most obvious or severe finding present on that particular case would indicate to the
evaluator the possibility of other pathosis in that case, thus the overall case would be
most conservatively rated by its most severe disease process. This had the untoward

46
effect in the periodontics model of greatly reducing the number of normal cases in the
sample pool because many of the cases selected had at least one mild finding, such as
calculus. The breakdown of case types is shown in Table 4.

47
Table 3--Breakdown of Collapsed Case Types in Endodontics
Case Type Number of Cases Percentage of Cases
Normal 112 41%
Subtle 64 23%
Moderate 63 23%
Obvious 35 13%
Total Cases 274 100%

48
Table 4--Breakdown of Collapsed Case Types in Periodontics
Case Type Number of Cases Percentage of Cases
Normal 17 13%
Mild 28 22%
Moderate 45 35%
Severe 38 30%
Total Findings 128 100%

49
CHAPTER 6
RESULTS
6.1 Endodontics
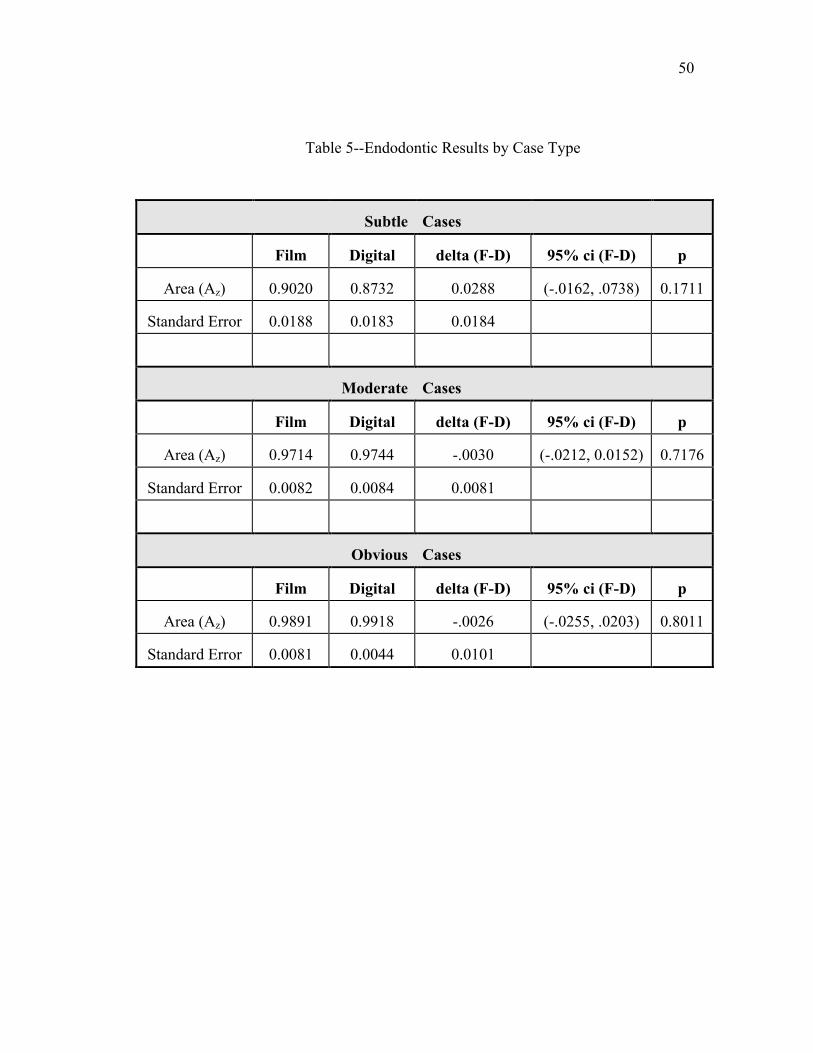
No statistically significant differences were found in the area under the curve
(Az) between Film Digitized (FD) and Plain Film (PF) images in the categories of
subtle, moderate or obvious (Table 5). We therefore reject the null hypothesis--that
FD images differ from PF images. There was the expected increase in Az as the case
difficulty decreased from subtle to obvious. The confidence interval for the subtle
case type is somewhat troubling at the 95% level. Stated precisely, we are 95%
confident that if we choose a specificity at random, there would be a difference in
sensitivity advantage of film over digital less than 7.4%. Given that 50% of the Az is
“free” because random guessing results in an Az of 0.50, a 7.4% difference could be
as much as 15% of real diagnostic performance.
Individual evaluators Az performances across the case types are summarized
in (Table 6) in order of increasing experience. ROC curves for the individual
evaluators demonstrated a variety of individual performances. Actual ROC curves for
all six evaluators are shown in Figure 10 to Figure 12.
50
Table 5--Endodontic Results by Case Type
Subtle Cases
Film Digital delta (F-D) 95% ci (F-D) p
Area (Az) 0.9020 0.8732 0.0288 (-.0162, .0738) 0.1711
Standard Error 0.0188 0.0183 0.0184
Moderate Cases
Film Digital delta (F-D) 95% ci (F-D) p
Area (Az) 0.9714 0.9744 -.0030 (-.0212, 0.0152) 0.7176
Standard Error 0.0082 0.0084 0.0081
Obvious Cases
Film Digital delta (F-D) 95% ci (F-D) p
Area (Az) 0.9891 0.9918 -.0026 (-.0255, .0203) 0.8011
Standard Error 0.0081 0.0044 0.0101

51
Table 6--Az in Endodontics by Increasing Evaluator Experience and Case Type
Subtle Cases Moderate Cases Obvious Cases
Film Digital Film Digital Film Digital
Reader 5 (least) 0.9295 0.8592 0.9839 0.9712 0.9509 0.9931
Reader 4 0.9451 0.8582 0.9804 0.9617 1.0000 1.0000
Reader 2 0.8594 0.8917 0.9557 0.9820 1.0000 0.9863
Reader 1 0.8840 0.8694 0.9818 0.9815 0.9839 0.9713
Reader 6 0.8831 0.8727 0.9627 0.9749 1.0000 1.0000
Reader 3 (most) 0.9108 0.8879 0.9638 0.9752 1.0000 1.0000

52
Figure 10--ROC curves for Evaluators 1 and 2

53
Figure 11--ROC curves for Evaluators 3 and 4

54
Figure 12--ROC curves for Evaluators 5 and 6

55
6.2 Periodontics
No statistically significant differences were found in the area under the curve
(Az) between Film Digitized and Plain Film images in the category of mild (Table 7).
In the categories of moderate and severe, the datasets were very sparse because all
evaluators detected over 99% of pathosis with the highest confidence level. Az
values for moderate and severe categories were calculated by direct inspection of the
response matrices for some observers, and estimated for the remaining observers. We
therefore reject the null hypothesis--that FD images differ from PF images. There
was the expected increase in the ability of the readers to detect pathosis as the case
difficulty decreased from mild to severe. Individual evaluators Az performances
across the case types are summarized in Table 8. ROC curves in the mild category
demonstrated a variety of individual performances (Figure 13). In the moderate and
severe categories, the sparse response matrices prohibited the generation of ROC
curves due to a bug in the software.

56
Table 7--Periodontics Results by Case Type
Mild Cases
Film Digital delta (F-D) 95% ci (F-D) p
Area (Az) 0.9270 0.9050 0.0219 (-0.0712, 0.115) 0.5868
Standard Error 0.0192 0.0401 0.0380
Moderate Cases
Film Digital delta (F-D) 95% ci (F-D) p
Area (Az) ~1 ~1 ~0 ~1
Standard Error
Severe Cases
Film Digital delta (F-D) 95% ci (F-D) p
Area (Az) ~1 ~1 ~0 ~1
Standard Error

57
Table 8--Az in Periodontics by Increasing Evaluator Experience and Case Type
Mild Cases Moderate Cases Severe Cases
Film Digital Film Digital Film Digital
Reader 1 (least) 0.9219 0.7923 ~1 ~1 ~1 ~1
Reader 4 0.9344 0.9807 ~1 ~1 ~1 ~1
Reader 3 0.9186 0.8638 1.00 ~1 1.00 ~1
Reader 5 0.9067 0.9415 ~1 ~1 ~1 ~1
Reader 2 (most) 0.9533 0.9469 1.00 ~1 1.00 ~1

58
Figure 13--ROC curves for Evaluators 1 thru 5

59
CHAPTER 7
DISCUSSION
While no statistically significant differences were found between film
digitized (FD) and plain film (PF) images, it is not proven that no difference exists.
As the ROC curves show, there was a general decrease in diagnostic performance as
lesions became more subtle. This general decrease appeared to be coupled to a
divergence in the Az for film and digital. It is paramount to note these trends as
future ROC studies are designed because failure to include subtle and difficult cases
will markedly skew the ROC curves and misrepresent the potential performance
differences between modalities. All ROC studies should emphasize subtle and
difficult lesions unless they break out lesion subtlety as done in this study.
In analyzing ROC data, prior studies in dentistry41 have inappropriately
averaged Az values and performed multiple paired t-tests to evaluate statistical
significance. This practice can easily lead to overestimation of significance unless
corrections suggested by Swetts and Pickett45 as well as corrections for multiple
paired t-tests are used. As this investigation has shown, ROC can be a powerful,
convincing analytic technique when used with an adequate number of qualified
reviewers and careful case selection.
It was interesting to note that for the subtle cases in the endodontics model,
the more experience reviewers had less apparent difficulty making the adjustment to
digital radiography. Going into this study, none of the observers had any experience
with digital radiography, or viewing images on a CRT. There is certainly a learning

60
curve, and it may be that the less experienced evaluators were still gaining experience
evaluating pathosis which was confounded by having to learn a new viewing
modality. Also interesting to note, especially in the periodontics model, was that the
examiners had little difficulty detecting actual pathosis. Instead of missing pathosis,
they generally tended to over-interpret the radiographs calling normal radiographs
abnormal. This is a reflection of the general education and interpretation process
where the sins of omission (missed abnormality) are greater than the sins of
comission (overinterpretation of normals).
Withstanding the forgoing caveats, it appears that the digitization and display
system used has adequate image quality for primary interpretation of radiographic
findings relevant to endodontics and periodontics. Since this study is intended to
model teleradiology/teleconsultation as well as image archival and claims
adjudication, primary interpretation is an important factor. It is possible that images
digitized and sent for consultation with an expert may be of the more difficult variety,
hence image quality is more important. Yet with experienced observers such the
faculty of a university, FD images performed very well. This type of teleconsultation
with radiographs may be an alternative to sending patients from remote locations to
specialists to rule out suspected pathosis. The absence of statistically significant
difference in the more difficult task of primary interpretation indicates that
digitization and electronic submission of radiographs for claims adjudication is
feasible using this system.
While other entities such as caries detection have not been completely
evaluated, this and prior work by Kassebaum and McDavid35 would indicate that this
digitization/display system has adequate image quality for image archival. Their
system used a smallest spot size of 200µm, while the 300dpi XRS scanner used in the

61
present study has a spot size of 82µm which should increase the spatial resolution by
more than a factor of five. While spatial resolution is not the only measure of image
quality, it is an important starting point for characterizing new imaging systems.
The cost of this system used in this study is well within the range of a dental
practitioner. It is important to note that the high resolutions needed in medical
radiography, the associated high cost of equipment, large file sizes, and long
transmission times can be avoided in dentistry by using inexpensive hardware with
intelligent software. The spatial resolution of 300dpi for the XRS Scanner was more
than adequate to capture image detail. It was in the area of over and underexposed
images that image quality began to degrade. With these images, the normal optical
density (OD) ranges was compressed to either the low or high end of the scanner’s
optical density range. This had the effect of greatly reducing the number of gray
levels available for digitizing structures of diagnostic interest. While a sampling of
poor quality radiographs was included in this investigation, the numbers were to
small to make any conclusions about their impact on diagnostic performance. Further
work to automatically determine the best scanner parameters (gain, offset and lookup
tables) to improve the image quality with poor radiographs is in progress.

62
CHAPTER 8
CONCLUSIONS
The present study compared the ability of dentists with various levels of
advanced training to interpret film digitized radiographs using an inexpensive image
digitization/display system versus plain film intraoral radiographs. No statistically
significant differences between FD and PF were demonstrated in the ability of
experienced evaluators to detect radiographic findings important in endodontics,
namely periradicular radiolucencies, resorptions and calcifications. No statistically
significant differences between FD and PF were demonstrated in the ability of
experienced evaluators to detect radiographic findings important in periodontics,
namely bone loss of periodontal origin, calculus and furcation involvements. It is our
conclusion that the digitization and display system used has image quality that
experienced clinicians can make primary interpretations from digitized images. Uses
for this system would include; 1) teleradiology and teleconsultation; 2) electronic
submission of radiographs for claims adjudication; 3) construction of a digital image
archive useful in developing an electronic patient record.
8.1 Future Directions
One of the most important accomplishments of this work was establishing a
radiographic dataset in endodontics and periodontics. This is an exciting new area,
and the opportunities for improving several aspects of dentistry are in their infancy.
Some areas open for further research will be discussed.

63
8.1.1 Computer Aided Instruction
One major problem in dental education is exposure to variety of clinical cases.
Dental students may graduate having treated less than 10 teeth endodontically. How
can they reasonably be expected to have encountered the range of pathosis with the
attendant radiographic and clinical presentation? Often, teaching files are assembled
and students are instructed to review the cases and report their findings.
Unfortunately, with no mentor to point out the areas of interest and share pearls of
wisdom, interaction with experts does not occur. With software, interactive teaching
cases sets with motion video, voice overlay and user interaction makes for a much
more realistic learning situation. The pearls of wisdom from the expert are captured
in the computer software, and are used to guide the student through the radiographic
and clinical presentation of pathosis. The student may gain information that takes
years of clinical experience to acquire. As the student makes the transition to private
practice, these teaching cases can become part of the electronic office acting as an
instant second opinion and a source of constant lifelong learning. The body of
knowledge is expanding so rapidly that we must all be prepared to abandon our
current thinking on a daily basis46.
8.1.2 Standardized Testing
A natural fallout from Computer Aided Instruction (CAI) is standardized
interactive testing. The static multiple choice paradigm must fall before the next
major breakthrough in testing technology is realized. Often, the best learning
experience is gained by reviewing (interactive) a test with a faculty member,
discussing (interactive) correct and missed answers and picking up tips and insights.
Unlike static Scan-Tron® tests, electronic interactive tests can provide feedback on
incorrect answers, so the entire testing process becomes more than just an evaluation

64
tool, it becomes another learning tool. Easy electronic dissemination and aggregate
databases can allow collaboration between different universities across town, or
across the world, exposing all involved to new ideas and new thought.
8.1.3 Teleradiology and Teleconsultation
The undiscovered country. The cost effective introduction of digitization and
display technology, coupled with emerging advanced network software, digital
telephony services and video dialtone will re-invent the generalist-specialist
relationship. The current model of referral places great time demands on all involved
parties. The generalist first evaluates the patient and makes the referral decision. He
then must convince the patient to seek specialty care at an unknown office at
unspecified cost in an unfamiliar area after covering an unidentified distance. When
the patient arrives at the specialty office, another examination is performed with by an
unfamiliar clinician. When treatment is indicated, this process is necessary, but often,
all that is needed is a second set of eyes and a few reassuring words with no treatment
required.
8.1.4 Data Compression
From the viewpoint of image transmission in dentistry, today’s information
superhighway is much more like a muddy rut. The model of dental practice has 80%
solo general practitioners who are very cost conscious. The satellite uplinks, T1
leased phone lines and Integrated Services Digital Network (ISDN) technology used
in medicine may not be cost effective in dentistry for several years. Terabyte optical
disk farms are also beyond the reach of dentists for several more years. An interim
stop-gap measure is needed to reduce the time of transmission with conventional
modems and reduce storage requirements to a reasonable level. Data compression, or

65
more specifically, lossy data compression has the potential for reducing image size by
an order of magnitude without impacting diagnostic performance. Lossy data
compression works by discarding some information in an image in order to more
effectively pack the remaining information into a smaller space. This packed
information can later be reconstructed to re-generate an image that resembles the
original image to a varying degree. Preliminary work by this author, and work done
in medicine47 indicates that up to a 10:1 size savings may be effected without
detectable differences between the original image and the reconstructed image.
While the subjective and technical measures used in the author’s pilot project are
interesting, diagnostic performance needs to be evaluated with a variety of
compression techniques such as the commonly available Joint Photographic Experts
Group (JPEG), and newer Wavlet based compression techniques. This investigation
provides the perfect dataset to conduct such studies.
8.1.5 Claims Adjudication
Third party payers are responsible for about half of the payments made to
dentists for patient care. They exert an influence on the practice of dentistry that
cannot be ignored. Several of these carriers are beginning to look at a completely
electronic claim, complete with radiograph, as a necessary business decision to
remain financially solvent with increasing government regulation, rising medical
costs and corporate pressure. It is unclear what the role digital imagery will play in
the continuing reforming of the health care system, but the interest and pilot projects
now underway certainly point to some incorporation of digitized radiographs.
However, diagnostic quality images may or may not be needed for claims
adjudication and utilization review. This would allow very inexpensive technology,

66
or perhaps very high data compression to be applied to digitized radiographs for
insurance purposes.
8.1.6 Digital Image Archive
The ability to archive all radiographs on electronic media will have several
advantages. Images may be stored off-site for safe-keeping in cases of fires, floods,
theft or other disasters. Electronic copies may be sent anywhere in the world in
seconds. Storage space is highly localized, thus all records may be available for easy
review at the clinical workstation. Record misplacement or loss is very likely to be
reduced, perhaps even eliminated with computer management of information. Cases
are easily assembled into presentations for patient education, staff training, or dental
education. Emergency patients records may accessible at a remote site off-hours to
aid in proper patient care.
8.1.7 Electronic Patient Record
Construction of a Digital Image Archive is a necessary first step for building
an electronic patient record. One of the mandates of the Clinton health care reform
package, and a direction shared by all providers and regulators of health care is the
reduction of paperwork. In today’s increasingly specialized healthcare environment
with it’s complex hierarchy, mountains of paperwork and bureaucracy, there is almost
one clerk per patient in a hospital46. Only 20 cents of the health care dollar goes
directly to patient care, with health care workers spending 30% of their time filling
out paperwork46. Newer and better software allowing clinicians to communicate
well, avoid the redundancy of multiple tests ordered by several specialty care
providers who can’t find old test results and don’t document their own test results
may reduce costs by untold amounts, all while chronicling patient care better and

67
allowing health care providers to increase their focus on providing patient care,
instead of putting out bureaucratically generated red-tape fires. This more accurate
documentation of conditions, diagnosis and treatment is especially important because
of the aging population with the attendant shift from acute care to chronic care.

68
REFERENCES
1. American Association of Endodontists. AAE Communiqué. August 1992; Volume 9.
2. Kido S, Ikezoe J, Takeuchi N, Kondoh H, Johkoh T, Kohno N, Tomiyama N, Yamagami H, Naito H, Arisawa J, Kozuka T. Interpretation of Subtle Interstitial Lung Abnormalities: Conventional versus Film-digitized Radiography. Radiology 1994; 192: 171-176
3. Chang PJ. Evaluating Imaging Test Performance: An Introduction to Bayesian Analysis for Urologists. Monographs in Urology 1991; 12(2): 18-34.
4. Vining DJ, Gladish GW. Receiver Operating Characteristic Curves: A Basic Understanding. Radiographics 1992; 12: 1147-1154.
5. Pitts NB, Rimmer PA. An in-vivo comparison of radiographic and directly assessed clinical caries status of posterior approximal surfaces in primary and permanent teeth. Caries Res. 1992; 26: 146-152.
6. Okajima K, Nagata Y, et al. Quantitative Assesment of Digitized Portal Images: Effect of Sampling Frequency on Observer Performance. Radiology 1992; 183: 569-572.
7. Dorfman DD, Berbaum KS, Metz CE. Receiver Operating Characteristic Analysis: Generalization to the Population of Readers and Patients with the Jackknife Method. Invest. Radiol 1992; 9: 723-731.
8. Furkart AJ, Dove SB, McDavid WD, Numminkoski P, Matteson S. Direct digital radiography for the detection of periodontal bone lesions. Oral Surg 1992; 74: 652-660.
9. Metz CE, Wang PL, Kronman HB. A new approach for testing the significance of differences between ROC curves measured from correlated data. In: Deconink F, ed. Information processing in medical imaging. The Hague, The Netherlands: Martinus Nijhoff; 1984: 432-445.
10. Hanley JA. Receiver operating characteristic (ROC) methodology: the state of the art. Crit Rev Diagn Imaging 1989; 29: 307-335.

69
11. Bender IB, Seltzer S. Roentgenographic and direct observation of
experimental lesions in bone: I. JADA 1961: 62; 152-160.
12. Bender IB, Seltzer S. Roentgenographic and direct observation of experimental lesions in bone: II. JADA 1961: 62; 708-719.
13. Bender IB. Factors influencing the radiographic appearance of bony lesions. J Endodon. 1982; 8(4): 161-170.
14. Goldman M et al. Endodontic Success--Who’s reading the radiographs? Oral Surg. 1972; 33: 432-437.
15. Goldman M et al. Reliability of radiographic interpretations. Oral Surg. 1974; 38: 287-293.
16. Zachariasen K, Scott D, Jensen J. Endodontic recall radiographs: How reliable is our interpretation of endodontic success or failure and what factors affect our reliability? Oral Surg. 1984; 57(3): 343-347.
17. Fujita M, Kodera Y, Ogawa M, Wada T, Doi K. Digital image processing of periapical radiographs. Oral Surg. 1988; 65: 490-494
18. Orstavik D, Farrants G, Wahl T, Kerekes K. Image analysis of endodontic radiographs: digital subtraction and quantitative denstitometry. Endod Dent Traumatol. 1990; 6: 6-11.
19. Kullendorf B, Grondahl K, Rohlin M, Hendrikson CO. Subtraction radiography for the diagnosis of periapical bone lesions. Endod Dent Traumatol. 1988l 4: 253-259
20. Kravitz LH, Tyndall DA, Bagnell CP, Dove SB. Assessment of External Root Resorption Using Digital Subtraction Radiography. J Endodon. 1992; 18(6): 275-283
21. Wenzel A. Effect of image enhancement for detectability of bone lesions in digitized intraoral radiographs. Scand J Dent Res. 1988; 96: 149-160
22. Webber RL, Ruttiman UE, Grondahl HG. X-ray image subtraction as a basis for assessment of periodontal changes. J Periodont Res. 1982; 17: 509-511
23. Grondahl HG, Grondahl K. Subtraction radiography for the diagnosis of periodontal bone lesions. Oral Surg. 1983; 55: 208-213

70
24. Pascon EA, Introcaso HI, Langeland K. Development of predictable
periapical lesions as a monitored by subtraction radiography. Endod Dent Traumatol. 1987; 3: 192-208
25. Jeffcoat MK, Jeffcoat RL, Wilhams RC. A new method for the comparison of bone loss measurements on non-standardized radiographs. J Periodont Res. 1984; 19: 434-440
26. Kullendorf Bm Grondahl K, Rohlin M, Nilsson M. Subtraction radiography of interradicular bone lesions. Acta Odontol Scand. 1992; 50: 259-267.
27. Karayianni KN, Bragger U, Burgin W, Nielsen PM, Lang NP. Diagnosis of alveolar bone changes with digital subtraction images and conventional radiographs. Oral Surg. 1991; 72; 251-256
28. Hull PS, Hillam DG, Beal JF. A radiography study of the prevalence of chronic periodontitis in 14 year-old English school children. J Clin Periodont. 1975; 2: 203
29. Worth HM. Principles and Practice of Oral Radiologic Interpretation. 1963. Year Book Medical Publishers, Inc. Chicago, IL.
30. Greenstein A, Polson A, Iker H. Associations between crestal lamina dura and periodontal status. J Periodont. 1981; 52: 362
31. Mann J. Pettigrew J, Beidman R. Investigation of the relationship between clinically detected loss of attachment and radiographic changes in early periodontal disease. J Clin Periodont. 1985; 12: 247
32. Goodson JM, Haffajee AD, Socransky SS. The relationship between attachment level loss and alveolar bone loss. J Clin Periodon. 1984; 11: 348
33. Clerehugh V, Lennon MA. The radiographic appearance of early periodontal bone loss and its relationship to clinical loss of attachment. Br. Dent J. 1986; 161: 141
34. Rees TD, Biggs NL, Collings CK. Radiographic interpretation of periodontal osseous lesions. Oral Surg. 1971; 32(1): 141-153
35. Kassebaum D, McDavid W, Dove S, Waggener R. Spatial resolution requirements for digitizing dental radiographs. Oral Surg 1989; 67:760-769
36. Benz C, Mouyen F. Evaluation of the new RadioVisioGraphy system image quality. Oral Surg 1991; 72: 627-631.

71
37. Nelvig P, Wing K, Welander U. Sens-A-Ray: A new system for direct digital
intraoral radiography. Oral Surg 1992; 74: 818-823
38. McDonnell D, Price C. An evaluation of the Sens-A-Ray digital dental imaging system. Denomaxillofac. Radiol. 1993; 22: 121-126.
39. Welander U, McDavid WD, Sanderink GCH, Tronje G, Morner AC, Dove SB. Resolution as defined by line spread and modulation transfer functions of four digital intraoral radiographic systems. Oral Surg 1994; 78: 109-115.
40. Yokota ET, Miles DA, Newton CW, Brown CE. Interpretation of Periapical Lesions Using RadioVisioGraphy. J Endodon 1994; 20(10): 490-494.
41. Sanderink GCH, Huiskens R, van der Stelt PF, Welander US, Stheeman SE. Image quality of direct digital intraoral x-ray sensors in assessing root canal length. Oral Surg 1994; 78:125-132
42. Douglas CW. Guest Editorial: Evaluating Diagnostic Tests in Dentistry. JDR 1993; 72(8): 1170.
43. Bratthall D. Evaluating Diagnostic Tests--a Comment. JDR 1994; 73(2): 497-498
44. Dunn SM, Kantor ML. Digital Radiology Facts and Fictions. JADA 1993; 124: 38-47.
45. Swets JA, Pickett RM. Evaluation of diagnostic systems: methods from signal detection theory. New York; NY: Academic Press; 1982: 68-93
46. Peters T. The Tom Peters Seminar.Vintage Books, New York 1994.
47. Cosman PC, Davidson HC, Bergin CJ, Tseng CW, Moses LE, Riskin EA, Olshen RA, Gray RM. Thoracic CT images: Effect of Lossy Image Compression on Diagnostic Accuracy. Radiology 1994; 190: 517-524.