1 build out of the flood sensorweb dan mandl – nasa/gsfc 9-24-08
Post on 19-Dec-2015
218 views
TRANSCRIPT
1
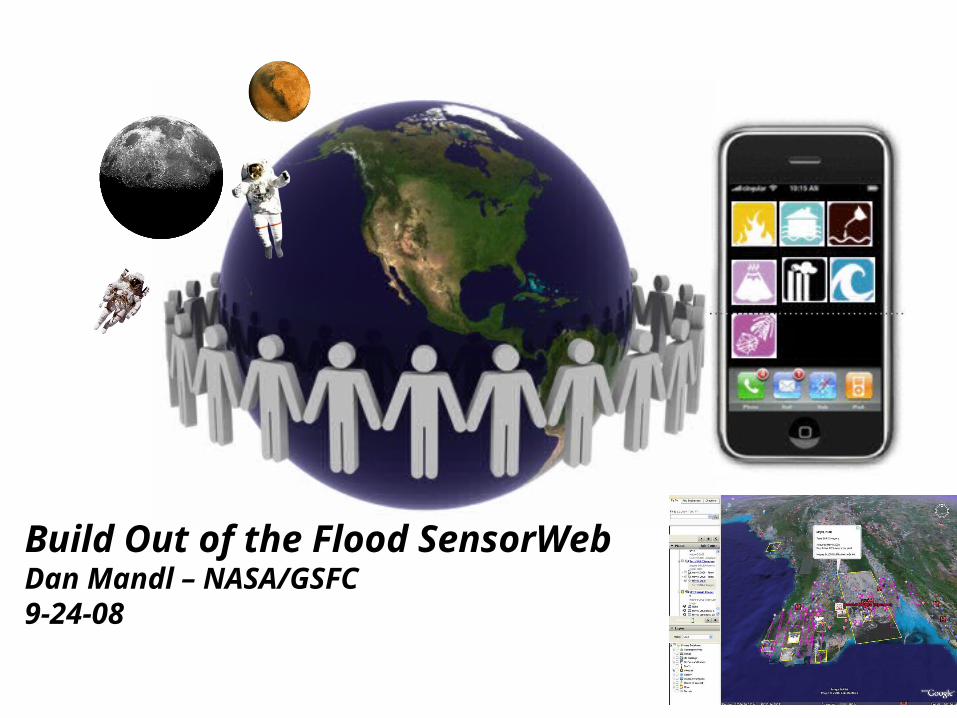
Build Out of the Flood SensorWebDan Mandl – NASA/GSFC9-24-08

• Vision of Flood Sensor Web• Present status of Flood SensorWeb initiative
Purpose
Before SensorWebs, How It Feels to Coordinate Sensors
3

4
Goal is to visualize available satellite data and possible future satellite data in an area of interest on Google Earth
Satellite imagery available on Myanmar flooding as a result of Nargis cyclone May 2008.
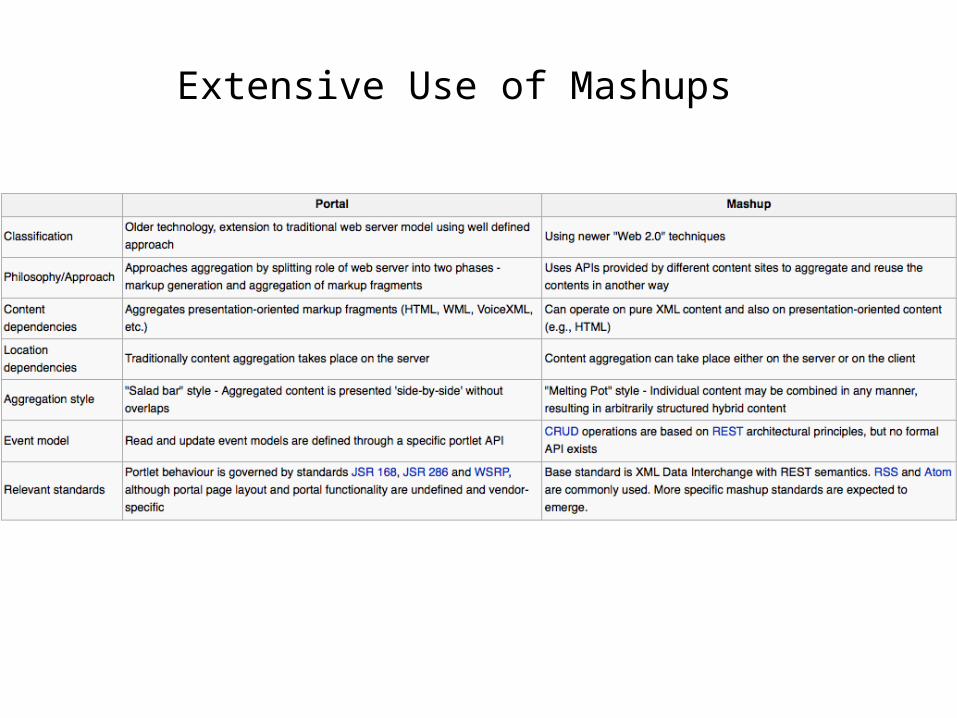
Extensive Use of Mashups
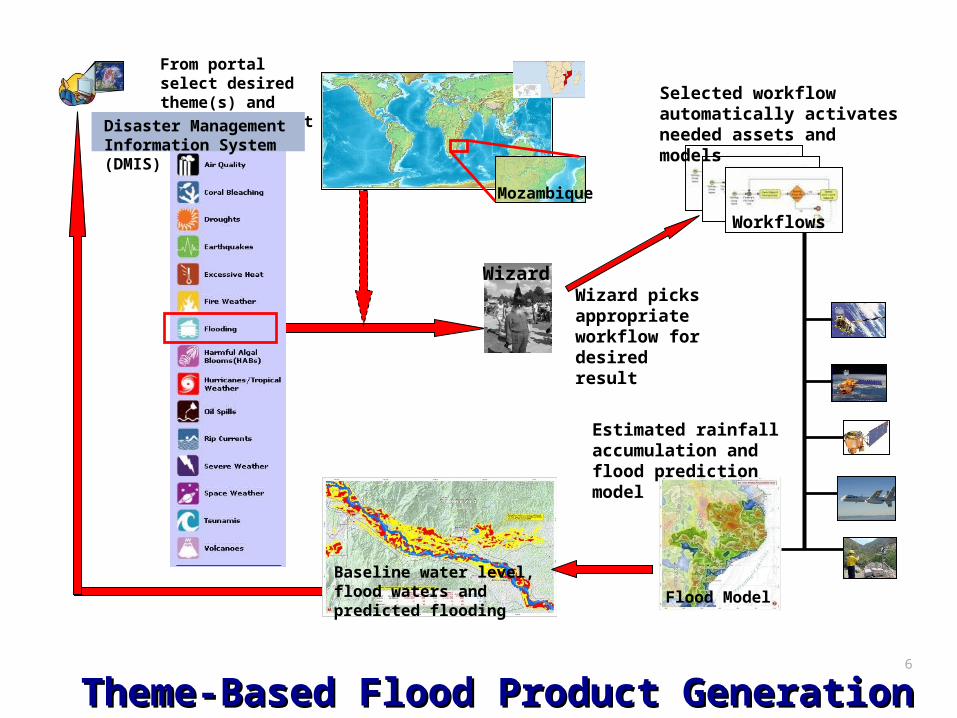
Theme-Based Flood Product GenerationTheme-Based Flood Product Generation6
From portal select desired theme(s) and area of interest
Wizard picks appropriate workflow for desired result
Wizard
Mozambique
Disaster Management Information System (DMIS)
Workflows
Estimated rainfall accumulation and flood prediction model
Flood Model
Selected workflow automatically activates needed assets and models
Baseline water level, flood waters and predicted flooding
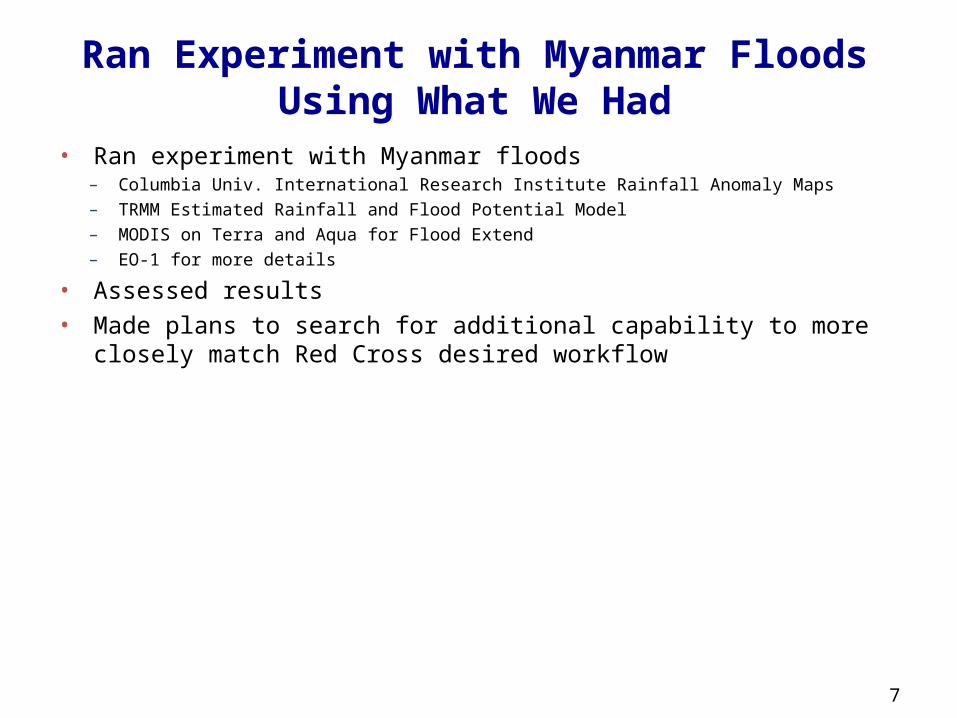
Ran Experiment with Myanmar Floods Using What We Had
• Ran experiment with Myanmar floods– Columbia Univ. International Research Institute Rainfall Anomaly Maps– TRMM Estimated Rainfall and Flood Potential Model– MODIS on Terra and Aqua for Flood Extend– EO-1 for more details
• Assessed results• Made plans to search for additional capability to more closely
match Red Cross desired workflow
7
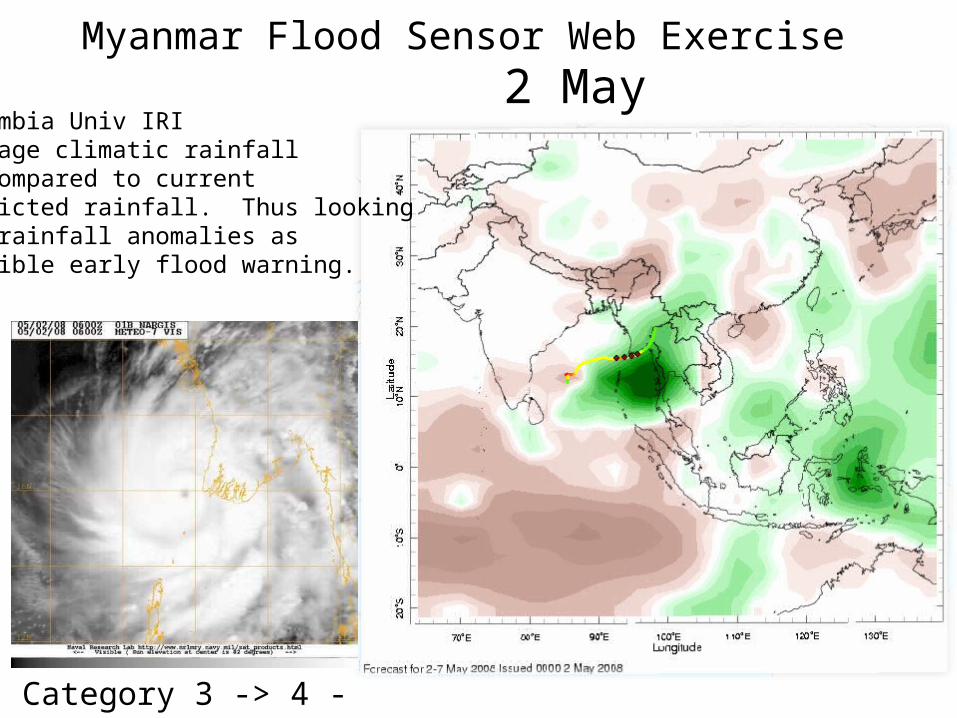
2 May
Category 3 -> 4 -> 2
Columbia Univ IRIAverage climatic rainfallas compared to currentPredicted rainfall. Thus lookingfor rainfall anomalies as Possible early flood warning.
Myanmar Flood Sensor Web Exercise
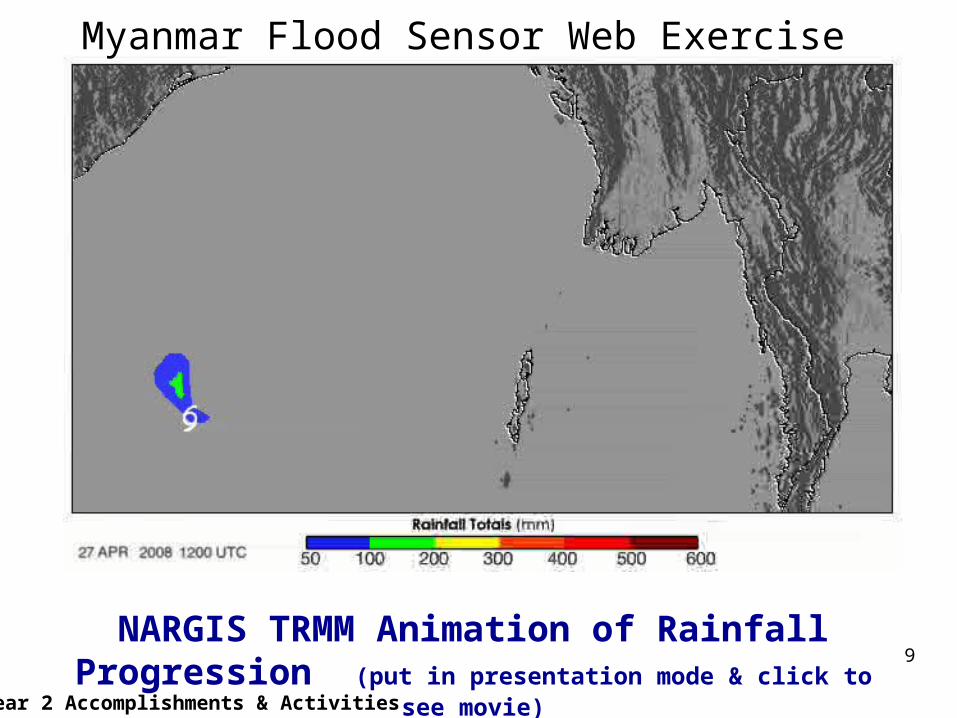
NARGIS TRMM Animation of Rainfall Progression (put in presentation mode & click to see movie)
9
Myanmar Flood Sensor Web Exercise
Year 2 Accomplishments & Activities
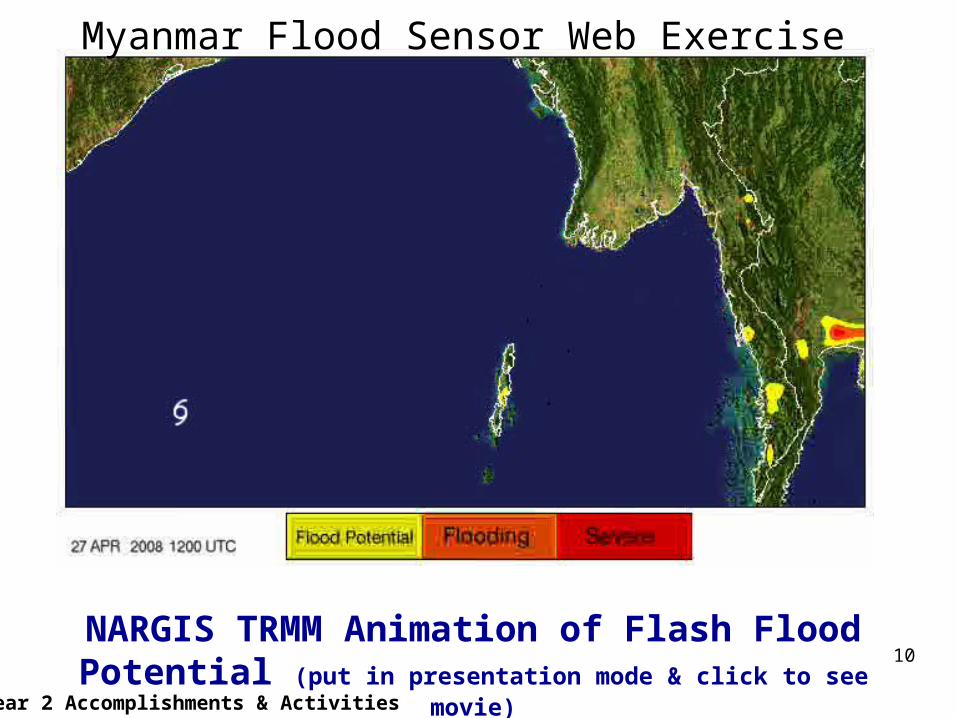
NARGIS TRMM Animation of Flash Flood Potential (put in presentation mode & click to see movie)
10
Year 2 Accomplishments & Activities
Myanmar Flood Sensor Web Exercise

11
Red - deepYellow - medium 1Green - medium 2Blue - shallow Black - no water
Burma May 5, 200815 km resolution
1. Real-time flood estimate using global hydrological model and satellite rainfall
estimate - Adler
Water Depth Classifier True color Advanced Land Imager 30m May 5, 2008
These two data productsare only approximately1/8 of entire image available
Inundation Map from Dartmouth Flood Observatory (using MODIS data) May 5, 2008
1 km resolution
2. MODIS used to validate flood locations with direct observation
3. EO-1 Advanced Land Imager automatically triggered and pointed to get more water depth details in area of interest.
4. Future experiment will be to substitute predicted rainfall versus real time rainfall estimate into Adler model to obtain predicted flood warning and automatically task EO-1 in area of interest and create MODIS and EO-1 data products
Year 2 Accomplishments & Activities
Myanmar Flood Sensor Web Exercise
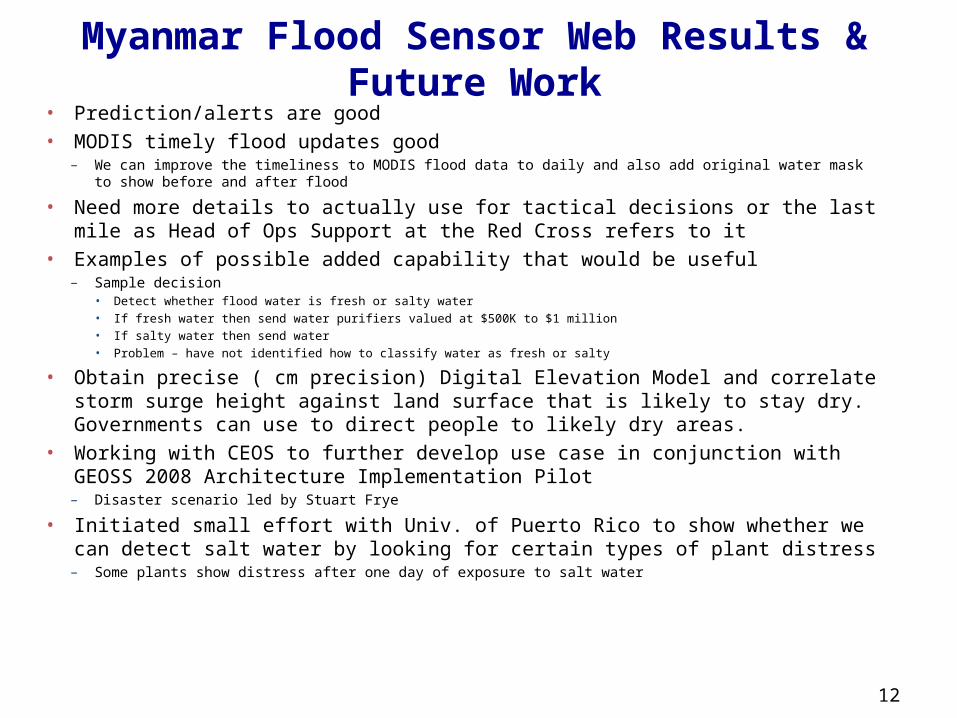
Myanmar Flood Sensor Web Results & Future Work
• Prediction/alerts are good• MODIS timely flood updates good
– We can improve the timeliness to MODIS flood data to daily and also add original water mask to show before and after flood
• Need more details to actually use for tactical decisions or the last mile as Head of Ops Support at the Red Cross refers to it
• Examples of possible added capability that would be useful– Sample decision
• Detect whether flood water is fresh or salty water• If fresh water then send water purifiers valued at $500K to $1 million• If salty water then send water• Problem – have not identified how to classify water as fresh or salty
• Obtain precise ( cm precision) Digital Elevation Model and correlate storm surge height against land surface that is likely to stay dry. Governments can use to direct people to likely dry areas.
• Working with CEOS to further develop use case in conjunction with GEOSS 2008 Architecture Implementation Pilot
– Disaster scenario led by Stuart Frye
• Initiated small effort with Univ. of Puerto Rico to show whether we can detect salt water by looking for certain types of plant distress
– Some plants show distress after one day of exposure to salt water
12
13
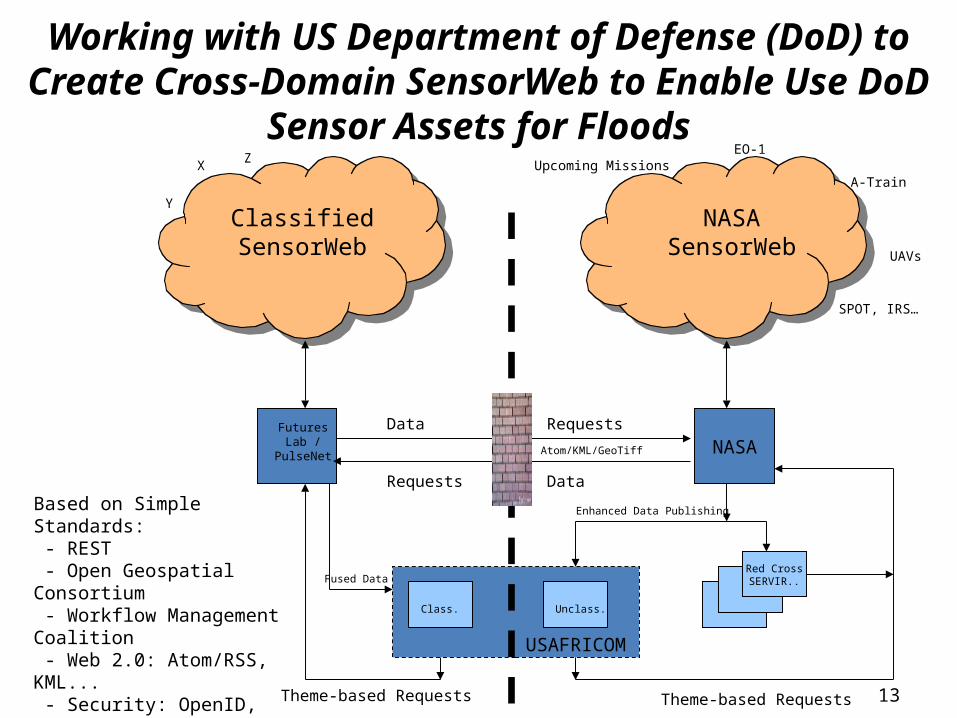
Working with US Department of Defense (DoD) to Create Cross-Domain SensorWeb to
Enable Use DoD Sensor Assets for Floods
NASASensorWeb
ClassifiedSensorWeb
EO-1
A-Train
UAVs
SPOT, IRS…
Upcoming Missions
NASA
Red CrossSERVIR..
USAFRICOM
FuturesLab /
PulseNet
Theme-based RequestsTheme-based Requests
Enhanced Data Publishing
Requests
Data
Data
Requests
Fused Data
Class. Unclass.
Based on Simple Standards: - REST - Open Geospatial Consortium - Workflow Management Coalition - Web 2.0: Atom/RSS, KML... - Security: OpenID, OAuth
X
Y
Z
Atom/KML/GeoTiff

Quickbird Image (2 ft res) – May 5, 2008 Myanmar
15
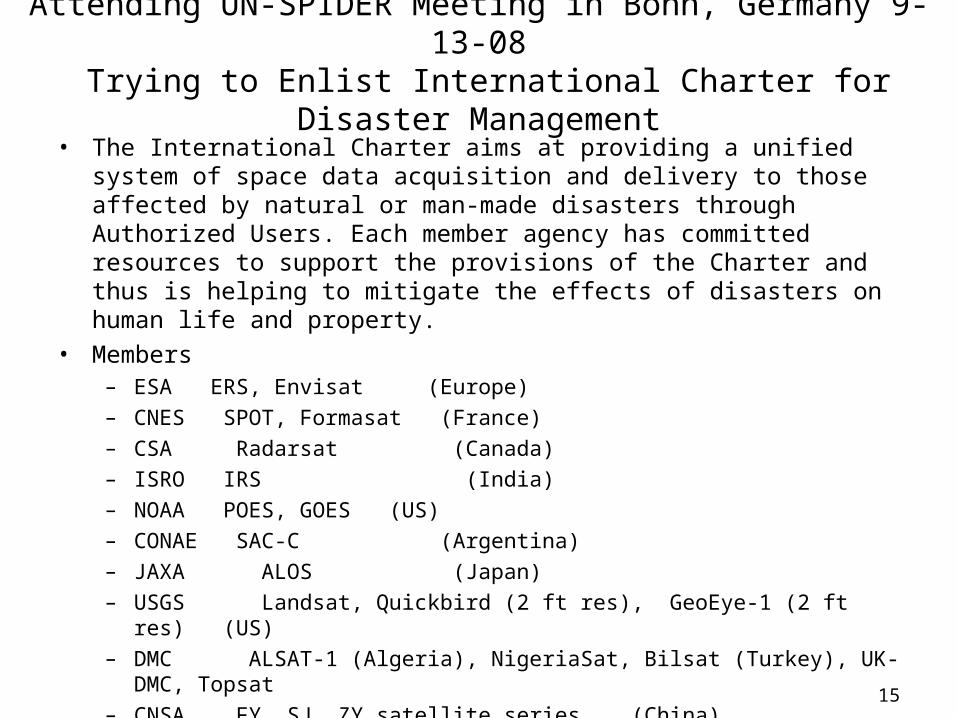
Attending UN-SPIDER Meeting in Bonn, Germany 9-13-08 Trying to Enlist International Charter for Disaster
Management• The International Charter aims at providing a unified system of
space data acquisition and delivery to those affected by natural or man-made disasters through Authorized Users. Each member agency has committed resources to support the provisions of the Charter and thus is helping to mitigate the effects of disasters on human life and property.
• Members– ESA ERS, Envisat (Europe)– CNES SPOT, Formasat (France)– CSA Radarsat (Canada)– ISRO IRS (India)– NOAA POES, GOES (US)– CONAE SAC-C (Argentina)– JAXA ALOS (Japan)– USGS Landsat, Quickbird (2 ft res), GeoEye-1 (2 ft res) (US)– DMC ALSAT-1 (Algeria), NigeriaSat, Bilsat (Turkey), UK-DMC, Topsat– CNSA FY, SJ, ZY satellite series (China)
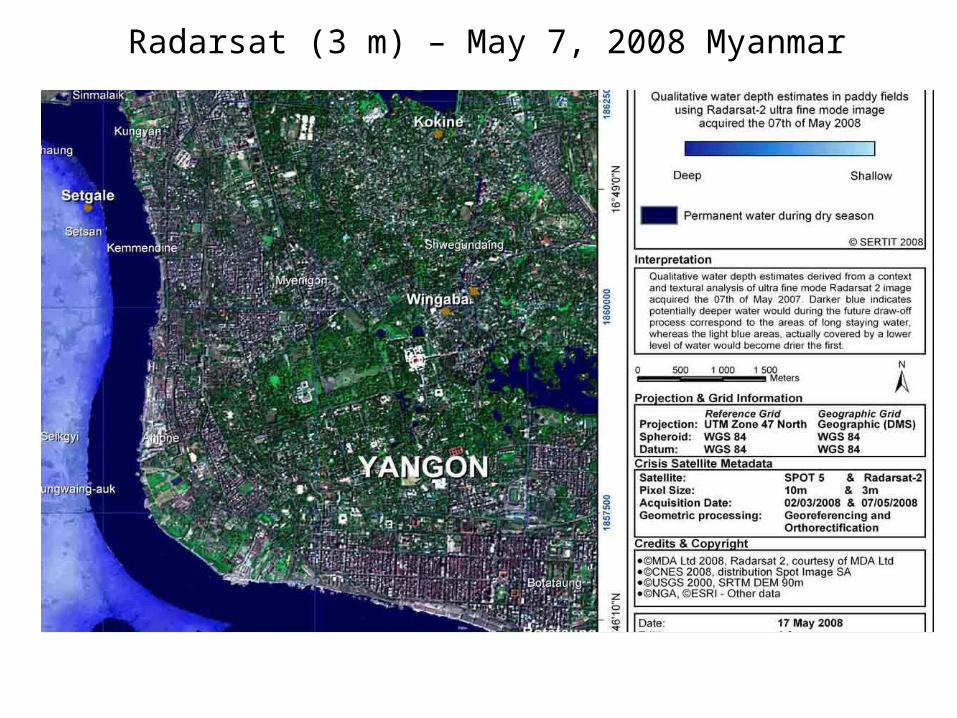
Radarsat (3 m) – May 7, 2008 Myanmar
• Following slides show some sample capabilities being developed for Fire SensorWebs that are applicable to Flood SensorWeb
Cross Integration of First Steps Via Fire SensorWeb
EO-1
EO-1
EO-1
ALI 4-3-2 Visible Bands
ALI 9-6-4 Bands
ALI 9-8-7 Infrared Bands
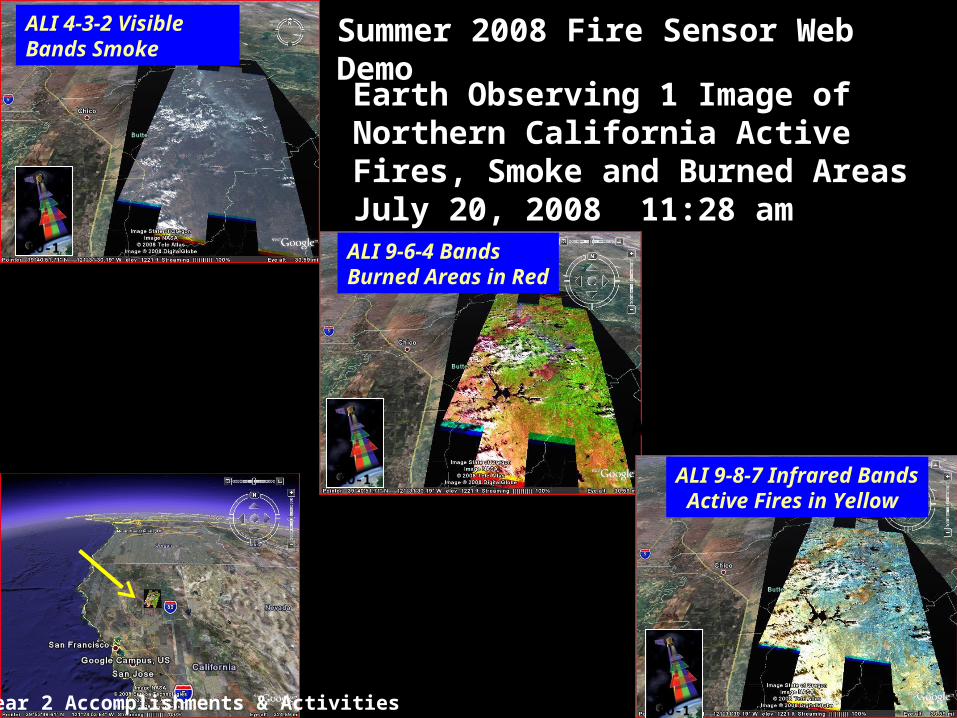
Earth Observing 1 Image of Northern California Active Fires, Smoke and Burned Areas July 20, 2008 11:28 am Pacific
Summer 2008 Fire Sensor Web Demo
Year 2 Accomplishments & Activities
ALI 4-3-2 Visible Bands Smoke
ALI 9-6-4 BandsBurned Areas in Red
ALI 9-8-7 Infrared Bands Active Fires in Yellow
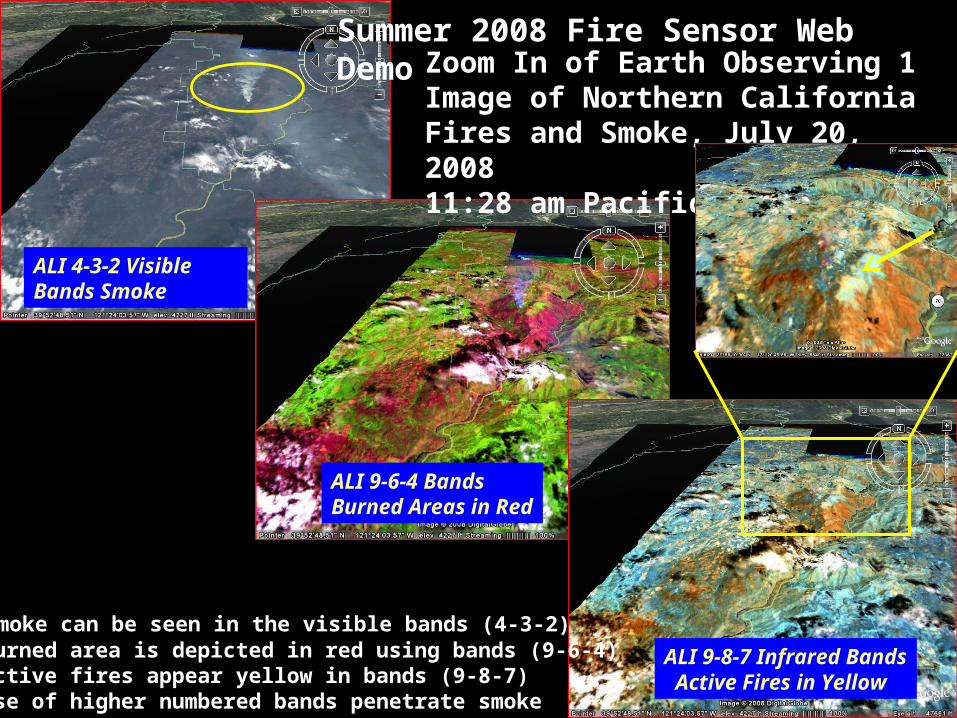
Zoom In of Earth Observing 1 Image of Northern California Fires and Smoke, July 20, 200811:28 am Pacific
• Smoke can be seen in the visible bands (4-3-2)• Burned area is depicted in red using bands (9-6-4)• Active fires appear yellow in bands (9-8-7)• Use of higher numbered bands penetrate smoke
ALI 4-3-2 Visible Bands Smoke
ALI 9-6-4 BandsBurned Areas in Red
ALI 9-8-7 Infrared Bands Active Fires in Yellow
Summer 2008 Fire Sensor Web Demo
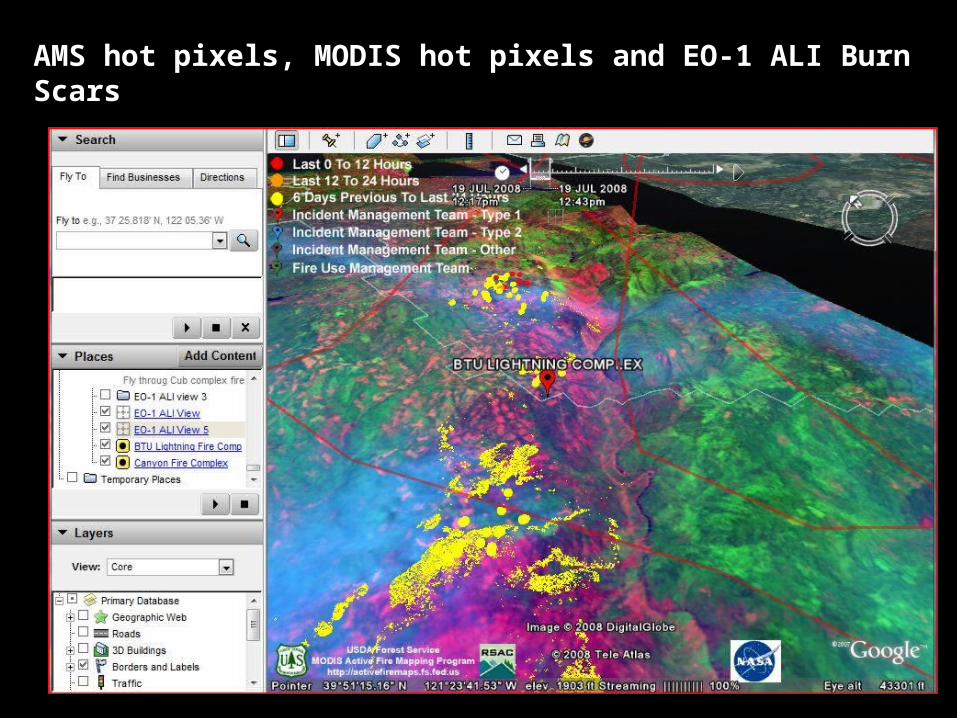
AMS hot pixels, MODIS hot pixels and EO-1 ALI Burn Scars
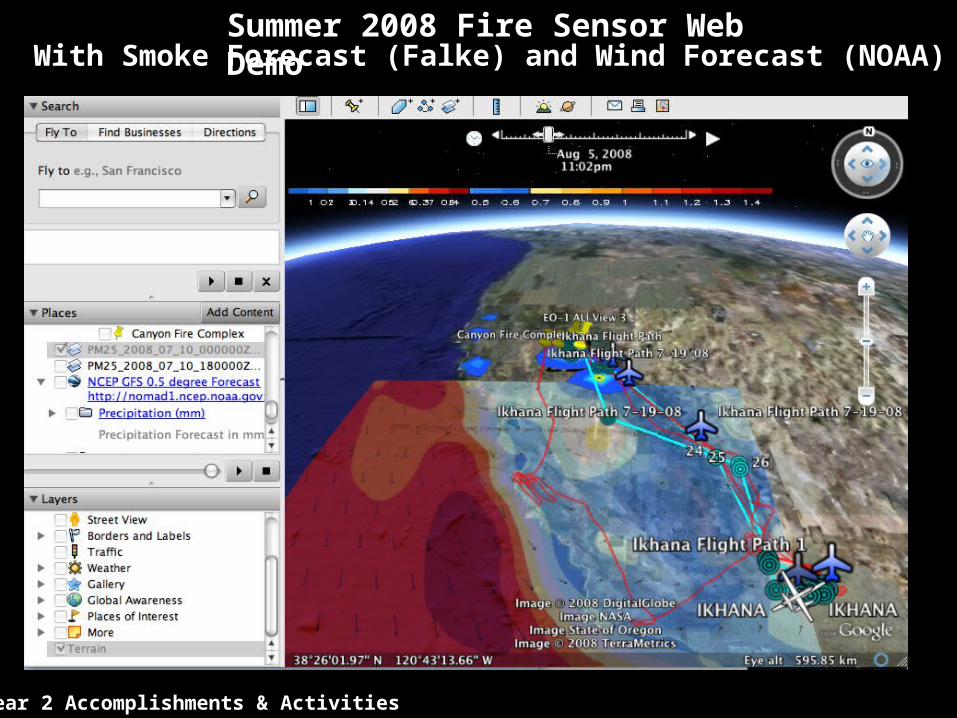
With Smoke Forecast (Falke) and Wind Forecast (NOAA)
Summer 2008 Fire Sensor Web Demo
Year 2 Accomplishments & Activities

Monitoring Ikhana Overflight on July 19, 2008 in Realtime
23
Satellite imagery available on Myanmar flooding as a result of Nargis cyclone May 2008.
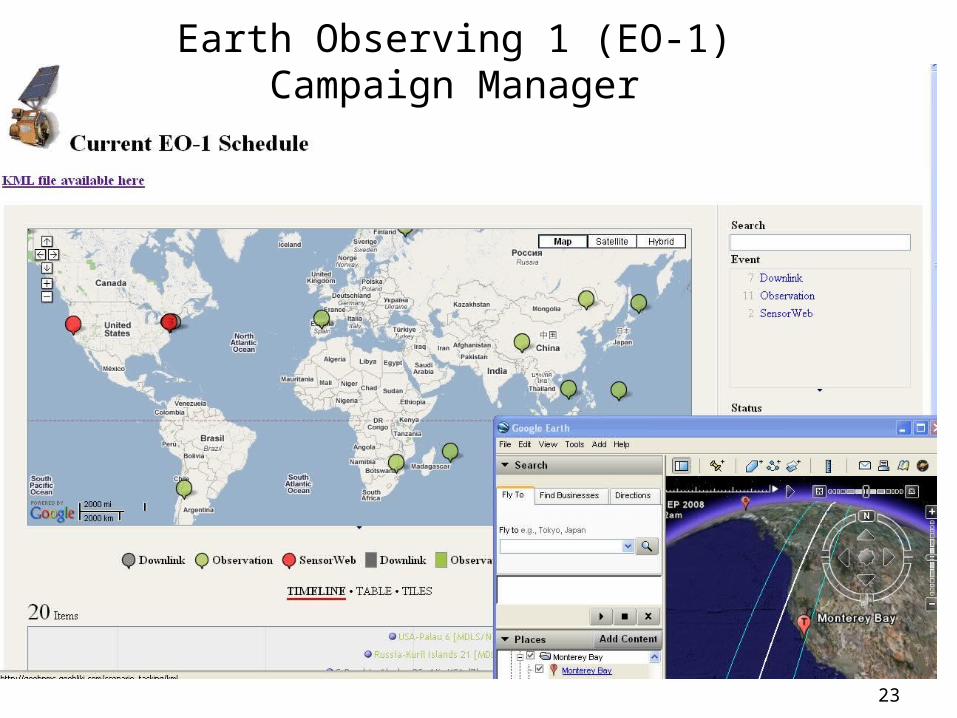
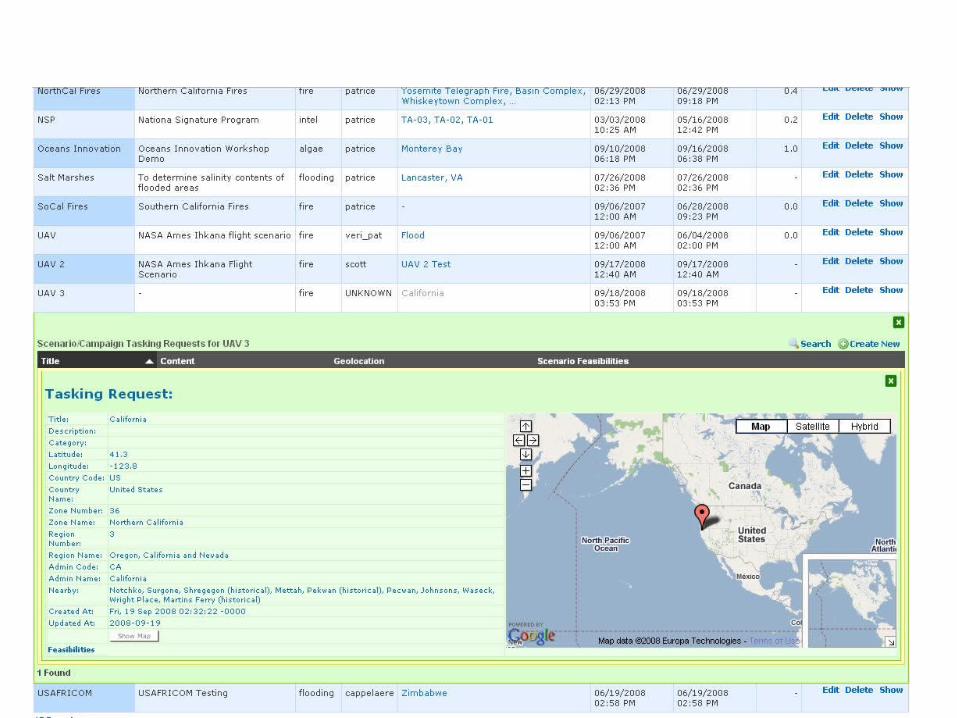
Earth Observing 1 (EO-1) Campaign Manager
24
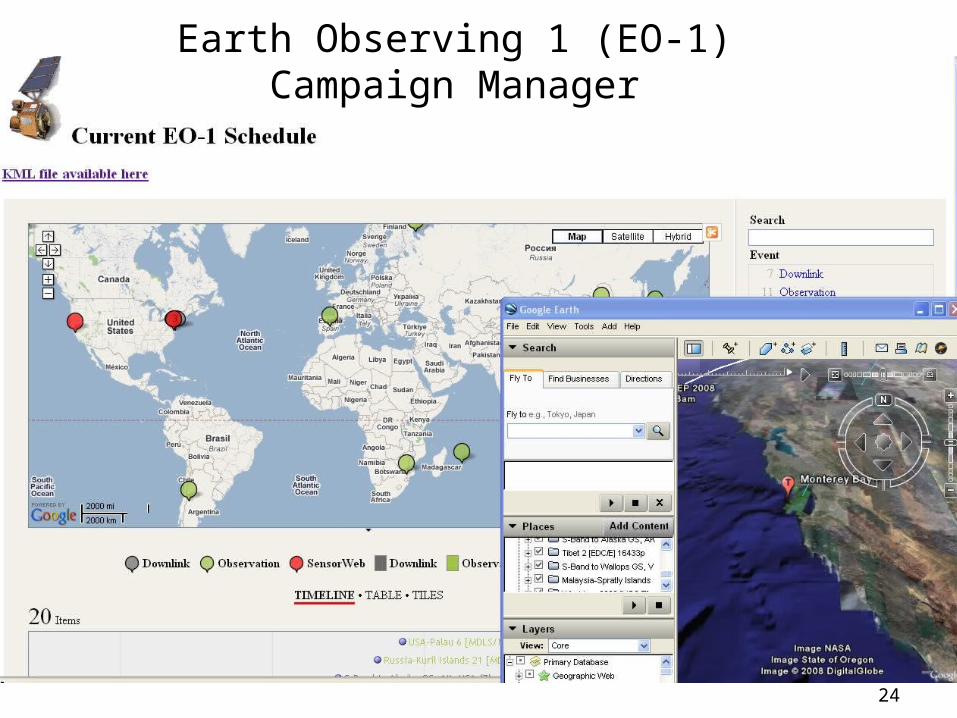
Earth Observing 1 (EO-1) Campaign Manager
25
Satellite imagery available on Myanmar flooding as a result of Nargis cyclone May 2008.
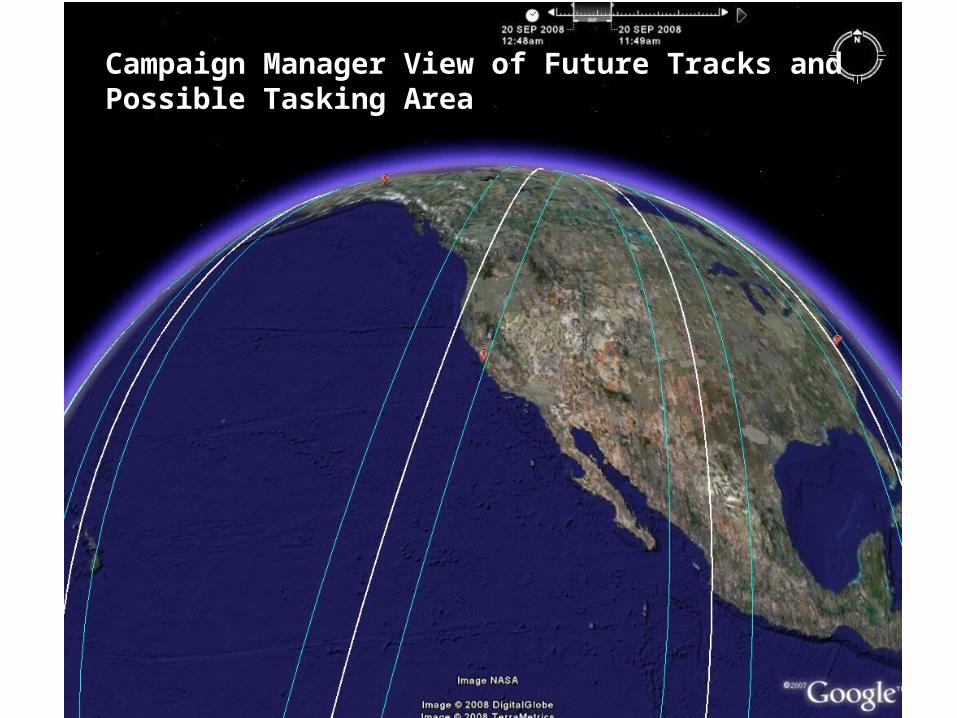
Campaign Manager View of Future Tracks and Possible Tasking Area
26
27
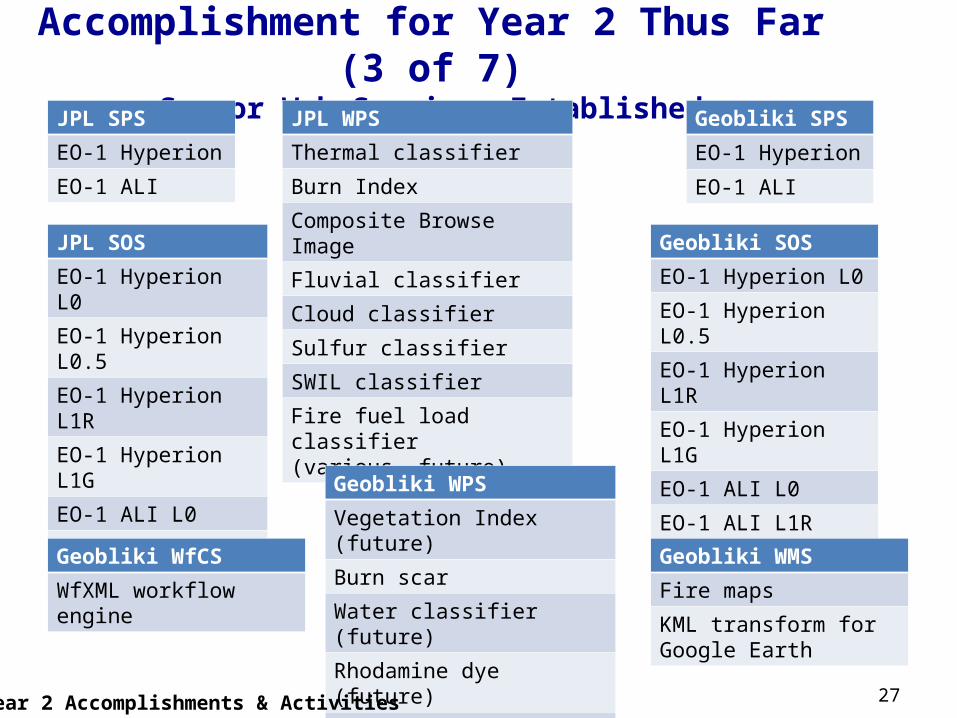
Accomplishment for Year 2 Thus Far (3 of 7)
Sensor Web Services EstablishedJPL SPS
EO-1 Hyperion
EO-1 ALI
Geobliki SPS
EO-1 Hyperion
EO-1 ALI
JPL SOS
EO-1 Hyperion L0
EO-1 Hyperion L0.5
EO-1 Hyperion L1R
EO-1 Hyperion L1G
EO-1 ALI L0
EO-1 ALI L1R
EO-1 ALI L1G
JPL WPS
Thermal classifier
Burn Index
Composite Browse Image
Fluvial classifier
Cloud classifier
Sulfur classifier
SWIL classifier
Fire fuel load classifier(various, future)
Geobliki WPS
Vegetation Index (future)
Burn scar
Water classifier (future)
Rhodamine dye (future)
Snow & Ice (future)
Geobliki SOS
EO-1 Hyperion L0
EO-1 Hyperion L0.5
EO-1 Hyperion L1R
EO-1 Hyperion L1G
EO-1 ALI L0
EO-1 ALI L1R
EO-1 ALI L1G
Year 2 Accomplishments & Activities
Geobliki WMS
Fire maps
KML transform for Google Earth
Geobliki WfCS
WfXML workflow engine

28
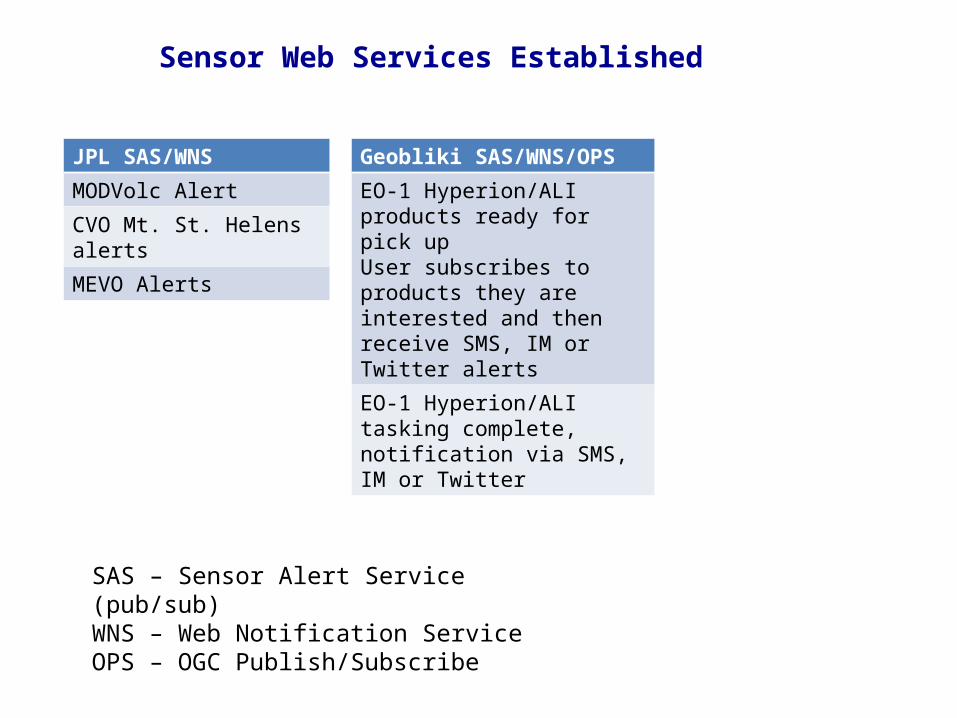
Sensor Web Services Established
Draper WPS
AFWA Cloud Cover
GMU WCS
Hot Pixels
AMES WCS
Ikhana UAS hot pixels
WVHTF WfCS
Sensor Workflow Engine
Northrop Grumman WPS
Smoke Model
ASTER SPS
ASTER
AMES SPS
Ikhana UAS Wildfire Instrument
AMES WMS
Ikhana UAS Wildfire Images & Fire location maps
KML transform for Google Earth
GMU WCS-T
Transform Hot Pixels for Map production
GMU WfCS
BPEL engine to execute workflow
ASTER SPS
ASTER
MODIS WFS
MODIS Hot Pixels
Earth Science Gateway CSW
NASA data
Global Change Management Directory CSW
NASA data
SPOT-5 SPS
SPOT-5
Sensor Web Services Established
JPL SAS/WNS
MODVolc Alert
CVO Mt. St. Helens alerts
MEVO Alerts
Geobliki SAS/WNS/OPS
EO-1 Hyperion/ALI products ready for pick upUser subscribes to products they are interested and then receive SMS, IM or Twitter alerts
EO-1 Hyperion/ALI tasking complete, notification via SMS, IM or Twitter
SAS – Sensor Alert Service (pub/sub)WNS – Web Notification ServiceOPS – OGC Publish/Subscribe

New Web Service Being TestedSensor Web Services Established
Prototype web service that Geo-rectified Advanced Land Imager ontomap with clouds removed. (Dr. Nevin Bryant/JPL - AFIDS)
WPS ALI Geo-rectification
Automatic geo-rectification of ALI images
Year 2 Accomplishments & Activities
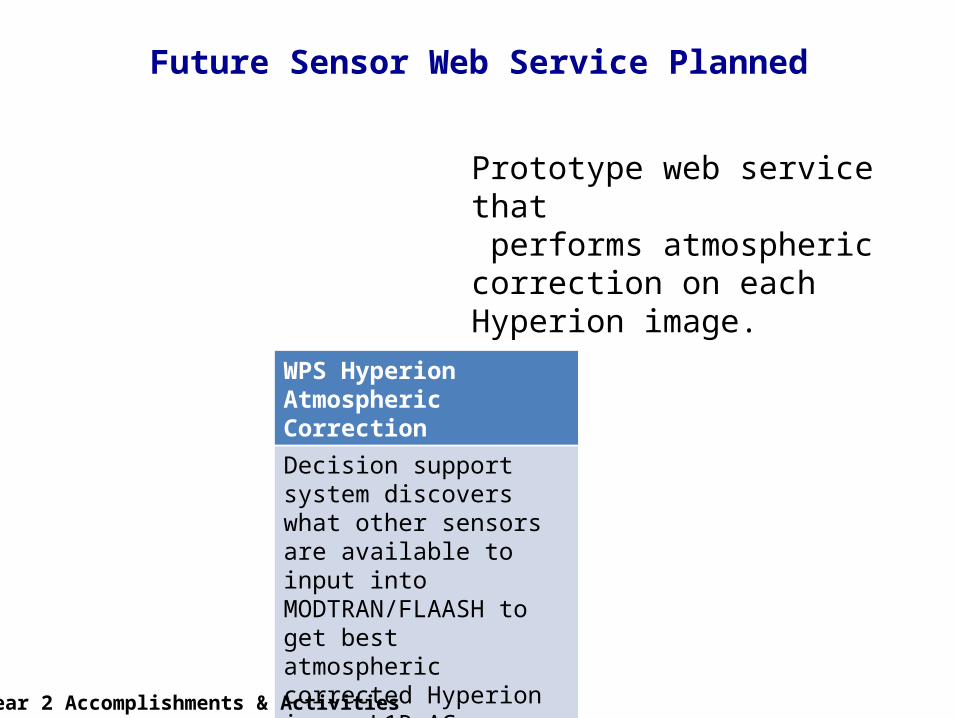
Prototype web service that performs atmospheric correction on each Hyperion image.
WPS Hyperion Atmospheric Correction
Decision support system discovers what other sensors are available to input into MODTRAN/FLAASH to get best atmospheric corrected Hyperion image L1R-AC
Future Sensor Web Service Planned
Year 2 Accomplishments & Activities
• Making good progress towards creation of real SensorWeb capabilities towards the SensorWeb vision
• Soliciting other organizations to build additional capabilities to provide critical mass of resources to make SensorWeb compelling
• Goal is to double assets, users and products of SensorWeb every 18 months
Conclusion