1 antonio f. b. costa marcela a. g. machado são paulo state university production department brazil...
TRANSCRIPT
1
Antonio F. B. Costa
Marcela A. G. Machado
São Paulo State University
Production Department
Brazil
THE BRAZILIAN COUCIL FOR SCIENTIFIC AND TECHNOLOGICAL DEVELOPMENT
A Side-Sensitive Synthetic Chart Combined with a VSS Mean Chart
2
Sample number1 2 3 4 5
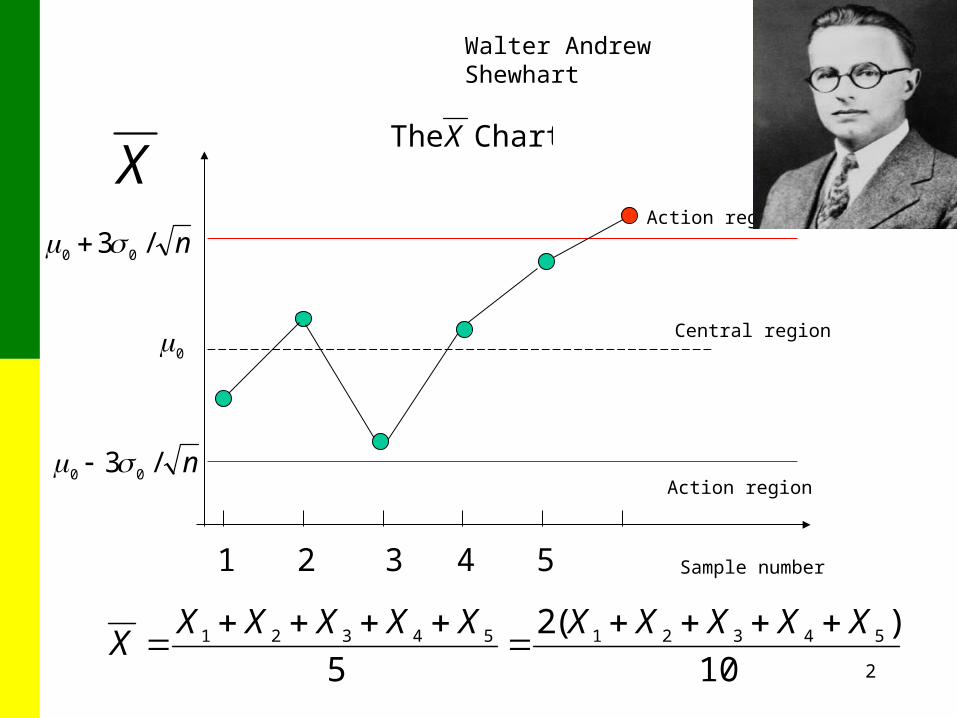
Chart The X
Central region
Action region
Action region
n/3 00
n/3 00
X
0
10
)(2
55432154321 XXXXXXXXXX
X
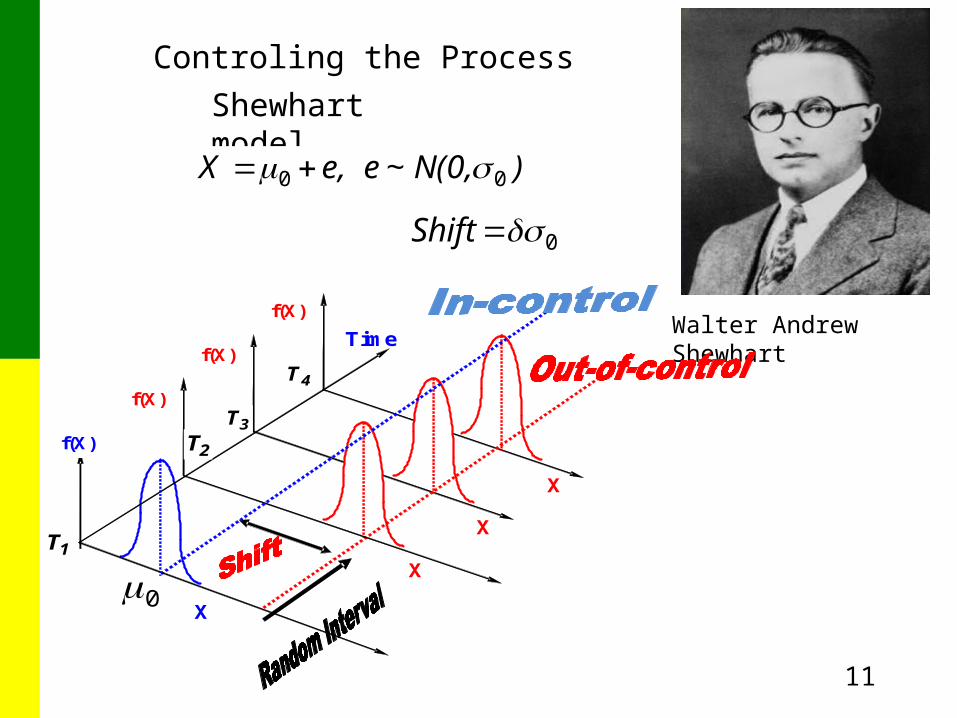
Walter Andrew Shewhart
3
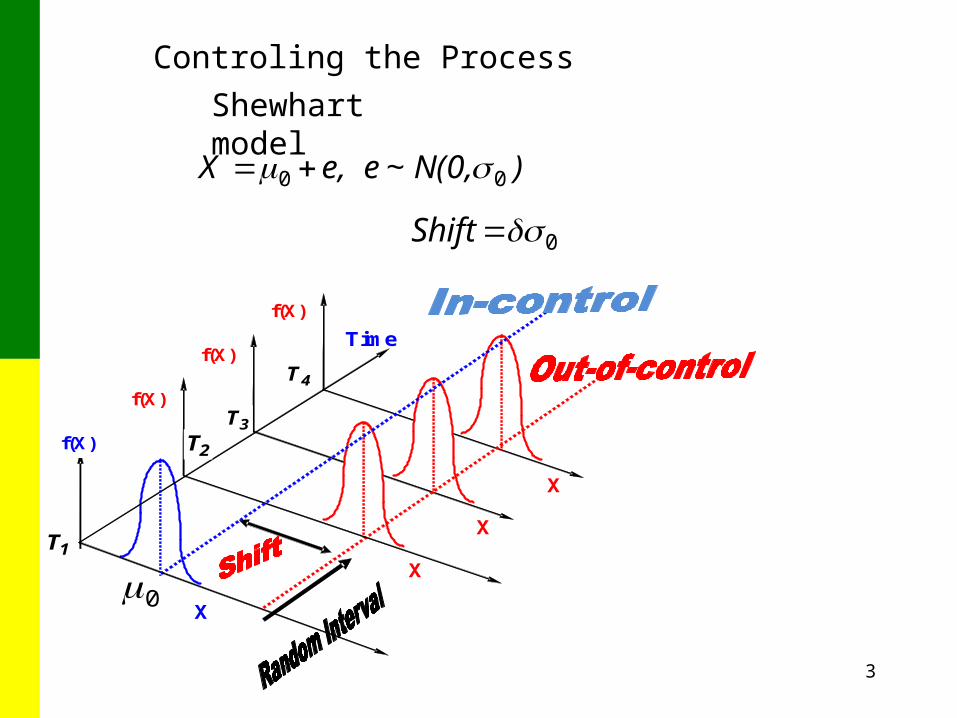
Controling the Process
0Shift
)N(0,~e e,X 00
Shewhart model
X
f(X)
Time
3T
4T
1T X
X
X
2T
f(X)
f(X)
f(X)
0
4
5

6
7
8
9
0 1 2 3 4 5 6 7 8 9 10
Sample number
UCL
LCL
UCL
L=5
LCL
CL
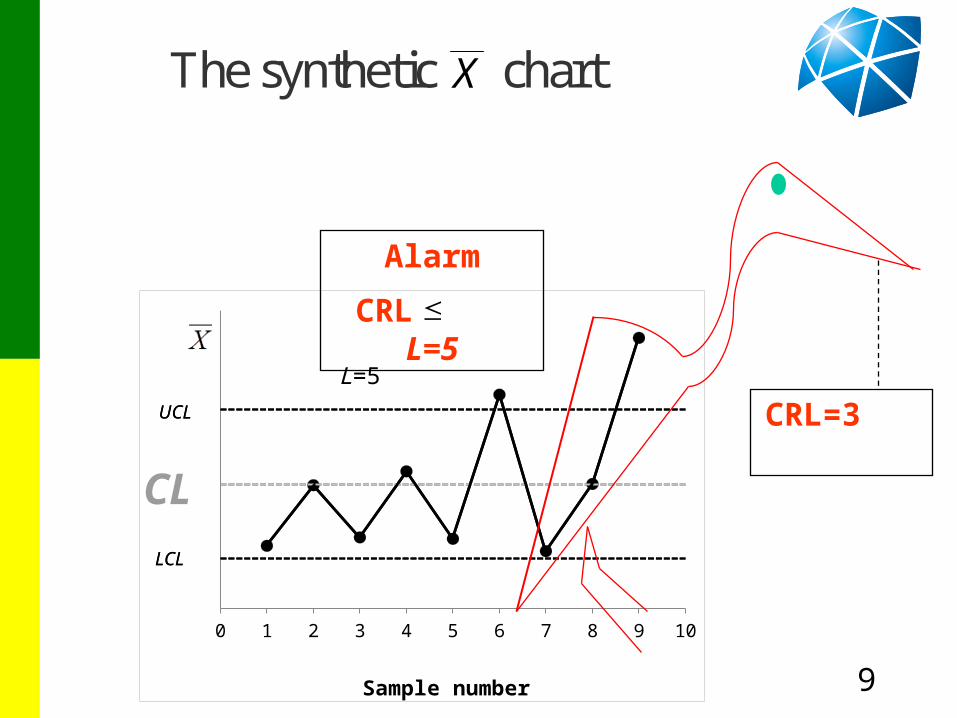
The synthetic X chart
Alarm
CRL L=5
CRL=3
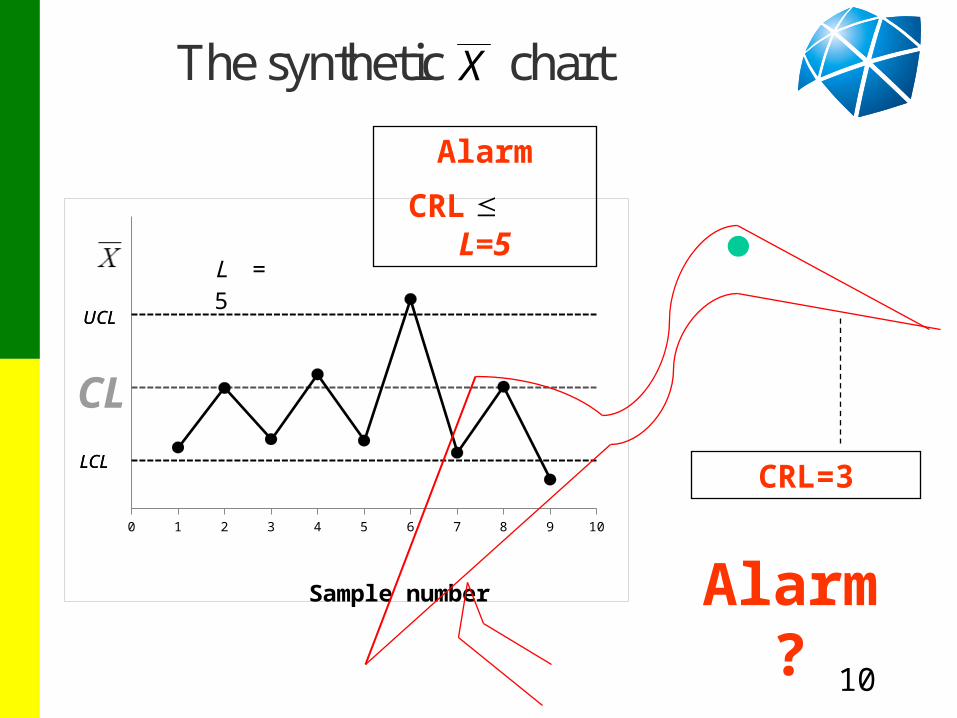
10
0 1 2 3 4 5 6 7 8 9 10
Sample number
UCL
LCL
UCL
L = 5
LCL
CL
CRL=3
Alarm
CRL L=5
The synthetic X chart
Alarm ?
11
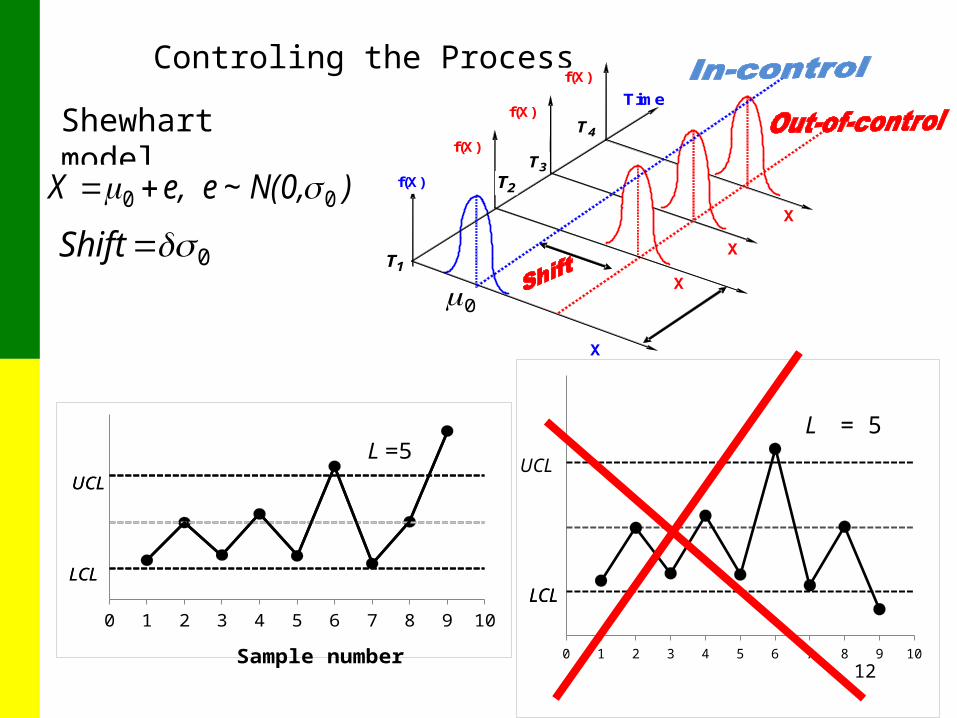
Controling the Process
Walter Andrew Shewhart
0Shift
)N(0,~e e,X 00
Shewhart model
X
f(X)
Time
3T
4T
1T X
X
X
2T
f(X)
f(X)
f(X)
0
12
Controling the Process
0Shift
)N(0,~e e,X 00
Shewhart model
0 1 2 3 4 5 6 7 8 9 10
UCL
LCL
L = 5
LCL0 1 2 3 4 5 6 7 8 9 10
Sample number
UCL
LCL
UCL
L =5
LCL
X
f(X)
Time
3T
4T
1T X
X
X
2T
f(X)
f(X)
f(X)
0
13
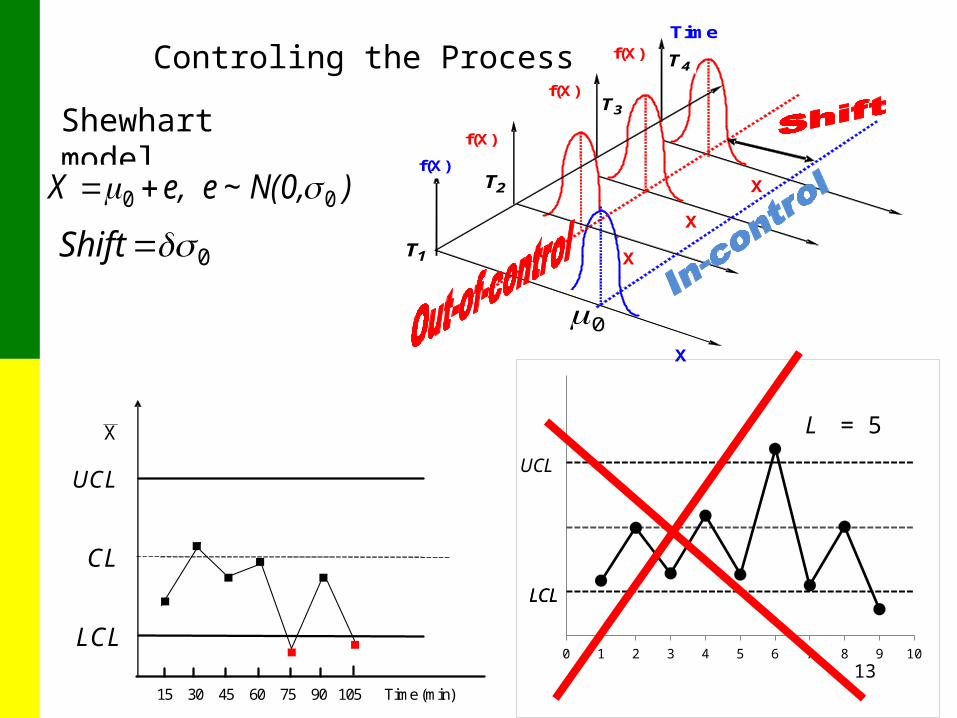
Controling the Process
0Shift
)N(0,~e e,X 00
Shewhart model
X
f(X)
Time
3T
4T
1T
X
X
X 2T
f(X)
f(X)
f(X)
0
15 30 45 60 75 90 105 Time (min)
X
LCL
CL
UCL
0 1 2 3 4 5 6 7 8 9 10
UCL
LCL
L = 5
LCL
14
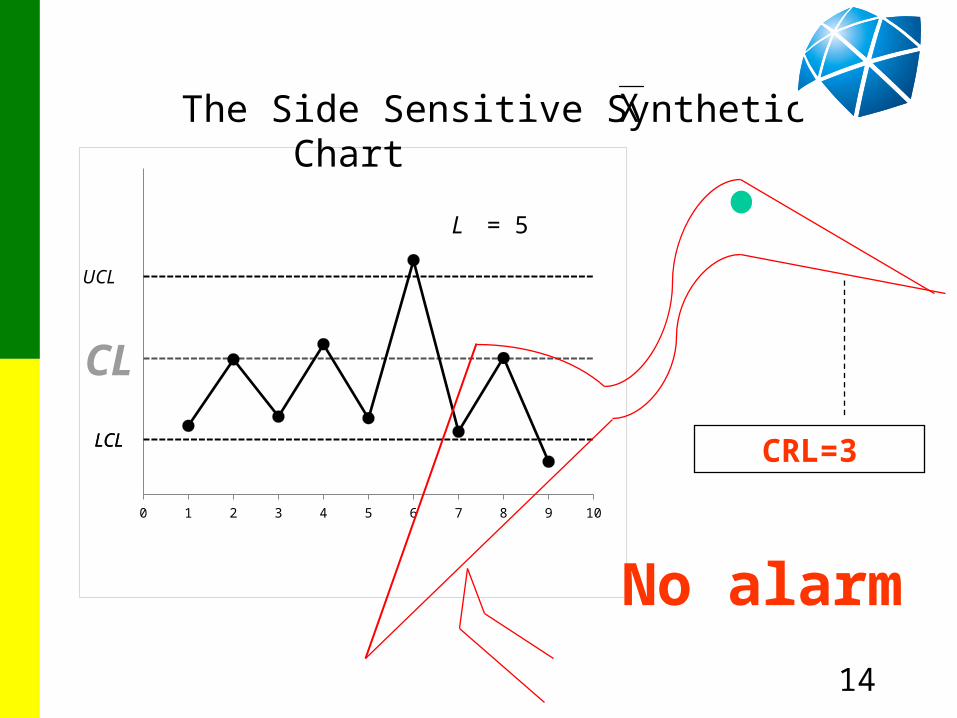
0 1 2 3 4 5 6 7 8 9 10
UCL
LCL
L = 5
LCLCRL=3
The Side Sensitive Synthetic Chart X
No alarm
CL
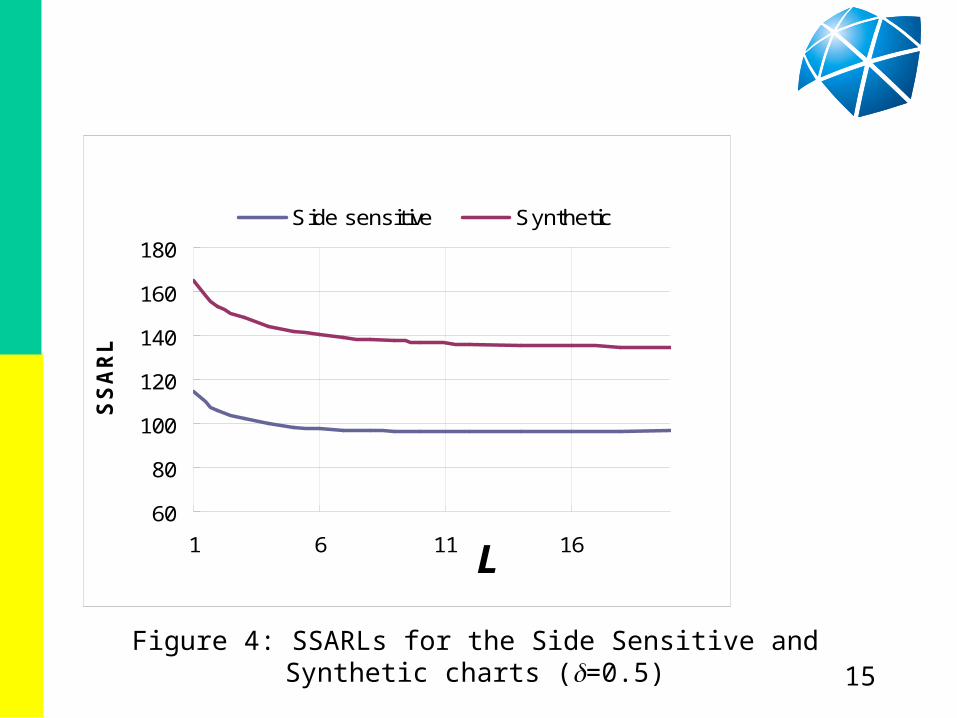
60
80
100
120
140
160
180
1 6 11 16L
SSARL
S ide s ens itive S ynthetic
Figure 4: SSARLs for the Side Sensitive and Synthetic charts (d=0.5)15
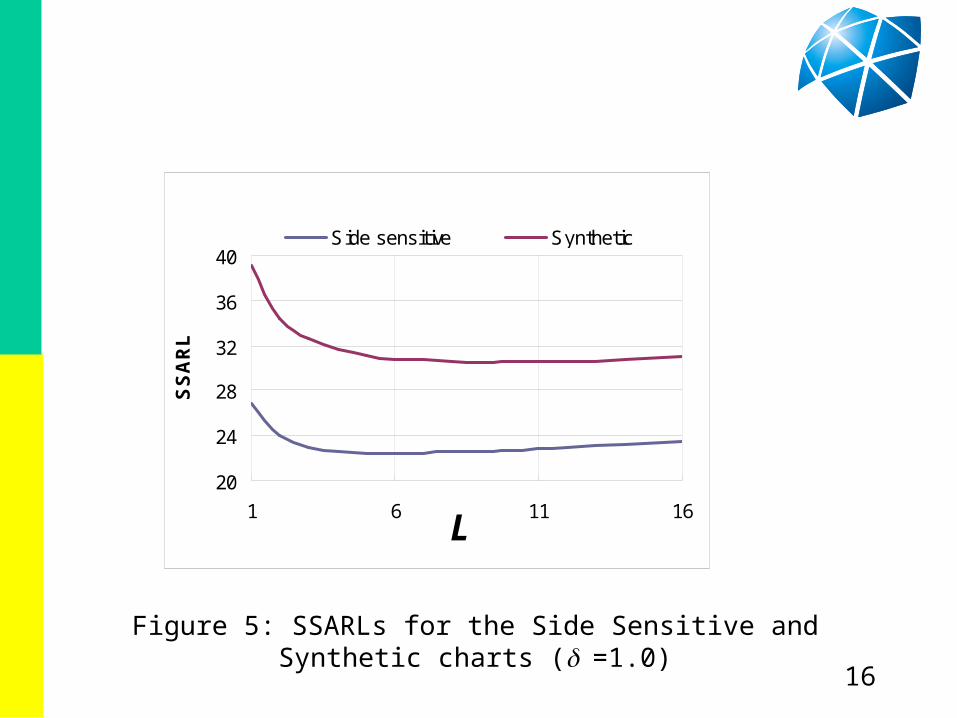
20
24
28
32
36
40
1 6 11 16L
SSARL
S ide s ens itive S ynthetic
Figure 5: SSARLs for the Side Sensitive and Synthetic charts ( d =1.0)
16
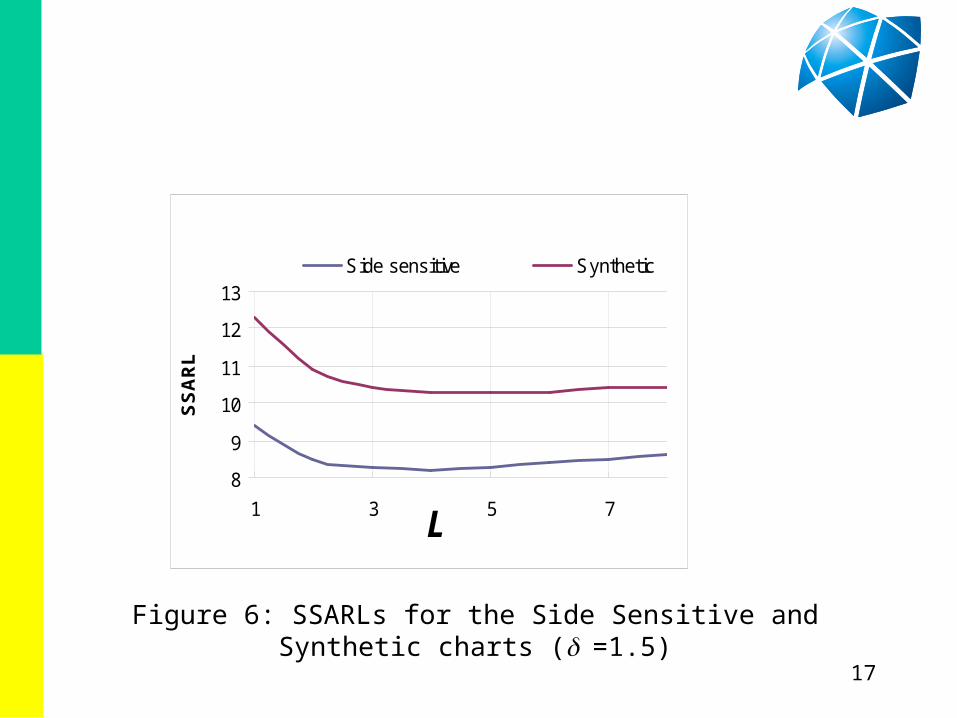
8
9
10
11
12
13
1 3 5 7L
SSARL
S ide s ens itive S ynthetic
Figure 6: SSARLs for the Side Sensitive and Synthetic charts ( d =1.5)
17
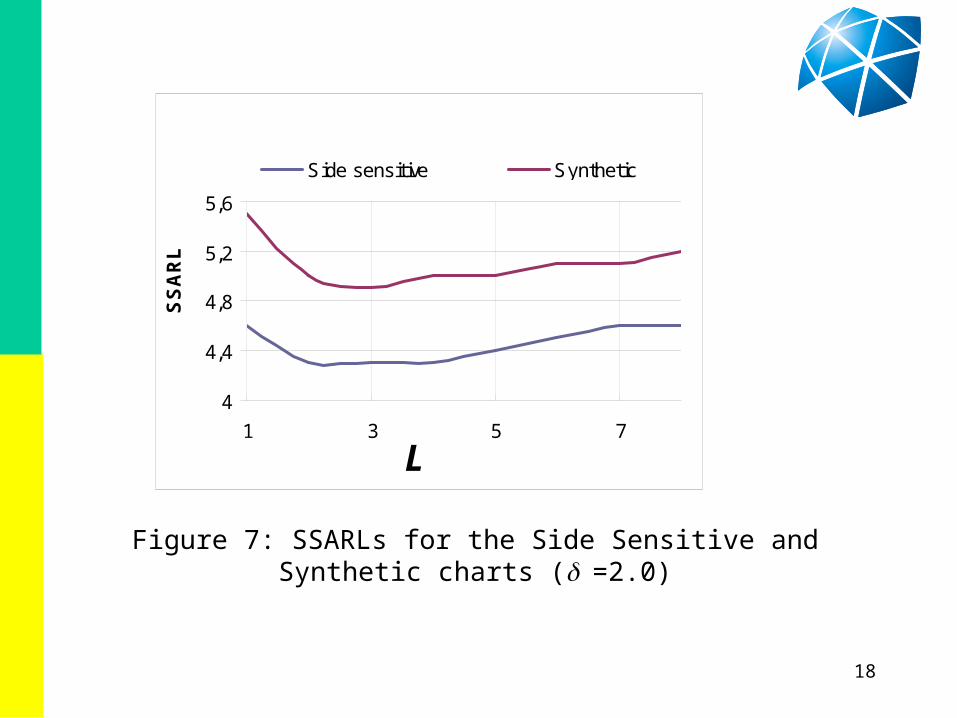
4
4,4
4,8
5,2
5,6
1 3 5 7
L
SSARL
S ide s ens itive S ynthetic
Figure 7: SSARLs for the Side Sensitive and Synthetic charts ( d =2.0)
18
19
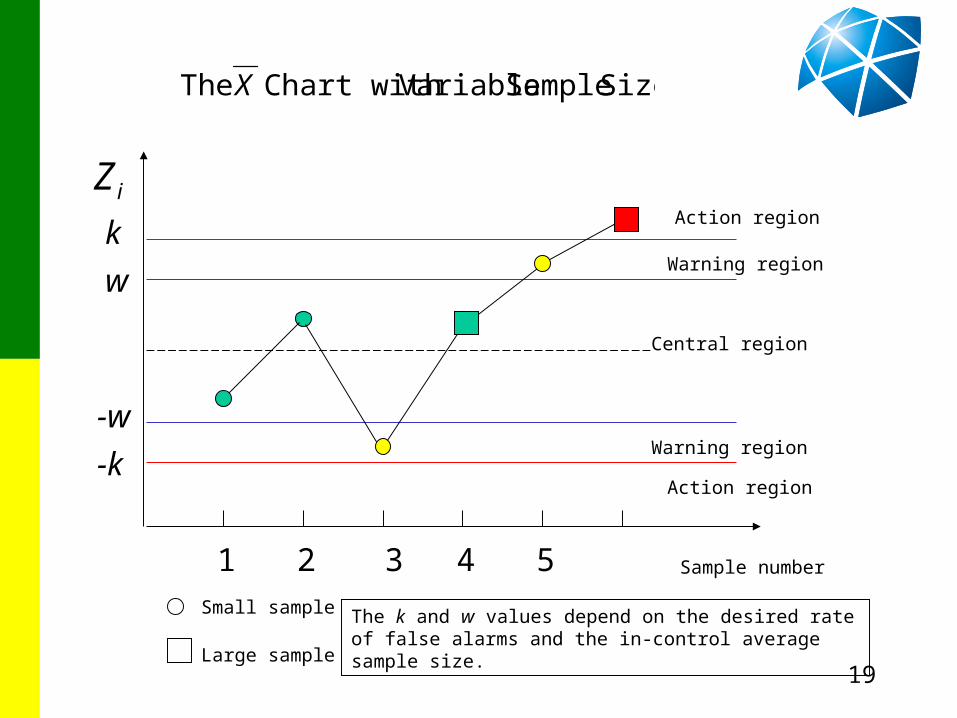
Sample number
iZ
1 2 3 4 5Small sample
Large sample
Size Sample Variable Chart with The X
w
k
-w
-kWarning region
Warning region
Central region
Action region
Action region
The k and w values depend on the desired rate of false alarms and the in-control average sample size.
20
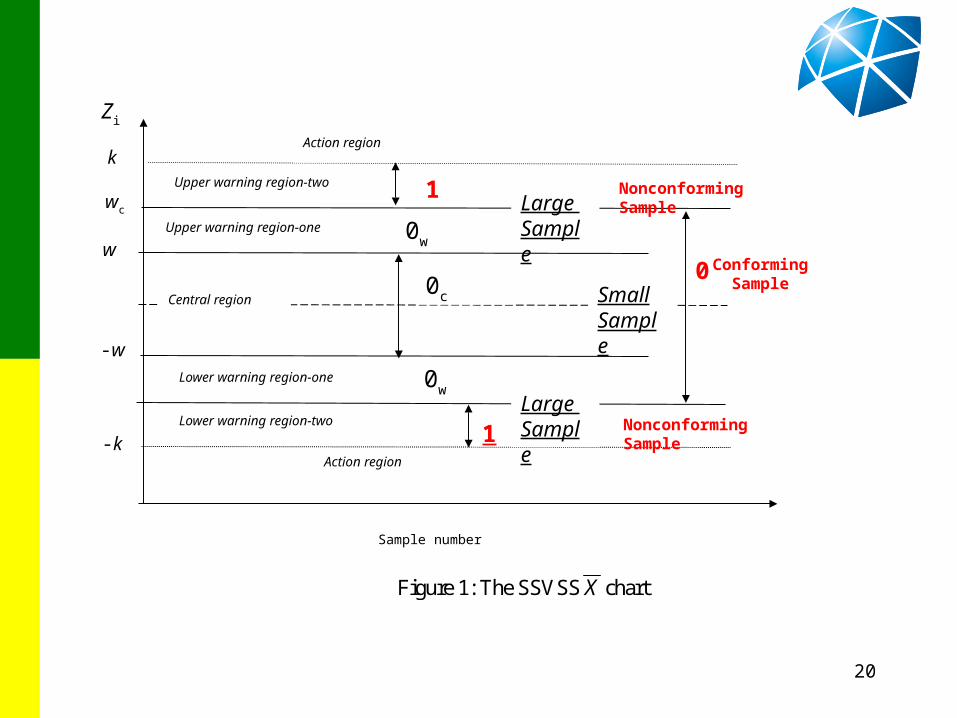
Zi
-k
k
wc
-w
w
1
Action region
0
0w
1
0c
Large Sample
Action region
Upper warning region-two
Lower warning region-two
Central region
Upper warning region-one
Lower warning region-one
Large Sample
SmallSample
Sample number
0w
Figure 1: The SSVSS X chart
ConformingSample
Nonconforming Sample
Nonconforming Sample
21
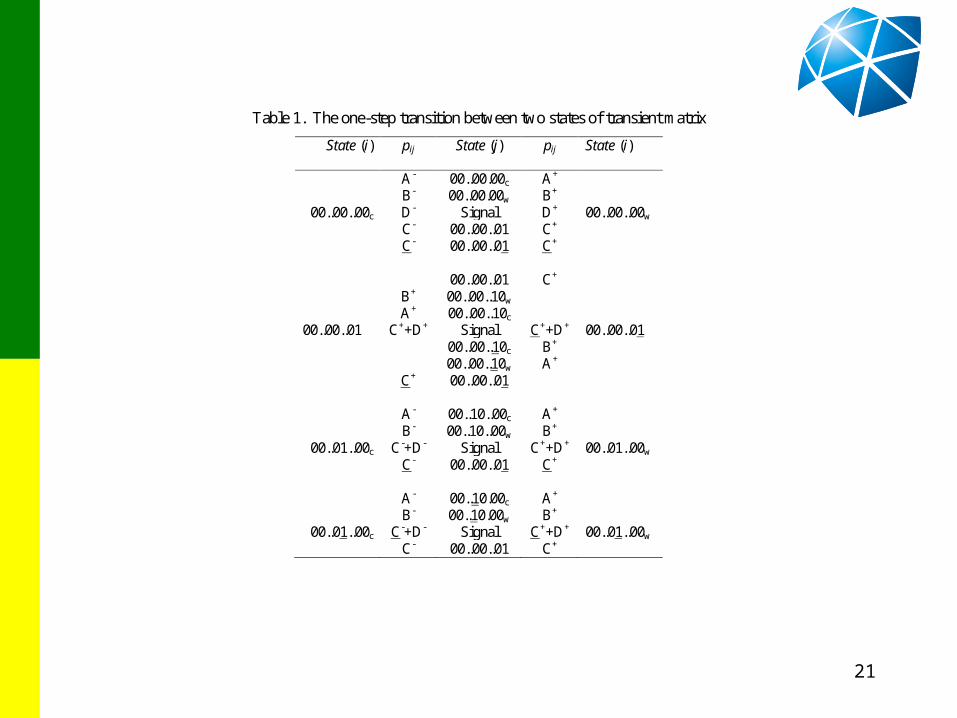
Table 1. The one-step transition between two states of transient matrix
State (i) pij State (j) pij State (i)
A- 00..00.00c A+ B- 00..00.00w B+
00..00..00c D- Signal D+ 00..00..00w
C- 00..00..01 C+ C- 00..00..01 C+ 00..00..01 C+ B+ 00..00..10w A+ 00..00..10c 00..00..01 C++D+ Signal C++D+ 00..00..01 00..00..10c B+ 00..00..10w A+ C+ 00..00..01 A- 00..10..00c A+ B- 00..10..00w B+
00..01..00c C-+D- Signal C++D+ 00..01..00w
C- 00..00..01 C+ A- 00..10.00c A+ B- 00..10.00w B+
00..01..00c C-+D- Signal C++D+ 00..01..00w
C- 00..00..01 C+
22
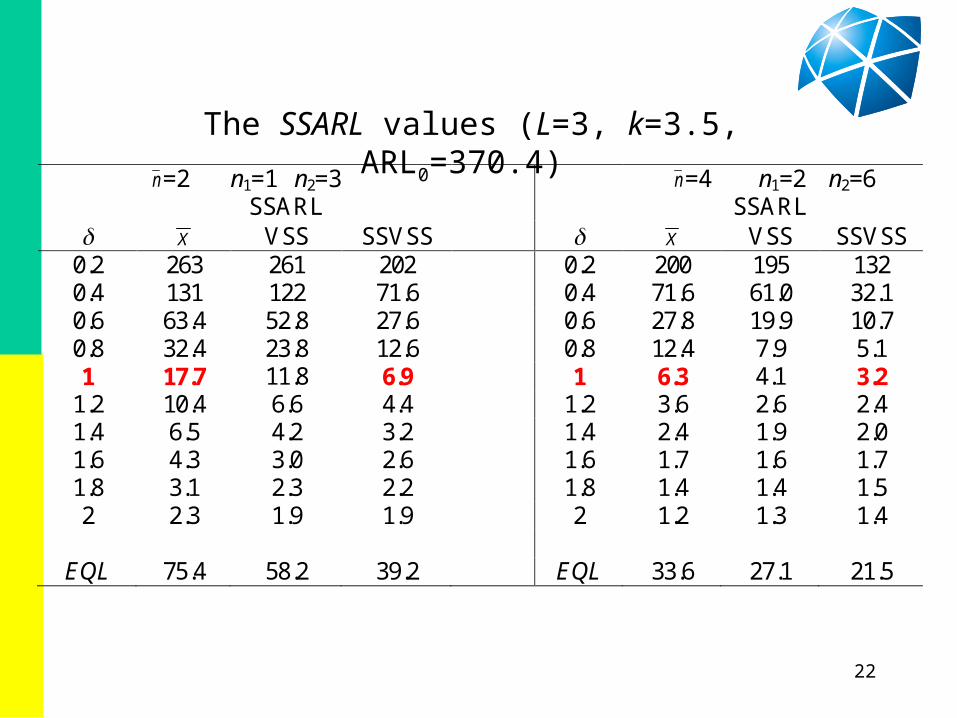
n=2 n1=1 n2=3 n=4 n1=2 n2=6 SSARL SSARL X VSS SSVSS X VSS SSVSS
0.2 263 261 202 0.2 200 195 132 0.4 131 122 71.6 0.4 71.6 61.0 32.1 0.6 63.4 52.8 27.6 0.6 27.8 19.9 10.7 0.8 32.4 23.8 12.6 0.8 12.4 7.9 5.1 1 17.7 11.8 6.9 1 6.3 4.1 3.2
1.2 10.4 6.6 4.4 1.2 3.6 2.6 2.4 1.4 6.5 4.2 3.2 1.4 2.4 1.9 2.0 1.6 4.3 3.0 2.6 1.6 1.7 1.6 1.7 1.8 3.1 2.3 2.2 1.8 1.4 1.4 1.5 2 2.3 1.9 1.9 2 1.2 1.3 1.4
EQL 75.4 58.2 39.2 EQL 33.6 27.1 21.5
The SSARL values (L=3, k=3.5, ARL0=370.4)
23
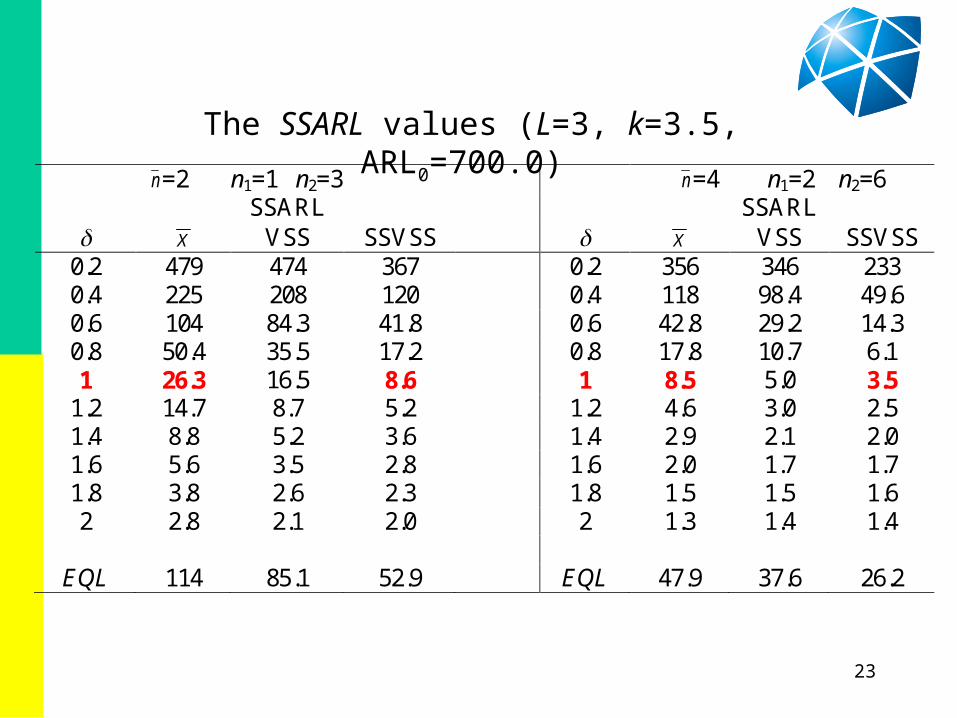
n=2 n1=1 n2=3 n=4 n1=2 n2=6 SSARL SSARL X VSS SSVSS X VSS SSVSS
0.2 479 474 367 0.2 356 346 233 0.4 225 208 120 0.4 118 98.4 49.6 0.6 104 84.3 41.8 0.6 42.8 29.2 14.3 0.8 50.4 35.5 17.2 0.8 17.8 10.7 6.1 1 26.3 16.5 8.6 1 8.5 5.0 3.5
1.2 14.7 8.7 5.2 1.2 4.6 3.0 2.5 1.4 8.8 5.2 3.6 1.4 2.9 2.1 2.0 1.6 5.6 3.5 2.8 1.6 2.0 1.7 1.7 1.8 3.8 2.6 2.3 1.8 1.5 1.5 1.6 2 2.8 2.1 2.0 2 1.3 1.4 1.4
EQL 114 85.1 52.9 EQL 47.9 37.6 26.2
The SSARL values (L=3, k=3.5, ARL0=700.0)
24
Thanks a lot for your attention.