1 age-adjusted diagnosed diabetes incidence texas.pdf · age-adjusted diagnosed diabetes incidence...
TRANSCRIPT

Age-adjusted Diagnosed Diabetes Incidence13:31 Monday, August 6, 2012 1
Year=2004
2004
StateFIPSCode County
Numberof NewCases
Age-adjustedRate per
1000
Age-adjustedLower
ConfidenceLimit
Age-adjustedUpper
ConfidenceLimit
Age-adjustedObesityPercent
Texas 48001 Anderson County 375 10.2 7.1 14.2 25.7
Texas 48003 Andrews County 89 10.7 7.4 15.3 25.2
Texas 48005 Angelina County 593 11.3 7.6 15.8 26.3
Texas 48007 Aransas County 185 9.8 6.4 14.0 24.7
Texas 48009 Archer County 59 9.4 6.2 13.8 24.2
Texas 48011 Armstrong County 15 9.3 6.1 13.4 25.2
Texas 48013 Atascosa County 242 9.3 6.2 13.8 24.4
Texas 48015 Austin County 184 10.3 6.8 14.8 25.3
Texas 48017 Bailey County 44 10.0 6.5 14.4 24.0
Texas 48019 Bandera County 143 9.7 6.3 14.0 24.0
Texas 48021 Bastrop County 434 10.0 6.9 14.1 25.1
Texas 48023 Baylor County 34 10.5 6.8 15.1 24.3
Texas 48025 Bee County 197 9.9 6.6 14.0 25.5
Texas 48027 Bell County 1603 11.2 7.8 15.6 27.5
Texas 48029 Bexar County 9369 10.4 7.9 13.3 24.5
Texas 48031 Blanco County 61 9.3 6.3 13.6 23.6
Texas 48033 Borden County 5 9.7 6.4 14.7 24.1
Texas 48035 Bosque County 140 10.3 6.8 15.1 24.6
Texas 48037 Bowie County 614 10.0 6.8 14.0 26.3
Texas 48039 Brazoria County 1496 9.0 6.2 12.4 25.7
Texas 48041 Brazos County 797 9.7 6.8 13.5 23.9
Texas 48043 Brewster County 63 9.9 6.4 14.2 24.2
Texas 48045 Briscoe County 13 9.9 6.6 14.3 24.5
Texas 48047 Brooks County 48 9.2 6.1 13.3 24.0
Texas 48049 Brown County 289 10.9 7.2 15.4 26.2
Texas 48051 Burleson County 131 11.0 7.3 15.8 27.1
Texas 48053 Burnet County 292 9.6 6.2 13.7 24.2
Texas 48055 Caldwell County 224 9.9 6.7 13.9 24.8
Texas 48057 Calhoun County 141 10.2 6.9 14.7 24.3
Texas 48059 Callahan County 95 9.6 6.4 13.8 24.4
Texas 48061 Cameron County 2091 10.3 6.9 14.3 23.9
Texas 48063 Camp County 88 10.9 7.4 15.4 25.9
Texas 48065 Carson County 44 9.3 6.2 13.6 25.7
Texas 48067 Cass County 256 11.5 7.9 16.1 27.0
Texas 48069 Castro County 52 10.3 6.9 14.8 25.1
Texas 48071 Chambers County 183 10.2 6.9 14.6 25.5
Texas 48073 Cherokee County 330 10.3 6.9 14.4 26.6
Texas 48075 Childress County 52 10.1 6.9 14.4 25.5
Texas 48077 Clay County 84 9.9 6.3 14.6 25.3
Texas 48079 Cochran County 22 9.8 6.5 14.4 25.0
Texas 48081 Coke County 28 9.5 6.1 13.6 23.5
Texas 48083 Coleman County 70 10.0 6.6 14.8 24.1
Texas 48085 Collin County 2933 8.1 5.9 10.9 23.0
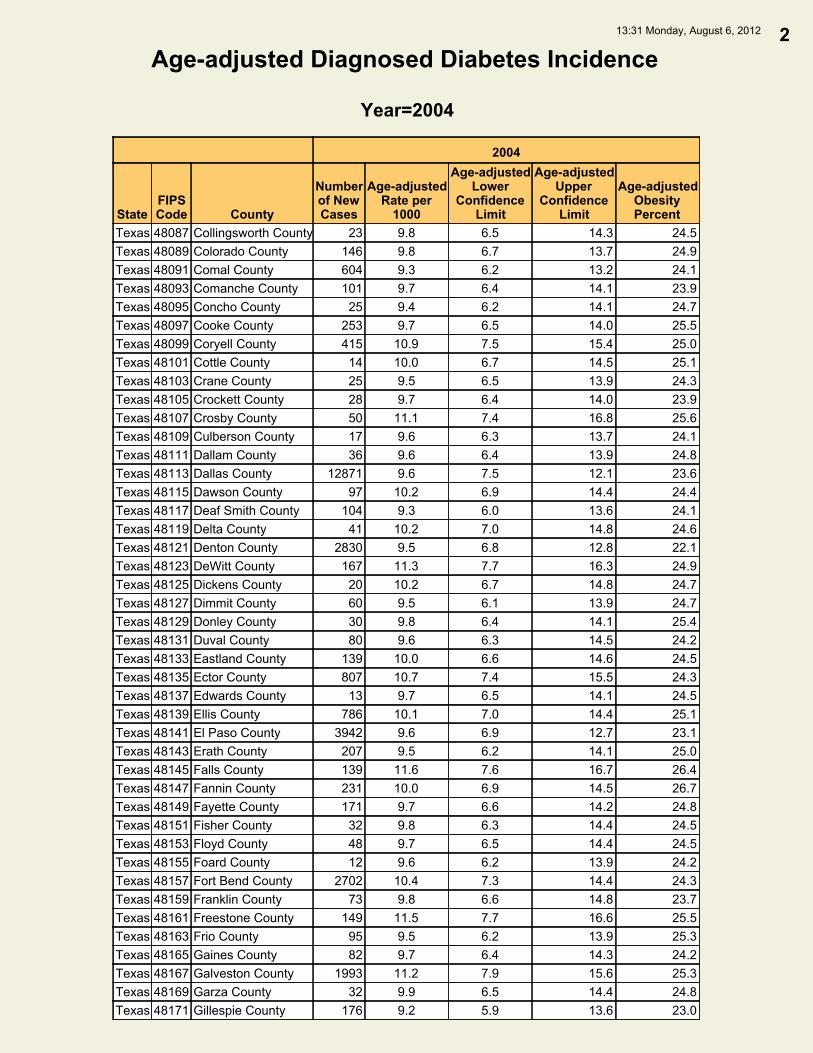
Age-adjusted Diagnosed Diabetes Incidence13:31 Monday, August 6, 2012 2
Year=2004
2004
StateFIPSCode County
Numberof NewCases
Age-adjustedRate per
1000
Age-adjustedLower
ConfidenceLimit
Age-adjustedUpper
ConfidenceLimit
Age-adjustedObesityPercent
Texas 48087 Collingsworth County 23 9.8 6.5 14.3 24.5
Texas 48089 Colorado County 146 9.8 6.7 13.7 24.9
Texas 48091 Comal County 604 9.3 6.2 13.2 24.1
Texas 48093 Comanche County 101 9.7 6.4 14.1 23.9
Texas 48095 Concho County 25 9.4 6.2 14.1 24.7
Texas 48097 Cooke County 253 9.7 6.5 14.0 25.5
Texas 48099 Coryell County 415 10.9 7.5 15.4 25.0
Texas 48101 Cottle County 14 10.0 6.7 14.5 25.1
Texas 48103 Crane County 25 9.5 6.5 13.9 24.3
Texas 48105 Crockett County 28 9.7 6.4 14.0 23.9
Texas 48107 Crosby County 50 11.1 7.4 16.8 25.6
Texas 48109 Culberson County 17 9.6 6.3 13.7 24.1
Texas 48111 Dallam County 36 9.6 6.4 13.9 24.8
Texas 48113 Dallas County 12871 9.6 7.5 12.1 23.6
Texas 48115 Dawson County 97 10.2 6.9 14.4 24.4
Texas 48117 Deaf Smith County 104 9.3 6.0 13.6 24.1
Texas 48119 Delta County 41 10.2 7.0 14.8 24.6
Texas 48121 Denton County 2830 9.5 6.8 12.8 22.1
Texas 48123 DeWitt County 167 11.3 7.7 16.3 24.9
Texas 48125 Dickens County 20 10.2 6.7 14.8 24.7
Texas 48127 Dimmit County 60 9.5 6.1 13.9 24.7
Texas 48129 Donley County 30 9.8 6.4 14.1 25.4
Texas 48131 Duval County 80 9.6 6.3 14.5 24.2
Texas 48133 Eastland County 139 10.0 6.6 14.6 24.5
Texas 48135 Ector County 807 10.7 7.4 15.5 24.3
Texas 48137 Edwards County 13 9.7 6.5 14.1 24.5
Texas 48139 Ellis County 786 10.1 7.0 14.4 25.1
Texas 48141 El Paso County 3942 9.6 6.9 12.7 23.1
Texas 48143 Erath County 207 9.5 6.2 14.1 25.0
Texas 48145 Falls County 139 11.6 7.6 16.7 26.4
Texas 48147 Fannin County 231 10.0 6.9 14.5 26.7
Texas 48149 Fayette County 171 9.7 6.6 14.2 24.8
Texas 48151 Fisher County 32 9.8 6.3 14.4 24.5
Texas 48153 Floyd County 48 9.7 6.5 14.4 24.5
Texas 48155 Foard County 12 9.6 6.2 13.9 24.2
Texas 48157 Fort Bend County 2702 10.4 7.3 14.4 24.3
Texas 48159 Franklin County 73 9.8 6.6 14.8 23.7
Texas 48161 Freestone County 149 11.5 7.7 16.6 25.5
Texas 48163 Frio County 95 9.5 6.2 13.9 25.3
Texas 48165 Gaines County 82 9.7 6.4 14.3 24.2
Texas 48167 Galveston County 1993 11.2 7.9 15.6 25.3
Texas 48169 Garza County 32 9.9 6.5 14.4 24.8
Texas 48171 Gillespie County 176 9.2 5.9 13.6 23.0

Age-adjusted Diagnosed Diabetes Incidence13:31 Monday, August 6, 2012 3
Year=2004
2004
StateFIPSCode County
Numberof NewCases
Age-adjustedRate per
1000
Age-adjustedLower
ConfidenceLimit
Age-adjustedUpper
ConfidenceLimit
Age-adjustedObesityPercent
Texas 48173 Glasscock County 8 9.5 6.0 13.8 24.2
Texas 48175 Goliad County 53 10.1 6.7 14.7 24.5
Texas 48177 Gonzales County 130 9.9 6.7 14.3 25.8
Texas 48179 Gray County 155 9.8 6.7 14.0 25.8
Texas 48181 Grayson County 877 11.0 7.5 15.5 24.8
Texas 48183 Gregg County 819 10.9 7.5 15.1 25.3
Texas 48185 Grimes County 208 12.2 8.5 17.2 26.6
Texas 48187 Guadalupe County 691 10.8 7.3 15.3 24.4
Texas 48189 Hale County 211 9.5 6.4 14.1 24.3
Texas 48191 Hall County 29 10.5 6.7 14.9 24.5
Texas 48193 Hamilton County 61 9.6 6.4 14.0 23.6
Texas 48195 Hansford County 34 9.2 6.0 13.6 24.1
Texas 48197 Hardeman County 33 9.6 6.5 14.0 24.5
Texas 48199 Hardin County 343 10.1 6.8 14.9 24.1
Texas 48201 Harris County 21403 9.9 7.8 12.1 23.2
Texas 48203 Harrison County 440 10.3 7.2 14.6 26.0
Texas 48205 Hartley County 40 10.1 6.6 14.5 24.7
Texas 48207 Haskell County 45 9.7 6.2 14.3 24.5
Texas 48209 Hays County 697 10.1 6.7 14.0 23.2
Texas 48211 Hemphill County 23 9.4 6.1 13.8 24.6
Texas 48213 Henderson County 539 9.3 6.2 12.7 23.7
Texas 48215 Hidalgo County 2945 8.7 5.9 12.5 26.4
Texas 48217 Hill County 247 10.1 6.9 14.4 26.8
Texas 48219 Hockley County 134 9.2 6.0 13.0 24.4
Texas 48221 Hood County 331 9.4 6.0 13.8 24.0
Texas 48223 Hopkins County 241 10.6 7.2 15.1 25.1
Texas 48225 Houston County 188 11.0 7.5 15.0 25.0
Texas 48227 Howard County 213 9.4 6.4 13.3 24.1
Texas 48229 Hudspeth County 20 9.8 6.3 14.2 24.6
Texas 48231 Hunt County 519 9.6 6.6 13.8 25.3
Texas 48233 Hutchinson County 188 11.9 8.0 17.4 25.0
Texas 48235 Irion County 12 9.6 6.1 14.3 23.9
Texas 48237 Jack County 59 9.5 6.3 13.8 24.9
Texas 48239 Jackson County 100 10.0 6.8 14.1 24.8
Texas 48241 Jasper County 260 10.5 7.1 14.5 26.4
Texas 48243 Jeff Davis County 18 9.6 6.4 14.4 24.3
Texas 48245 Jefferson County 2129 13.2 9.3 17.9 26.8
Texas 48247 Jim Hogg County 34 9.8 6.2 14.6 24.5
Texas 48249 Jim Wells County 254 10.0 6.4 14.4 24.5
Texas 48251 Johnson County 905 10.2 6.9 14.3 25.8
Texas 48253 Jones County 139 10.3 7.0 14.6 25.0
Texas 48255 Karnes County 108 10.7 7.1 15.4 25.5
Texas 48257 Kaufman County 602 11.4 7.8 16.0 24.4

Age-adjusted Diagnosed Diabetes Incidence13:31 Monday, August 6, 2012 4
Year=2004
2004
StateFIPSCode County
Numberof NewCases
Age-adjustedRate per
1000
Age-adjustedLower
ConfidenceLimit
Age-adjustedUpper
ConfidenceLimit
Age-adjustedObesityPercent
Texas 48259 Kendall County 176 8.9 5.9 12.8 23.4
Texas 48261 Kenedy County 3 9.9 6.4 14.7 24.8
Texas 48263 Kent County 7 9.4 6.1 13.9 24.3
Texas 48265 Kerr County 338 9.1 5.9 13.1 24.0
Texas 48267 Kimble County 35 9.9 6.5 14.7 24.2
Texas 48269 King County 2 9.6 6.3 14.4 24.3
Texas 48271 Kinney County 26 9.8 6.4 14.1 24.8
Texas 48273 Kleberg County 193 10.3 6.6 15.1 24.7
Texas 48275 Knox County 29 10.0 6.7 14.7 24.7
Texas 48277 Lamar County 373 11.0 7.4 15.3 26.3
Texas 48279 Lamb County 102 10.5 6.7 15.8 24.8
Texas 48281 Lampasas County 133 9.7 6.3 14.1 24.6
Texas 48283 La Salle County 37 10.0 6.6 14.5 25.1
Texas 48285 Lavaca County 154 10.5 7.0 14.9 25.4
Texas 48287 Lee County 114 10.5 7.2 15.1 25.8
Texas 48289 Leon County 126 10.2 6.8 14.8 24.8
Texas 48291 Liberty County 501 10.8 7.4 15.1 25.8
Texas 48293 Limestone County 172 11.1 7.8 15.7 25.3
Texas 48295 Lipscomb County 21 9.5 5.9 14.2 25.0
Texas 48297 Live Oak County 91 10.2 6.9 14.4 24.8
Texas 48299 Llano County 159 9.3 6.1 13.4 23.0
Texas 48301 Loving County 0 9.5 6.0 13.9 24.4
Texas 48303 Lubbock County 1593 10.2 7.0 13.9 24.6
Texas 48305 Lynn County 41 9.8 6.3 14.1 24.4
Texas 48307 McCulloch County 58 9.6 6.2 13.8 23.7
Texas 48309 McLennan County 1535 11.1 7.7 15.4 24.0
Texas 48311 McMullen County 6 9.5 6.2 13.8 23.9
Texas 48313 Madison County 99 11.5 7.6 16.1 25.5
Texas 48315 Marion County 98 11.4 7.8 16.2 26.1
Texas 48317 Martin County 27 9.6 6.3 14.1 24.5
Texas 48319 Mason County 33 10.0 6.3 15.0 24.8
Texas 48321 Matagorda County 269 10.9 7.3 15.3 26.4
Texas 48323 Maverick County 270 9.8 6.4 14.6 25.1
Texas 48325 Medina County 266 9.7 6.4 14.1 23.9
Texas 48327 Menard County 19 9.9 6.5 14.6 24.0
Texas 48329 Midland County 730 9.4 6.4 13.3 24.6
Texas 48331 Milam County 189 10.8 7.3 15.5 26.3
Texas 48333 Mills County 40 9.8 6.5 14.5 24.6
Texas 48335 Mitchell County 69 10.5 7.2 15.1 25.6
Texas 48337 Montague County 145 9.8 6.4 14.3 24.3
Texas 48339 Montgomery County 2053 9.1 6.3 12.7 23.9
Texas 48341 Moore County 114 9.8 6.3 14.0 25.2
Texas 48343 Morris County 116 12.2 8.2 17.7 26.2

Age-adjusted Diagnosed Diabetes Incidence13:31 Monday, August 6, 2012 5
Year=2004
2004
StateFIPSCode County
Numberof NewCases
Age-adjustedRate per
1000
Age-adjustedLower
ConfidenceLimit
Age-adjustedUpper
ConfidenceLimit
Age-adjustedObesityPercent
Texas 48345 Motley County 11 9.7 6.3 14.1 24.3
Texas 48347 Nacogdoches County 411 11.1 7.5 15.6 26.0
Texas 48349 Navarro County 352 11.5 7.9 16.2 26.2
Texas 48351 Newton County 117 11.6 8.0 16.3 26.9
Texas 48353 Nolan County 107 10.1 6.8 14.8 24.9
Texas 48355 Nueces County 1978 9.7 6.6 13.5 25.2
Texas 48357 Ochiltree County 53 9.4 6.1 13.4 25.1
Texas 48359 Oldham County 14 9.9 6.5 14.2 24.7
Texas 48361 Orange County 578 10.0 6.7 14.1 25.3
Texas 48363 Palo Pinto County 198 10.2 6.8 14.8 24.8
Texas 48365 Panola County 196 12.0 8.3 16.9 25.8
Texas 48367 Parker County 617 9.3 6.4 13.3 23.4
Texas 48369 Parmer County 60 9.7 6.4 14.1 25.1
Texas 48371 Pecos County 100 9.7 6.4 14.2 24.8
Texas 48373 Polk County 359 10.7 7.1 15.3 27.0
Texas 48375 Potter County 764 10.7 7.5 15.0 23.9
Texas 48377 Presidio County 47 9.6 6.1 14.1 24.2
Texas 48379 Rains County 85 10.6 7.0 15.3 24.6
Texas 48381 Randall County 645 8.9 6.0 12.6 25.7
Texas 48383 Reagan County 20 10.1 6.4 14.6 25.1
Texas 48385 Real County 23 9.4 6.2 13.7 24.2
Texas 48387 Red River County 109 10.5 7.1 15.0 25.0
Texas 48389 Reeves County 80 10.2 6.5 14.9 24.8
Texas 48391 Refugio County 57 10.3 7.0 14.8 25.1
Texas 48393 Roberts County 6 9.4 6.1 13.5 25.4
Texas 48395 Robertson County 125 11.4 7.8 15.5 26.3
Texas 48397 Rockwall County 342 9.5 6.3 13.6 25.1
Texas 48399 Runnels County 79 9.8 6.3 14.3 24.0
Texas 48401 Rusk County 347 10.2 6.9 14.7 26.6
Texas 48403 Sabine County 90 10.5 6.9 14.9 25.2
Texas 48405 San Augustine County 78 11.2 7.7 16.3 26.0
Texas 48407 San Jacinto County 183 10.4 6.9 15.0 27.4
Texas 48409 San Patricio County 433 10.4 6.8 14.7 24.4
Texas 48411 San Saba County 42 9.5 6.1 13.8 24.8
Texas 48413 Schleicher County 19 9.5 6.2 13.8 24.5
Texas 48415 Scurry County 104 9.4 6.2 13.8 24.2
Texas 48417 Shackelford County 23 9.5 6.1 14.1 24.2
Texas 48419 Shelby County 194 11.1 7.6 15.4 25.7
Texas 48421 Sherman County 20 9.7 6.3 14.5 24.5
Texas 48423 Smith County 1434 11.6 8.4 16.2 28.1
Texas 48425 Somervell County 49 9.7 6.3 14.2 24.3
Texas 48427 Starr County 289 9.5 6.2 13.9 24.4
Texas 48429 Stephens County 70 10.1 6.8 14.5 26.3

Age-adjusted Diagnosed Diabetes Incidence13:31 Monday, August 6, 2012 6
Year=2004
2004
StateFIPSCode County
Numberof NewCases
Age-adjustedRate per
1000
Age-adjustedLower
ConfidenceLimit
Age-adjustedUpper
ConfidenceLimit
Age-adjustedObesityPercent
Texas 48431 Sterling County 9 9.6 6.1 14.5 23.9
Texas 48433 Stonewall County 12 10.0 6.6 14.4 24.7
Texas 48435 Sutton County 26 9.3 5.9 13.4 24.6
Texas 48437 Swisher County 55 10.2 6.9 14.8 24.2
Texas 48439 Tarrant County 9750 10.2 8.0 12.9 22.1
Texas 48441 Taylor County 854 10.8 7.6 15.1 25.0
Texas 48443 Terrell County 8 9.7 6.2 14.3 24.8
Texas 48445 Terry County 81 9.9 6.4 14.1 25.4
Texas 48447 Throckmorton County 13 9.5 6.3 13.9 24.0
Texas 48449 Titus County 173 10.0 6.7 14.1 24.7
Texas 48451 Tom Green County 640 9.2 6.2 13.0 23.0
Texas 48453 Travis County 4793 9.4 7.1 12.2 19.5
Texas 48455 Trinity County 123 11.3 7.6 16.1 27.0
Texas 48457 Tyler County 156 10.2 6.7 14.4 24.5
Texas 48459 Upshur County 285 10.9 7.3 15.7 25.9
Texas 48461 Upton County 23 10.2 6.7 14.7 24.8
Texas 48463 Uvalde County 165 9.9 6.5 14.8 24.5
Texas 48465 Val Verde County 289 10.0 6.5 14.3 24.2
Texas 48467 Van Zandt County 388 10.4 6.9 15.2 23.6
Texas 48469 Victoria County 538 9.6 6.3 13.7 25.4
Texas 48471 Walker County 390 10.2 7.0 14.4 25.9
Texas 48473 Waller County 231 11.1 7.6 15.4 26.3
Texas 48475 Ward County 71 10.1 6.8 15.1 24.5
Texas 48477 Washington County 226 10.3 7.1 14.7 26.1
Texas 48479 Webb County 972 9.1 6.1 13.7 23.9
Texas 48481 Wharton County 303 11.1 7.6 15.7 27.8
Texas 48483 Wheeler County 39 10.1 6.5 14.8 24.7
Texas 48485 Wichita County 853 10.3 7.1 14.3 24.5
Texas 48487 Wilbarger County 98 10.4 6.8 14.9 25.1
Texas 48489 Willacy County 113 9.4 6.1 13.8 24.1
Texas 48491 Williamson County 1725 9.5 6.6 12.9 21.2
Texas 48493 Wilson County 238 10.0 6.6 14.4 24.0
Texas 48495 Winkler County 44 9.6 6.3 14.2 25.3
Texas 48497 Wise County 342 9.6 6.3 13.6 25.1
Texas 48499 Wood County 321 10.2 6.9 14.5 24.7
Texas 48501 Yoakum County 46 9.8 6.5 14.3 25.3
Texas 48503 Young County 133 9.8 6.4 14.1 23.9
Texas 48505 Zapata County 73 9.5 6.2 14.1 24.8
Texas 48507 Zavala County 67 9.9 6.5 14.4 24.3

Age-adjusted Diagnosed Diabetes Incidence13:31 Monday, August 6, 2012 7
Year=2005
2005
StateFIPSCode County
Numberof NewCases
Age-adjustedRate per
1000
Age-adjustedLower
ConfidenceLimit
Age-adjustedUpper
ConfidenceLimit
Age-adjustedObesityPercent
Texas 48001 Anderson County 388 10.5 7.5 14.1 27.3
Texas 48003 Andrews County 95 11.5 7.3 17.1 25.7
Texas 48005 Angelina County 572 10.8 7.3 15.7 28.4
Texas 48007 Aransas County 189 9.8 6.3 14.7 25.0
Texas 48009 Archer County 59 9.3 5.7 13.4 23.8
Texas 48011 Armstrong County 16 9.8 6.2 14.7 25.4
Texas 48013 Atascosa County 264 10.0 6.4 15.1 25.9
Texas 48015 Austin County 193 10.7 7.1 15.3 25.7
Texas 48017 Bailey County 47 11.0 6.7 16.1 24.5
Texas 48019 Bandera County 140 9.4 6.1 13.6 25.5
Texas 48021 Bastrop County 409 9.2 6.1 13.4 25.6
Texas 48023 Baylor County 35 11.5 7.5 16.6 24.8
Texas 48025 Bee County 204 10.2 6.4 15.3 26.1
Texas 48027 Bell County 1722 11.9 8.5 16.0 25.4
Texas 48029 Bexar County 9903 10.8 8.3 14.0 25.2
Texas 48031 Blanco County 65 10.0 6.3 15.2 23.8
Texas 48033 Borden County 5 10.0 6.3 14.8 24.6
Texas 48035 Bosque County 144 10.6 6.7 15.6 25.6
Texas 48037 Bowie County 669 10.9 7.6 15.1 26.9
Texas 48039 Brazoria County 1531 9.0 6.1 13.1 26.9
Texas 48041 Brazos County 825 9.8 6.6 13.7 26.4
Texas 48043 Brewster County 65 10.3 6.5 15.4 24.2
Texas 48045 Briscoe County 13 10.2 6.5 15.1 24.9
Texas 48047 Brooks County 50 9.7 6.1 15.2 24.6
Texas 48049 Brown County 265 9.9 6.4 14.5 25.8
Texas 48051 Burleson County 127 10.5 7.0 15.6 27.4
Texas 48053 Burnet County 297 9.5 6.1 13.7 25.5
Texas 48055 Caldwell County 226 9.8 6.7 14.1 26.5
Texas 48057 Calhoun County 152 11.1 7.2 16.1 25.3
Texas 48059 Callahan County 93 9.4 6.2 13.9 25.7
Texas 48061 Cameron County 2303 11.2 7.4 16.0 23.8
Texas 48063 Camp County 86 10.5 6.9 15.3 25.6
Texas 48065 Carson County 45 9.7 6.1 14.1 26.4
Texas 48067 Cass County 256 11.5 7.8 16.5 27.4
Texas 48069 Castro County 51 10.1 6.3 14.8 25.1
Texas 48071 Chambers County 187 10.3 6.5 15.2 27.3
Texas 48073 Cherokee County 325 10.2 6.7 14.6 26.6
Texas 48075 Childress County 52 10.1 6.7 14.7 25.7
Texas 48077 Clay County 85 10.1 6.3 14.8 25.2
Texas 48079 Cochran County 22 10.1 6.5 15.0 25.3
Texas 48081 Coke County 28 9.6 6.0 14.5 24.0
Texas 48083 Coleman County 67 9.8 6.1 14.3 25.0
Texas 48085 Collin County 3352 8.8 6.3 11.8 23.8

Age-adjusted Diagnosed Diabetes Incidence13:31 Monday, August 6, 2012 8
Year=2005
2005
StateFIPSCode County
Numberof NewCases
Age-adjustedRate per
1000
Age-adjustedLower
ConfidenceLimit
Age-adjustedUpper
ConfidenceLimit
Age-adjustedObesityPercent
Texas 48087 Collingsworth County 23 10.1 6.5 15.1 25.0
Texas 48089 Colorado County 145 9.6 6.3 13.8 25.3
Texas 48091 Comal County 604 9.0 6.0 13.2 22.5
Texas 48093 Comanche County 102 9.9 6.3 14.9 25.3
Texas 48095 Concho County 26 9.7 6.0 14.4 25.5
Texas 48097 Cooke County 258 9.8 6.5 14.5 25.8
Texas 48099 Coryell County 419 11.1 7.6 15.9 25.3
Texas 48101 Cottle County 14 10.1 6.6 14.6 25.6
Texas 48103 Crane County 24 9.7 6.2 14.3 25.2
Texas 48105 Crockett County 28 9.8 6.1 15.1 24.7
Texas 48107 Crosby County 50 11.2 7.3 17.0 26.9
Texas 48109 Culberson County 18 9.9 6.2 14.4 24.7
Texas 48111 Dallam County 36 9.6 6.2 13.9 24.9
Texas 48113 Dallas County 13927 10.3 8.0 13.2 24.8
Texas 48115 Dawson County 100 10.6 6.7 15.2 24.8
Texas 48117 Deaf Smith County 117 10.6 6.6 15.8 25.1
Texas 48119 Delta County 41 10.4 6.9 14.8 25.1
Texas 48121 Denton County 2927 9.4 6.5 13.1 23.0
Texas 48123 DeWitt County 163 11.0 7.4 15.7 25.4
Texas 48125 Dickens County 19 10.1 6.4 15.1 25.2
Texas 48127 Dimmit County 62 9.9 6.2 14.9 25.6
Texas 48129 Donley County 30 10.0 6.6 15.3 26.0
Texas 48131 Duval County 80 9.7 6.1 14.4 25.2
Texas 48133 Eastland County 144 10.6 6.8 15.5 25.6
Texas 48135 Ector County 812 10.7 6.9 15.6 25.9
Texas 48137 Edwards County 13 10.0 6.4 15.4 25.3
Texas 48139 Ellis County 810 10.0 6.7 14.4 27.3
Texas 48141 El Paso County 4055 9.7 7.1 12.8 23.4
Texas 48143 Erath County 221 10.1 6.5 15.2 26.4
Texas 48145 Falls County 135 11.3 7.5 16.3 27.2
Texas 48147 Fannin County 238 10.2 6.7 14.6 26.5
Texas 48149 Fayette County 166 9.4 6.0 14.2 24.8
Texas 48151 Fisher County 33 9.9 6.2 14.8 25.1
Texas 48153 Floyd County 48 10.0 6.4 15.1 25.0
Texas 48155 Foard County 11 9.8 6.3 14.5 24.7
Texas 48157 Fort Bend County 2840 10.5 7.5 14.3 24.0
Texas 48159 Franklin County 80 10.1 6.6 15.2 24.2
Texas 48161 Freestone County 143 10.9 7.3 15.7 25.7
Texas 48163 Frio County 96 9.6 6.1 14.1 25.6
Texas 48165 Gaines County 87 10.2 6.5 15.2 25.6
Texas 48167 Galveston County 2040 11.3 7.7 16.0 25.8
Texas 48169 Garza County 32 10.0 6.5 14.8 25.8
Texas 48171 Gillespie County 177 9.2 5.8 13.9 23.7

Age-adjusted Diagnosed Diabetes Incidence13:31 Monday, August 6, 2012 9
Year=2005
2005
StateFIPSCode County
Numberof NewCases
Age-adjustedRate per
1000
Age-adjustedLower
ConfidenceLimit
Age-adjustedUpper
ConfidenceLimit
Age-adjustedObesityPercent
Texas 48173 Glasscock County 8 9.7 5.9 14.4 24.6
Texas 48175 Goliad County 52 9.8 6.3 14.4 25.0
Texas 48177 Gonzales County 134 10.3 6.9 14.9 26.5
Texas 48179 Gray County 159 10.1 6.9 14.6 26.1
Texas 48181 Grayson County 919 11.5 7.7 16.7 24.4
Texas 48183 Gregg County 844 11.2 7.9 15.4 25.1
Texas 48185 Grimes County 216 12.6 8.3 18.3 27.2
Texas 48187 Guadalupe County 744 11.3 7.5 15.9 24.3
Texas 48189 Hale County 216 9.8 6.4 14.1 25.2
Texas 48191 Hall County 28 10.6 7.2 15.5 24.8
Texas 48193 Hamilton County 65 10.3 6.4 15.8 24.0
Texas 48195 Hansford County 34 9.5 5.9 14.4 24.1
Texas 48197 Hardeman County 34 10.3 6.9 15.1 25.4
Texas 48199 Hardin County 347 10.1 6.6 14.6 24.0
Texas 48201 Harris County 21769 9.8 7.8 12.2 23.0
Texas 48203 Harrison County 484 11.5 8.1 16.1 28.0
Texas 48205 Hartley County 39 10.2 6.7 15.3 25.9
Texas 48207 Haskell County 45 9.7 6.2 14.8 24.8
Texas 48209 Hays County 710 9.7 6.2 13.9 22.8
Texas 48211 Hemphill County 23 9.5 5.8 14.5 24.6
Texas 48213 Henderson County 557 9.6 6.4 14.1 24.1
Texas 48215 Hidalgo County 3083 8.8 6.0 12.4 26.1
Texas 48217 Hill County 256 10.5 6.8 15.1 26.9
Texas 48219 Hockley County 134 9.2 6.0 13.4 24.6
Texas 48221 Hood County 371 10.5 6.9 15.0 26.0
Texas 48223 Hopkins County 247 10.8 7.1 16.1 25.8
Texas 48225 Houston County 182 10.7 7.1 15.4 26.3
Texas 48227 Howard County 223 10.1 6.5 14.6 24.5
Texas 48229 Hudspeth County 20 9.9 6.1 14.7 25.2
Texas 48231 Hunt County 541 10.0 6.6 14.6 25.5
Texas 48233 Hutchinson County 196 12.7 8.0 18.5 26.3
Texas 48235 Irion County 13 10.0 6.3 15.0 24.5
Texas 48237 Jack County 64 10.3 6.6 15.0 25.5
Texas 48239 Jackson County 102 10.2 6.7 14.6 25.6
Texas 48241 Jasper County 262 10.6 7.1 15.2 26.2
Texas 48243 Jeff Davis County 17 9.8 6.1 15.0 24.6
Texas 48245 Jefferson County 2160 13.4 9.8 18.1 28.9
Texas 48247 Jim Hogg County 34 10.1 6.5 15.1 24.9
Texas 48249 Jim Wells County 250 9.7 6.0 14.8 24.9
Texas 48251 Johnson County 996 10.9 7.4 15.7 25.6
Texas 48253 Jones County 144 10.8 7.1 16.0 25.5
Texas 48255 Karnes County 104 10.4 6.8 15.5 26.7
Texas 48257 Kaufman County 599 11.0 7.3 16.1 23.8

Age-adjusted Diagnosed Diabetes Incidence13:31 Monday, August 6, 2012 10
Year=2005
2005
StateFIPSCode County
Numberof NewCases
Age-adjustedRate per
1000
Age-adjustedLower
ConfidenceLimit
Age-adjustedUpper
ConfidenceLimit
Age-adjustedObesityPercent
Texas 48259 Kendall County 176 8.5 5.2 12.5 22.9
Texas 48261 Kenedy County 3 10.0 6.3 15.2 24.8
Texas 48263 Kent County 7 9.8 6.3 14.9 24.8
Texas 48265 Kerr County 351 9.4 6.0 14.1 23.8
Texas 48267 Kimble County 37 10.5 6.6 15.8 25.1
Texas 48269 King County 2 9.8 6.1 14.6 24.5
Texas 48271 Kinney County 26 9.9 6.4 14.6 25.2
Texas 48273 Kleberg County 198 10.6 7.0 15.7 25.3
Texas 48275 Knox County 29 10.2 6.7 15.1 25.2
Texas 48277 Lamar County 378 11.1 7.5 15.9 26.8
Texas 48279 Lamb County 99 10.1 6.4 14.9 25.2
Texas 48281 Lampasas County 131 9.6 6.2 14.1 24.8
Texas 48283 La Salle County 38 10.2 6.5 15.1 25.8
Texas 48285 Lavaca County 160 11.1 7.2 16.1 26.7
Texas 48287 Lee County 118 10.7 6.9 15.3 26.9
Texas 48289 Leon County 128 10.3 6.7 15.3 25.0
Texas 48291 Liberty County 542 11.6 7.7 16.5 26.4
Texas 48293 Limestone County 160 10.4 7.1 14.9 26.0
Texas 48295 Lipscomb County 21 9.9 6.1 14.6 25.4
Texas 48297 Live Oak County 91 10.3 6.5 15.6 25.1
Texas 48299 Llano County 153 9.0 5.8 13.4 24.0
Texas 48301 Loving County 0 9.8 6.1 14.5 24.1
Texas 48303 Lubbock County 1477 9.3 6.9 12.2 24.9
Texas 48305 Lynn County 41 9.9 6.2 14.6 25.9
Texas 48307 McCulloch County 58 9.7 6.1 14.6 24.2
Texas 48309 McLennan County 1558 11.2 7.9 15.5 25.3
Texas 48311 McMullen County 7 9.6 6.2 14.6 25.0
Texas 48313 Madison County 99 11.5 7.6 17.1 26.8
Texas 48315 Marion County 96 11.2 7.8 16.1 27.1
Texas 48317 Martin County 28 9.9 6.3 15.1 24.7
Texas 48319 Mason County 32 9.8 6.1 14.8 25.0
Texas 48321 Matagorda County 267 10.8 7.3 15.3 26.7
Texas 48323 Maverick County 288 10.3 6.6 15.0 25.6
Texas 48325 Medina County 277 10.0 6.4 14.9 24.7
Texas 48327 Menard County 18 9.8 6.3 14.3 24.7
Texas 48329 Midland County 876 11.3 7.6 16.4 24.1
Texas 48331 Milam County 194 11.2 7.5 16.5 26.8
Texas 48333 Mills County 41 10.2 6.3 15.3 24.7
Texas 48335 Mitchell County 72 11.0 7.4 15.8 26.4
Texas 48337 Montague County 150 10.2 6.4 15.6 25.4
Texas 48339 Montgomery County 2183 9.2 6.2 13.1 24.6
Texas 48341 Moore County 116 10.0 6.7 14.4 25.5
Texas 48343 Morris County 131 14.1 9.5 20.4 27.6

Age-adjusted Diagnosed Diabetes Incidence13:31 Monday, August 6, 2012 11
Year=2005
2005
StateFIPSCode County
Numberof NewCases
Age-adjustedRate per
1000
Age-adjustedLower
ConfidenceLimit
Age-adjustedUpper
ConfidenceLimit
Age-adjustedObesityPercent
Texas 48345 Motley County 11 9.9 6.2 14.4 24.6
Texas 48347 Nacogdoches County 364 9.7 6.6 13.7 25.2
Texas 48349 Navarro County 350 11.3 7.5 15.8 27.2
Texas 48351 Newton County 115 11.4 7.8 16.2 26.5
Texas 48353 Nolan County 105 10.1 6.6 14.8 24.5
Texas 48355 Nueces County 2266 11.1 7.6 16.1 28.1
Texas 48357 Ochiltree County 56 9.7 6.4 14.7 25.6
Texas 48359 Oldham County 13 9.9 6.4 15.4 25.5
Texas 48361 Orange County 563 9.6 6.6 13.8 27.3
Texas 48363 Palo Pinto County 182 9.3 6.1 13.5 24.9
Texas 48365 Panola County 188 11.4 7.7 16.6 26.7
Texas 48367 Parker County 683 10.1 6.6 14.5 24.3
Texas 48369 Parmer County 58 9.4 6.2 14.0 24.6
Texas 48371 Pecos County 102 10.0 6.5 14.8 25.3
Texas 48373 Polk County 373 11.0 7.5 16.1 26.9
Texas 48375 Potter County 786 10.9 7.4 15.3 24.6
Texas 48377 Presidio County 50 10.1 6.3 15.3 24.2
Texas 48379 Rains County 83 10.3 6.7 15.0 24.9
Texas 48381 Randall County 637 8.7 5.7 13.1 26.2
Texas 48383 Reagan County 20 10.3 6.5 15.8 25.2
Texas 48385 Real County 23 9.6 5.8 14.6 24.4
Texas 48387 Red River County 113 11.0 7.5 15.9 25.9
Texas 48389 Reeves County 78 10.1 6.5 15.1 25.4
Texas 48391 Refugio County 59 10.6 6.8 15.8 25.9
Texas 48393 Roberts County 6 9.6 6.0 14.6 25.2
Texas 48395 Robertson County 124 11.2 7.5 16.3 26.9
Texas 48397 Rockwall County 375 9.7 6.2 14.1 26.3
Texas 48399 Runnels County 79 9.8 6.2 14.8 24.3
Texas 48401 Rusk County 343 10.1 6.8 14.3 27.4
Texas 48403 Sabine County 90 10.7 6.8 15.3 25.9
Texas 48405 San Augustine County 77 11.3 7.3 16.2 26.4
Texas 48407 San Jacinto County 190 10.7 7.1 15.1 27.7
Texas 48409 San Patricio County 440 10.4 6.7 14.7 25.3
Texas 48411 San Saba County 41 9.6 5.9 14.5 24.7
Texas 48413 Schleicher County 20 9.8 6.2 14.5 24.7
Texas 48415 Scurry County 102 9.3 6.2 13.9 24.2
Texas 48417 Shackelford County 23 9.4 6.1 14.0 24.3
Texas 48419 Shelby County 201 11.5 7.7 16.4 25.8
Texas 48421 Sherman County 19 10.0 6.1 15.1 24.9
Texas 48423 Smith County 1338 10.5 7.6 14.4 28.2
Texas 48425 Somervell County 54 10.5 6.5 15.5 24.9
Texas 48427 Starr County 309 9.9 6.5 14.7 25.4
Texas 48429 Stephens County 72 10.6 6.8 15.7 27.0
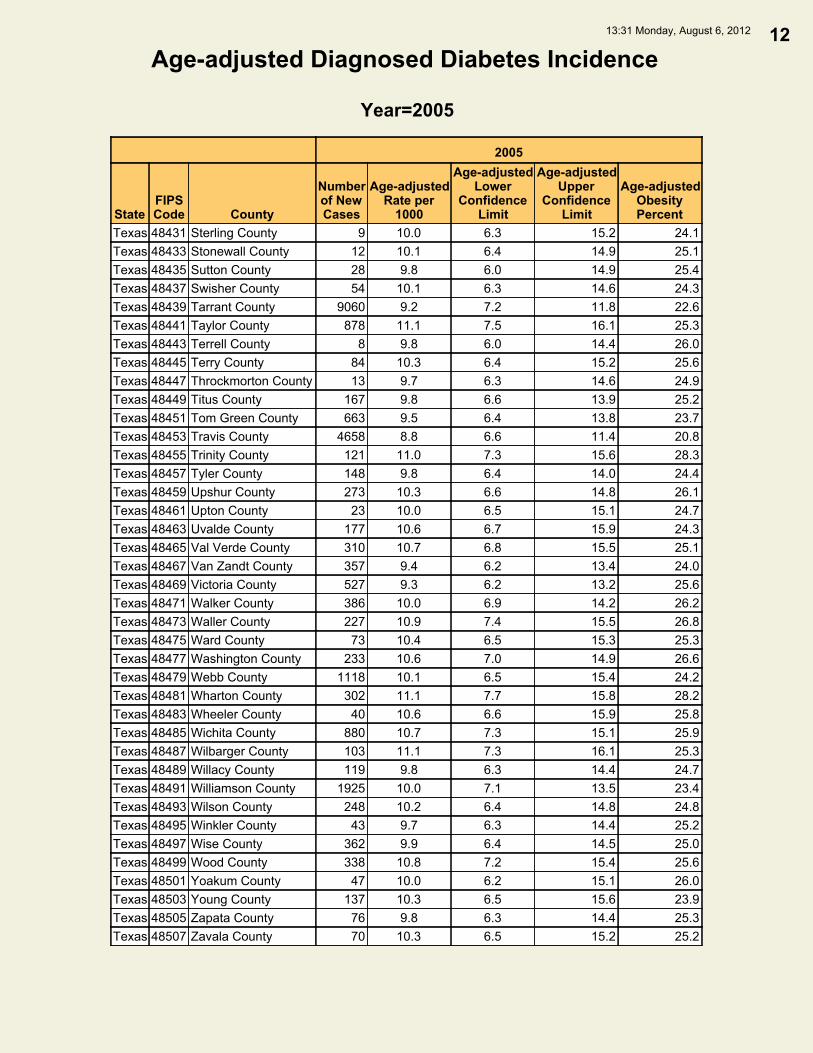
Age-adjusted Diagnosed Diabetes Incidence13:31 Monday, August 6, 2012 12
Year=2005
2005
StateFIPSCode County
Numberof NewCases
Age-adjustedRate per
1000
Age-adjustedLower
ConfidenceLimit
Age-adjustedUpper
ConfidenceLimit
Age-adjustedObesityPercent
Texas 48431 Sterling County 9 10.0 6.3 15.2 24.1
Texas 48433 Stonewall County 12 10.1 6.4 14.9 25.1
Texas 48435 Sutton County 28 9.8 6.0 14.9 25.4
Texas 48437 Swisher County 54 10.1 6.3 14.6 24.3
Texas 48439 Tarrant County 9060 9.2 7.2 11.8 22.6
Texas 48441 Taylor County 878 11.1 7.5 16.1 25.3
Texas 48443 Terrell County 8 9.8 6.0 14.4 26.0
Texas 48445 Terry County 84 10.3 6.4 15.2 25.6
Texas 48447 Throckmorton County 13 9.7 6.3 14.6 24.9
Texas 48449 Titus County 167 9.8 6.6 13.9 25.2
Texas 48451 Tom Green County 663 9.5 6.4 13.8 23.7
Texas 48453 Travis County 4658 8.8 6.6 11.4 20.8
Texas 48455 Trinity County 121 11.0 7.3 15.6 28.3
Texas 48457 Tyler County 148 9.8 6.4 14.0 24.4
Texas 48459 Upshur County 273 10.3 6.6 14.8 26.1
Texas 48461 Upton County 23 10.0 6.5 15.1 24.7
Texas 48463 Uvalde County 177 10.6 6.7 15.9 24.3
Texas 48465 Val Verde County 310 10.7 6.8 15.5 25.1
Texas 48467 Van Zandt County 357 9.4 6.2 13.4 24.0
Texas 48469 Victoria County 527 9.3 6.2 13.2 25.6
Texas 48471 Walker County 386 10.0 6.9 14.2 26.2
Texas 48473 Waller County 227 10.9 7.4 15.5 26.8
Texas 48475 Ward County 73 10.4 6.5 15.3 25.3
Texas 48477 Washington County 233 10.6 7.0 14.9 26.6
Texas 48479 Webb County 1118 10.1 6.5 15.4 24.2
Texas 48481 Wharton County 302 11.1 7.7 15.8 28.2
Texas 48483 Wheeler County 40 10.6 6.6 15.9 25.8
Texas 48485 Wichita County 880 10.7 7.3 15.1 25.9
Texas 48487 Wilbarger County 103 11.1 7.3 16.1 25.3
Texas 48489 Willacy County 119 9.8 6.3 14.4 24.7
Texas 48491 Williamson County 1925 10.0 7.1 13.5 23.4
Texas 48493 Wilson County 248 10.2 6.4 14.8 24.8
Texas 48495 Winkler County 43 9.7 6.3 14.4 25.2
Texas 48497 Wise County 362 9.9 6.4 14.5 25.0
Texas 48499 Wood County 338 10.8 7.2 15.4 25.6
Texas 48501 Yoakum County 47 10.0 6.2 15.1 26.0
Texas 48503 Young County 137 10.3 6.5 15.6 23.9
Texas 48505 Zapata County 76 9.8 6.3 14.4 25.3
Texas 48507 Zavala County 70 10.3 6.5 15.2 25.2
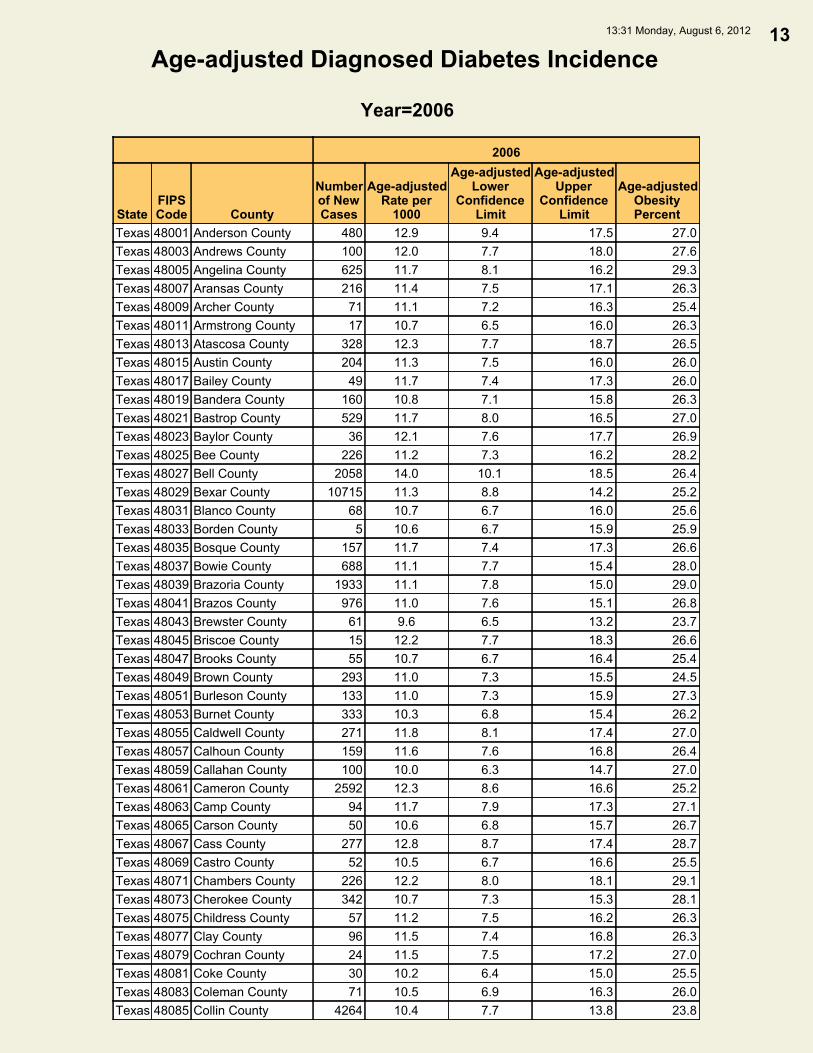
Age-adjusted Diagnosed Diabetes Incidence13:31 Monday, August 6, 2012 13
Year=2006
2006
StateFIPSCode County
Numberof NewCases
Age-adjustedRate per
1000
Age-adjustedLower
ConfidenceLimit
Age-adjustedUpper
ConfidenceLimit
Age-adjustedObesityPercent
Texas 48001 Anderson County 480 12.9 9.4 17.5 27.0
Texas 48003 Andrews County 100 12.0 7.7 18.0 27.6
Texas 48005 Angelina County 625 11.7 8.1 16.2 29.3
Texas 48007 Aransas County 216 11.4 7.5 17.1 26.3
Texas 48009 Archer County 71 11.1 7.2 16.3 25.4
Texas 48011 Armstrong County 17 10.7 6.5 16.0 26.3
Texas 48013 Atascosa County 328 12.3 7.7 18.7 26.5
Texas 48015 Austin County 204 11.3 7.5 16.0 26.0
Texas 48017 Bailey County 49 11.7 7.4 17.3 26.0
Texas 48019 Bandera County 160 10.8 7.1 15.8 26.3
Texas 48021 Bastrop County 529 11.7 8.0 16.5 27.0
Texas 48023 Baylor County 36 12.1 7.6 17.7 26.9
Texas 48025 Bee County 226 11.2 7.3 16.2 28.2
Texas 48027 Bell County 2058 14.0 10.1 18.5 26.4
Texas 48029 Bexar County 10715 11.3 8.8 14.2 25.2
Texas 48031 Blanco County 68 10.7 6.7 16.0 25.6
Texas 48033 Borden County 5 10.6 6.7 15.9 25.9
Texas 48035 Bosque County 157 11.7 7.4 17.3 26.6
Texas 48037 Bowie County 688 11.1 7.7 15.4 28.0
Texas 48039 Brazoria County 1933 11.1 7.8 15.0 29.0
Texas 48041 Brazos County 976 11.0 7.6 15.1 26.8
Texas 48043 Brewster County 61 9.6 6.5 13.2 23.7
Texas 48045 Briscoe County 15 12.2 7.7 18.3 26.6
Texas 48047 Brooks County 55 10.7 6.7 16.4 25.4
Texas 48049 Brown County 293 11.0 7.3 15.5 24.5
Texas 48051 Burleson County 133 11.0 7.3 15.9 27.3
Texas 48053 Burnet County 333 10.3 6.8 15.4 26.2
Texas 48055 Caldwell County 271 11.8 8.1 17.4 27.0
Texas 48057 Calhoun County 159 11.6 7.6 16.8 26.4
Texas 48059 Callahan County 100 10.0 6.3 14.7 27.0
Texas 48061 Cameron County 2592 12.3 8.6 16.6 25.2
Texas 48063 Camp County 94 11.7 7.9 17.3 27.1
Texas 48065 Carson County 50 10.6 6.8 15.7 26.7
Texas 48067 Cass County 277 12.8 8.7 17.4 28.7
Texas 48069 Castro County 52 10.5 6.7 16.6 25.5
Texas 48071 Chambers County 226 12.2 8.0 18.1 29.1
Texas 48073 Cherokee County 342 10.7 7.3 15.3 28.1
Texas 48075 Childress County 57 11.2 7.5 16.2 26.3
Texas 48077 Clay County 96 11.5 7.4 16.8 26.3
Texas 48079 Cochran County 24 11.5 7.5 17.2 27.0
Texas 48081 Coke County 30 10.2 6.4 15.0 25.5
Texas 48083 Coleman County 71 10.5 6.9 16.3 26.0
Texas 48085 Collin County 4264 10.4 7.7 13.8 23.8

Age-adjusted Diagnosed Diabetes Incidence13:31 Monday, August 6, 2012 14
Year=2006
2006
StateFIPSCode County
Numberof NewCases
Age-adjustedRate per
1000
Age-adjustedLower
ConfidenceLimit
Age-adjustedUpper
ConfidenceLimit
Age-adjustedObesityPercent
Texas 48087 Collingsworth County 25 11.4 7.2 17.1 26.5
Texas 48089 Colorado County 169 11.3 7.5 16.1 27.4
Texas 48091 Comal County 695 9.9 6.8 14.0 24.4
Texas 48093 Comanche County 113 11.3 7.4 16.6 26.8
Texas 48095 Concho County 29 11.1 6.9 17.0 26.4
Texas 48097 Cooke County 310 12.0 7.6 18.2 26.6
Texas 48099 Coryell County 451 11.6 7.9 16.9 25.6
Texas 48101 Cottle County 15 11.6 7.5 16.8 27.5
Texas 48103 Crane County 28 11.2 7.1 16.7 27.1
Texas 48105 Crockett County 31 11.3 7.1 17.8 26.4
Texas 48107 Crosby County 52 11.9 7.5 17.4 28.0
Texas 48109 Culberson County 20 11.0 7.0 16.5 25.7
Texas 48111 Dallam County 39 10.6 7.0 15.9 26.5
Texas 48113 Dallas County 16571 11.9 9.6 14.9 25.7
Texas 48115 Dawson County 110 11.8 7.5 17.3 26.4
Texas 48117 Deaf Smith County 134 12.2 8.0 17.7 26.4
Texas 48119 Delta County 44 11.3 7.3 16.2 27.3
Texas 48121 Denton County 4109 12.1 8.7 16.1 26.0
Texas 48123 DeWitt County 172 11.9 7.9 16.8 27.8
Texas 48125 Dickens County 22 11.8 7.4 17.5 27.4
Texas 48127 Dimmit County 65 10.5 6.8 15.3 27.0
Texas 48129 Donley County 32 10.8 7.0 15.8 26.6
Texas 48131 Duval County 90 11.0 6.9 16.3 25.5
Texas 48133 Eastland County 152 11.4 7.2 17.0 27.2
Texas 48135 Ector County 849 10.9 7.3 15.2 27.7
Texas 48137 Edwards County 15 11.5 7.3 17.5 26.4
Texas 48139 Ellis County 901 10.6 7.0 15.2 29.1
Texas 48141 El Paso County 4064 9.4 7.0 12.3 23.1
Texas 48143 Erath County 245 10.9 7.1 16.6 26.8
Texas 48145 Falls County 147 12.6 8.5 18.0 29.3
Texas 48147 Fannin County 258 11.1 7.4 16.0 25.8
Texas 48149 Fayette County 185 10.6 7.0 15.7 25.7
Texas 48151 Fisher County 36 11.4 7.3 16.6 26.4
Texas 48153 Floyd County 53 11.3 7.2 16.6 26.8
Texas 48155 Foard County 12 11.0 7.0 16.3 25.5
Texas 48157 Fort Bend County 3226 11.1 8.0 14.7 25.4
Texas 48159 Franklin County 89 11.3 7.4 17.1 26.2
Texas 48161 Freestone County 158 12.1 8.2 17.5 27.4
Texas 48163 Frio County 105 10.4 6.7 16.1 25.6
Texas 48165 Gaines County 93 10.7 6.8 15.8 28.1
Texas 48167 Galveston County 2500 13.8 9.7 19.2 26.7
Texas 48169 Garza County 36 11.2 7.2 17.0 26.8
Texas 48171 Gillespie County 190 10.0 6.5 14.7 25.0

Age-adjusted Diagnosed Diabetes Incidence13:31 Monday, August 6, 2012 15
Year=2006
2006
StateFIPSCode County
Numberof NewCases
Age-adjustedRate per
1000
Age-adjustedLower
ConfidenceLimit
Age-adjustedUpper
ConfidenceLimit
Age-adjustedObesityPercent
Texas 48173 Glasscock County 9 10.8 6.7 16.7 25.6
Texas 48175 Goliad County 55 10.4 6.7 15.7 25.1
Texas 48177 Gonzales County 145 11.3 7.5 15.9 27.5
Texas 48179 Gray County 175 11.2 7.3 16.4 27.4
Texas 48181 Grayson County 942 11.6 7.9 16.4 25.1
Texas 48183 Gregg County 929 12.3 8.7 16.5 26.9
Texas 48185 Grimes County 231 13.4 9.1 19.4 27.6
Texas 48187 Guadalupe County 815 11.7 7.9 16.5 26.6
Texas 48189 Hale County 258 11.8 7.7 17.5 27.1
Texas 48191 Hall County 31 12.1 8.0 18.1 26.6
Texas 48193 Hamilton County 72 11.6 7.3 17.8 25.9
Texas 48195 Hansford County 36 10.3 6.7 15.5 25.4
Texas 48197 Hardeman County 36 11.3 7.3 16.5 27.1
Texas 48199 Hardin County 445 13.1 8.7 18.7 26.9
Texas 48201 Harris County 25193 10.9 8.6 13.7 23.7
Texas 48203 Harrison County 548 13.0 9.4 17.7 28.8
Texas 48205 Hartley County 41 11.0 7.1 16.5 27.0
Texas 48207 Haskell County 49 10.9 7.2 16.1 26.8
Texas 48209 Hays County 712 9.1 6.2 12.7 23.1
Texas 48211 Hemphill County 27 11.3 6.9 17.5 26.1
Texas 48213 Henderson County 562 9.7 6.6 14.0 28.1
Texas 48215 Hidalgo County 4655 13.1 9.4 18.3 29.1
Texas 48217 Hill County 270 11.1 7.6 16.1 27.4
Texas 48219 Hockley County 149 10.3 6.7 15.0 24.9
Texas 48221 Hood County 429 12.1 8.0 17.4 26.1
Texas 48223 Hopkins County 271 12.0 8.0 16.9 28.1
Texas 48225 Houston County 207 12.4 8.4 17.7 28.8
Texas 48227 Howard County 237 10.8 7.0 15.9 26.7
Texas 48229 Hudspeth County 23 11.2 7.3 16.9 25.6
Texas 48231 Hunt County 608 11.1 7.4 16.2 27.2
Texas 48233 Hutchinson County 204 13.3 8.9 19.6 27.4
Texas 48235 Irion County 14 11.2 6.9 17.6 25.7
Texas 48237 Jack County 71 11.4 7.2 16.4 26.9
Texas 48239 Jackson County 123 12.5 8.1 18.2 27.6
Texas 48241 Jasper County 287 11.8 7.9 16.4 28.1
Texas 48243 Jeff Davis County 18 10.1 6.4 14.8 23.8
Texas 48245 Jefferson County 2364 15.0 10.9 20.1 29.2
Texas 48247 Jim Hogg County 38 11.3 7.3 17.1 26.5
Texas 48249 Jim Wells County 283 10.9 6.9 16.6 26.2
Texas 48251 Johnson County 1290 14.0 9.6 19.8 27.5
Texas 48253 Jones County 157 11.8 7.8 17.1 26.3
Texas 48255 Karnes County 115 11.3 7.4 16.3 27.6
Texas 48257 Kaufman County 637 11.2 7.4 15.9 26.0

Age-adjusted Diagnosed Diabetes Incidence13:31 Monday, August 6, 2012 16
Year=2006
2006
StateFIPSCode County
Numberof NewCases
Age-adjustedRate per
1000
Age-adjustedLower
ConfidenceLimit
Age-adjustedUpper
ConfidenceLimit
Age-adjustedObesityPercent
Texas 48259 Kendall County 194 9.0 5.8 13.2 23.7
Texas 48261 Kenedy County 3 11.5 7.0 17.2 26.0
Texas 48263 Kent County 7 10.8 6.6 16.2 25.8
Texas 48265 Kerr County 379 10.2 6.9 15.1 25.1
Texas 48267 Kimble County 39 11.3 7.2 16.6 25.5
Texas 48269 King County 2 11.2 7.2 16.7 26.5
Texas 48271 Kinney County 28 10.9 6.9 16.2 26.5
Texas 48273 Kleberg County 216 11.6 7.7 17.3 26.2
Texas 48275 Knox County 32 11.6 7.4 17.3 26.7
Texas 48277 Lamar County 407 12.0 8.3 16.9 25.5
Texas 48279 Lamb County 108 11.4 7.5 16.9 26.6
Texas 48281 Lampasas County 147 10.3 6.8 14.9 25.3
Texas 48283 La Salle County 43 11.5 7.3 17.5 27.1
Texas 48285 Lavaca County 176 12.4 8.1 18.4 27.8
Texas 48287 Lee County 124 11.2 7.4 16.1 26.6
Texas 48289 Leon County 134 10.9 7.2 15.7 25.7
Texas 48291 Liberty County 658 14.1 9.6 19.7 28.3
Texas 48293 Limestone County 180 11.7 8.0 16.8 27.8
Texas 48295 Lipscomb County 24 11.1 7.1 16.4 25.8
Texas 48297 Live Oak County 95 10.8 6.9 16.3 26.8
Texas 48299 Llano County 164 10.1 6.6 14.8 24.4
Texas 48301 Loving County 1 10.6 6.7 16.3 24.1
Texas 48303 Lubbock County 1678 10.3 7.5 13.7 26.6
Texas 48305 Lynn County 44 10.7 6.8 15.9 27.3
Texas 48307 McCulloch County 68 11.7 7.3 17.3 25.5
Texas 48309 McLennan County 1789 12.8 9.1 17.2 30.1
Texas 48311 McMullen County 8 10.9 7.0 16.8 27.2
Texas 48313 Madison County 109 12.4 8.3 17.5 28.4
Texas 48315 Marion County 99 11.8 8.1 17.3 29.1
Texas 48317 Martin County 30 10.9 6.9 16.5 25.5
Texas 48319 Mason County 33 10.3 6.4 15.3 25.4
Texas 48321 Matagorda County 310 12.7 8.5 18.4 27.9
Texas 48323 Maverick County 348 12.2 7.8 17.9 25.9
Texas 48325 Medina County 305 10.7 7.2 15.5 26.1
Texas 48327 Menard County 20 10.8 6.9 16.5 25.8
Texas 48329 Midland County 1081 13.8 9.7 19.4 24.9
Texas 48331 Milam County 216 12.6 8.2 18.3 26.7
Texas 48333 Mills County 42 10.6 6.8 16.1 26.0
Texas 48335 Mitchell County 81 12.8 8.1 18.7 27.5
Texas 48337 Montague County 170 11.7 7.3 17.3 26.0
Texas 48339 Montgomery County 2439 9.8 6.9 13.6 23.9
Texas 48341 Moore County 123 10.5 6.8 15.6 27.0
Texas 48343 Morris County 139 15.1 10.3 21.2 28.6

Age-adjusted Diagnosed Diabetes Incidence13:31 Monday, August 6, 2012 17
Year=2006
2006
StateFIPSCode County
Numberof NewCases
Age-adjustedRate per
1000
Age-adjustedLower
ConfidenceLimit
Age-adjustedUpper
ConfidenceLimit
Age-adjustedObesityPercent
Texas 48345 Motley County 12 11.1 7.1 16.6 26.0
Texas 48347 Nacogdoches County 428 11.3 7.8 15.9 27.7
Texas 48349 Navarro County 371 11.7 7.9 17.6 28.6
Texas 48351 Newton County 122 12.4 8.5 17.7 27.1
Texas 48353 Nolan County 118 11.5 7.7 17.0 26.0
Texas 48355 Nueces County 2457 11.9 8.5 16.0 27.2
Texas 48357 Ochiltree County 59 10.1 6.4 15.1 24.8
Texas 48359 Oldham County 15 11.0 7.2 16.6 26.6
Texas 48361 Orange County 627 10.9 7.5 15.3 31.0
Texas 48363 Palo Pinto County 198 10.1 6.5 15.0 27.4
Texas 48365 Panola County 194 11.8 7.9 16.9 28.2
Texas 48367 Parker County 835 12.0 8.1 17.4 25.8
Texas 48369 Parmer County 67 11.2 7.0 16.7 26.7
Texas 48371 Pecos County 124 12.2 8.1 18.0 24.9
Texas 48373 Polk County 435 13.0 9.0 18.4 28.8
Texas 48375 Potter County 864 11.8 8.2 16.3 27.8
Texas 48377 Presidio County 51 10.2 6.5 15.2 25.3
Texas 48379 Rains County 90 11.0 6.9 16.3 27.0
Texas 48381 Randall County 721 9.7 6.6 13.4 25.7
Texas 48383 Reagan County 22 11.3 7.2 17.4 26.6
Texas 48385 Real County 25 10.8 7.0 15.8 25.2
Texas 48387 Red River County 125 12.6 8.3 18.2 26.6
Texas 48389 Reeves County 85 11.1 7.0 16.5 26.5
Texas 48391 Refugio County 64 11.6 7.5 17.0 26.9
Texas 48393 Roberts County 7 11.1 7.2 17.4 26.2
Texas 48395 Robertson County 132 12.2 8.1 17.6 28.9
Texas 48397 Rockwall County 462 10.9 7.1 16.3 26.8
Texas 48399 Runnels County 90 11.7 7.5 17.5 25.3
Texas 48401 Rusk County 410 12.3 8.5 17.4 28.6
Texas 48403 Sabine County 99 12.2 8.1 18.3 26.8
Texas 48405 San Augustine County 82 12.5 8.6 18.1 27.5
Texas 48407 San Jacinto County 204 11.6 7.8 16.9 28.8
Texas 48409 San Patricio County 465 10.8 7.1 16.0 25.9
Texas 48411 San Saba County 44 10.5 6.6 15.9 25.7
Texas 48413 Schleicher County 22 10.7 6.7 15.8 26.5
Texas 48415 Scurry County 110 10.0 6.4 14.3 25.3
Texas 48417 Shackelford County 25 10.5 6.6 16.0 25.7
Texas 48419 Shelby County 209 12.0 8.2 17.1 26.7
Texas 48421 Sherman County 21 10.8 6.8 16.3 25.5
Texas 48423 Smith County 1374 10.6 7.7 14.2 27.3
Texas 48425 Somervell County 61 11.5 7.4 17.0 26.4
Texas 48427 Starr County 365 11.6 7.3 17.6 26.5
Texas 48429 Stephens County 76 11.2 7.4 16.6 28.3

Age-adjusted Diagnosed Diabetes Incidence13:31 Monday, August 6, 2012 18
Year=2006
2006
StateFIPSCode County
Numberof NewCases
Age-adjustedRate per
1000
Age-adjustedLower
ConfidenceLimit
Age-adjustedUpper
ConfidenceLimit
Age-adjustedObesityPercent
Texas 48431 Sterling County 10 10.9 7.0 16.7 25.2
Texas 48433 Stonewall County 13 11.1 7.2 16.5 26.2
Texas 48435 Sutton County 31 10.8 6.9 16.2 25.9
Texas 48437 Swisher County 60 11.3 7.2 16.9 25.4
Texas 48439 Tarrant County 10917 10.8 8.5 13.3 24.8
Texas 48441 Taylor County 931 11.6 8.0 16.4 26.1
Texas 48443 Terrell County 9 11.5 7.3 17.3 26.7
Texas 48445 Terry County 93 11.4 7.4 16.8 26.2
Texas 48447 Throckmorton County 15 10.6 6.5 15.8 26.1
Texas 48449 Titus County 188 10.9 7.2 15.9 25.6
Texas 48451 Tom Green County 801 11.6 7.7 16.4 25.5
Texas 48453 Travis County 5408 9.6 7.5 12.1 20.2
Texas 48455 Trinity County 127 11.9 7.5 17.2 28.5
Texas 48457 Tyler County 166 11.2 7.4 16.6 25.6
Texas 48459 Upshur County 306 11.6 7.9 16.3 27.0
Texas 48461 Upton County 26 11.5 7.2 17.3 25.8
Texas 48463 Uvalde County 192 11.5 7.5 17.2 25.0
Texas 48465 Val Verde County 412 14.4 9.9 20.6 26.4
Texas 48467 Van Zandt County 361 9.5 6.4 13.6 26.1
Texas 48469 Victoria County 647 11.5 7.8 16.6 27.5
Texas 48471 Walker County 488 12.6 8.7 17.8 28.9
Texas 48473 Waller County 260 12.3 8.4 17.3 29.5
Texas 48475 Ward County 77 10.9 7.1 15.9 27.3
Texas 48477 Washington County 296 13.7 9.3 19.6 30.4
Texas 48479 Webb County 1465 12.9 8.5 18.3 27.7
Texas 48481 Wharton County 332 12.3 8.3 18.0 30.2
Texas 48483 Wheeler County 43 11.8 7.7 17.3 27.1
Texas 48485 Wichita County 1023 12.5 8.7 17.1 24.9
Texas 48487 Wilbarger County 108 11.7 7.9 17.4 27.1
Texas 48489 Willacy County 137 11.1 6.9 16.7 26.6
Texas 48491 Williamson County 2315 11.4 8.3 14.9 23.5
Texas 48493 Wilson County 289 11.5 7.4 17.2 26.0
Texas 48495 Winkler County 47 10.7 6.8 15.6 25.5
Texas 48497 Wise County 376 9.9 6.5 14.7 26.4
Texas 48499 Wood County 419 13.6 9.3 19.9 26.5
Texas 48501 Yoakum County 53 11.2 7.1 16.6 26.6
Texas 48503 Young County 143 10.8 6.8 16.3 26.1
Texas 48505 Zapata County 84 10.8 6.8 16.8 26.9
Texas 48507 Zavala County 77 11.4 7.2 16.8 26.4

Age-adjusted Diagnosed Diabetes Incidence13:31 Monday, August 6, 2012 19
Year=2007
2007
StateFIPSCode County
Numberof NewCases
Age-adjustedRate per
1000
Age-adjustedLower
ConfidenceLimit
Age-adjustedUpper
ConfidenceLimit
Age-adjustedObesityPercent
Texas 48001 Anderson County 532 14.1 9.7 18.8 28.6
Texas 48003 Andrews County 96 11.1 7.2 16.6 27.5
Texas 48005 Angelina County 604 11.1 7.7 15.1 29.3
Texas 48007 Aransas County 215 11.2 7.2 16.5 27.2
Texas 48009 Archer County 74 11.6 7.3 17.0 26.3
Texas 48011 Armstrong County 18 11.0 7.0 16.6 27.6
Texas 48013 Atascosa County 325 11.9 7.6 17.8 26.4
Texas 48015 Austin County 212 11.6 7.5 16.9 26.3
Texas 48017 Bailey County 47 11.4 7.1 17.5 27.5
Texas 48019 Bandera County 163 10.8 6.8 15.7 26.4
Texas 48021 Bastrop County 581 12.5 8.5 17.3 28.5
Texas 48023 Baylor County 35 11.7 7.3 17.8 27.6
Texas 48025 Bee County 242 11.6 7.5 16.9 28.7
Texas 48027 Bell County 2280 14.9 10.9 19.4 27.4
Texas 48029 Bexar County 10635 11.0 8.6 13.7 26.1
Texas 48031 Blanco County 68 10.9 6.6 16.7 26.4
Texas 48033 Borden County 5 11.0 6.7 16.7 26.8
Texas 48035 Bosque County 147 10.9 6.9 16.1 26.6
Texas 48037 Bowie County 707 11.4 7.6 16.1 29.6
Texas 48039 Brazoria County 2432 13.7 9.7 18.2 28.7
Texas 48041 Brazos County 1097 11.8 8.3 16.5 26.4
Texas 48043 Brewster County 61 9.4 6.3 13.8 25.1
Texas 48045 Briscoe County 14 12.2 7.4 18.9 27.3
Texas 48047 Brooks County 56 11.0 6.9 17.0 26.3
Texas 48049 Brown County 292 10.9 7.1 16.0 25.3
Texas 48051 Burleson County 138 11.5 7.6 16.5 27.0
Texas 48053 Burnet County 348 10.5 6.7 14.9 27.1
Texas 48055 Caldwell County 275 11.7 7.7 17.2 28.5
Texas 48057 Calhoun County 162 11.8 7.5 17.7 27.6
Texas 48059 Callahan County 107 10.7 7.0 16.2 28.5
Texas 48061 Cameron County 2574 11.9 8.4 16.3 25.4
Texas 48063 Camp County 95 11.5 7.6 16.5 28.2
Texas 48065 Carson County 54 11.6 7.3 17.4 27.2
Texas 48067 Cass County 273 12.6 8.5 18.3 29.4
Texas 48069 Castro County 54 11.2 7.1 16.8 26.4
Texas 48071 Chambers County 229 12.2 7.8 18.3 27.8
Texas 48073 Cherokee County 355 11.1 7.3 15.7 27.4
Texas 48075 Childress County 59 11.5 7.4 16.9 27.0
Texas 48077 Clay County 91 11.0 7.0 16.8 27.8
Texas 48079 Cochran County 24 11.6 7.3 17.5 27.8
Texas 48081 Coke County 30 10.6 6.6 16.1 26.7
Texas 48083 Coleman County 69 10.3 6.5 15.7 26.2
Texas 48085 Collin County 4319 9.9 7.2 13.0 23.7

Age-adjusted Diagnosed Diabetes Incidence13:31 Monday, August 6, 2012 20
Year=2007
2007
StateFIPSCode County
Numberof NewCases
Age-adjustedRate per
1000
Age-adjustedLower
ConfidenceLimit
Age-adjustedUpper
ConfidenceLimit
Age-adjustedObesityPercent
Texas 48087 Collingsworth County 25 11.6 7.2 17.6 27.3
Texas 48089 Colorado County 171 11.6 7.8 16.5 28.6
Texas 48091 Comal County 699 9.6 6.5 13.7 24.0
Texas 48093 Comanche County 115 11.6 7.2 17.2 28.0
Texas 48095 Concho County 30 11.7 7.2 17.6 28.1
Texas 48097 Cooke County 377 15.0 9.6 22.7 27.8
Texas 48099 Coryell County 502 12.5 8.6 18.1 26.9
Texas 48101 Cottle County 15 11.8 7.5 17.8 28.1
Texas 48103 Crane County 31 12.1 7.4 18.4 28.1
Texas 48105 Crockett County 31 11.4 7.3 17.5 27.3
Texas 48107 Crosby County 49 11.6 7.4 17.2 28.0
Texas 48109 Culberson County 20 11.3 6.9 17.3 26.1
Texas 48111 Dallam County 41 10.9 6.9 16.3 26.6
Texas 48113 Dallas County 16590 11.6 9.2 14.5 26.8
Texas 48115 Dawson County 112 12.2 7.9 17.9 27.9
Texas 48117 Deaf Smith County 141 12.8 7.8 19.5 26.9
Texas 48119 Delta County 45 11.5 7.3 16.8 27.8
Texas 48121 Denton County 4539 12.7 9.1 17.2 27.8
Texas 48123 DeWitt County 171 11.9 7.7 17.7 28.4
Texas 48125 Dickens County 23 12.1 7.5 18.2 28.4
Texas 48127 Dimmit County 68 10.9 6.8 16.5 27.4
Texas 48129 Donley County 34 11.4 7.4 16.8 26.4
Texas 48131 Duval County 94 11.6 7.4 17.0 26.0
Texas 48133 Eastland County 152 11.3 7.0 17.4 26.7
Texas 48135 Ector County 801 10.0 6.7 14.9 28.4
Texas 48137 Edwards County 15 11.5 7.3 17.4 26.9
Texas 48139 Ellis County 953 10.8 7.2 15.6 28.7
Texas 48141 El Paso County 4335 9.9 7.3 13.0 23.9
Texas 48143 Erath County 268 11.9 7.4 18.0 27.5
Texas 48145 Falls County 141 12.1 8.0 17.0 29.6
Texas 48147 Fannin County 277 11.9 7.6 17.1 25.6
Texas 48149 Fayette County 194 11.2 7.2 16.7 26.9
Texas 48151 Fisher County 35 11.3 7.0 16.9 27.2
Texas 48153 Floyd County 52 11.4 7.2 16.8 27.1
Texas 48155 Foard County 13 11.7 7.7 18.1 26.6
Texas 48157 Fort Bend County 3403 11.1 8.0 15.1 25.2
Texas 48159 Franklin County 88 11.1 7.1 16.4 26.7
Texas 48161 Freestone County 156 12.0 7.8 17.4 28.8
Texas 48163 Frio County 110 10.9 6.9 16.4 26.5
Texas 48165 Gaines County 95 10.7 6.7 16.7 28.2
Texas 48167 Galveston County 2376 12.9 9.0 17.8 28.0
Texas 48169 Garza County 36 11.5 7.3 17.6 28.0
Texas 48171 Gillespie County 196 10.2 6.6 15.8 25.2

Age-adjusted Diagnosed Diabetes Incidence13:31 Monday, August 6, 2012 21
Year=2007
2007
StateFIPSCode County
Numberof NewCases
Age-adjustedRate per
1000
Age-adjustedLower
ConfidenceLimit
Age-adjustedUpper
ConfidenceLimit
Age-adjustedObesityPercent
Texas 48173 Glasscock County 9 11.0 6.7 16.7 26.1
Texas 48175 Goliad County 57 10.7 6.9 16.2 26.1
Texas 48177 Gonzales County 145 11.5 7.4 17.2 28.2
Texas 48179 Gray County 187 11.9 7.8 17.2 28.6
Texas 48181 Grayson County 893 10.9 7.3 15.3 25.3
Texas 48183 Gregg County 933 12.2 8.8 17.0 29.1
Texas 48185 Grimes County 227 12.9 8.7 18.7 28.0
Texas 48187 Guadalupe County 846 11.7 8.0 16.3 28.5
Texas 48189 Hale County 271 12.5 8.1 18.8 27.8
Texas 48191 Hall County 29 11.7 7.4 17.5 27.0
Texas 48193 Hamilton County 74 12.0 7.3 17.9 26.6
Texas 48195 Hansford County 37 10.7 6.7 16.4 26.4
Texas 48197 Hardeman County 35 11.2 7.2 16.5 27.5
Texas 48199 Hardin County 469 13.7 9.0 19.7 27.7
Texas 48201 Harris County 27213 11.7 9.2 14.5 25.6
Texas 48203 Harrison County 586 14.1 9.9 19.3 28.6
Texas 48205 Hartley County 43 12.0 7.3 17.9 28.5
Texas 48207 Haskell County 49 11.2 7.0 16.8 27.8
Texas 48209 Hays County 809 9.6 6.5 13.5 24.6
Texas 48211 Hemphill County 27 11.2 6.9 17.4 26.1
Texas 48213 Henderson County 583 10.1 6.7 14.6 29.1
Texas 48215 Hidalgo County 5152 14.0 10.1 19.0 28.8
Texas 48217 Hill County 259 10.5 6.8 15.7 28.8
Texas 48219 Hockley County 152 10.6 6.6 16.0 26.4
Texas 48221 Hood County 461 12.8 8.5 18.5 26.5
Texas 48223 Hopkins County 296 13.1 8.5 19.2 29.2
Texas 48225 Houston County 212 12.8 8.8 18.1 30.3
Texas 48227 Howard County 246 11.1 7.1 16.6 28.6
Texas 48229 Hudspeth County 24 11.3 6.8 17.0 26.0
Texas 48231 Hunt County 680 12.4 8.1 18.4 28.9
Texas 48233 Hutchinson County 186 12.3 8.2 18.2 27.7
Texas 48235 Irion County 14 11.3 7.2 16.9 26.4
Texas 48237 Jack County 79 12.9 7.9 19.8 27.7
Texas 48239 Jackson County 126 12.9 8.1 19.5 27.7
Texas 48241 Jasper County 285 11.8 8.1 16.5 29.0
Texas 48243 Jeff Davis County 18 10.2 6.3 15.6 24.3
Texas 48245 Jefferson County 2354 14.9 10.9 20.1 30.3
Texas 48247 Jim Hogg County 39 11.6 7.1 17.5 27.1
Texas 48249 Jim Wells County 291 11.1 7.0 17.3 26.9
Texas 48251 Johnson County 1241 13.1 9.1 18.1 28.4
Texas 48253 Jones County 162 12.2 7.8 18.2 27.2
Texas 48255 Karnes County 119 11.6 7.7 16.6 29.1
Texas 48257 Kaufman County 647 10.8 7.1 15.5 26.6

Age-adjusted Diagnosed Diabetes Incidence13:31 Monday, August 6, 2012 22
Year=2007
2007
StateFIPSCode County
Numberof NewCases
Age-adjustedRate per
1000
Age-adjustedLower
ConfidenceLimit
Age-adjustedUpper
ConfidenceLimit
Age-adjustedObesityPercent
Texas 48259 Kendall County 209 9.3 5.9 13.9 24.8
Texas 48261 Kenedy County 3 11.3 7.0 17.2 26.6
Texas 48263 Kent County 7 11.0 6.8 17.4 26.4
Texas 48265 Kerr County 380 10.1 6.6 14.7 26.4
Texas 48267 Kimble County 38 11.1 6.8 16.8 26.0
Texas 48269 King County 2 11.3 7.3 16.7 27.2
Texas 48271 Kinney County 28 11.0 6.8 16.9 27.1
Texas 48273 Kleberg County 218 11.6 7.3 17.5 27.0
Texas 48275 Knox County 32 12.1 8.0 17.9 27.4
Texas 48277 Lamar County 418 12.4 8.3 17.5 26.7
Texas 48279 Lamb County 107 11.3 7.1 17.0 27.8
Texas 48281 Lampasas County 148 10.0 6.4 14.6 26.4
Texas 48283 La Salle County 42 11.2 6.9 16.5 27.5
Texas 48285 Lavaca County 170 11.9 7.7 17.4 27.5
Texas 48287 Lee County 128 11.5 7.3 16.8 26.3
Texas 48289 Leon County 131 10.6 6.9 15.2 26.4
Texas 48291 Liberty County 611 12.8 8.5 18.5 28.0
Texas 48293 Limestone County 185 12.2 7.9 17.9 28.4
Texas 48295 Lipscomb County 24 11.4 7.1 17.3 26.2
Texas 48297 Live Oak County 95 10.8 6.7 16.2 27.2
Texas 48299 Llano County 175 11.0 6.9 16.4 25.4
Texas 48301 Loving County 0 10.7 6.6 16.3 24.4
Texas 48303 Lubbock County 1715 10.4 7.9 13.5 25.9
Texas 48305 Lynn County 44 10.7 6.9 16.1 27.9
Texas 48307 McCulloch County 66 11.4 7.1 17.0 26.3
Texas 48309 McLennan County 1846 13.0 9.5 17.7 31.3
Texas 48311 McMullen County 8 11.1 6.8 17.0 27.9
Texas 48313 Madison County 111 12.3 8.2 17.9 29.5
Texas 48315 Marion County 103 12.4 8.3 18.3 29.5
Texas 48317 Martin County 31 11.0 7.0 16.6 25.9
Texas 48319 Mason County 34 10.8 6.7 16.6 26.5
Texas 48321 Matagorda County 322 13.3 8.7 19.1 27.9
Texas 48323 Maverick County 366 12.7 8.3 18.6 26.5
Texas 48325 Medina County 333 11.6 7.4 17.2 28.3
Texas 48327 Menard County 20 11.1 7.0 16.6 26.8
Texas 48329 Midland County 1158 14.6 9.8 20.5 26.1
Texas 48331 Milam County 215 12.6 8.2 18.6 28.3
Texas 48333 Mills County 42 10.6 6.7 15.8 25.8
Texas 48335 Mitchell County 87 13.7 8.9 20.2 29.0
Texas 48337 Montague County 176 12.2 7.7 18.4 26.9
Texas 48339 Montgomery County 2709 10.5 7.3 14.1 24.5
Texas 48341 Moore County 125 10.6 6.9 15.8 28.6
Texas 48343 Morris County 146 16.0 10.6 23.5 29.7

Age-adjusted Diagnosed Diabetes Incidence13:31 Monday, August 6, 2012 23
Year=2007
2007
StateFIPSCode County
Numberof NewCases
Age-adjustedRate per
1000
Age-adjustedLower
ConfidenceLimit
Age-adjustedUpper
ConfidenceLimit
Age-adjustedObesityPercent
Texas 48345 Motley County 12 11.1 7.1 17.2 26.8
Texas 48347 Nacogdoches County 438 11.4 7.8 16.0 28.4
Texas 48349 Navarro County 358 11.2 7.4 16.3 28.9
Texas 48351 Newton County 122 12.6 8.6 18.2 27.4
Texas 48353 Nolan County 121 12.0 7.4 18.6 27.0
Texas 48355 Nueces County 2736 13.4 9.3 19.1 26.3
Texas 48357 Ochiltree County 63 10.5 6.3 16.8 25.6
Texas 48359 Oldham County 15 11.1 6.8 16.7 27.4
Texas 48361 Orange County 648 11.3 7.7 15.7 30.3
Texas 48363 Palo Pinto County 204 10.5 6.6 15.7 29.4
Texas 48365 Panola County 192 11.7 7.5 17.0 28.7
Texas 48367 Parker County 836 11.5 7.9 16.8 28.5
Texas 48369 Parmer County 68 11.3 7.1 17.3 27.4
Texas 48371 Pecos County 128 12.5 8.1 18.2 25.8
Texas 48373 Polk County 431 13.0 8.5 18.2 28.8
Texas 48375 Potter County 860 11.6 8.4 15.9 29.8
Texas 48377 Presidio County 51 10.1 6.4 15.2 25.3
Texas 48379 Rains County 91 11.0 7.1 16.2 27.8
Texas 48381 Randall County 835 11.3 8.0 15.5 24.9
Texas 48383 Reagan County 23 11.5 7.0 17.4 27.1
Texas 48385 Real County 25 10.9 6.5 16.9 25.9
Texas 48387 Red River County 127 13.1 8.7 19.0 27.6
Texas 48389 Reeves County 91 11.9 7.7 18.6 26.9
Texas 48391 Refugio County 62 11.4 7.4 17.3 27.4
Texas 48393 Roberts County 7 11.3 7.1 16.7 26.6
Texas 48395 Robertson County 131 12.2 8.0 17.6 29.3
Texas 48397 Rockwall County 498 11.0 7.1 16.5 26.4
Texas 48399 Runnels County 90 11.7 7.1 17.4 26.6
Texas 48401 Rusk County 431 12.9 8.8 18.2 28.9
Texas 48403 Sabine County 96 11.9 7.6 17.7 27.4
Texas 48405 San Augustine County 80 12.3 8.3 17.8 28.7
Texas 48407 San Jacinto County 213 12.1 7.8 17.6 27.0
Texas 48409 San Patricio County 516 12.0 7.8 17.5 26.9
Texas 48411 San Saba County 45 10.7 6.6 16.3 26.4
Texas 48413 Schleicher County 23 10.9 6.7 17.0 27.0
Texas 48415 Scurry County 112 10.2 6.6 15.2 26.5
Texas 48417 Shackelford County 26 10.7 6.7 16.3 26.2
Texas 48419 Shelby County 217 12.4 8.2 17.7 28.6
Texas 48421 Sherman County 21 10.8 6.7 16.5 25.9
Texas 48423 Smith County 1290 9.7 7.4 12.4 26.8
Texas 48425 Somervell County 62 11.5 7.0 17.7 26.5
Texas 48427 Starr County 375 11.6 7.3 17.4 27.1
Texas 48429 Stephens County 76 11.2 6.8 16.8 27.3
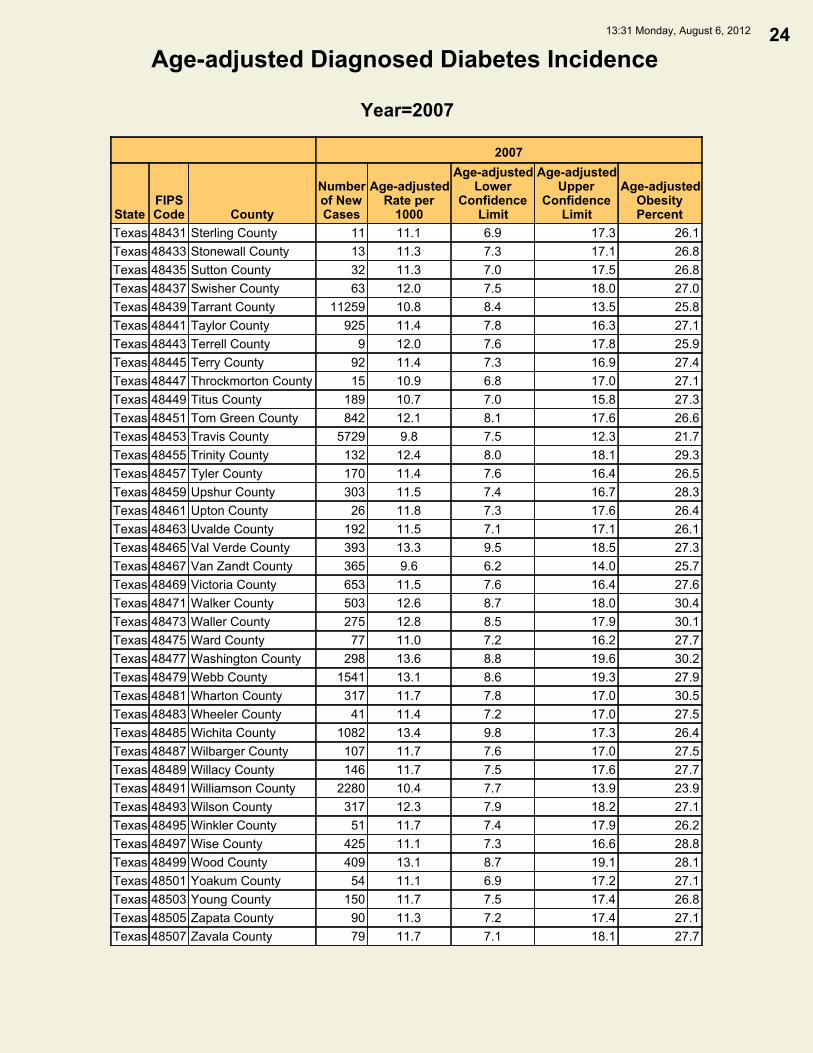
Age-adjusted Diagnosed Diabetes Incidence13:31 Monday, August 6, 2012 24
Year=2007
2007
StateFIPSCode County
Numberof NewCases
Age-adjustedRate per
1000
Age-adjustedLower
ConfidenceLimit
Age-adjustedUpper
ConfidenceLimit
Age-adjustedObesityPercent
Texas 48431 Sterling County 11 11.1 6.9 17.3 26.1
Texas 48433 Stonewall County 13 11.3 7.3 17.1 26.8
Texas 48435 Sutton County 32 11.3 7.0 17.5 26.8
Texas 48437 Swisher County 63 12.0 7.5 18.0 27.0
Texas 48439 Tarrant County 11259 10.8 8.4 13.5 25.8
Texas 48441 Taylor County 925 11.4 7.8 16.3 27.1
Texas 48443 Terrell County 9 12.0 7.6 17.8 25.9
Texas 48445 Terry County 92 11.4 7.3 16.9 27.4
Texas 48447 Throckmorton County 15 10.9 6.8 17.0 27.1
Texas 48449 Titus County 189 10.7 7.0 15.8 27.3
Texas 48451 Tom Green County 842 12.1 8.1 17.6 26.6
Texas 48453 Travis County 5729 9.8 7.5 12.3 21.7
Texas 48455 Trinity County 132 12.4 8.0 18.1 29.3
Texas 48457 Tyler County 170 11.4 7.6 16.4 26.5
Texas 48459 Upshur County 303 11.5 7.4 16.7 28.3
Texas 48461 Upton County 26 11.8 7.3 17.6 26.4
Texas 48463 Uvalde County 192 11.5 7.1 17.1 26.1
Texas 48465 Val Verde County 393 13.3 9.5 18.5 27.3
Texas 48467 Van Zandt County 365 9.6 6.2 14.0 25.7
Texas 48469 Victoria County 653 11.5 7.6 16.4 27.6
Texas 48471 Walker County 503 12.6 8.7 18.0 30.4
Texas 48473 Waller County 275 12.8 8.5 17.9 30.1
Texas 48475 Ward County 77 11.0 7.2 16.2 27.7
Texas 48477 Washington County 298 13.6 8.8 19.6 30.2
Texas 48479 Webb County 1541 13.1 8.6 19.3 27.9
Texas 48481 Wharton County 317 11.7 7.8 17.0 30.5
Texas 48483 Wheeler County 41 11.4 7.2 17.0 27.5
Texas 48485 Wichita County 1082 13.4 9.8 17.3 26.4
Texas 48487 Wilbarger County 107 11.7 7.6 17.0 27.5
Texas 48489 Willacy County 146 11.7 7.5 17.6 27.7
Texas 48491 Williamson County 2280 10.4 7.7 13.9 23.9
Texas 48493 Wilson County 317 12.3 7.9 18.2 27.1
Texas 48495 Winkler County 51 11.7 7.4 17.9 26.2
Texas 48497 Wise County 425 11.1 7.3 16.6 28.8
Texas 48499 Wood County 409 13.1 8.7 19.1 28.1
Texas 48501 Yoakum County 54 11.1 6.9 17.2 27.1
Texas 48503 Young County 150 11.7 7.5 17.4 26.8
Texas 48505 Zapata County 90 11.3 7.2 17.4 27.1
Texas 48507 Zavala County 79 11.7 7.1 18.1 27.7

Age-adjusted Diagnosed Diabetes Incidence13:31 Monday, August 6, 2012 25
Year=2008
2008
StateFIPSCode County
Numberof NewCases
Age-adjustedRate per
1000
Age-adjustedLower
ConfidenceLimit
Age-adjustedUpper
ConfidenceLimit
Age-adjustedObesityPercent
Texas 48001 Anderson County 519 13.7 10.0 18.9 28.4
Texas 48003 Andrews County 92 10.4 6.8 15.3 27.9
Texas 48005 Angelina County 564 10.3 7.3 13.8 30.1
Texas 48007 Aransas County 209 10.8 7.0 16.0 27.5
Texas 48009 Archer County 77 11.7 7.6 17.5 27.5
Texas 48011 Armstrong County 17 10.3 6.5 15.4 28.3
Texas 48013 Atascosa County 301 10.8 7.1 16.2 26.7
Texas 48015 Austin County 199 10.7 7.3 15.6 28.0
Texas 48017 Bailey County 42 10.2 6.5 15.1 28.0
Texas 48019 Bandera County 153 9.9 6.7 14.4 26.3
Texas 48021 Bastrop County 608 12.8 8.7 17.7 29.8
Texas 48023 Baylor County 30 10.4 6.9 15.4 28.1
Texas 48025 Bee County 230 10.9 7.3 16.0 29.1
Texas 48027 Bell County 2271 14.4 10.5 19.0 29.0
Texas 48029 Bexar County 9901 9.9 7.9 12.2 25.5
Texas 48031 Blanco County 63 9.9 6.4 14.7 27.3
Texas 48033 Borden County 5 10.1 6.4 15.0 27.5
Texas 48035 Bosque County 135 10.0 6.5 14.7 26.2
Texas 48037 Bowie County 678 10.7 7.4 14.9 28.7
Texas 48039 Brazoria County 2420 13.1 9.3 17.8 27.9
Texas 48041 Brazos County 1042 10.9 7.6 15.0 26.2
Texas 48043 Brewster County 58 8.9 6.0 12.7 25.7
Texas 48045 Briscoe County 13 11.2 7.1 16.8 27.7
Texas 48047 Brooks County 54 10.4 6.5 15.7 27.0
Texas 48049 Brown County 281 10.4 7.0 15.0 26.0
Texas 48051 Burleson County 137 11.4 7.6 16.8 28.1
Texas 48053 Burnet County 327 9.6 6.5 13.8 27.9
Texas 48055 Caldwell County 261 10.9 7.4 15.6 28.5
Texas 48057 Calhoun County 144 10.3 6.9 15.0 28.0
Texas 48059 Callahan County 102 10.0 6.5 14.6 29.0
Texas 48061 Cameron County 2423 10.9 7.7 14.9 26.7
Texas 48063 Camp County 98 11.9 8.1 17.7 29.1
Texas 48065 Carson County 51 11.0 7.1 16.2 27.8
Texas 48067 Cass County 243 11.1 7.6 15.7 29.5
Texas 48069 Castro County 51 10.6 6.8 15.7 27.3
Texas 48071 Chambers County 213 11.0 7.2 15.8 27.6
Texas 48073 Cherokee County 327 10.1 7.0 14.0 29.7
Texas 48075 Childress County 57 11.2 7.5 15.8 27.8
Texas 48077 Clay County 81 9.8 6.4 14.4 28.6
Texas 48079 Cochran County 22 10.8 7.1 16.2 28.3
Texas 48081 Coke County 29 9.9 6.3 15.0 27.7
Texas 48083 Coleman County 66 9.8 6.5 14.3 26.8
Texas 48085 Collin County 4363 9.4 6.9 12.4 23.1

Age-adjusted Diagnosed Diabetes Incidence13:31 Monday, August 6, 2012 26
Year=2008
2008
StateFIPSCode County
Numberof NewCases
Age-adjustedRate per
1000
Age-adjustedLower
ConfidenceLimit
Age-adjustedUpper
ConfidenceLimit
Age-adjustedObesityPercent
Texas 48087 Collingsworth County 23 10.9 7.2 16.0 28.0
Texas 48089 Colorado County 170 11.5 7.6 16.4 28.6
Texas 48091 Comal County 739 9.8 6.8 13.5 24.6
Texas 48093 Comanche County 107 10.7 6.8 16.1 27.1
Texas 48095 Concho County 29 11.0 7.1 16.7 28.7
Texas 48097 Cooke County 337 13.2 8.5 19.5 28.6
Texas 48099 Coryell County 493 12.1 8.3 16.9 27.8
Texas 48101 Cottle County 15 11.2 7.3 17.1 28.4
Texas 48103 Crane County 30 11.4 7.2 17.0 28.2
Texas 48105 Crockett County 29 10.7 6.8 15.9 28.2
Texas 48107 Crosby County 44 10.6 7.0 15.9 27.5
Texas 48109 Culberson County 19 10.4 6.7 15.5 26.7
Texas 48111 Dallam County 40 10.2 6.6 15.3 27.3
Texas 48113 Dallas County 16847 11.5 9.3 14.3 27.9
Texas 48115 Dawson County 108 11.8 7.7 17.5 28.9
Texas 48117 Deaf Smith County 121 10.7 7.0 16.0 27.5
Texas 48119 Delta County 43 11.0 7.2 16.3 28.3
Texas 48121 Denton County 4439 11.7 8.5 15.6 27.9
Texas 48123 DeWitt County 159 11.1 7.4 16.2 28.5
Texas 48125 Dickens County 20 10.7 6.9 15.8 29.0
Texas 48127 Dimmit County 66 10.6 6.7 15.7 27.7
Texas 48129 Donley County 31 10.6 6.9 15.7 27.5
Texas 48131 Duval County 86 10.5 6.8 15.4 26.7
Texas 48133 Eastland County 143 10.9 7.0 16.2 27.6
Texas 48135 Ector County 925 11.5 8.2 15.6 29.5
Texas 48137 Edwards County 14 10.9 7.0 16.2 27.5
Texas 48139 Ellis County 957 10.4 7.0 14.7 29.2
Texas 48141 El Paso County 4165 9.3 7.0 12.2 23.6
Texas 48143 Erath County 248 11.0 7.1 16.2 27.7
Texas 48145 Falls County 133 11.5 7.8 16.4 29.2
Texas 48147 Fannin County 252 10.6 7.1 15.4 26.5
Texas 48149 Fayette County 189 10.9 7.1 15.9 27.7
Texas 48151 Fisher County 33 10.8 6.8 15.6 27.7
Texas 48153 Floyd County 51 11.3 7.5 16.5 27.8
Texas 48155 Foard County 12 11.2 7.1 16.6 27.2
Texas 48157 Fort Bend County 3175 9.5 7.2 12.0 24.9
Texas 48159 Franklin County 82 10.3 6.7 15.2 27.4
Texas 48161 Freestone County 153 11.6 7.8 16.6 29.5
Texas 48163 Frio County 104 10.2 6.8 14.8 27.2
Texas 48165 Gaines County 96 10.6 7.0 15.4 27.5
Texas 48167 Galveston County 2106 11.0 7.9 14.9 27.2
Texas 48169 Garza County 34 10.8 7.0 16.3 28.5
Texas 48171 Gillespie County 184 9.5 6.1 13.6 26.5

Age-adjusted Diagnosed Diabetes Incidence13:31 Monday, August 6, 2012 27
Year=2008
2008
StateFIPSCode County
Numberof NewCases
Age-adjustedRate per
1000
Age-adjustedLower
ConfidenceLimit
Age-adjustedUpper
ConfidenceLimit
Age-adjustedObesityPercent
Texas 48173 Glasscock County 9 10.5 6.4 15.5 27.1
Texas 48175 Goliad County 56 10.3 6.5 15.1 26.7
Texas 48177 Gonzales County 140 11.0 7.1 16.2 28.3
Texas 48179 Gray County 182 11.7 7.8 17.6 30.3
Texas 48181 Grayson County 814 9.8 6.7 13.9 25.1
Texas 48183 Gregg County 903 11.8 8.6 15.7 29.4
Texas 48185 Grimes County 196 10.8 7.5 15.3 28.9
Texas 48187 Guadalupe County 784 10.3 7.1 14.0 27.9
Texas 48189 Hale County 246 11.3 7.6 16.5 28.0
Texas 48191 Hall County 27 10.9 7.3 15.7 27.9
Texas 48193 Hamilton County 65 10.4 6.8 15.5 27.4
Texas 48195 Hansford County 35 10.1 6.4 15.2 27.1
Texas 48197 Hardeman County 32 10.5 7.0 15.3 27.9
Texas 48199 Hardin County 429 12.2 8.2 17.5 28.3
Texas 48201 Harris County 25371 10.6 8.8 12.6 26.3
Texas 48203 Harrison County 526 12.3 8.8 17.1 29.7
Texas 48205 Hartley County 42 11.8 7.5 17.5 28.3
Texas 48207 Haskell County 46 10.6 6.7 15.9 28.4
Texas 48209 Hays County 817 9.2 6.5 12.9 25.6
Texas 48211 Hemphill County 26 10.6 6.5 16.2 27.0
Texas 48213 Henderson County 613 10.8 7.4 15.1 29.1
Texas 48215 Hidalgo County 4729 12.5 9.3 17.2 28.8
Texas 48217 Hill County 265 10.8 7.2 15.5 29.3
Texas 48219 Hockley County 155 10.8 7.2 15.7 26.9
Texas 48221 Hood County 404 10.8 7.2 15.4 27.1
Texas 48223 Hopkins County 280 12.4 8.3 17.8 29.3
Texas 48225 Houston County 205 12.4 8.6 17.2 29.0
Texas 48227 Howard County 231 10.4 6.9 15.5 29.3
Texas 48229 Hudspeth County 23 10.6 6.8 15.9 26.4
Texas 48231 Hunt County 653 11.8 7.9 16.7 29.8
Texas 48233 Hutchinson County 174 11.5 7.6 17.2 28.3
Texas 48235 Irion County 14 10.7 7.1 15.7 27.3
Texas 48237 Jack County 71 11.4 7.5 17.4 28.0
Texas 48239 Jackson County 122 12.4 7.9 18.6 28.1
Texas 48241 Jasper County 283 11.7 8.0 16.7 30.3
Texas 48243 Jeff Davis County 18 9.7 6.1 14.4 25.2
Texas 48245 Jefferson County 2005 12.4 9.1 16.7 29.7
Texas 48247 Jim Hogg County 37 10.9 6.6 17.1 27.7
Texas 48249 Jim Wells County 274 10.3 6.7 15.9 27.9
Texas 48251 Johnson County 1226 12.5 8.8 17.6 29.3
Texas 48253 Jones County 149 11.2 7.4 16.2 28.4
Texas 48255 Karnes County 114 11.1 7.2 15.7 29.1
Texas 48257 Kaufman County 662 10.6 7.3 14.9 29.9

Age-adjusted Diagnosed Diabetes Incidence13:31 Monday, August 6, 2012 28
Year=2008
2008
StateFIPSCode County
Numberof NewCases
Age-adjustedRate per
1000
Age-adjustedLower
ConfidenceLimit
Age-adjustedUpper
ConfidenceLimit
Age-adjustedObesityPercent
Texas 48259 Kendall County 210 8.8 5.9 12.7 24.8
Texas 48261 Kenedy County 3 10.8 6.9 16.4 27.3
Texas 48263 Kent County 6 10.3 6.5 15.8 27.0
Texas 48265 Kerr County 395 10.5 7.0 15.0 27.2
Texas 48267 Kimble County 35 9.9 6.5 15.1 26.4
Texas 48269 King County 2 10.9 6.8 16.6 27.5
Texas 48271 Kinney County 26 10.1 6.6 15.2 28.0
Texas 48273 Kleberg County 192 10.1 6.7 15.0 27.2
Texas 48275 Knox County 30 11.6 7.7 16.7 28.0
Texas 48277 Lamar County 398 11.7 8.0 16.4 25.7
Texas 48279 Lamb County 99 10.6 7.0 15.3 28.1
Texas 48281 Lampasas County 149 9.9 6.5 14.4 27.2
Texas 48283 La Salle County 39 10.4 6.7 15.3 27.6
Texas 48285 Lavaca County 159 11.2 7.5 16.1 27.4
Texas 48287 Lee County 119 10.4 7.1 14.5 26.9
Texas 48289 Leon County 132 10.6 6.8 15.1 27.9
Texas 48291 Liberty County 563 11.6 8.0 16.7 28.1
Texas 48293 Limestone County 184 12.2 8.5 17.9 28.7
Texas 48295 Lipscomb County 22 10.5 6.8 15.8 26.9
Texas 48297 Live Oak County 87 9.9 6.5 14.8 27.7
Texas 48299 Llano County 164 10.4 6.6 15.3 25.8
Texas 48301 Loving County 0 9.9 6.1 15.0 26.8
Texas 48303 Lubbock County 1606 9.6 7.4 12.4 27.4
Texas 48305 Lynn County 44 10.7 6.8 16.0 27.5
Texas 48307 McCulloch County 65 11.1 7.1 16.6 27.2
Texas 48309 McLennan County 1708 11.8 8.8 15.8 31.4
Texas 48311 McMullen County 7 10.5 6.5 16.2 27.7
Texas 48313 Madison County 106 11.8 8.0 16.9 29.8
Texas 48315 Marion County 97 11.9 8.0 16.9 29.7
Texas 48317 Martin County 30 10.2 6.4 15.0 26.8
Texas 48319 Mason County 32 9.9 6.1 14.9 27.1
Texas 48321 Matagorda County 312 12.6 8.6 18.5 28.3
Texas 48323 Maverick County 339 11.4 7.6 16.7 26.6
Texas 48325 Medina County 311 10.6 7.2 15.2 29.2
Texas 48327 Menard County 19 10.5 6.6 15.9 27.1
Texas 48329 Midland County 797 9.4 6.8 12.5 26.9
Texas 48331 Milam County 210 12.3 8.1 18.1 28.8
Texas 48333 Mills County 38 9.7 6.3 14.3 26.7
Texas 48335 Mitchell County 80 12.6 8.3 18.2 29.5
Texas 48337 Montague County 160 11.1 7.2 16.6 27.4
Texas 48339 Montgomery County 2792 10.3 7.4 14.2 24.7
Texas 48341 Moore County 123 10.3 6.7 15.3 28.7
Texas 48343 Morris County 125 13.7 9.4 19.8 28.9

Age-adjusted Diagnosed Diabetes Incidence13:31 Monday, August 6, 2012 29
Year=2008
2008
StateFIPSCode County
Numberof NewCases
Age-adjustedRate per
1000
Age-adjustedLower
ConfidenceLimit
Age-adjustedUpper
ConfidenceLimit
Age-adjustedObesityPercent
Texas 48345 Motley County 11 10.7 6.8 16.2 27.4
Texas 48347 Nacogdoches County 420 10.8 7.4 15.5 29.5
Texas 48349 Navarro County 347 10.7 7.3 15.1 29.6
Texas 48351 Newton County 115 11.8 8.1 16.8 28.7
Texas 48353 Nolan County 119 11.7 7.6 17.6 28.5
Texas 48355 Nueces County 2633 12.7 9.0 17.4 27.7
Texas 48357 Ochiltree County 59 9.7 6.3 14.4 26.6
Texas 48359 Oldham County 14 10.7 7.0 15.9 27.6
Texas 48361 Orange County 628 10.8 7.6 15.0 29.2
Texas 48363 Palo Pinto County 196 10.1 6.5 15.3 29.7
Texas 48365 Panola County 179 10.8 7.4 15.5 28.2
Texas 48367 Parker County 874 11.6 8.0 16.3 27.1
Texas 48369 Parmer County 65 10.7 6.9 15.9 28.1
Texas 48371 Pecos County 126 12.0 8.0 17.7 26.2
Texas 48373 Polk County 401 12.2 8.4 16.9 30.7
Texas 48375 Potter County 817 11.0 8.0 14.7 31.3
Texas 48377 Presidio County 48 9.4 6.0 14.0 26.4
Texas 48379 Rains County 90 10.8 6.8 16.2 28.1
Texas 48381 Randall County 798 10.6 7.4 14.5 25.7
Texas 48383 Reagan County 22 10.6 6.7 15.7 27.4
Texas 48385 Real County 25 10.9 6.9 16.1 26.6
Texas 48387 Red River County 113 11.6 7.8 17.0 28.1
Texas 48389 Reeves County 90 11.9 7.7 17.4 27.5
Texas 48391 Refugio County 61 11.1 7.3 16.4 28.0
Texas 48393 Roberts County 7 10.7 6.6 16.5 27.4
Texas 48395 Robertson County 128 11.9 7.9 16.5 29.0
Texas 48397 Rockwall County 496 10.3 6.8 14.6 26.9
Texas 48399 Runnels County 88 11.5 7.5 16.6 27.4
Texas 48401 Rusk County 425 12.6 8.9 17.7 28.4
Texas 48403 Sabine County 89 11.3 7.5 16.2 27.8
Texas 48405 San Augustine County 78 12.2 8.2 17.6 29.2
Texas 48407 San Jacinto County 199 11.1 7.3 16.1 27.7
Texas 48409 San Patricio County 508 11.7 7.6 17.2 26.9
Texas 48411 San Saba County 42 10.0 6.3 15.7 27.3
Texas 48413 Schleicher County 22 10.4 6.8 15.2 27.7
Texas 48415 Scurry County 109 10.0 6.4 14.6 27.8
Texas 48417 Shackelford County 24 10.0 6.3 15.7 26.9
Texas 48419 Shelby County 205 11.6 7.7 16.8 29.9
Texas 48421 Sherman County 20 10.2 6.6 15.3 27.0
Texas 48423 Smith County 1281 9.5 7.3 12.1 27.7
Texas 48425 Somervell County 60 10.7 6.7 16.1 27.1
Texas 48427 Starr County 348 10.6 6.9 15.7 27.2
Texas 48429 Stephens County 71 10.4 6.9 14.9 27.7

Age-adjusted Diagnosed Diabetes Incidence13:31 Monday, August 6, 2012 30
Year=2008
2008
StateFIPSCode County
Numberof NewCases
Age-adjustedRate per
1000
Age-adjustedLower
ConfidenceLimit
Age-adjustedUpper
ConfidenceLimit
Age-adjustedObesityPercent
Texas 48431 Sterling County 10 10.2 6.4 15.8 26.8
Texas 48433 Stonewall County 12 10.5 6.8 15.4 27.5
Texas 48435 Sutton County 30 10.4 6.6 15.7 26.9
Texas 48437 Swisher County 59 11.2 7.6 16.7 28.0
Texas 48439 Tarrant County 11201 10.4 8.3 12.9 26.5
Texas 48441 Taylor County 832 10.1 7.1 14.4 28.0
Texas 48443 Terrell County 8 11.3 7.5 16.5 26.0
Texas 48445 Terry County 89 10.9 7.3 15.9 28.1
Texas 48447 Throckmorton County 14 10.2 6.3 15.1 27.1
Texas 48449 Titus County 186 10.3 6.8 14.9 29.2
Texas 48451 Tom Green County 864 12.4 8.4 17.9 27.9
Texas 48453 Travis County 5605 9.2 7.3 11.4 22.7
Texas 48455 Trinity County 120 11.3 7.6 16.1 28.9
Texas 48457 Tyler County 169 11.5 7.8 16.4 27.6
Texas 48459 Upshur County 298 11.1 7.6 15.4 27.6
Texas 48461 Upton County 25 10.7 7.0 15.7 27.0
Texas 48463 Uvalde County 181 10.8 6.9 16.3 27.3
Texas 48465 Val Verde County 365 12.1 8.7 16.5 27.4
Texas 48467 Van Zandt County 376 9.9 6.7 14.2 26.0
Texas 48469 Victoria County 643 11.2 7.5 16.2 28.5
Texas 48471 Walker County 494 12.3 8.6 16.9 31.3
Texas 48473 Waller County 266 12.2 8.2 17.5 30.2
Texas 48475 Ward County 76 10.6 6.8 16.1 28.0
Texas 48477 Washington County 273 12.3 8.3 17.4 30.1
Texas 48479 Webb County 1455 12.1 8.1 17.3 28.2
Texas 48481 Wharton County 328 12.2 8.2 17.4 30.7
Texas 48483 Wheeler County 37 10.4 6.8 15.3 27.4
Texas 48485 Wichita County 1029 12.7 9.6 16.5 27.4
Texas 48487 Wilbarger County 98 10.6 7.1 15.3 28.6
Texas 48489 Willacy County 138 10.9 7.0 16.0 28.0
Texas 48491 Williamson County 2142 9.0 6.9 11.5 24.8
Texas 48493 Wilson County 321 12.0 7.8 17.2 27.1
Texas 48495 Winkler County 50 11.4 7.4 17.1 27.1
Texas 48497 Wise County 402 10.1 6.7 14.6 29.6
Texas 48499 Wood County 375 11.8 7.9 17.0 28.2
Texas 48501 Yoakum County 51 10.3 6.6 15.3 27.1
Texas 48503 Young County 140 10.8 6.9 16.0 28.2
Texas 48505 Zapata County 85 10.4 6.7 15.9 27.7
Texas 48507 Zavala County 73 10.7 6.7 16.0 27.8

Age-adjusted Diagnosed Diabetes Incidence13:31 Monday, August 6, 2012 31
Year=2009
2009
StateFIPSCode County
Numberof NewCases
Age-adjustedRate per
1000
Age-adjustedLower
ConfidenceLimit
Age-adjustedUpper
ConfidenceLimit
Age-adjustedObesityPercent
Texas 48001 Anderson County 484 12.7 8.9 17.5 32.7
Texas 48003 Andrews County 88 10.1 6.4 14.6 29.6
Texas 48005 Angelina County 603 11.0 7.8 14.7 32.1
Texas 48007 Aransas County 203 10.0 6.4 14.6 27.8
Texas 48009 Archer County 76 11.8 8.2 16.7 28.1
Texas 48011 Armstrong County 15 9.9 6.6 14.6 29.0
Texas 48013 Atascosa County 281 9.7 6.5 14.3 29.6
Texas 48015 Austin County 200 10.3 7.0 14.4 29.5
Texas 48017 Bailey County 41 10.3 6.7 15.0 28.8
Texas 48019 Bandera County 178 10.6 7.0 14.8 29.8
Texas 48021 Bastrop County 557 11.0 7.6 15.5 30.8
Texas 48023 Baylor County 30 10.1 6.7 15.0 27.7
Texas 48025 Bee County 238 11.5 7.8 16.7 28.4
Texas 48027 Bell County 1926 11.8 8.6 15.8 28.7
Texas 48029 Bexar County 9792 9.7 7.8 11.8 28.2
Texas 48031 Blanco County 66 9.8 6.3 14.8 28.3
Texas 48033 Borden County 4 10.0 6.5 15.0 28.1
Texas 48035 Bosque County 129 9.4 6.0 13.9 27.4
Texas 48037 Bowie County 719 11.3 7.9 16.0 32.8
Texas 48039 Brazoria County 2233 11.6 8.4 15.6 26.9
Texas 48041 Brazos County 1001 10.3 7.3 14.0 30.2
Texas 48043 Brewster County 61 9.1 6.3 12.7 27.2
Texas 48045 Briscoe County 11 10.0 6.5 14.7 28.5
Texas 48047 Brooks County 49 10.1 6.4 14.9 28.7
Texas 48049 Brown County 279 10.2 7.0 14.6 31.0
Texas 48051 Burleson County 138 11.3 7.5 16.4 32.5
Texas 48053 Burnet County 353 9.7 6.4 14.3 28.5
Texas 48055 Caldwell County 253 10.1 6.8 14.3 32.3
Texas 48057 Calhoun County 143 10.2 6.8 14.9 29.5
Texas 48059 Callahan County 96 9.7 6.4 14.1 30.7
Texas 48061 Cameron County 2165 9.7 7.1 13.5 27.2
Texas 48063 Camp County 101 12.0 7.9 16.9 31.2
Texas 48065 Carson County 47 10.7 6.9 15.7 31.1
Texas 48067 Cass County 249 11.4 7.8 15.9 30.6
Texas 48069 Castro County 49 10.3 6.8 15.3 29.6
Texas 48071 Chambers County 200 9.8 6.5 14.0 28.2
Texas 48073 Cherokee County 386 12.0 8.5 17.0 33.0
Texas 48075 Childress County 57 11.2 7.6 16.2 29.6
Texas 48077 Clay County 84 10.1 6.8 14.3 29.4
Texas 48079 Cochran County 20 10.3 6.9 14.8 30.1
Texas 48081 Coke County 26 9.7 6.5 14.4 31.7
Texas 48083 Coleman County 64 9.5 6.3 13.9 27.7
Texas 48085 Collin County 4055 8.3 6.1 11.0 24.3

Age-adjusted Diagnosed Diabetes Incidence13:31 Monday, August 6, 2012 32
Year=2009
2009
StateFIPSCode County
Numberof NewCases
Age-adjustedRate per
1000
Age-adjustedLower
ConfidenceLimit
Age-adjustedUpper
ConfidenceLimit
Age-adjustedObesityPercent
Texas 48087 Collingsworth County 23 10.4 6.8 15.0 30.0
Texas 48089 Colorado County 160 10.5 6.9 14.7 29.1
Texas 48091 Comal County 789 9.5 6.5 13.4 25.7
Texas 48093 Comanche County 101 9.9 6.4 14.5 28.2
Texas 48095 Concho County 26 10.2 6.4 15.5 30.4
Texas 48097 Cooke County 308 11.7 7.7 17.2 33.0
Texas 48099 Coryell County 518 12.8 8.7 18.2 29.8
Texas 48101 Cottle County 13 10.4 7.0 14.8 29.8
Texas 48103 Crane County 27 10.7 6.9 15.6 29.8
Texas 48105 Crockett County 26 10.0 6.4 14.8 29.9
Texas 48107 Crosby County 42 10.2 6.9 14.7 27.9
Texas 48109 Culberson County 17 10.1 6.6 15.2 28.1
Texas 48111 Dallam County 40 10.3 6.7 15.4 27.4
Texas 48113 Dallas County 16573 11.5 9.1 14.1 30.5
Texas 48115 Dawson County 104 11.6 7.9 16.6 31.1
Texas 48117 Deaf Smith County 108 9.9 6.6 14.4 30.4
Texas 48119 Delta County 43 10.6 7.1 15.5 29.0
Texas 48121 Denton County 4265 10.9 8.0 14.6 29.4
Texas 48123 DeWitt County 153 10.5 7.1 15.2 28.4
Texas 48125 Dickens County 19 10.7 7.0 15.8 30.5
Texas 48127 Dimmit County 65 10.6 6.7 15.7 28.9
Texas 48129 Donley County 29 10.7 7.1 15.9 30.4
Texas 48131 Duval County 82 10.2 6.5 15.2 30.3
Texas 48133 Eastland County 141 10.6 7.0 15.4 29.4
Texas 48135 Ector County 881 11.0 8.2 14.1 32.0
Texas 48137 Edwards County 13 10.2 7.0 14.1 29.3
Texas 48139 Ellis County 956 10.1 6.8 14.0 29.7
Texas 48141 El Paso County 4240 9.6 7.3 12.3 23.7
Texas 48143 Erath County 244 10.7 7.2 15.5 28.0
Texas 48145 Falls County 137 12.0 8.1 17.2 30.6
Texas 48147 Fannin County 253 10.7 7.3 15.2 29.8
Texas 48149 Fayette County 181 9.9 6.3 14.6 29.0
Texas 48151 Fisher County 30 9.8 6.5 14.3 30.5
Texas 48153 Floyd County 50 11.3 7.1 16.3 28.6
Texas 48155 Foard County 12 11.2 7.5 16.4 29.5
Texas 48157 Fort Bend County 3225 9.3 7.4 11.5 25.5
Texas 48159 Franklin County 82 10.2 6.8 14.8 27.2
Texas 48161 Freestone County 147 10.9 7.4 15.2 31.7
Texas 48163 Frio County 101 9.9 6.4 14.5 28.6
Texas 48165 Gaines County 93 10.6 7.1 15.6 30.7
Texas 48167 Galveston County 2034 10.7 7.5 14.2 29.2
Texas 48169 Garza County 32 10.5 6.9 15.1 32.1
Texas 48171 Gillespie County 194 9.4 6.2 14.0 28.0

Age-adjusted Diagnosed Diabetes Incidence13:31 Monday, August 6, 2012 33
Year=2009
2009
StateFIPSCode County
Numberof NewCases
Age-adjustedRate per
1000
Age-adjustedLower
ConfidenceLimit
Age-adjustedUpper
ConfidenceLimit
Age-adjustedObesityPercent
Texas 48173 Glasscock County 9 10.1 6.6 14.7 28.6
Texas 48175 Goliad County 56 10.4 6.9 15.1 29.2
Texas 48177 Gonzales County 143 11.0 7.4 15.9 31.6
Texas 48179 Gray County 182 12.2 8.5 17.1 31.1
Texas 48181 Grayson County 840 9.9 6.8 13.9 26.5
Texas 48183 Gregg County 904 11.7 9.0 14.9 32.3
Texas 48185 Grimes County 201 10.7 7.4 15.6 33.4
Texas 48187 Guadalupe County 755 9.4 6.4 13.2 29.8
Texas 48189 Hale County 217 10.0 6.9 14.3 29.4
Texas 48191 Hall County 25 10.3 6.9 14.7 28.5
Texas 48193 Hamilton County 63 9.8 6.2 14.2 29.3
Texas 48195 Hansford County 35 10.2 6.4 15.7 28.2
Texas 48197 Hardeman County 29 10.0 6.6 14.8 29.8
Texas 48199 Hardin County 442 12.5 8.4 18.2 30.2
Texas 48201 Harris County 23468 9.8 8.1 11.8 28.5
Texas 48203 Harrison County 502 11.6 8.1 15.7 33.9
Texas 48205 Hartley County 38 11.6 7.9 16.9 30.7
Texas 48207 Haskell County 41 10.1 6.6 15.0 29.0
Texas 48209 Hays County 914 9.8 6.6 13.7 29.4
Texas 48211 Hemphill County 22 9.8 6.3 14.6 27.5
Texas 48213 Henderson County 623 10.6 7.4 14.8 25.6
Texas 48215 Hidalgo County 4540 12.0 8.9 15.8 30.0
Texas 48217 Hill County 273 10.8 7.2 15.5 32.8
Texas 48219 Hockley County 143 9.8 6.7 14.2 29.6
Texas 48221 Hood County 406 10.1 6.6 14.5 30.4
Texas 48223 Hopkins County 282 12.0 8.1 17.1 32.7
Texas 48225 Houston County 194 11.8 8.5 16.6 31.0
Texas 48227 Howard County 232 10.6 6.9 15.3 31.5
Texas 48229 Hudspeth County 22 10.2 6.6 14.8 28.2
Texas 48231 Hunt County 679 12.2 8.1 17.6 31.1
Texas 48233 Hutchinson County 150 10.2 6.8 15.0 31.3
Texas 48235 Irion County 13 10.2 6.5 15.5 28.6
Texas 48237 Jack County 67 11.3 7.3 16.5 30.4
Texas 48239 Jackson County 102 10.1 6.6 14.5 30.4
Texas 48241 Jasper County 286 11.8 8.3 16.6 30.1
Texas 48243 Jeff Davis County 19 10.0 6.7 15.1 26.5
Texas 48245 Jefferson County 1949 12.2 8.7 16.8 31.5
Texas 48247 Jim Hogg County 33 10.1 6.4 14.6 29.1
Texas 48249 Jim Wells County 262 10.1 6.6 15.0 31.5
Texas 48251 Johnson County 1205 11.9 8.2 16.6 31.1
Texas 48253 Jones County 148 11.4 7.5 16.6 31.0
Texas 48255 Karnes County 114 11.2 7.5 15.9 30.4
Texas 48257 Kaufman County 676 10.6 7.2 15.4 35.8

Age-adjusted Diagnosed Diabetes Incidence13:31 Monday, August 6, 2012 34
Year=2009
2009
StateFIPSCode County
Numberof NewCases
Age-adjustedRate per
1000
Age-adjustedLower
ConfidenceLimit
Age-adjustedUpper
ConfidenceLimit
Age-adjustedObesityPercent
Texas 48259 Kendall County 226 8.8 6.0 12.5 23.8
Texas 48261 Kenedy County 3 10.2 6.5 15.2 29.2
Texas 48263 Kent County 6 9.9 6.3 15.2 28.9
Texas 48265 Kerr County 413 10.7 7.1 15.6 29.5
Texas 48267 Kimble County 36 9.5 6.1 13.5 27.1
Texas 48269 King County 2 10.1 6.4 15.1 28.5
Texas 48271 Kinney County 26 10.0 6.6 14.7 29.5
Texas 48273 Kleberg County 185 9.9 6.6 14.4 30.0
Texas 48275 Knox County 27 10.9 7.3 15.4 28.2
Texas 48277 Lamar County 367 10.7 7.4 15.4 25.8
Texas 48279 Lamb County 87 9.7 6.4 14.3 31.7
Texas 48281 Lampasas County 144 9.6 6.3 14.0 30.5
Texas 48283 La Salle County 37 10.0 6.5 15.0 29.6
Texas 48285 Lavaca County 144 10.1 6.6 14.4 27.8
Texas 48287 Lee County 122 10.8 7.3 15.6 31.0
Texas 48289 Leon County 147 11.3 7.6 16.0 31.1
Texas 48291 Liberty County 512 10.4 7.0 14.7 30.5
Texas 48293 Limestone County 173 11.2 7.6 15.6 28.6
Texas 48295 Lipscomb County 21 10.0 6.4 14.4 29.0
Texas 48297 Live Oak County 87 10.2 6.6 15.2 28.6
Texas 48299 Llano County 172 10.5 6.9 15.7 27.4
Texas 48301 Loving County 0 9.7 6.1 15.2 28.1
Texas 48303 Lubbock County 1615 9.6 7.6 11.9 27.4
Texas 48305 Lynn County 42 10.9 7.3 15.7 29.4
Texas 48307 McCulloch County 60 10.3 6.5 15.2 28.4
Texas 48309 McLennan County 1534 10.6 7.5 14.2 30.0
Texas 48311 McMullen County 7 10.2 6.7 15.5 29.9
Texas 48313 Madison County 105 11.8 8.1 17.2 31.5
Texas 48315 Marion County 96 11.9 7.8 16.7 30.9
Texas 48317 Martin County 28 9.9 6.3 14.4 29.1
Texas 48319 Mason County 32 9.8 6.4 14.4 27.6
Texas 48321 Matagorda County 278 11.2 7.4 16.2 28.3
Texas 48323 Maverick County 310 10.5 7.2 15.0 29.8
Texas 48325 Medina County 332 10.9 7.2 16.0 29.6
Texas 48327 Menard County 18 10.0 6.2 15.0 30.5
Texas 48329 Midland County 743 8.7 6.6 11.0 26.5
Texas 48331 Milam County 193 11.3 7.6 16.5 32.2
Texas 48333 Mills County 39 9.9 6.4 14.7 29.2
Texas 48335 Mitchell County 74 11.5 7.6 16.3 31.4
Texas 48337 Montague County 149 10.1 6.7 14.8 29.2
Texas 48339 Montgomery County 2788 9.6 7.0 13.0 26.3
Texas 48341 Moore County 121 10.3 6.9 14.8 31.4
Texas 48343 Morris County 111 12.4 8.3 17.7 31.8

Age-adjusted Diagnosed Diabetes Incidence13:31 Monday, August 6, 2012 35
Year=2009
2009
StateFIPSCode County
Numberof NewCases
Age-adjustedRate per
1000
Age-adjustedLower
ConfidenceLimit
Age-adjustedUpper
ConfidenceLimit
Age-adjustedObesityPercent
Texas 48345 Motley County 11 10.2 6.6 14.9 29.1
Texas 48347 Nacogdoches County 414 10.6 7.1 14.8 29.7
Texas 48349 Navarro County 336 10.4 7.1 14.3 32.5
Texas 48351 Newton County 112 11.4 7.6 16.2 31.3
Texas 48353 Nolan County 108 10.7 6.9 15.5 30.4
Texas 48355 Nueces County 2379 11.5 8.0 15.9 30.2
Texas 48357 Ochiltree County 57 9.6 6.0 14.4 28.5
Texas 48359 Oldham County 13 10.4 6.6 15.4 30.3
Texas 48361 Orange County 644 11.5 7.8 16.4 29.7
Texas 48363 Palo Pinto County 208 10.8 7.2 15.9 29.6
Texas 48365 Panola County 183 11.1 7.6 16.2 30.2
Texas 48367 Parker County 917 11.8 7.9 16.9 31.2
Texas 48369 Parmer County 59 9.9 6.6 14.6 30.7
Texas 48371 Pecos County 106 10.3 7.2 14.5 29.4
Texas 48373 Polk County 396 11.0 7.5 15.5 32.8
Texas 48375 Potter County 839 11.1 8.3 14.3 33.9
Texas 48377 Presidio County 47 9.4 6.0 13.5 24.8
Texas 48379 Rains County 92 10.4 6.7 15.6 30.1
Texas 48381 Randall County 775 10.3 7.7 13.5 25.8
Texas 48383 Reagan County 19 10.1 6.6 14.8 28.6
Texas 48385 Real County 26 10.5 6.8 15.8 29.4
Texas 48387 Red River County 111 11.5 7.9 16.7 31.3
Texas 48389 Reeves County 79 11.0 7.5 16.1 30.4
Texas 48391 Refugio County 56 10.4 7.0 15.1 29.3
Texas 48393 Roberts County 6 10.0 6.4 15.2 28.5
Texas 48395 Robertson County 125 11.5 7.8 16.4 31.6
Texas 48397 Rockwall County 487 9.6 6.5 13.6 26.5
Texas 48399 Runnels County 77 10.2 6.3 14.8 34.0
Texas 48401 Rusk County 386 11.3 8.2 16.1 31.4
Texas 48403 Sabine County 86 10.0 6.5 14.6 31.3
Texas 48405 San Augustine County 78 11.8 8.1 16.9 30.4
Texas 48407 San Jacinto County 201 10.8 7.1 16.0 29.7
Texas 48409 San Patricio County 505 11.5 7.5 16.5 29.6
Texas 48411 San Saba County 44 10.3 6.7 15.6 29.3
Texas 48413 Schleicher County 19 9.9 6.5 14.5 29.4
Texas 48415 Scurry County 104 9.6 6.3 13.8 29.2
Texas 48417 Shackelford County 22 9.9 6.5 14.6 28.4
Texas 48419 Shelby County 199 11.3 7.5 16.1 32.6
Texas 48421 Sherman County 19 10.0 6.4 15.1 29.2
Texas 48423 Smith County 1293 9.4 7.5 11.7 28.5
Texas 48425 Somervell County 57 10.1 6.7 15.0 28.7
Texas 48427 Starr County 322 9.8 6.3 14.8 29.2
Texas 48429 Stephens County 66 9.7 6.6 14.2 28.3

Age-adjusted Diagnosed Diabetes Incidence13:31 Monday, August 6, 2012 36
Year=2009
2009
StateFIPSCode County
Numberof NewCases
Age-adjustedRate per
1000
Age-adjustedLower
ConfidenceLimit
Age-adjustedUpper
ConfidenceLimit
Age-adjustedObesityPercent
Texas 48431 Sterling County 9 9.8 6.2 14.6 28.8
Texas 48433 Stonewall County 11 10.4 6.8 15.7 29.2
Texas 48435 Sutton County 28 9.7 6.3 14.5 28.1
Texas 48437 Swisher County 53 10.6 6.9 15.4 29.4
Texas 48439 Tarrant County 10813 9.9 7.9 12.4 27.6
Texas 48441 Taylor County 851 10.3 7.0 14.5 28.6
Texas 48443 Terrell County 7 9.8 6.3 14.4 26.7
Texas 48445 Terry County 87 11.0 7.5 15.7 30.5
Texas 48447 Throckmorton County 13 10.0 6.4 15.3 29.4
Texas 48449 Titus County 184 10.2 6.7 14.8 33.0
Texas 48451 Tom Green County 757 10.6 7.3 14.8 29.5
Texas 48453 Travis County 5513 8.9 7.2 10.9 24.7
Texas 48455 Trinity County 123 11.3 7.6 15.9 32.3
Texas 48457 Tyler County 170 11.4 7.9 16.6 28.7
Texas 48459 Upshur County 317 12.0 8.1 17.2 30.4
Texas 48461 Upton County 21 10.0 6.5 14.7 28.9
Texas 48463 Uvalde County 181 10.6 6.8 15.7 30.0
Texas 48465 Val Verde County 310 10.2 7.5 13.5 29.2
Texas 48467 Van Zandt County 417 11.0 7.4 15.8 29.4
Texas 48469 Victoria County 613 10.6 7.1 15.0 30.4
Texas 48471 Walker County 460 11.3 7.6 15.9 32.5
Texas 48473 Waller County 251 11.1 7.6 15.6 31.4
Texas 48475 Ward County 69 10.3 6.6 15.0 28.6
Texas 48477 Washington County 241 10.1 6.8 14.8 29.2
Texas 48479 Webb County 1294 10.6 7.5 14.9 29.2
Texas 48481 Wharton County 305 11.2 7.8 16.0 30.5
Texas 48483 Wheeler County 37 10.6 6.9 15.8 29.4
Texas 48485 Wichita County 1011 12.5 9.8 15.9 31.1
Texas 48487 Wilbarger County 96 10.6 7.0 14.9 30.4
Texas 48489 Willacy County 128 10.3 6.7 15.2 29.5
Texas 48491 Williamson County 2088 8.2 6.1 10.3 26.8
Texas 48493 Wilson County 313 11.2 7.3 16.3 29.3
Texas 48495 Winkler County 47 11.0 7.4 16.3 30.8
Texas 48497 Wise County 401 9.9 6.7 14.3 31.3
Texas 48499 Wood County 360 10.5 7.0 15.3 30.1
Texas 48501 Yoakum County 45 9.8 6.5 14.3 29.9
Texas 48503 Young County 145 11.3 7.7 16.2 29.9
Texas 48505 Zapata County 74 9.1 6.0 13.3 30.2
Texas 48507 Zavala County 70 10.1 6.4 15.2 29.6