appendix a: definitions for cancer incidence data diagnosed in minnesota residents, ... 155.2 ....
TRANSCRIPT

Appendices
App
endi
x A
: Def
initi
ons
for C
ance
r Inc
iden
ce D
ata
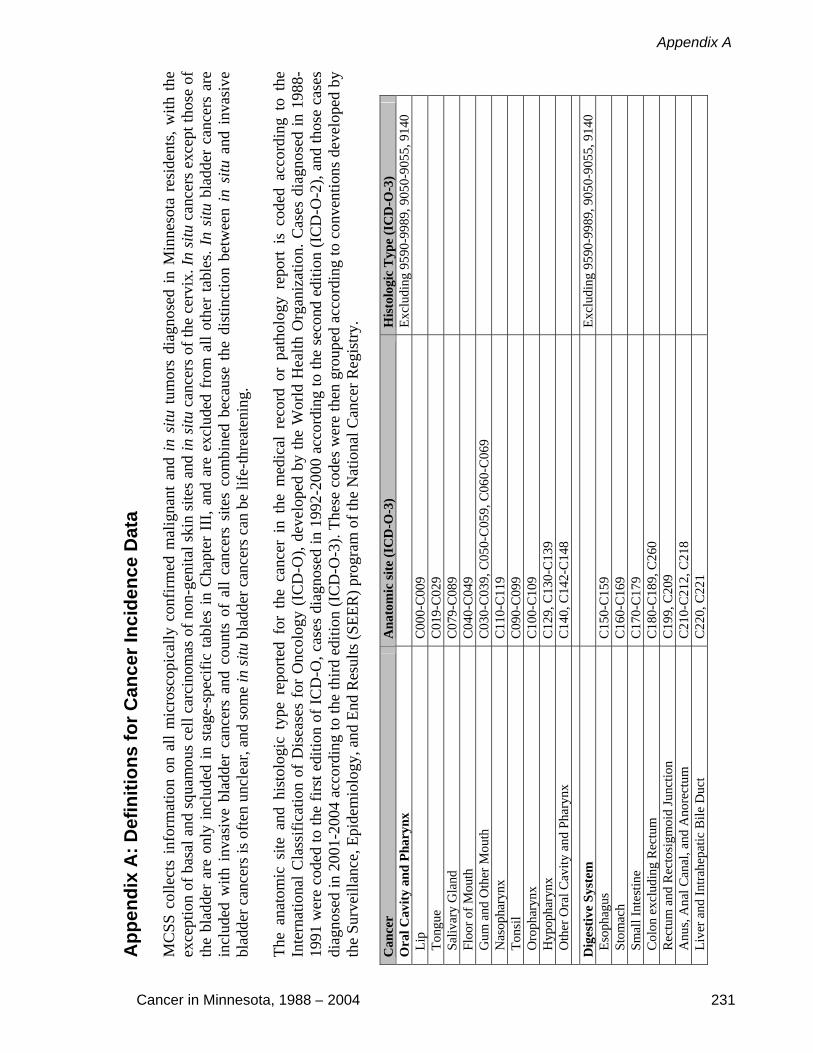
MC
SS c
olle
cts
info
rmat
ion
on a
ll m
icro
scop
ical
ly c
onfir
med
mal
igna
nt a
nd in
situ
tum
ors
diag
nose
d in
Min
neso
ta r
esid
ents
, with
the
exce
ptio
n of
bas
al a
nd s
quam
ous
cell
carc
inom
as o
f non
-gen
ital s
kin
site
s an
d in
situ
can
cers
of t
he c
ervi
x. In
situ
can
cers
exc
ept t
hose
of
the
blad
der
are
only
incl
uded
in s
tage
-spe
cific
tabl
es in
Cha
pter
III
, and
are
exc
lude
d fr
om a
ll ot
her
tabl
es. I
n si
tu b
ladd
er c
ance
rs a
re
incl
uded
with
inv
asiv
e bl
adde
r ca
ncer
s an
d co
unts
of
all
canc
ers
site
s co
mbi
ned
beca
use
the
dist
inct
ion
betw
een
in s
itu a
nd i
nvas
ive
blad
der c
ance
rs is
ofte
n un
clea
r, an
d so
me
in si
tu b
ladd
er c
ance
rs c
an b
e lif
e-th
reat
enin
g.
The
anat
omic
site
and
his
tolo
gic
type
rep
orte
d fo
r th
e ca
ncer
in
the
med
ical
rec
ord
or p
atho
logy
rep
ort
is c
oded
acc
ordi
ng t
o th
e In
tern
atio
nal C
lass
ifica
tion
of D
isea
ses
for
Onc
olog
y (I
CD
-O),
deve
lope
d by
the
Wor
ld H
ealth
Org
aniz
atio
n. C
ases
dia
gnos
ed in
198
8-19
91 w
ere
code
d to
the
first
edi
tion
of IC
D-O
, cas
es d
iagn
osed
in 1
992-
2000
acc
ordi
ng to
the
seco
nd e
ditio
n (I
CD
-O-2
), an
d th
ose
case
s di
agno
sed
in 2
001-
2004
acc
ordi
ng to
the
third
edi
tion
(IC
D-O
-3).
Thes
e co
des
wer
e th
en g
roup
ed a
ccor
ding
to c
onve
ntio
ns d
evel
oped
by
the
Surv
eilla
nce,
Epi
dem
iolo
gy, a
nd E
nd R
esul
ts (S
EER
) pro
gram
of t
he N
atio
nal C
ance
r Reg
istry
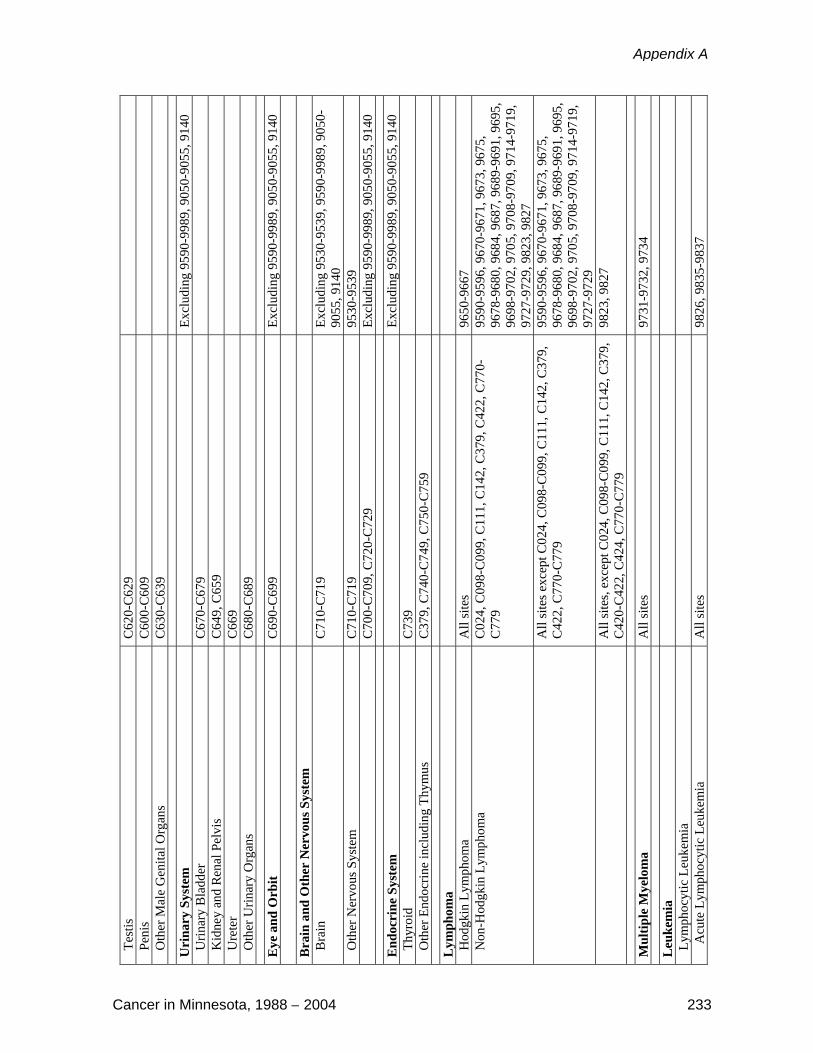
. C
ance
r A
nato
mic
site
(IC
D-O
-3)
His
tolo
gic
Typ
e (I
CD
-O-3
) O
ral C
avity
and
Pha
rynx
Excl
udin
g 95
90-9
989,
905
0-90
55, 9
140
Lip
C
000-
C00
9
Ton
gue
C01
9-C
029
S
aliv
ary
Gla
nd
C07
9-C
089
F
loor
of M
outh
C
040-
C04
9
Gum
and
Oth
er M
outh
C
030-
C03
9, C
050-
C05
9, C
060-
C06
9
Nas
opha
rynx
C
110-
C11
9
Ton
sil
C09
0-C
099
O
roph
aryn
x C
100-
C10
9
Hyp
opha
rynx
C
129,
C13
0-C
139
O
ther
Ora
l Cav
ity a
nd P
hary
nx
C14
0, C
142-
C14
8
Dig
estiv
e Sy
stem
Excl
udin
g 95
90-9
989,
905
0-90
55, 9
140
Eso
phag
us
C15
0-C
159
S
tom
ach
C16
0-C
169
S
mal
l Int
estin
e C
170-
C17
9
Col
on e
xclu
ding
Rec
tum
C
180-
C18
9, C
260
R
ectu
m a
nd R
ecto
sigm
oid
Junc
tion
C19
9, C
209
A
nus,
Ana
l Can
al, a
nd A
nore
ctum
C
210-
C21
2, C
218
L
iver
and
Intra
hepa
tic B
ile D
uct
C22
0, C
221
Cancer in Minnesota, 1988 – 2004 231
Appendix A

Gal
lbla
dder
C
239
O
ther
Bili
ary
C24
0-C
249
P
ancr
eas
C25
0-C
259
R
etro
perit
oneu
m
C48
0
Per
itone
um, O
men
tum
, and
Mes
ente
ry
C48
1-C
482
O
ther
Dig
estiv
e O
rgan
s C
268-
C26
9, C
488
Res
pira
tory
Sys
tem
Excl
udin
g 95
90-9
989,
905
0-90
55, 9
140
Nos
e, N
asal
Cav
ity a
nd M
iddl
e Ea
r C
300-
C30
1, C
310-
C31
9
Lar
ynx
C32
0-C
329
L
ung
and
Bro
nchu
s C
340-
C34
9
Ple
ura
C38
4
Tra
chea
, Med
iast
inum
and
Oth
er
Res
pira
tory
Org
ans
C33
9, C
381-
C38
3, C
388,
C39
0, C
398,
C39
9
Mes
othe
liom
a A
ll si
tes
9050
-905
5
Bon
es a
nd J
oint
s C
400-
C41
9 Ex
clud
ing
9590
-998
9, 9
050-
9055
, 914
0
Soft
Tis
sue
incl
udin
g H
eart
C
380,
C47
0-C
479,
C49
0-C
499
Excl
udin
g 95
90-9
989,
905
0-90
55, 9
140
Skin
exc
ludi
ng B
asal
and
Squ
amou
s
M
elan
oma
of th
e Sk
in
C44
0-C
449
8720
– 8
790
Oth
er N
on-E
pith
elia
l Ski
n C
440-
C44
9 Ex
clud
ing
8000
-800
5, 8
010-
8045
, 805
0-80
84, 8
090-
8110
, 872
0-87
90, 9
590-
9989
, 90
50-9
055,
914
0
Kap
osi S
arco
ma
All
site
s 91
40
Bre
ast
C50
0-C
509
Excl
udin
g 95
90-9
989,
905
0-90
55, 9
140
Fem
ale
Gen
ital S
yste
m
Ex
clud
ing
9590
-998
9, 9
050-
9055
, 914
0 C
ervi
x U
teri
C53
0-C
539
C
orpu
s and
Ute
rus,
NO
S C
540-
C54
9, C
559
O
vary
C
569
V
agin
a C
529
V
ulva
C
510-
C51
9
Oth
er F
emal
e G
enita
l Org
ans
C57
0-C
589
Mal
e G
enita
l Sys
tem
Excl
udin
g 95
90-9
989,
905
0-90
55, 9
140
Pro
stat
e C
619
Incidence Data Definitions
232 Cancer in Minnesota, 1988 – 2004
Tes
tis
C62
0-C
629
P
enis
C
600-
C60
9
Oth
er M
ale
Gen
ital O
rgan
s C
630-
C63
9
Uri
nary
Sys
tem
Excl
udin
g 95
90-9
989,
905
0-90
55, 9
140
Urin
ary
Bla
dder
C
670-
C67
9
Kid
ney
and
Ren
al P
elvi
s C
649,
C65
9
Ure
ter
C66
9
Oth
er U
rinar
y O
rgan
s C
680-
C68
9
Eye
and
Orb
it C
690-
C69
9 Ex
clud
ing
9590
-998
9, 9
050-
9055
, 914
0
Bra
in a
nd O
ther
Ner
vous
Sys
tem
B
rain
C
710-
C71
9 Ex
clud
ing
9530
-953
9, 9
590-
9989
, 905
0-90
55, 9
140
Oth
er N
ervo
us S
yste
m
C71
0-C
719
9530
-953
9
C70
0-C
709,
C72
0-C
729
Excl
udin
g 95
90-9
989,
905
0-90
55, 9
140
End
ocri
ne S
yste
m
Ex
clud
ing
9590
-998
9, 9
050-
9055
, 914
0 T
hyro
id
C73
9
Oth
er E
ndoc
rine
incl
udin
g Th
ymus
C
379,
C74
0-C
749,
C75
0-C
759
Lym
phom
a
H
odgk
in L
ymph
oma
All
site
s 96
50-9
667
Non
-Hod
gkin
Lym
phom
a C
024,
C09
8-C
099,
C11
1, C
142,
C37
9, C
422,
C77
0-C
779
9590
-959
6, 9
670-
9671
, 967
3, 9
675,
96
78-9
680,
968
4, 9
687,
968
9-96
91, 9
695,
96
98-9
702,
970
5, 9
708-
9709
, 971
4-97
19,
9727
-972
9, 9
823,
982
7
All
site
s exc
ept C
024,
C09
8-C
099,
C11
1, C
142,
C37
9,
C42
2, C
770-
C77
9 95
90-9
596,
967
0-96
71, 9
673,
967
5,
9678
-968
0, 9
684,
968
7, 9
689-
9691
, 969
5,
9698
-970
2, 9
705,
970
8-97
09, 9
714-
9719
, 97
27-9
729
A
ll si
tes,
exce
pt C
024,
C09
8-C
099,
C11
1, C
142,
C37
9,
C42
0-C
422,
C42
4, C
770-
C77
9 98
23, 9
827
Mul
tiple
Mye
lom
a A
ll si
tes
9731
-973
2, 9
734
Leu
kem
ia
Lym
phoc
ytic
Leu
kem
ia
A
cute
Lym
phoc
ytic
Leu
kem
ia
All
site
s 98
26, 9
835-
9837
Cancer in Minnesota, 1988 – 2004 233
Appendix A
C
hron
ic L
ymph
ocyt
ic L
euke
mia
C
420-
C42
1, C
424
9823
Oth
er L
ymph
ocyt
ic L
euke
mia
A
ll si
tes
9820
, 983
2-98
34, 9
940
Mye
loid
and
Mon
ocyt
ic L
euke
mia
Acu
te M
yelo
id L
euke
mia
A
ll si
tes
9840
, 986
1, 9
866,
986
7, 9
871-
9874
, 98
95-9
897,
991
0, 9
920
A
cute
Mon
ocyt
ic L
euke
mia
A
ll si
tes
9891
Chr
onic
Mye
loid
Leu
kem
ia
All
site
s 98
63, 9
875,
987
6, 9
945,
994
6
Oth
er M
yelo
id/M
onoc
ytic
Leu
kem
ia
All
site
s 98
60, 9
930
Oth
er L
euke
mia
Oth
er A
cute
Leu
kem
ia
All
site
s 98
01, 9
805,
993
1
Ale
ukem
ic, S
uble
ukem
ic a
nd N
OS
All
site
s 97
33, 9
742,
980
0, 9
831,
987
0, 9
948,
99
63, 9
964
C
420-
C42
1,C
424
9827
Mis
cella
neou
s A
ll si
tes
9740
-974
1, 9
750-
9758
, 976
0-97
69, 9
950,
99
60-9
962,
997
0, 9
975,
998
0, 9
982-
9987
, 99
89
C
420-
C42
4, C
760-
C76
8, C
770-
C77
9, C
809
Excl
udin
g 95
90-9
989,
905
0-90
55, 9
140
234 Cancer in Minnesota, 1988 – 2004
Incidence Data Definitions
App
endi
x B
: Def
initi
ons
for C
ance
r Mor
talit
y D
ata
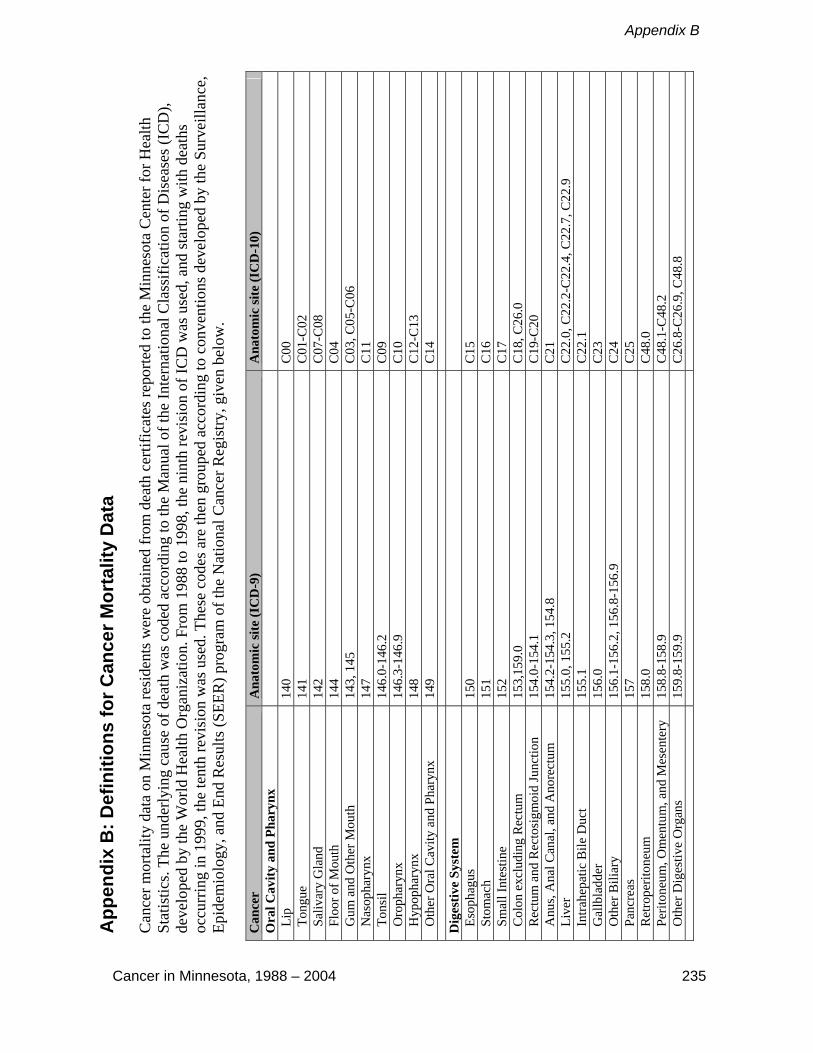
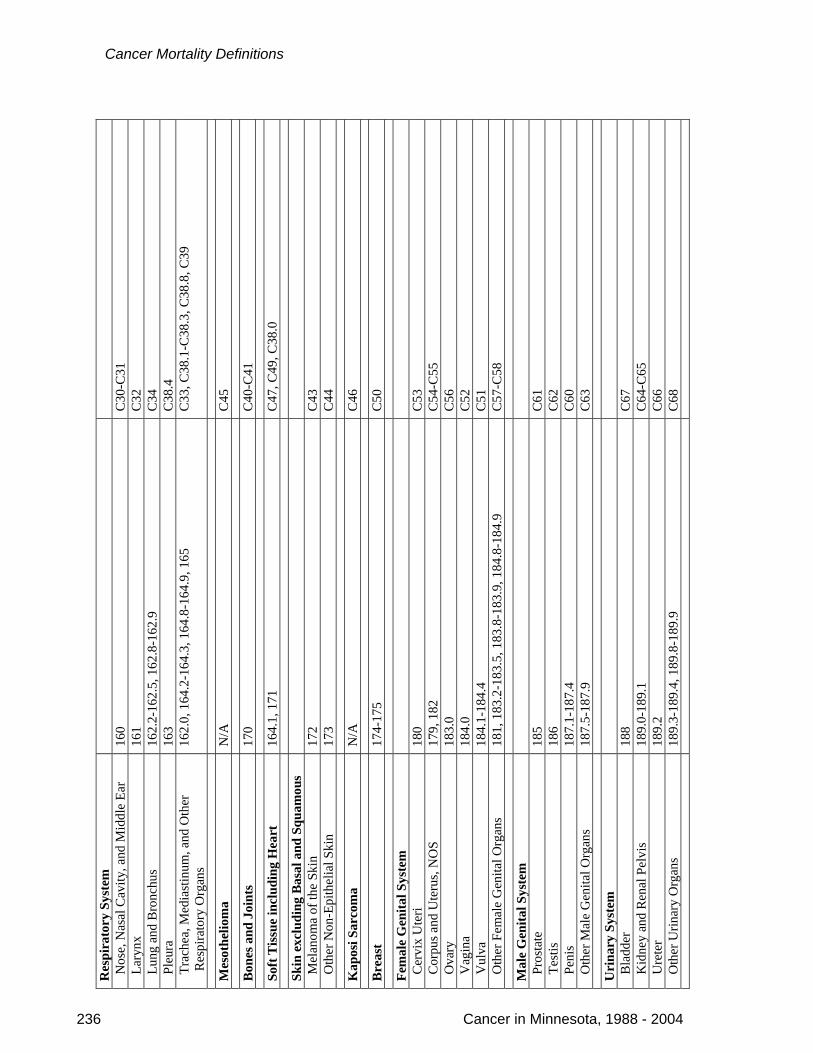
Can
cer m
orta
lity
data
on
Min
neso
ta re
side
nts w
ere
obta
ined
from
dea
th c
ertif
icat
es re
porte
d to
the
Min
neso
ta C
ente
r for
Hea
lth
Stat
istic
s. Th
e un
derly
ing
caus
e of
dea
th w
as c
oded
acc
ordi
ng to
the
Man
ual o
f the
Inte
rnat
iona
l Cla
ssifi
catio
n of
Dis
ease
s (IC
D),
deve
lope
d by
the
Wor
ld H
ealth
Org
aniz
atio
n. F
rom
198
8 to
199
8, th
e ni
nth
revi
sion
of I
CD
was
use
d, a
nd st
artin
g w
ith d
eath
s oc
curr
ing
in 1
999,
the
tent
h re
visi
on w
as u
sed.
The
se c
odes
are
then
gro
uped
acc
ordi
ng to
con
vent
ions
dev
elop
ed b
y th
e Su
rvei
llanc
e,
Epid
emio
logy
, and
End
Res
ults
(SEE
R) p
rogr
am o
f the
Nat
iona
l Can
cer R
egis
try, g
iven
bel
ow.
Can
cer
Ana
tom
ic si
te (I
CD
-9)
Ana
tom
ic si
te (I
CD
-10)
O
ral C
avity
and
Pha
rynx
L
ip
140
C00
T
ongu
e 14
1 C
01-C
02
Sal
ivar
y G
land
14
2 C
07-C
08
Flo
or o
f Mou
th
144
C04
G
um a
nd O
ther
Mou
th
143,
145
C
03, C
05-C
06
Nas
opha
rynx
14
7 C
11
Ton
sil
146.
0-14
6.2
C09
O
roph
aryn
x 14
6.3-
146.
9 C
10
Hyp
opha
rynx
14
8 C
12-C
13
Oth
er O
ral C
avity
and
Pha
rynx
14
9 C
14
Dig
estiv
e Sy
stem
E
soph
agus
15
0 C
15
Sto
mac
h 15
1 C
16
Sm
all I
ntes
tine
152
C17
C
olon
exc
ludi
ng R
ectu
m
153,
159.
0 C
18, C
26.0
R
ectu
m a
nd R
ecto
sigm
oid
Junc
tion
154.
0-15
4.1
C19
-C20
A
nus,
Ana
l Can
al, a
nd A
nore
ctum
15
4.2-
154.
3, 1
54.8
C
21
Liv
er
155.
0, 1
55.2
C
22.0
, C22
.2-C
22.4
, C22
.7, C
22.9
I
ntra
hepa
tic B
ile D
uct
155.
1 C
22.1
G
allb
ladd
er
156.
0 C
23
Oth
er B
iliar
y 15
6.1-
156.
2, 1
56.8
-156
.9
C24
P
ancr
eas
157
C25
R
etro
perit
oneu
m
158.
0 C
48.0
P
erito
neum
, Om
entu
m, a
nd M
esen
tery
15
8.8-
158.
9 C
48.1
-C48
.2
Oth
er D
iges
tive
Org
ans
159.
8-15
9.9
C26
.8-C
26.9
, C48
.8
Cancer in Minnesota, 1988 – 2004 235
Appendix B
Res
pira
tory
Sys
tem
N
ose,
Nas
al C
avity
, and
Mid
dle
Ear
160
C30
-C31
L
aryn
x 16
1 C
32
Lun
g an
d B
ronc
hus
162.
2-16
2.5,
162
.8-1
62.9
C
34
Ple
ura
163
C38
.4
Tra
chea
, Med
iast
inum
, and
Oth
er
R
espi
rato
ry O
rgan
s
162.
0, 1
64.2
-164
.3, 1
64.8
-164
.9, 1
65
C33
, C38
.1-C
38.3
, C38
.8, C
39
Mes
othe
liom
a N
/A
C45
Bon
es a
nd J
oint
s 17
0 C
40-C
41
Soft
Tis
sue
incl
udin
g H
eart
16
4.1,
171
C
47, C
49, C
38.0
Skin
exc
ludi
ng B
asal
and
Squ
amou
s
M
elan
oma
of th
e Sk
in
172
C43
O
ther
Non
-Epi
thel
ial S
kin
173
C44
Kap
osi S
arco
ma
N/A
C
46
Bre
ast
174-
175
C50
Fem
ale
Gen
ital S
yste
m
Cer
vix
Ute
ri 18
0 C
53
Cor
pus a
nd U
teru
s, N
OS
179,
182
C
54-C
55
Ova
ry
183.
0 C
56
Vag
ina
184.
0 C
52
Vul
va
184.
1-18
4.4
C51
O
ther
Fem
ale
Gen
ital O
rgan
s 18
1, 1
83.2
-183
.5, 1
83.8
-183
.9, 1
84.8
-184
.9
C57
-C58
Mal
e G
enita
l Sys
tem
P
rost
ate
185
C61
T
estis
18
6 C
62
Pen
is
187.
1-18
7.4
C60
O
ther
Mal
e G
enita
l Org
ans
187.
5-18
7.9
C63
Uri
nary
Sys
tem
B
ladd
er
188
C67
K
idne
y an
d R
enal
Pel
vis
189.
0-18
9.1
C64
-C65
U
rete
r 18
9.2
C66
O
ther
Urin
ary
Org
ans
189.
3-18
9.4,
189
.8-1
89.9
C
68
236 Cancer in Minnesota, 1988 - 2004
Cancer Mortality Definitions

Eye
and
Orb
it 19
0 C
69
B
rain
and
Oth
er N
ervo
us S
yste
m
191,
192
C
70, C
71, C
72
End
ocri
ne S
yste
m
Thy
roid
19
3 C
73
Oth
er E
ndoc
rine,
incl
udin
g Th
ymus
16
4.0,
194
C
37, C
74-C
75
Lym
phom
a
H
odgk
in L
ymph
oma
201
C81
N
on-H
odgk
in L
ymph
oma
200,
202
.0-2
02.2
, 202
.8-2
02.9
C
82-C
85, C
96.3
Mul
tiple
Mye
lom
a 20
3.0,
238
.6
C90
.0, C
90.2
Leu
kem
ia
Lym
phoc
ytic
Leu
kem
ia
A
cute
Lym
phoc
ytic
Leu
kem
ia
204.
0 C
91.0
Chr
onic
Lym
phoc
ytic
Leu
kem
ia
204.
1 C
91.1
Oth
er L
ymph
ocyt
ic L
euke
mia
20
2.4,
204
.2, 2
04.8
-204
.9
C91
.2-C
91.4
, C91
.7, C
91.9
M
yelo
id a
nd M
onoc
ytic
Leu
kem
ia
A
cute
Mye
loid
Leu
kem
ia
205.
0, 2
07.0
, 207
.2
C92
.0, C
92.4
-C92
.5, C
94.0
, C94
.2
A
cute
Mon
ocyt
ic L
euke
mia
20
6.0
C93
.0
C
hron
ic M
yelo
id L
euke
mia
20
5.1
C92
.1
O
ther
Mye
loid
/Mon
ocyt
ic L
euke
mia
20
5.2-
205.
3, 2
05.8
-205
.9, 2
06.1
-206
.2, 2
06.8
-206
.9
C92
.2-C
92.3
, C92
.7, C
92.9
, C93
.1-C
93.2
, C93
.7,
C93
.9
Oth
er L
euke
mia
Oth
er A
cute
Leu
kem
ia
208.
0 C
94.4
, C94
.5, C
95.0
Ale
ukem
ic, S
uble
ukem
ic a
nd N
OS
203.
1, 2
07.1
, 207
.8, 2
08.1
-208
.2, 2
08.8
-208
.9
C90
.1, C
91.5
, C94
.1, C
94.3
, C94
.7, C
95.1
, C95
.2,
C95
.7, C
95.9
Mis
cella
neou
s 15
9.1,
195
-199
, 202
.3, 2
02.5
-202
.6, 2
03.8
C
26.1
, C76
-C80
, C88
, C96
.0-C
96.2
, C96
.7, C
96.9
, C
97
Appendix B
Cancer in Minnesota, 1988 – 2004 237
Appendix C
App
endi
x C
: Def
initi
on o
f Min
neso
ta R
egio
ns
Cancer in Minnesota, 1988 – 2004 239
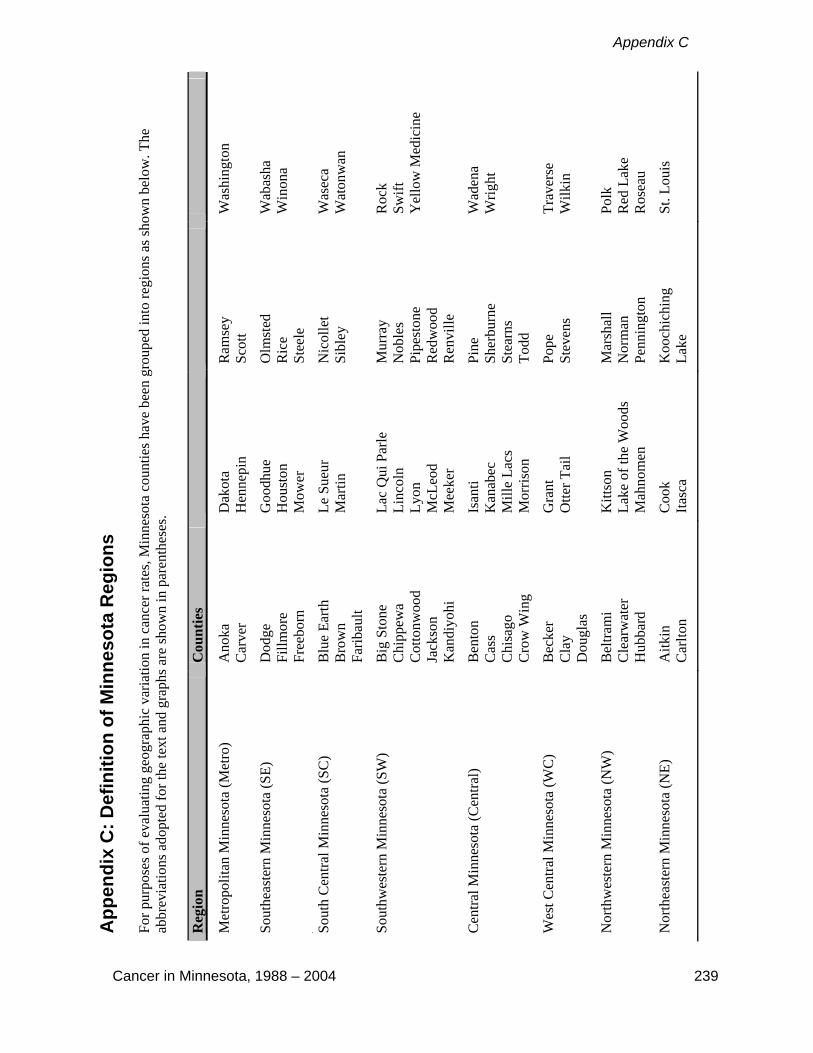
For p
urpo
ses o
f eva
luat
ing
geog
raph
ic v
aria
tion
in c
ance
r rat
es, M
inne
sota
cou
ntie
s hav
e be
en g
roup
ed in
to re
gion
s as s
how
n be
low
. The
ab
brev
iatio
ns a
dopt
ed fo
r the
text
and
gra
phs a
re sh
own
in p
aren
thes
es.
Reg
ion
Cou
ntie
s
Met
ropo
litan
Min
neso
ta (M
etro
) A
noka
C
arve
r D
akot
a H
enne
pin
Ram
sey
Scot
t W
ashi
ngto
n
Sout
heas
tern
Min
neso
ta (S
E)
Dod
ge
Fillm
ore
Free
born
Goo
dhue
H
oust
on
Mow
er
Olm
sted
R
ice
Stee
le
Wab
asha
W
inon
a
.
Sout
h C
entra
l Min
neso
ta (S
C)
Blu
e Ea
rth
Bro
wn
Farib
ault
Le S
ueur
M
artin
N
icol
let
Sibl
ey
Was
eca
Wat
onw
an
Sout
hwes
tern
Min
neso
ta (S
W)
Big
Sto
ne
Chi
ppew
a C
otto
nwoo
d Ja
ckso
n K
andi
yohi
Lac
Qui
Par
le
Linc
oln
Lyon
M
cLeo
d M
eeke
r
Mur
ray
Nob
les
Pipe
ston
e R
edw
ood
Ren
ville
Roc
k Sw
ift
Yel
low
Med
icin
e
Cen
tral M
inne
sota
(Cen
tral)
Ben
ton
Cas
s C
hisa
go
Cro
w W
ing
Isan
ti K
anab
ec
Mill
e La
cs
Mor
rison
Pine
Sh
erbu
rne
Stea
rns
Todd
Wad
ena
Wrig
ht
Wes
t Cen
tral M
inne
sota
(WC
) B
ecke
r C
lay
Dou
glas
Gra
nt
Otte
r Tai
l Po
pe
Stev
ens
Trav
erse
W
ilkin
Nor
thw
este
rn M
inne
sota
(NW
) B
eltra
mi
Cle
arw
ater
H
ubba
rd
Kitt
son
Lake
of t
he W
oods
M
ahno
men
Mar
shal
l N
orm
an
Penn
ingt
on
Polk
R
ed L
ake
Ros
eau
Nor
thea
ster
n M
inne
sota
(NE)
A
itkin
C
arlto
n C
ook
Itasc
a K
ooch
ichi
ng
Lake
St
. Lou
is

Appendix D
Appendix D: Glossary Age-Adjusted Rate: A rate that has been adjusted to control for differences in age distribution between populations. It is a weighted average of age-specific rates, with the proportion of individuals in the corresponding age groups of the standard population functioning as the weights. All age-adjusted rates in this report are age-adjusted to the 2000 U.S. population and are expressed per 100,000 persons. Age-Specific Rate: The rate of occurrence of a cancer for a specific age group (the number of cancers occurring during a specified period of time in a particular age group divided by the total number of individuals in the age group and time period). Annual Percent Change (APC): The average percent change in the age-adjusted rate each year over a specified period of time. See also Appendix E. Artifact: Any artificial product. In epidemiology, any observation that has been introduced by the methods used for data collection or data analysis. Benign: A tumor or abnormal cell growth that is not malignant and unlikely to metastasize. Cancer: A group of diseases characterized by rapid, uncontrolled cell growth, with a tendency to spread throughout the body. Cancer Incidence: The number of new cases of cancer diagnosed during a specified period of time. Cancer Incidence Rate: The rate at which newly diagnosed cancers occur in a population (the number of cancers occurring in a defined period of time divided by the total number of people in the population during that period of time). Cancer Mortality: The number of deaths due to cancer during a specified period of time, regardless of when the disease was diagnosed. Cancer Mortality Rate: The rate at which cancer-related deaths occur in a population (the number of deaths occurring in a defined period of time divided by the total number of people in the population during that period of time). Cancer Registry: An ongoing system for the registration and follow-up of patients who develop cancer.
Hospital-Based Cancer Registry: A cancer registry that uses hospital records as the primary data source for identification of cases.
Pathology-Based Cancer Registry: A cancer registry that uses pathology laboratory records as the primary data source for identification of cases.
Population-Based Cancer Registry: A cancer registry that attempts to collect information on at least 95 percent of the incident cancers occurring in the individuals residing within a defined geopolitical region. The MCSS is a population-based cancer registry.
Carcinoma: A malignant tumor of epithelial origin. Case-Control Study: A study in which individuals with a particular condition such as cancer (referred to as cases) are selected for comparison with individuals in whom the condition is absent (controls). Cases and controls are compared with respect to past exposures, risk factors, or attributes thought to be relevant to the development of the condition under study.
Cancer in Minnesota, 1988 - 2004 241
Glossary
CDC: Centers for Disease Control and Prevention. Clinical Diagnosis: Cancers that are not histologically confirmed, but are instead diagnosed through other means—for example, through imaging procedures such as CT scans. The MCSS does not collect information on cancers that are only clinically diagnosed and have no microscopic confirmation. Cumulative Lifetime Risk of Cancer: As calculated in this report, this is the estimated percentage of newborns in Minnesota in 2000-2002 who would be diagnosed with cancer over their entire lifetime, if cancer incidence and mortality and all-cause mortality rates do not change from those in 2000-2002. See also Appendix E. Death Clearance: A quality control activity that links the MCSS database of incident cancers with Minnesota cancer-related death certificates. Any death certificates that do not have a corresponding match in the MCSS database indicate a cancer that may have been missed. MCSS staff members follow up on each of these cases to see if the cancer should have been included in the database. Epidemiology: The study of health conditions (e.g., cancers, injuries, etc.) by looking for patterns of occurrence by time, place, or person in the hopes of finding causes or identifying control measures for the condition. Etiology: The study or theory of the causation of any disease; the sum of knowledge regarding causes. Expected Number of Cases: The number of cases (of a cancer) expected in a given population in a given time period if the incident rates for that cancer were the same as the rates in a comparison population, adjusting for age differences of the two populations. Five-year Relative Survival: The estimated proportion of persons who will be alive five years following diagnosis, after adjusting for expected mortality from other causes. Histology: The type of tissue in which a tumor originated, e.g., glandular tissue, connective tissue, etc. ICD-9 and ICD-10: The ninth and tenth revisions of the International Classification of Diseases used to code and classify underlying cause of death. ICD-O-FT, ICD-O-2 and ICD-O-3: The 1987 Field Trial, second and third revisions of the International Classifications of Diseases for Oncology used to code and classify anatomic site and histologic type of cancer cases. Invasive: The tendency of a tumor to spread to adjacent healthy tissues. Technically, “invasive” means the carcinoma has penetrated the basement membranes and is close to blood vessels. Malignant: Tending to become progressively worse, to spread, and invade other tissues. MCHS: Minnesota Center for Health Statistics. MCSS: Minnesota Cancer Surveillance System. MDH: Minnesota Department of Health.
242 Cancer in Minnesota, 1988 - 2004
Appendix D
Median Age: As calculated in this report, the midpoint of the age distribution of group of persons diagnosed with or dying of cancer during the 3-year period 2000-2002; that is, the age at which 50 percent of cases or deaths are younger and 50 percent are older. Microscopic Confirmation: A tumor of which at least a piece has been examined microscopically and diagnosed by a pathologist or other specialist. NAACCR: North American Association of Central Cancer Registries. NPCR: National Program of Cancer Registries. Observed Number of Cases: The actual (also called crude) number of cases of a cancer recorded for a given population for a given period of time. Pathology: The branch of medicine that studies the essential nature of disease, especially the structural changes in tissues or organs associated with disease. Prevalence: The number of people alive on a certain date who have been diagnosed with cancer at any time in their lives. Prevalence considers both newly diagnosed and previously diagnosed cancers. Primary Site (cancer site): The place in the body where the cancer first arose. Quality Control: The steps taken to avoid making errors and to find and correct errors before the data are added to the master database. Record Linkage: The process of comparing two records from different sources, deciding if the records correspond to the same individual or entity, and then taking some action based on that decision. Risk Factor: An attribute or exposure that is associated with an increased probability of developing a condition or disease, but does not necessarily imply cause and effect. SEER (Surveillance, Epidemiology, and End Results): An ongoing, population-based cancer surveillance system sponsored by the National Cancer Institute that monitors cancer incidence, treatment, and follow-up in nine or thirteen U.S. regions comprising approximately 10 or 14 percent of the U.S. population depending on which years of data are examined. Since a cancer registry covering the entire U.S. does not exist, cancer incidence data from SEER are widely cited as national data. Stage at diagnosis: The extent to which the cancer has spread at the time of diagnosis. Two well-known staging systems include the General Summary Stage system, developed for the SEER Program, and the TNM staging system, developed by the American Joint Committee on Cancer. For this report, the following terms describing cancer stage are used:
In situ: earliest stage of cancer development in which the tumor has not infiltrated the tissue of the organ in which they are growing;
Localized: tumor has invaded the tissue of the organ, but has not spread beyond the organ in which the tumor originated;
Regional: tumor has spread beyond the organ in which the tumor originated to adjacent lymph nodes or tissues;
Distant: most advanced stage of cancer development in which the tumor has spread, or metastasized, beyond the organ in which the tumor originated to organs in other parts of the body;
Unknown: unstaged tumors due to insufficient information recorded in the medical record to determine the extent of the tumor at the time of diagnosis.
Cancer in Minnesota, 1988 - 2004 243

Glossary
244 Cancer in Minnesota, 1988 - 2004
Surveillance: The systematic collection, analysis, and interpretation of data pertaining to the occurrence of specific diseases (in this report, cancer).
Active Surveillance: The reporters of disease are contacted at regular intervals and specifically asked about the occurrence of the disease under surveillance. This is considered the most ideal and complete form of surveillance.
Passive Surveillance: Reporting of the disease in question is initiated by the reporting source. Tumor: A mass resulting from the abnormal growth of cells. Tumors may either be benign (with little tendency to spread throughout the body) or malignant (with a tendency to spread throughout the body). Malignant tumors are synonymous with cancer. Underlying Cause of Death: The disease or injury that initiated events resulting in death.

Appendix E
Appendix E: Statistical Methods Age-Adjusted Rates Age-adjusted rates were calculated using the Surveillance Research Program, National Cancer Institute SEER*Stat software (http://seer.cancer.gov/seerstat/index.html) version 6.4.4. Cases diagnosed with histology defined as a “borderline malignancy” under ICD-O-2 coding rules and “invasive” under ICD-O-3 were not included under data for All Cancer Sites Combined or Miscellaneous cancers. These histologies (9950, 9960-9962, and 9980-9989) are miscellaneous myeloproliferative and lymphoproliferative disorders and myelodysplastic syndromes; they accounted for a total of 1,631 diagnoses over the four-year period 2001-2004.
Standard Population
2000 U.S. Standard Million Population Age group
(years) Population
0 13,818 1-4 55,317 5-9 72,533
10-14 73,032 15-19 72,169 20-24 66,478 25-29 64,529 30-34 71,044 35-39 80,762 40-44 81,851 45-49 72,118 50-54 62,716 55-59 48,454 60-64 38,793 65-69 34,264 70-74 31,773 75-79 26,999 80-84 17,842 85+ 15,508
Trends/Annual Percent Change All Minnesota trends were calculated using the Surveillance Research Program, National Cancer Institute Joinpoint Regression Program (http://srab.cancer.gov/joinpoint) version 3.3, with a maximum of three joinpoints (i.e. four line segments). Joinpoint takes annual age-adjusted cancer rates and their standard errors and identifies points in time where trends change direction and calculates the Annual Percent Change (APC) during the intervals between these points, called a segment. Only the APC for the segment ending in 2004 is presented.
Cancer in Minnesota, 1988 – 2004 245

Statistical Methods
246 Cancer in Minnesota, 1988 - 2004
Cumulative Lifetime Risk Cumulative lifetime risk was calculated using DevCan (http://srab.cancer.gov/devcan) version 6.3.0, using site-, sex-, and age-specific incidence, cancer mortality and all cause mortality in Minnesota for 2002-2004. It represents the estimated percentage of newborns in Minnesota in 2002-2004 who would develop cancer during their lifetimes, if cancer incidence and mortality rates and all cause mortality rates in the state do not change from those in 2002-2004. Statistical Significance Statistical significance was determined at the p = 0.05 level using methods incorporated into SEER*Stat software programs. Prevalence MCSS cannot directly calculate prevalence for Minnesota because MCSS has only registered cancers in Minnesota since 1988 and does not have complete follow-up information on the vital status of the individual. To estimate Minnesota cancer prevalence, the age-, sex- and site-specific cancer prevalence percents (5-year and 29-year) for the white population in the nine regions participating in the SEER Program since 1975 were calculated in limited duration prevalence sessions in SEER*Stat version 6.4.4 for all sites combined and the most common cancers. Prevalence percents were multiplied by the corresponding age- and sex-specific population estimates for Minnesota on January 1, 2004, obtained by averaging estimates for the mid-year of 2003 and 2004 obtained from SEER. To adjust for generally lower cancer rates in Minnesota, the resulting numbers were multiplied by age-, sex- and site-specific rate ratios for cancer incidence in Minnesota and in the SEER 9 Region white population during 2000-2004. Age-specific estimates were summed for site and sex totals and rounded to the nearest ten persons. The prevalence estimates for males and females were summed to estimate prevalence for both sexes combined. Completeness indexes for SEER 9 whites were estimated in CanPrev (http://srab.cancer.gov/canprev) and applied to the 29-year estimates for complete prevalence. The prevalence data presented here are estimates, not actual counts of Minnesotans living with cancer. Adjusting the prevalence percents for the white population in the nine SEER regions by known differences in cancer incidence between Minnesota and SEER decreased cancer prevalence estimates for Minnesota. This is appropriate given that overall cancer incidence has historically been lower in Minnesota than in the geographic areas participating in the SEER program. However, other factors affecting cancer prevalence could not be adjusted for. If Minnesotans have higher cancer survival rates than the SEER 9 Region white population, our prevalence estimates will be too low. MCSS is not yet able to calculate cancer survival rates for Minnesotans because of incomplete follow-up information. However, given the recognized high quality of health care in Minnesota, higher survival rates in Minnesota may occur. Similarly, Minnesotans have a higher life expectancy than many other states, due in part to having the lowest heart disease mortality rate in the nation. Since Minnesotans live longer and therefore have more “opportunity” to develop cancer, these prevalence estimates may be too low. It is therefore likely that the prevalence estimates presented here represent the lower limits of actual prevalence.