1 acoustic characterization of 41 cooper square … characterization of 41 cooper square ... the...
TRANSCRIPT

1
Acoustic Characterization of 41 Cooper SquareAcademic Spaces
Jacob Fern
Abstract—The acoustics of Cooper Union’s new academicbuilding were tested for two different acoustical parameters:reverberation time and ambient sound levels. These mea-surements were compared with ANSI/ASA S12.60-2010.Based on the overall ambient sound pressure level and rever-beration time measurements, Cooper Union’s new academicbuilding does not meet ANSI standards for academic acous-tical characteristics. Although most rooms were just belowthe maximum limit for reverberation times of 0.7 seconds,almost every room that was tested failed to fall below theANSI standard for the ambient sound levels of the room.In many cases, this was due to external noise from the city,and in almost all cases, the HVAC system seemed to be atfault.
I. Background
A. Sound Level Measurement
The intensity of sound can be quantified by measuringthe pressure of the sound wave, commonly measured inPascals. A microphone is an instrument which converts achanging sound pressure into a voltage. This voltage canthen be read by a sound level meter, computer, or otherdevice which then displays the voltage as a sound pressure.The sensitivity of a microphone is commonly expressed inunits of mV/Pa, which describes the voltage output of themicrophone compared with the pressure of the sound wave.
Sound levels are often measured with the units of deci-bels (abbreviated dB). The decibel is a logarithmic scale,which works well for sound measurements, since our earsalso sense sound logarithmically. To convert a sound pres-sure into logarithmic scale, the following equation is used:
SPL = 20 log10
(prms
pref
)(1)
where prms is the root mean square pressure (measuredin Pascals), pref is a reference pressure of 20× 10−6 Pa(roughly equal to the faintest sound that the average hu-man can hear), and SPL is the resulting Sound PressureLevel, expressed in decibels.
Human hears are not equally sensitive to all frequencies.Generally, most people cannot hear frequencies lower than20 Hz, or higher than 20 kHz. Weighting schemes havebeen developed which attempt to correct sound pressurelevel measurements to account for the variable sensitiv-ity to different frequencies. The most common weightingscheme is the A-weighting. Because we are not as sen-sitive to low frequency noises, these frequencies have alower weighting, while the most sensitive frequencies (inthe 2 kHz range) are weighted higher. This weightingscheme was developed to more accurately represent the
A. The Cooper Union for the Advancement of Science and Art:Department of Mechanical Engineering. [email protected]
way that we actually hear different frequencies, althoughit is a very simplified version. Figure 1 shows the standardA-weighting curve1.
Fig. 1. A-Weighting Curve
The chart shows how to adjust sound pressure level mea-surements according to frequency. If, for example, a 100Hz tone was measured to have a sound pressure level of60 dB (unweighted), then the A-weighted sound pressurewould be:
SPLA = 60− 19 = 41dBA
Often, when referencing standards for maximum allowablesound pressure levels on job sites or in schools, the value isexpressed as an A-weighted measurement. Other weightingschemes (such as B, C, and D weighting) also exist; how-ever, they are generally for specific industries, and are gen-erally not commonly used for standard room acoustics. Forexample, D-weighting was specifically designed for mea-suring aircraft, and has frequency adjustments specificallydesigned for jet engines.
A.1 Octave Band Levels
Sounds can be broken up into different frequency bands.One common method of dividing frequency bands is into“octave bands”. An octave band consists of a range offrequencies surrounding a center frequency, fc. The limitsof the band can be calculated using the following equations:
flow =fc√
2
andfhigh = fc ×
√2
1 Everest, F. Alton; Pohlmann, Ken C. “Master Handbook ofAcoustics.” 5th ed. 2009: McGraw Hill. pp. 30-31

2
Commonly, center frequencies begin at 31.5 Hz, and eachsuccessive center frequency is equal to twice the previouscenter frequency. When plotted on a logarithmic scale,the center frequencies will be equally spaced. Octave bandlevels are often split further into third octave bands, whichsplit the octave bands into three sub-bands.
B. Reverberation Time
A key measure of the sound quality of a room is thereverberation time of the room. The reverberation time(expressed in seconds) is the amount of time that it takesa sound to decay by 60dB on an unweighted scale. For thisreason, the reverberation time is often abbreviated as T60.
SPL
Time
60 dB
Reverb. Time
Sound Stopped
Ambient SPL
Fig. 2. Non-ideal Reverberation Time Measurement
Because of equipment limitations, it is not always possi-ble to measure time it takes for a sound to decay by exactly60dB. If the background sound level of the room is approx-imately 60dB, then the sound would have to be 120 dB inorder to decay by a full 60dB,which would be roughly asloud as an air raid siren. If measuring in an indoor space,this is obviously not practical. Therefore, it is commonto measure a smaller drop (30-50dB), and extrapolate theslope of the decay to determine how long it would havetaken to decay by a full 60dB, as shown in Figure 2.
High reverberation times can be desirable in some situ-ations, such as music performance. In this case, reverber-ation adds fullness to the music, and can make the perfor-mance sound better. Often, reverberation times of largeconcert venues can be as high as 1.5-2.5 seconds2. Foracademic spaces, however, reverberation should be keptto a minimum. Longer reverberation times make it farmore difficult to understand speech, and can be detrimen-tal to learning. ANSI S12.60 recommends that reverbera-tion times in academic core learning spaces be no longerthan 0.7 seconds. Furthermore, it states that any academicspace should have the ability to reduce reverberation timesto 0.35 seconds, if necessary.
2 ibid. p. 378
II. Testing Methods and Procedure
A. Ambient Sound Pressure Level Measurement
Ambient sound pressure levels were measured with bothA and C weightings. This was achieved using LabViewsoftware with the Sound and Vibration Suite. A micro-phone was placed near the center of the room, away fromany reflective objects such as walls or desks. The A andC weighted sound pressure level was recorded for ten sec-onds, and the average value of that period was recorded.The sound pressure level was recorded with a sample rateof 51.2 kHz, to effectively capture the entire audible fre-quency range. A schematic of the setup is shown in Figure3.
B&K Type 4189 Free
Field Microphone
Computer with
LabView
NI 9233 Analog to
Digital Converter
Fig. 3. Ambient Sound Pressure Level Measurement Setup
Sound pressure levels were recorded with A and Cweightings to compare with the standards set by ANSI S12-60, which states that core learning spaces with a volume ofless than 20,000 ft3 should not have ambient sound pres-sure levels which exceed 35dBA (55dBC), and core learn-ing spaces with a volume of greater than 20,000 ft3 shouldnot have ambient sound pressure levels exceeding 40dBA(60dBC).
B. Reverberation Time
The reverberation time of various rooms was measuredusing two different methods. The first method used an im-pulse sound source, and the decay of the impulse was mea-sured. The second method used a sustained white-noisesignal. The signal was suddenly stopped, and the decaytime was measured. Both methods used a combination ofMatlab and LabView to perform the measurements.
B.1 Impulse Measurement
The easiest method of measuring the reverberation timeof a room is using the impulse method. With this method,an impulse sound source is introduced, and the decay timeof the impulse is measured. To be effective, the impulseshould be very loud (greater than 120dB), and should con-tain a broad spectrum of frequencies. Ideally, the impulsesource would contain all audible frequencies; however, thisis rarely possible with common sources. Common impulse

ACOUSTIC CHARACTERIZATION OF 41 COOPER SQUARE 3
sources include gunshots, large capacitor discharges, andballoon pops. For convenience and safety, balloons wereused as impulse sources for this experiment.
During the testing process, a microphone was set up inthe center of the room, away from any tables or walls (toreduce the effects of direct reverberations). A LabView VIwas used to record the sound pressure level at a samplerate of 51.2 kHz. Two different sized balloons were usedduring the testing procedure: a small water balloon witha 5” diameter, and a standard sized “party” balloon withan 11” diameter.
After recording the sound pressure from the balloon pop,custom Matlab scripts were used to convert the sound pres-sure to an instantaneous sound pressure level. The peakvalue of the sound pressure level was identified, and a lin-ear regression was automatically fit to the decay. Sinceall measurements were less than 60dB above the ambientsound pressure level of the room, the regression line wasextrapolated to calculate the final reverberation time ofthe room. This procedure was repeated using a smallerballoon, so that the two values could be compared.
B.2 White Noise Measurement
Although the impulse method of measuring reverbera-tion time is the easiest, it is extremely difficult to excite allaudible frequencies equally. Generally, only a small rangeof frequencies are excited. Although this may be accept-able for a rough estimation of the reverberation time, itdoes not fully characterize the performance of the room.
To excite a broader range of frequencies, white noise canbe used instead of an impulse source. With this method,white noise is played loudly, and is allowed to fill the roomwith noise. Ideally, the sound would be loud enough thatthe sound pressure level would be the same regardless ofwhere the measurement was taken. This situation is knownas a diffuse sound field, and is ideal for reverberation timesmeasurements. After the sound filed has become diffuse,the noise is suddenly stopped, and the decay is measured.
A microphone was setup in the center of the room, anda pair of studio monitors were placed on one side of theroom. Matlab was used to generate a white noise signalat a frequency of 48 kHz, which ensured that all audiblefrequencies would be excited. The noise was generatedwhile simultaneously recording the sound pressure in theroom using LabView. After a period of 5 seconds, thewhite noise was stopped, and the decay was recorded. Thesetup was similar to the schematic shown in Figure 3
After recording the decay with LabView, the data wasimported into Matlab, where the decay was automaticallyidentified, and a line was fit to the curve. The maximumsound pressure level achieved using this method was ap-proximately 95dB, with an ambient sound pressure levelof approximately 65dB. Since the sound pressure level wasnot 60dB above ambient, the slope was automatically ex-trapolated to calculate the reverberation time.
B.3 Octave Band White Noise Measurement
White noise reverberation time measurement ensuresthat all frequencies are excited; however, it does not in-dicate which frequencies are contributing the most to thereverberation in the room. To find this information, an oc-tave band reverberation time measurement was performed.Although the general setup was the same as previous rever-beration time measurements, instead of playing pure whitenoise, octave filters were applied to the noise. Each set offiltered noise was played individually, and the reverbera-tion time for each octave band was recorded.
The octave band filter set was generated using Matlab,as shown in Figure B.3, such that the upper cutoff fre-quency of the first band intersected the lower cutoff fre-quency of the second band at -3dB. This was done fora total of 9 center frequencies, covering the entire audi-ble spectrum. White noise, generated at a sample rateof 48kHz was filtered through each octave band. Eachband was played individually, and the reverberation timewas recorded. This process was repeated ten times, andan average reverberation time for each octave band wasrecorded.
Fig. 4. Octave Band Filter Bank
Because the original white noise signal was filtered somany times, the resulting octave band signals had far loweroverall acoustic power. Therefore, larger speakers werenecessary to produce high enough sound levels to accu-rately measure the reverberation time. Rather than us-ing the Mackie HR824 Studio Monitors, which were usedfor previous white noise experiments, larger JBL MP418Sspeakers and a Crown XLS402 power amplifier was used.Because of the large size of the speakers, amplifiers andother equipment, the procedure was only performed in theacoustics lab.

4
C. Software
Extensive Matlab scripts were written to help with thedata acquisition and analysis process. The goal was toprovide a set of scripts that would allow any user to per-form acoustic tests with little or no knowledge of Matlab.For additional information about the Matlab scripts, thefollowing commands can be used:
>> help balloon_pop_analysis>> help octave_band_reverb_time
III. Results and Discussion
A. Ambient Sound Pressure Level
The ambient sound pressure level of various classrooms,laboratories, study spaces, and common areas is shown inFigure 5.
Fig. 5. Ambient Sound Pressure Level of Various Rooms [dB]
From this information, it is clear that almost none ofCooper Unions core academic spaces or ancillary spacesconform with the ANSI standard for ambient sound pres-sure levels. For many of these rooms, especially those witha large number of windows, the ambient sound pressurelevel was heavily influenced by noise from the outside.These recordings were take late at night, when traffic isrelatively light; however, in the middle of a day, soundlevels may rise considerably.
Another significant source of noise was the HVAC sys-tem. This noise tends to be quite variable, and the ambientsound can change by as much as 10-15 dBA with the cyclesof the HVAC. For example: room 504 (which had the low-est ambient sound pressure level) did not have any HVACturned on during the measurement. All other rooms did,which caused the ambient sound pressure level to rise.
Finally, although all rooms were tested without anyother people present in the room, students’ activities inother rooms were clearly audible, and influenced the av-erage sound pressure levels. Music and speech could beclearly heard through the walls, indicating that improper
attention was given to sound transmission during the de-sign of the building.
There are two possible methods of lowering the ambientsound pressure level: add absorptive materials on the in-side of the room, or reflective materials on the outside ofthe room. The first method would not reduce the amountof noise that gets into the room; however, it would reducethe reverberations of that noise, reducing the amount oftime the sound stays in the room, and also the overall am-bient sound pressure level. This method would also reducethe reverberation time of the room, if necessary.
The second method would tend to reflect any soundsfrom outside of the room back at the source, reducing theamount of noise that ever reaches the room. Althougheffective, it may be difficult to do this approach, since thebuilding has already been constructed. Furthermore, thismethod would not help reduce reverberation times in theroom.
B. Reverberation Time
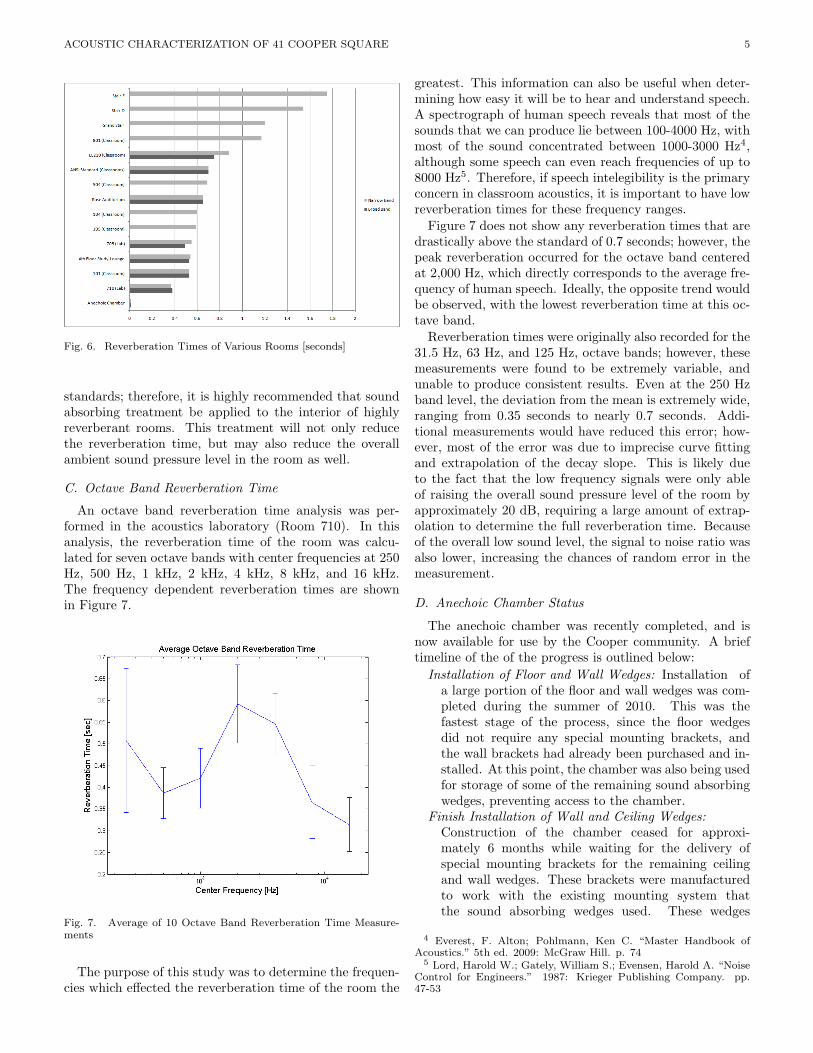
The reverberation times of various room and commonareas was measured using the impulse method. A balloonwas used as the impact source. Often, two different sizeballoons were used. This is due to the different frequencycomponents of the impulse of each source. Larger balloonsgenerally have a wider range of frequency components,while smaller balloons have smaller ranges. Furthermore,larger balloons have higher total acoustical energy, and areable to produce louder impulses3, which made them suit-able for larger spaces (such as the Grand Stiarcase and theRose Auditorium).
The reverberation times various rooms in the buildingare shown in Figure 6, where “Broad Band” excitationcorresponds to the large balloon pops, and “narrow band”excitation corresponds to the smaller balloon pops. Morenarrow band measurements were taken, since smaller bal-loons were more readily available.
Figure 6 shows that although most core learning spacesfall within ANSI standards for reverberation time (withthe exception of rooms LL210 and 801), most rooms areon the upper end of the standard, and are nearly be-yond the acceptable maximum reverberation time. Therooms which were beyond ANSI standards could be con-sidered non-standard classrooms (although they are stillcommonly used as core learning spaces).
Room 801 is officially considered a conference room, andhas glass windows covering approximately 50% of the walls.Since glass is much harder than drywall, it reflects soundsmuch more, leading to an increased reverberation time.Room LL210 also had higher than recommended reverber-ation times. Again, this may have been due to the floor toceiling windows on one of the walls of the classroom.
Reduction of reverberation time is a key component inspeech intelligibility, and therefore, academic success. Itis essential that reverberation times do not exceed ANSI
3 Patynen, Jukka; Katz, Brian F. G.; Lokki, Tapio. “Investigationson the Balloon as an Impulse Source.” Journal of the AcousticalSociety of America 129 (1), January 2011.
ACOUSTIC CHARACTERIZATION OF 41 COOPER SQUARE 5
Fig. 6. Reverberation Times of Various Rooms [seconds]
standards; therefore, it is highly recommended that soundabsorbing treatment be applied to the interior of highlyreverberant rooms. This treatment will not only reducethe reverberation time, but may also reduce the overallambient sound pressure level in the room as well.
C. Octave Band Reverberation Time
An octave band reverberation time analysis was per-formed in the acoustics laboratory (Room 710). In thisanalysis, the reverberation time of the room was calcu-lated for seven octave bands with center frequencies at 250Hz, 500 Hz, 1 kHz, 2 kHz, 4 kHz, 8 kHz, and 16 kHz.The frequency dependent reverberation times are shownin Figure 7.
Fig. 7. Average of 10 Octave Band Reverberation Time Measure-ments
The purpose of this study was to determine the frequen-cies which effected the reverberation time of the room the
greatest. This information can also be useful when deter-mining how easy it will be to hear and understand speech.A spectrograph of human speech reveals that most of thesounds that we can produce lie between 100-4000 Hz, withmost of the sound concentrated between 1000-3000 Hz4,although some speech can even reach frequencies of up to8000 Hz5. Therefore, if speech intelegibility is the primaryconcern in classroom acoustics, it is important to have lowreverberation times for these frequency ranges.
Figure 7 does not show any reverberation times that aredrastically above the standard of 0.7 seconds; however, thepeak reverberation occurred for the octave band centeredat 2,000 Hz, which directly corresponds to the average fre-quency of human speech. Ideally, the opposite trend wouldbe observed, with the lowest reverberation time at this oc-tave band.
Reverberation times were originally also recorded for the31.5 Hz, 63 Hz, and 125 Hz, octave bands; however, thesemeasurements were found to be extremely variable, andunable to produce consistent results. Even at the 250 Hzband level, the deviation from the mean is extremely wide,ranging from 0.35 seconds to nearly 0.7 seconds. Addi-tional measurements would have reduced this error; how-ever, most of the error was due to imprecise curve fittingand extrapolation of the decay slope. This is likely dueto the fact that the low frequency signals were only ableof raising the overall sound pressure level of the room byapproximately 20 dB, requiring a large amount of extrap-olation to determine the full reverberation time. Becauseof the overall low sound level, the signal to noise ratio wasalso lower, increasing the chances of random error in themeasurement.
D. Anechoic Chamber Status
The anechoic chamber was recently completed, and isnow available for use by the Cooper community. A brieftimeline of the of the progress is outlined below:
Installation of Floor and Wall Wedges: Installation ofa large portion of the floor and wall wedges was com-pleted during the summer of 2010. This was thefastest stage of the process, since the floor wedgesdid not require any special mounting brackets, andthe wall brackets had already been purchased and in-stalled. At this point, the chamber was also being usedfor storage of some of the remaining sound absorbingwedges, preventing access to the chamber.
Finish Installation of Wall and Ceiling Wedges:Construction of the chamber ceased for approxi-mately 6 months while waiting for the delivery ofspecial mounting brackets for the remaining ceilingand wall wedges. These brackets were manufacturedto work with the existing mounting system thatthe sound absorbing wedges used. These wedges
4 Everest, F. Alton; Pohlmann, Ken C. “Master Handbook ofAcoustics.” 5th ed. 2009: McGraw Hill. p. 74
5 Lord, Harold W.; Gately, William S.; Evensen, Harold A. “NoiseControl for Engineers.” 1987: Krieger Publishing Company. pp.47-53

6
were moved from the anechoic chamber in the oldengineering building at 51 Astor Place. Although theceiling is sloped, allowing the wedges to be higherat one side than at the other, the wedges were allinstalled at the same elevation.
Modify Existing Wall: Before a door could be installedin the chamber, the existing opening for the doorwas widened to allow for the non-standard size of thechamber door. Additionally, portions of the openingwere closed off, since the door was installed approxi-mately 2.5’ above ground level.
Installation of Doors: Two doors are used on the ane-choic chamber. The outer door is constructed with ametal shell with insulating material on the inside, andis approximately 2” thick. This door forms a tightseal with the frame, preventing outside noises fromentering the chamber. An interior door is also in-stalled, which is constructed with a light metal frame,and has sound absorbing wedges installed on the face.This door reduces internal reflections that would occuroff of the metal exterior door, and further attenuatessounds entering from the exterior.
Lighting in the anechoic chamber is provided by a singleincandescent bulb (shown in Figure 8), hanging from theceiling at the center of the chamber. Incandescent lightingis important, since florescent bulbs tend to produce an au-dible hum. Other forms of lighting, such as LED lighting,are sometimes used in anechoic chambers; however, theselighting systems are often more expensive and complicatedto install. Additionally, LED lighting requires transform-ers to provide DC power, which can also produce audiblehums.
Fig. 8. Anechoic Chamber Lighting
A fire suppression system was also included in the newanechoic chamber. Although the sound absorbing wedgesare not flamible, a sprinkler was installed in the center ofthe room, near the light. The sprinkler (shown in Figure9) will cause small reflections of high frequencies; however,since the sprinkler is mostly hidden inside a sound absorb-ing wedge, the effect should be minimal.
Fig. 9. Anechoic Chamber Fire Suppression
Data lines and power outlets were also included insidethe chamber, allowing for computers and other equipmentto be used inside the chamber. The single data connectionis currently hanging from the ceiling of the chamber, whilethe power is supplied on two lower corners of the room.
The anechoic chamber was finished in mid April. Al-though extensive testing has not yet occurred, initial re-verberation time measurements were performed in the ane-choic chamber. Ideally, the anechoic chamber should havezero reverberation time (since no echos or reverberationsshould occur in the chamber). Initial measurements pro-duced reverberation times which were less then 0.01 sec-onds. This is the lowest detectable reverberation timewith the current calculation algorithm, which calculatesinstantaneous sound pressure levels in 0.01 second inter-vals. Therefore, the actual reverberation time of the roomwas unmeasurable using current equipment and software.
IV. Conclusions
Based on the overall ambient sound pressure level and re-verberation time measurements, Cooper Union’s new aca-demic building does not meet ANSI standards for academicacoustical characteristics. Although most rooms were justbelow the maximum limit set for reverberation times, al-most every room that was tested failed to fall below theANSI standard for the ambient sound levels of the room.In many cases, this was due to external noise from the city,and in almost all cases, the HVAC system seemed to be atfault.
In order to bring the classrooms, laboratories, and studyareas into compliance with ANSI standards, it is recom-mended that sound absorbing panels be installed in themost reverberant rooms. This would help lower the re-verberation time in the room, and also reduce the overallambient sound levels.
V. Suggested Future Work
The goal of this project was not only to characterize thebuilding’s acoustical properties, but also setup a system for

ACOUSTIC CHARACTERIZATION OF 41 COOPER SQUARE 7
future testing. This project focused on developing a soft-ware system that would allow acoustical measurements tobe made by users without significant knowledge of acous-tics or programming.
In order to get an accurate representation of the acous-tics of the building, it is important that all core learningspaces be tested for both reverberation time as well asambient sound pressure level. This can be accomplishedusing the software that has been created for this project,or by using sound level meters. Current sound level me-ters available in the Cooper Union Acoustics Lab have notbeen calibrated recently, and do not have the capability ofmeasuring below 60dB. Therefore, in order to make accu-rate and meaningful measurements, it would be necessaryto purchase a new sound level meter capable of performingthe measurements described in the report.
Additionally, it would be useful to perform octave (oreven third octave) band frequency reverberation time mea-surements on each of the rooms. This process could shedlight on the specific frequencies that are problematic, anddetermine whether these frequencies interfere with humanspeech. It can also help with the selection of sound absorb-ing panels (if necessary), since the effectiveness of most ofthese products is frequency dependent.
VI. Acknowledgements
I would like to thank my advisors: Professor Wei andProfessor Baglione for their guidance and assistance withthis project. I would also like to thank Jody Grapes andthe staff of buildings and grounds for their help with thecompletion of the anechoic chamber.
VII. References
[1]ANSI/ASA S12.60-2010/Part 1: Acoustic Perfor-mance Criteria, Design Requirements, and Guidelines forSchools.
[2] Everest, F. Alton; Pohlmann, Ken C. “Master Hand-book of Acoustics.” 5th ed. 2009: McGraw Hill.
[3] Patynen, Jukka; Katz, Brian F. G.; Lokki, Tapio.“Investigations on the Balloon as an Impulse Source.”Journal of the Acoustical Society of America 129 (1), Jan-uary 2011.
[4] Lord, Harold W.; Gately, William S.; Evensen,Harold A. “Noise Control for Engineers.” 1987: KriegerPublishing Company. pp. 47-53