06 july 2008 - universidade nova de lisboa › bitstream › 10362 › 15914 › 3 ›...
TRANSCRIPT
THIS DOCUMENT IS NOT AN INVESTMENT RECOMMENDATION AND SHALL BE USED
EXCLUSIVELY FOR ACADEMIC PURPOSES (SEE DISCLOSURES AND DISCLAIMERS AT END OF DOCUMENT)
See more information at WWW.NOVASBE.PT Page 1/29
MASTERS IN FINANCE
EQUITY RESEARCH
Global leader in distribution and IT sector
Amadeus IT Holdings is still a global leader in both the distribution
and the IT solution sector. In the distribution sector also known as
GDS sector the company has 37% of market share and expects to
increase this lead to 39% by 2016. In the IT sector the company
already possess 30% of the market share with 372M passengers
boarded and expect to almost double this number by 2014.
Current Macroeconomic conditions pose a challenge
With all the turbulence around the European sovereign debt,
especially Spain where the company is established the company
has been under a lot of pressure to perform well. Despite the
difficulties we still believe the company is the best positioned
player in both the distribution and IT sector.
Bookings expected to pick up to pre-recession levels
The number of booking processed by Amadeus is expected to
grow to pre-recession levels. This will only happen though,
because the emerging economies will offset the current slowdown
in Europe and North America.
Diversity in the IT solutions sector
Amadeus is currently developing solutions to increase their product
offering in the hotel, rail and airport sector.
Recommendation According to our valuation the company is the global leader in both sectors where operates and still has room to grow, especially in the IT sector. Therefore we issue a Buy recommendation on Amadeus IT Holdings with an expected price per share of 16.04€, representing a potential upside of 27.60%
AMADEUS IT HOLDINGS COMPANY REPORT
INFORMATION SERVICES 6 JANUARY 2012
STUDENT: ADRIANO ROSA [email protected]
Tough times to fly high
Europe macroeconomic conditions remain blur
Recommendation: BUY
Price Target FY12: 16.04 €
Price (as of 5-Jan-122) 12.60 €
Reuters: AMA.MC, Bloomberg: AMS:SM
52-week range (€) 11.21-16.39
Market Cap (€m) 5500
Outstanding Shares (m) 447.58
Source:Reuters
Source:Yahoo Finance
(Values in € millions) 2010 2011E 2012F
Revenues 2593 2792 3002
EBIT 311 735 795
Net profit 137 676 475
EPS 0.30 1.51 1.06
P/E 41.3 8.21 11.7
Source:Nova Equity Research
AMADEUS IT HOLDINGS COMPANY REPORT
THIS DOCUMENT IS NOT AN INVESTMENT RECOMMENDATION AND SHALL BE USED
EXCLUSIVELY FOR ACADEMIC PURPOSES (SEE DISCLOSURES AND DISCLAIMERS AT END OF DOCUMENT)
GDS - Global Distribution System CRS – Computer Reservation System
OTA-Online Travel Agencies PAGE 2/29 F2F- Face to face business
Table of Contents
Executive Summary……………………………………………..………..3
Company Overview ............................................................................3
Shareholder Structure………………………………………………........4
Distribution Sector…………………………………………………….......4
IT Sector……………………………………………………………….....11 Comparables……………………………………………………………..13 Travel Industry Trends…………………………………………………..14 Overview of Amadeus Debt Structure………....................................18 Valuation……………………………………………………………........19 Conclusion…………………………………………………………….....24 References…………………………………………………………........25 Appendix……………………………………………………………….....26 Discloser and Disclaimers………………………………………………29

AMADEUS IT HOLDINGS COMPANY REPORT
THIS DOCUMENT IS NOT AN INVESTMENT RECOMMENDATION AND SHALL BE USED
EXCLUSIVELY FOR ACADEMIC PURPOSES (SEE DISCLOSURES AND DISCLAIMERS AT END OF DOCUMENT)
GDS - Global Distribution System CRS – Computer Reservation System
OTA-Online Travel Agencies PAGE 3/29 F2F- Face to face business
Executive summary
This document presents a detailed valuation of Amadeus IT Holdings. A DCF
valuation was used in order to obtain the best possible estimate of a fair value of
the company. In order to evaluate the company, the company was split in two
sectors: the distribution sector and the IT sector. The total valuation was obtained
as a sum-of-the-parts valuation. Due to the current economic conditions multiple
scenarios were accounted for where the key growth drivers of each sector grew
at a different pace. A brief comparison was done between Amadeus and their
main competitors in order to access the company’s strengths and weaknesses in
the market. Finally the result were able to show the company is the global leader
in both the distribution and the IT sector, and is still very well positioned in both
markets with decent margins to grow.
Company overview
Amadeus IT Holdings was originally created in 1987 by a consortium of airline
companies, composed by Air France, Iberia, Lufthansa and SAS. Their main
purpose was to connect providers’ content with travel agencies and consumers in
real time. The company is divided in two business segments: distribution and IT
solutions.
In the distribution segment the Amadeus Computer Reservation System is the
largest GDS provider serving the worldwide travel and tourism industry, and has
an estimated market share of around 37%. Amadeus CRS already gives access
to bookable content from 435 airlines (including 60 low cost carriers), 29 car
rental companies (representing 36000 car rental locations), 51 cruise lines and
ferry operators, 280 hotel chains and 87000 hotels, 200 tour operators, 103 rail
operators and 116 travel insurance companies. Due to this position in the market
the company is able to focus in distributing both global and local travel content.
From the total number of bookings made by Amadeus around 58% of the total
bookings are what could be called guaranteed bookings since they come from
airlines who are shareholders of Amadeus, leaving the company in a great
position to acquire new markets without having to worry about their core market.
Exhibit 1:Shareholders bookings
Source: IATA

AMADEUS IT HOLDINGS COMPANY REPORT
THIS DOCUMENT IS NOT AN INVESTMENT RECOMMENDATION AND SHALL BE USED
EXCLUSIVELY FOR ACADEMIC PURPOSES (SEE DISCLOSURES AND DISCLAIMERS AT END OF DOCUMENT)
GDS - Global Distribution System CRS – Computer Reservation System
OTA-Online Travel Agencies PAGE 4/29 F2F- Face to face business
The IT Solutions business segment aims at the development and the provision of
IT solutions to travel providers. The current product offering of this sector
primarily addresses the passenger service systems (PSS) segment of the airline
IT market, and is called Altéa software suite. Regarding this segment, the
company is seeking to grow their market-share within the non-airline IT solutions
markets, including the hotel, rail and airport IT markets.
Shareholder structure
On the 29 of April of 2010 Amadeus IT Holdings become publicly listed in the
Madrid stock exchange, in an IPO that was the biggest in Europe during 2010,
where the company raised 1.32B€ by selling 120M of shares at 11€ a share. It
was also the biggest IPO in Spain, since 2007 when Iberdrola Renovables went
public.
As of December of 2011 the current shareholder structure is the following one:
Distribution Sector
Amadeus IT Holdings has their business divided in two sectors: the GDS sector
and the IT sector. GDS stands for global distribution systems, and is mainly a
computer reservation system (CRS) that is able to sell through internet gateways
a multiple diversity of tickets, from a multiple diversity of operators. Regular
Exhibit 2:Shareholder structure
Source: Amadeus

AMADEUS IT HOLDINGS COMPANY REPORT
THIS DOCUMENT IS NOT AN INVESTMENT RECOMMENDATION AND SHALL BE USED
EXCLUSIVELY FOR ACADEMIC PURPOSES (SEE DISCLOSURES AND DISCLAIMERS AT END OF DOCUMENT)
GDS - Global Distribution System CRS – Computer Reservation System
OTA-Online Travel Agencies PAGE 5/29 F2F- Face to face business
operators of this kind of system are: airline companies, hotel companies, rental
car companies, railway companies and ferry companies.
By connecting a large number of travel providers with a large number of travel
agencies, Amadeus is able to create value in the travel distribution chain for both
travel providers and travel agencies. Exhibit 3 shows that the number of travel
providers using the distribution system is directly proportional to the number of
travel agencies already connected to the system.
The rationale behind this correlation is quite easy to understand from both points
of view: travel providers and travel agencies.
From the travel providers perspective it makes more sense to choose a
distribution platform that is already connected to a large number of travel
agencies in order to be able to sell their products to a broader audience,
essentially international markets they could not reach on their own and niche
markets.
Sitting in the travel agencies shoes, it is pretty obvious that it will be better to
work with a distribution platform that already has a large number of travel
providers connected to it, since travel agencies work as an intermediary between
travel providers and the final customer and therefore the larger the offer
spectrum, the larger their base clientele.
Exhibit 3: Distribution business model
Source: Amadeus

AMADEUS IT HOLDINGS COMPANY REPORT
THIS DOCUMENT IS NOT AN INVESTMENT RECOMMENDATION AND SHALL BE USED
EXCLUSIVELY FOR ACADEMIC PURPOSES (SEE DISCLOSURES AND DISCLAIMERS AT END OF DOCUMENT)
GDS - Global Distribution System CRS – Computer Reservation System
OTA-Online Travel Agencies PAGE 6/29 F2F- Face to face business
This sector is susceptible to a phenomenon called network effect that basically
says the following; the value of a product is dependent on the number of others
using it. In our case, every time a travel provider or a travel agent joins Amadeus
platform it will be adding value without intending to travel agents/providers that
already use the platform, since the final customer will tend to use a travel agency
that is connected to a platform with a lot of travel providers and is more likely to
pick a travel provider that is connected to a platform with plenty of travel
agencies. This phenomenon also has an impact in the commissions received and
paid by Amadeus. The average fee charged by Amadeus to travel providers is
directly proportional with the amount of travel agencies present in the platform,
while the average incentive fee paid by Amadeus to travel agencies is inversely
proportional with the number of travel providers linked to the platform.
The GDS sector is more and less a natural oligopoly, in the sense it has very high
barriers to enter such as, the technology content replication and the network
infrastructures needed for this kind of operation. Amadeus has one of the largest
and most complex datacenter in Europe in order to be able to process the
required amount of transactions needed. Also the company spends heavily in
both electronic and physical security of their system and low latency algorithms to
keep improving their system functionality. Finally after the massive investments
that have to be made one of the biggest challenges for someone who wants to
enter this market is the know-how required to elaborate complex travel itineraries
and at the same time do it without adding extra costs to the final customer.
GDS systems are responsible for bringing in some of the most important
innovations in the travel industry, features like e-ticketing, graphic seat selection,
travel e-commerce and best price fares only exist nowadays in the travel market
due to them.
Inside this sector companies usually recognize their revenues by dividing this
item in booking revenue and non-booking revenue. Booking revenue comes
strictly from bookings made through the system, while non-booking revenue
comes from the fees paid to have access to the distribution platform.
Since part of this sector operates on a fee-per-transaction basis, it is important to
get the big picture of the transaction processing model used by the companies
operating on this sector.
Exhibit 5: Distribution Sector Revenue
Source: Amadeus
Exhibit 4: Distribution Sector Revenue
Source:Amadeus
AMADEUS IT HOLDINGS COMPANY REPORT
THIS DOCUMENT IS NOT AN INVESTMENT RECOMMENDATION AND SHALL BE USED
EXCLUSIVELY FOR ACADEMIC PURPOSES (SEE DISCLOSURES AND DISCLAIMERS AT END OF DOCUMENT)
GDS - Global Distribution System CRS – Computer Reservation System
OTA-Online Travel Agencies PAGE 7/29 F2F- Face to face business
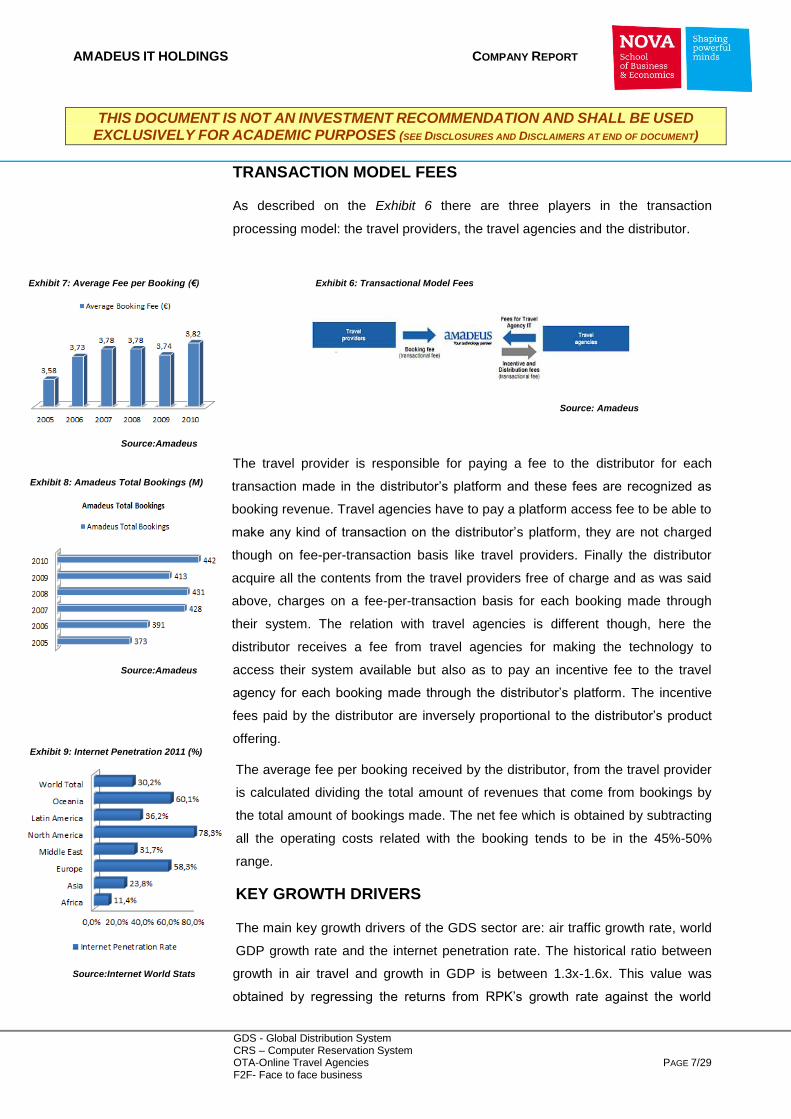
TRANSACTION MODEL FEES
As described on the Exhibit 6 there are three players in the transaction
processing model: the travel providers, the travel agencies and the distributor.
The travel provider is responsible for paying a fee to the distributor for each
transaction made in the distributor’s platform and these fees are recognized as
booking revenue. Travel agencies have to pay a platform access fee to be able to
make any kind of transaction on the distributor’s platform, they are not charged
though on fee-per-transaction basis like travel providers. Finally the distributor
acquire all the contents from the travel providers free of charge and as was said
above, charges on a fee-per-transaction basis for each booking made through
their system. The relation with travel agencies is different though, here the
distributor receives a fee from travel agencies for making the technology to
access their system available but also as to pay an incentive fee to the travel
agency for each booking made through the distributor’s platform. The incentive
fees paid by the distributor are inversely proportional to the distributor’s product
offering.
The average fee per booking received by the distributor, from the travel provider
is calculated dividing the total amount of revenues that come from bookings by
the total amount of bookings made. The net fee which is obtained by subtracting
all the operating costs related with the booking tends to be in the 45%-50%
range.
KEY GROWTH DRIVERS
The main key growth drivers of the GDS sector are: air traffic growth rate, world
GDP growth rate and the internet penetration rate. The historical ratio between
growth in air travel and growth in GDP is between 1.3x-1.6x. This value was
obtained by regressing the returns from RPK’s growth rate against the world
Source: Amadeus
Exhibit 6: Transactional Model Fees Exhibit 7: Average Fee per Booking (€)
Source:Amadeus
Exhibit 8: Amadeus Total Bookings (M)
Source:Amadeus
Exhibit 9: Internet Penetration 2011 (%)
Source:Internet World Stats

AMADEUS IT HOLDINGS COMPANY REPORT
THIS DOCUMENT IS NOT AN INVESTMENT RECOMMENDATION AND SHALL BE USED
EXCLUSIVELY FOR ACADEMIC PURPOSES (SEE DISCLOSURES AND DISCLAIMERS AT END OF DOCUMENT)
GDS - Global Distribution System CRS – Computer Reservation System
OTA-Online Travel Agencies PAGE 8/29 F2F- Face to face business
GDP growth rate, therefore if the GDP growth rate starts picking up there will be
direct positive consequences in the air traffic growth rate.
Also due to the rise on the OTA market vs. offline travel agencies a very
significant number of bookings are currently made online, meaning the internet
penetration rate in emerging economies such as the Asia-Pacific and the Latin
America will play a critical role on how the distribution sector will perform in the
near future. Exhibit 10 shows a statistics chart with the expected internet
penetration rates for the near future worldwide.
ONLINE BOOKINGS MARKET FORECASTS
In order to forecast the total number of bookings Amadeus will process in the
future, first we had to forecast the total number of bookings that will be processed
by the GDS market. Since the total number of air bookings processed by GDS
systems represent 85% of the total market and non-air bookings only account for
15%, we decided our best key driver to forecast the future number of bookings
would be the air traffic growth rate. Firstly we divided all the bookings processed
by region and found out the weights of each of the regions when compared with
the total market, secondly we found out the future air traffic growth rate for each
of the regions who had bookings processed and finally we did a weighted
average of the future air growth rate by region taking into accounts the weights
obtained in the first step. To obtain the number of bookings that will be processed
by Amadeus we multiplied the total number of booking processed, by the market
share forecast for Amadeus. Our Amadeus market share predictions were made
solely by looking to past performance, and due to the nature of the business we
Exhibit 11: Air Traffic Growth Rate (%)
Source: IATA
Exhibit 12: Air Bookings by region (%)
Source: Amadeus
Exhibit 10: Internet Penetration 2015 (%)
Source: Internet World Stats
Exhibit 13: GDP Growth vs. RPK Growth (RPK’s)
Source: ICAO

AMADEUS IT HOLDINGS COMPANY REPORT
THIS DOCUMENT IS NOT AN INVESTMENT RECOMMENDATION AND SHALL BE USED
EXCLUSIVELY FOR ACADEMIC PURPOSES (SEE DISCLOSURES AND DISCLAIMERS AT END OF DOCUMENT)
GDS - Global Distribution System CRS – Computer Reservation System
OTA-Online Travel Agencies PAGE 9/29 F2F- Face to face business
decided to adjust the market share of Amadeus by 0.5% a year for the next two
years and after by 0.3%. The main reason for this assumption was the fact the
market is an oligopoly with only two more players and due to the maturity the
market is reaching, the trends within the sector are very well defined and
therefore none of the players is expected to have a lot of volatility market share
wise. Forecasts for the average fee per booking were made by incorporating in
the current average fee per booking, the expected inflation for the future years.
The rationale behind this decision is related to Amadeus policy of not wanting to
increase their margins in the average fee per booking, but to gain share from the
offline bookings market and relief the pressure on the airline industry. Below is a
table with all the information regarding the operating data of the sector.
(In millions) 2012 2013 2014 2015 2016
Online Market Total Bookings 1377 1473 1576 1686 1803
Online Market Air Bookings 1128 1184 1243 1304 1369
Online Market Non-Air bookings 199 209 219 230 242
Amadeus Total Bookings 491 515 541 568 596
Amadeus Air Bookings 417 438 460 483 507
Amadeus Non-Air Bookings 74 77 81 85 89
Putting together all the variables explained above, Amadeus is expected to
outgrow their main competitors regarding the total number of bookings and the
type of booking trend is expected to remain the same, with the majority of
bookings coming from air bookings.
THE DISTRIBUTION SECTOR SWOT ANALYSYS
STRENGHTS
The global distribution system main strengths are the following: global reach to
new markets and new targets, allowing airline companies to make bookings
outside of their home market and of higher standard (business and first-class
bookings). This kind of system also allows companies to establish partnerships
among them like code-sharing and interlining. GDS systems are also responsible
for improved travel agency efficiency and travel agency network management.
Finally another important advantage of the GDS system is the ability it gives
travel providers to make their current inventory available to their customers in
real-time.
Source: Nova Equity Research
Table 1: Booking statistics
AMADEUS IT HOLDINGS COMPANY REPORT
THIS DOCUMENT IS NOT AN INVESTMENT RECOMMENDATION AND SHALL BE USED
EXCLUSIVELY FOR ACADEMIC PURPOSES (SEE DISCLOSURES AND DISCLAIMERS AT END OF DOCUMENT)
GDS - Global Distribution System CRS – Computer Reservation System
OTA-Online Travel Agencies PAGE 10/29 F2F- Face to face business
WEAKNESSES
The main weaknesses that tend to appear in a centralized system like this are
the huge costs the company has to spend to be able to replicate and store in
different physical areas worldwide, to be able to prevent themselves against
catastrophic events. Also in the event of a technical glitch every travel provider
and every travel agency will be directly affected during the time the system is
down or is showing incorrect information to their customers. A final critic usually
made to these systems, is how they are not ready to deal with complex logistics
travelling like the ones we are used to see in the business travel market.
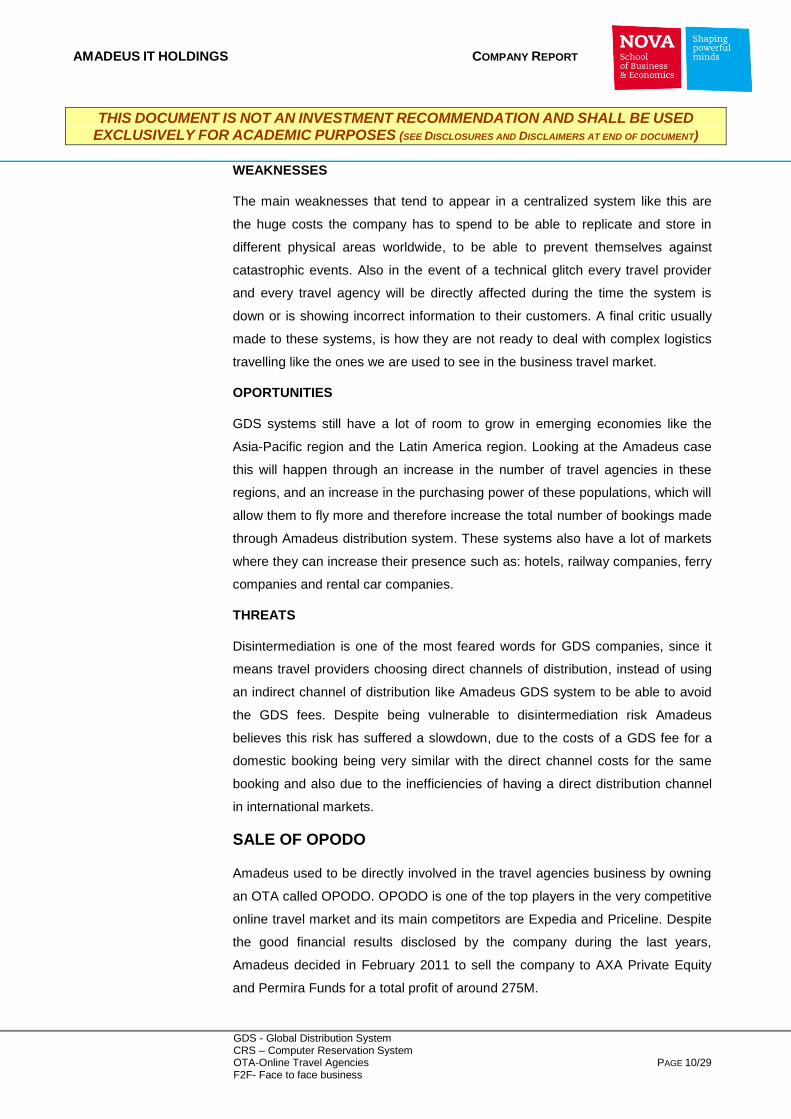
OPORTUNITIES
GDS systems still have a lot of room to grow in emerging economies like the
Asia-Pacific region and the Latin America region. Looking at the Amadeus case
this will happen through an increase in the number of travel agencies in these
regions, and an increase in the purchasing power of these populations, which will
allow them to fly more and therefore increase the total number of bookings made
through Amadeus distribution system. These systems also have a lot of markets
where they can increase their presence such as: hotels, railway companies, ferry
companies and rental car companies.
THREATS
Disintermediation is one of the most feared words for GDS companies, since it
means travel providers choosing direct channels of distribution, instead of using
an indirect channel of distribution like Amadeus GDS system to be able to avoid
the GDS fees. Despite being vulnerable to disintermediation risk Amadeus
believes this risk has suffered a slowdown, due to the costs of a GDS fee for a
domestic booking being very similar with the direct channel costs for the same
booking and also due to the inefficiencies of having a direct distribution channel
in international markets.
SALE OF OPODO
Amadeus used to be directly involved in the travel agencies business by owning
an OTA called OPODO. OPODO is one of the top players in the very competitive
online travel market and its main competitors are Expedia and Priceline. Despite
the good financial results disclosed by the company during the last years,
Amadeus decided in February 2011 to sell the company to AXA Private Equity
and Permira Funds for a total profit of around 275M.

AMADEUS IT HOLDINGS COMPANY REPORT
THIS DOCUMENT IS NOT AN INVESTMENT RECOMMENDATION AND SHALL BE USED
EXCLUSIVELY FOR ACADEMIC PURPOSES (SEE DISCLOSURES AND DISCLAIMERS AT END OF DOCUMENT)
GDS - Global Distribution System CRS – Computer Reservation System
OTA-Online Travel Agencies PAGE 11/29 F2F- Face to face business
IT SECTOR
The IT Solutions sector aims to develop custom made IT solutions for travel
providers, such as system integration and migration services, application hosting,
training and other consulting services.
Amadeus current product offering mainly addresses the passenger services
system (PSS) segment of the airline IT market, by enabling processes such as
central reservation, inventory management, departure control, e-commerce and
direct distribution technology.
Historically travel providers have developed many of their core systems in-house
but due to increasingly complexity in these systems it became extremely
inefficient to develop their own in-house legacy systems price wise. Amadeus
Community PSS most attractive features include the following: high economies of
scale having a core platform designed to support multiple customers,
customization capability by allowing individual customers to identify functional
requirements they may need on their system, the functional richness of the
platform and the seamless integration with alliances and partners.
One of the main reasons for the airline companies to migrate from out-dated
legacy systems to scalable next-generation technology platforms like Amadeus is
the ability to respond to changing market conditions, while reducing their
spending on-going maintenance of their legacy systems by converting their fixed
costs in variable costs. Since 2007 Amadeus has almost tripled the number of
airline companies who have migrated to their software suite (from 34 to 94) and
has already confirmed a decent amount of companies who are expected to
migrate in the near future. The number of passengers boarded processed by
Amadeus software have also increased in an exponentially way from 2007 until
2010 as can be seen in Exhibit 17. This phenomenon happened mainly because
of two reasons: the steady increase in the number of contracted airlines by
Amadeus and the ability this software gives the airline companies to get rid of
their inventory in a much faster and reliable way.
The main software suite of this business sector is called Amadeus Altéa, a new
generation passenger management suite which addresses airlines mission
critical operating functions.
The Altéa software suite is currently composed by: Altéa Reservation, Altéa
Inventory, Altéa Departure Control and Altéa e-commerce. Altéa Reservation
enables airline customers to manage all their bookings, fare prices and ticketing
Exhibit 14: IT sector revenue (thous)
Source:Amadeus
Exhibit 15: IT sector revenue (%)
Source: Amadeus
AMADEUS IT HOLDINGS COMPANY REPORT
THIS DOCUMENT IS NOT AN INVESTMENT RECOMMENDATION AND SHALL BE USED
EXCLUSIVELY FOR ACADEMIC PURPOSES (SEE DISCLOSURES AND DISCLAIMERS AT END OF DOCUMENT)
GDS - Global Distribution System CRS – Computer Reservation System
OTA-Online Travel Agencies PAGE 12/29 F2F- Face to face business
through a single interfaces and is compatible with distribution via direct and
indirect channels, both online and offline. Altéa Inventory permits airlines to
create and manage schedules, seat capacity and associated on a flight-by-flight
basis. Altéa Departure Control covers many aspects of flight departure, including
check-in, issuance of boarding passes, gate control and other functions related to
passenger flight. Altéa e-commerce seeks to improve the profitability and
efficiency of the airline e-commerce sales and support process. Amadeus also
provides stand-alone IT solutions to support airlines in certain critical customer-
related processes such as, ticketing platform, customer loyalty, revenue integrity
and payment solutions.
Despite currently developing the majority of their IT solution for airline
companies, Amadeus is seeking to grow their market share within the non-airline
IT solutions market, including the hotel, rail and airport IT markets.
Within this sector revenue is recognized as transactional revenue or as non-
transactional revenue, where the transactional revenue represents fees paid by
the companies for each passenger boarded processed by Amadeus software
suite and the non-transactional revenue represents the other costs associated
with the implementation of the Amadeus technology.
IT SECTOR FUNDAMENTALS
The IT sector performance is strongly correlated with the air traffic growth and
with the number of companies contracted. Due to this correlation, using both
drivers is the fairest way to forecast future performance of the IT sector.
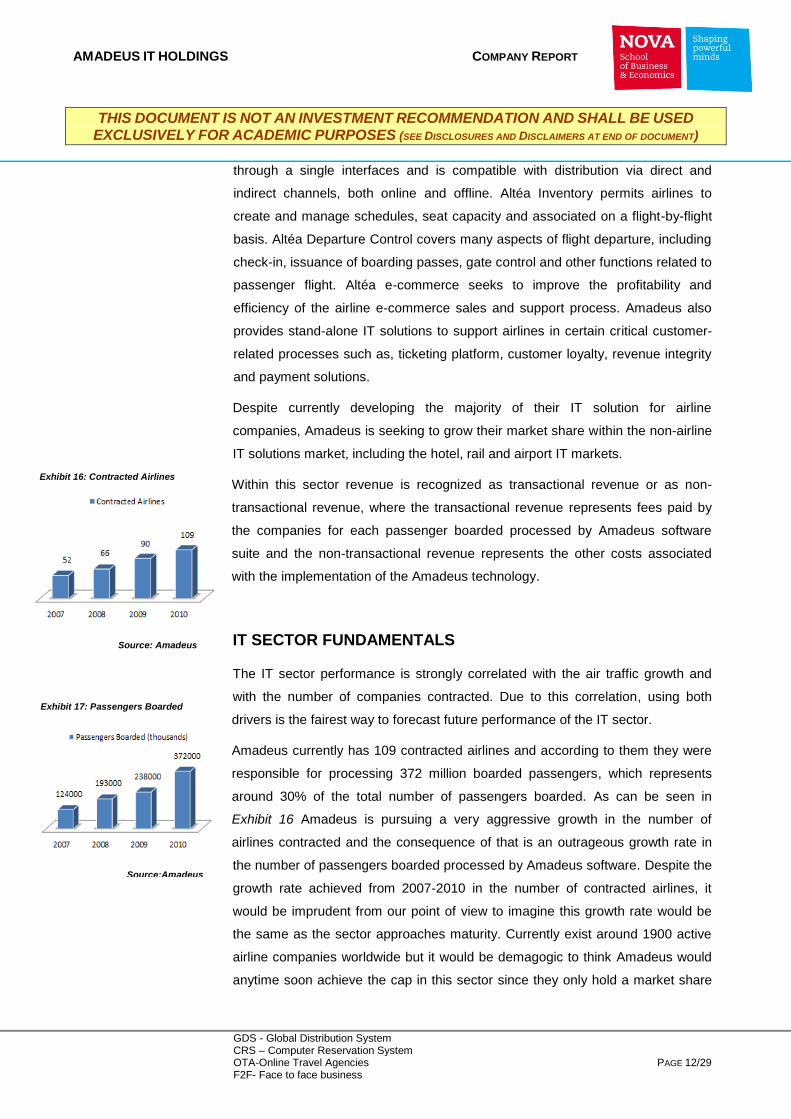
Amadeus currently has 109 contracted airlines and according to them they were
responsible for processing 372 million boarded passengers, which represents
around 30% of the total number of passengers boarded. As can be seen in
Exhibit 16 Amadeus is pursuing a very aggressive growth in the number of
airlines contracted and the consequence of that is an outrageous growth rate in
the number of passengers boarded processed by Amadeus software. Despite the
growth rate achieved from 2007-2010 in the number of contracted airlines, it
would be imprudent from our point of view to imagine this growth rate would be
the same as the sector approaches maturity. Currently exist around 1900 active
airline companies worldwide but it would be demagogic to think Amadeus would
anytime soon achieve the cap in this sector since they only hold a market share
Exhibit 16: Contracted Airlines
Source: Amadeus
Exhibit 17: Passengers Boarded
Source:Amadeus

AMADEUS IT HOLDINGS COMPANY REPORT
THIS DOCUMENT IS NOT AN INVESTMENT RECOMMENDATION AND SHALL BE USED
EXCLUSIVELY FOR ACADEMIC PURPOSES (SEE DISCLOSURES AND DISCLAIMERS AT END OF DOCUMENT)
GDS - Global Distribution System CRS – Computer Reservation System
OTA-Online Travel Agencies PAGE 13/29 F2F- Face to face business
of 5.7%. Taking that into account we decided to use a moderate 9% growth rate
in the number of contracted airlines for the near future.
According to an IATA study the profitability of Amadeus IT business model is not
correlated with the airline industry profitability, therefore the profit margin
shrinking, that is currently happening in the airline industry is not expected to
bring direct consequences to the IT sector, where Amadeus operates.
As was said above, currently almost the entire revenue generated in the IT sector
comes from airline companies but in order to diversify their presence in this
sector Amadeus is already developing solutions for other markets that also have
a shortage in product selection such as: the hotel, rail and airport market.
Comparables
Due to the high barriers to enter both distribution and IT solution sector, there are
only another two main players who also operate in both sectors.
The main competitors of Amadeus IT Holdings are Sabre Holdings and
Travelport. Sabre Holdings was founded by American Airlines in order to
automate the way they booked reservations and is currently used by companies
such as: American Express, BCD, Carlson Wagonlit, Expedia, Frontier, Last
Minute, JetBlue, and Travelcity. Travelport is a private company owned by The
Blackstone Group, One Equity Partners, Technology Crossover Ventures and
Travelport management. Both Sabre Holdings and Travelport are private-owned
so we only have unaudited data from them to compare the three companies but
accordingly to studies developed by Amadeus and PhoCusWright, Amadeus
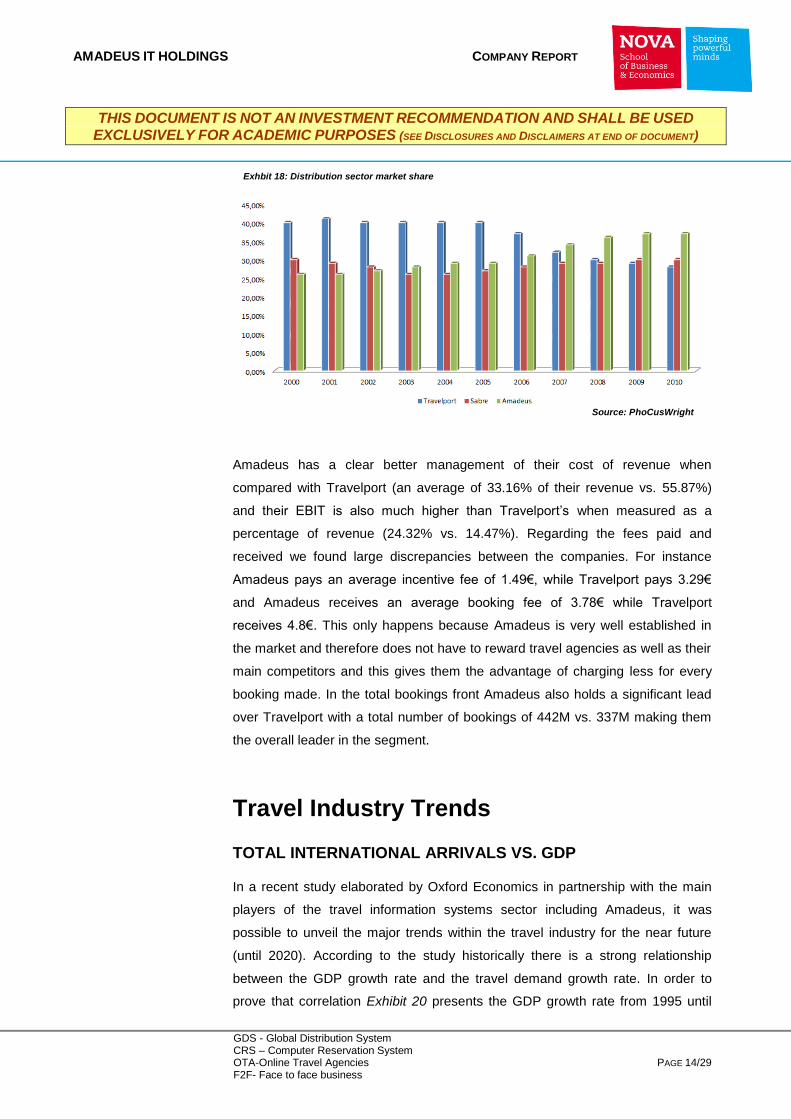
holds a significant lead in both sectors. Below Exhibit 18 shows us the
performance obtained by the three main players in the distribution sector.
When comparing the operating data from Amadeus with the same data from their
main competitors is quite easy to draw a conclusion on why they have been the
market leader in the distribution sector for the last four years and why they expect
to increase their market share in the sector.
AMADEUS IT HOLDINGS COMPANY REPORT
THIS DOCUMENT IS NOT AN INVESTMENT RECOMMENDATION AND SHALL BE USED
EXCLUSIVELY FOR ACADEMIC PURPOSES (SEE DISCLOSURES AND DISCLAIMERS AT END OF DOCUMENT)
GDS - Global Distribution System CRS – Computer Reservation System
OTA-Online Travel Agencies PAGE 14/29 F2F- Face to face business
Amadeus has a clear better management of their cost of revenue when
compared with Travelport (an average of 33.16% of their revenue vs. 55.87%)
and their EBIT is also much higher than Travelport’s when measured as a
percentage of revenue (24.32% vs. 14.47%). Regarding the fees paid and
received we found large discrepancies between the companies. For instance
Amadeus pays an average incentive fee of 1.49€, while Travelport pays 3.29€
and Amadeus receives an average booking fee of 3.78€ while Travelport
receives 4.8€. This only happens because Amadeus is very well established in
the market and therefore does not have to reward travel agencies as well as their
main competitors and this gives them the advantage of charging less for every
booking made. In the total bookings front Amadeus also holds a significant lead
over Travelport with a total number of bookings of 442M vs. 337M making them
the overall leader in the segment.
Travel Industry Trends
TOTAL INTERNATIONAL ARRIVALS VS. GDP
In a recent study elaborated by Oxford Economics in partnership with the main
players of the travel information systems sector including Amadeus, it was
possible to unveil the major trends within the travel industry for the near future
(until 2020). According to the study historically there is a strong relationship
between the GDP growth rate and the travel demand growth rate. In order to
prove that correlation Exhibit 20 presents the GDP growth rate from 1995 until
Exhbit 18: Distribution sector market share
Source: PhoCusWright

AMADEUS IT HOLDINGS COMPANY REPORT
THIS DOCUMENT IS NOT AN INVESTMENT RECOMMENDATION AND SHALL BE USED
EXCLUSIVELY FOR ACADEMIC PURPOSES (SEE DISCLOSURES AND DISCLAIMERS AT END OF DOCUMENT)
GDS - Global Distribution System CRS – Computer Reservation System
OTA-Online Travel Agencies PAGE 15/29 F2F- Face to face business
2016 and Exhibit 19 presents the international tourist arrivals also for the same
period.
Despite the charts not looking exactly the same, there is a strong similarity
between the periods when there was a slowdown in the GDP growth rate and
when the total amount of international tourist arrivals also suffered a slowdown.
For instance the periods between 2001-2002 and 2009 reflect the hypothesis
explained above. Another important conclusion to retain from this data is that
travel demand, tends to have an income elasticity above 1.0, which means during
good times it will increase faster than the GDP growth but correspondingly will
drop faster during a recession. The general conclusion that should be reached
from the data above provided is that the leisure travel market is expected to take
some time to re-establish itself from the recessive economy but the business
travel market will keep showing a strong demand.
Exhibit 19: International Tourist Arrivals (M)
Source: Amadeus
Exhibit 20: World GDP ($)
Source:Amadeus

AMADEUS IT HOLDINGS COMPANY REPORT
THIS DOCUMENT IS NOT AN INVESTMENT RECOMMENDATION AND SHALL BE USED
EXCLUSIVELY FOR ACADEMIC PURPOSES (SEE DISCLOSURES AND DISCLAIMERS AT END OF DOCUMENT)
GDS - Global Distribution System CRS – Computer Reservation System
OTA-Online Travel Agencies PAGE 16/29 F2F- Face to face business
AVIATION INDUSTRY TRENDS
Recent data disclosed by IATA, shows the global aviation industry returning to
net profits and levels of passenger traffic already picking up to pre-recession
levels. Despite this good news the current net profit margins have been shrinking
and data from 2010 shows a net profit margin of only 0.5%. Also if we start
looking locally instead of taking a peak at the big picture we discover that, the
more developed economies such as Europe and North America still present big
losses and the big picture is only positive because these losses are offset by the
emerging markets profit. Despite the gloomy outlook for the airline companies
Amadeus portfolio of travel providers is already very well diversified by region
and has been gradually increasing. In Europe Amadeus have long-term full
content agreements with the top three carriers: Lufhtansa Group which is
composed by Lufhtansa, Austrian Airlines, Swiss Airlines, Air Brussels and by
their low cost carrier GermanWings, Air France – KLM and with the International
Airlines Group who is composed by Iberia and British Ariways. In North America
despite being the player with less market share (from the three main players of
the sector) the company have been conquering market share and recently signed
an agreement with two top carriers: American Airlines and United Airlines. The
Middle East region is also very important for Amadeus and evidence of that are
the long-term agreements the company currently has with Emirates Airlines,
Etihad Airlines, Saudi Arabian Airlines, Turkish Airlines and Royal Jordanian
Airlines. Amadeus has also signed three very important companies in Asia, Air
Asia, Singapore Airlines and China Southern Airlines, already predicting this
region will become one of the most important international hubs for passengers.
Finally in Latin America the company has also signed a major deal with TAM,
who is the largest carrier in Latin America.
TRAVEL AGENCIES TRENDS
Travel agencies market share have been migrating in recent years from offline
agencies to OTA (online travel agencies) as can be seen in the graph below.
Exhibit 21: Lufhtansa Group Stats
Source: Lufhtansa Group
Exhibit 22: China Southern Air Stats
Source: China Southern Airlines
Exhibit 23: Emirates Air Stats
Source: Emirates Airlines
Exhibit 24: TAM Stats
Source: TAM
AMADEUS IT HOLDINGS COMPANY REPORT
THIS DOCUMENT IS NOT AN INVESTMENT RECOMMENDATION AND SHALL BE USED
EXCLUSIVELY FOR ACADEMIC PURPOSES (SEE DISCLOSURES AND DISCLAIMERS AT END OF DOCUMENT)
GDS - Global Distribution System CRS – Computer Reservation System
OTA-Online Travel Agencies PAGE 17/29 F2F- Face to face business
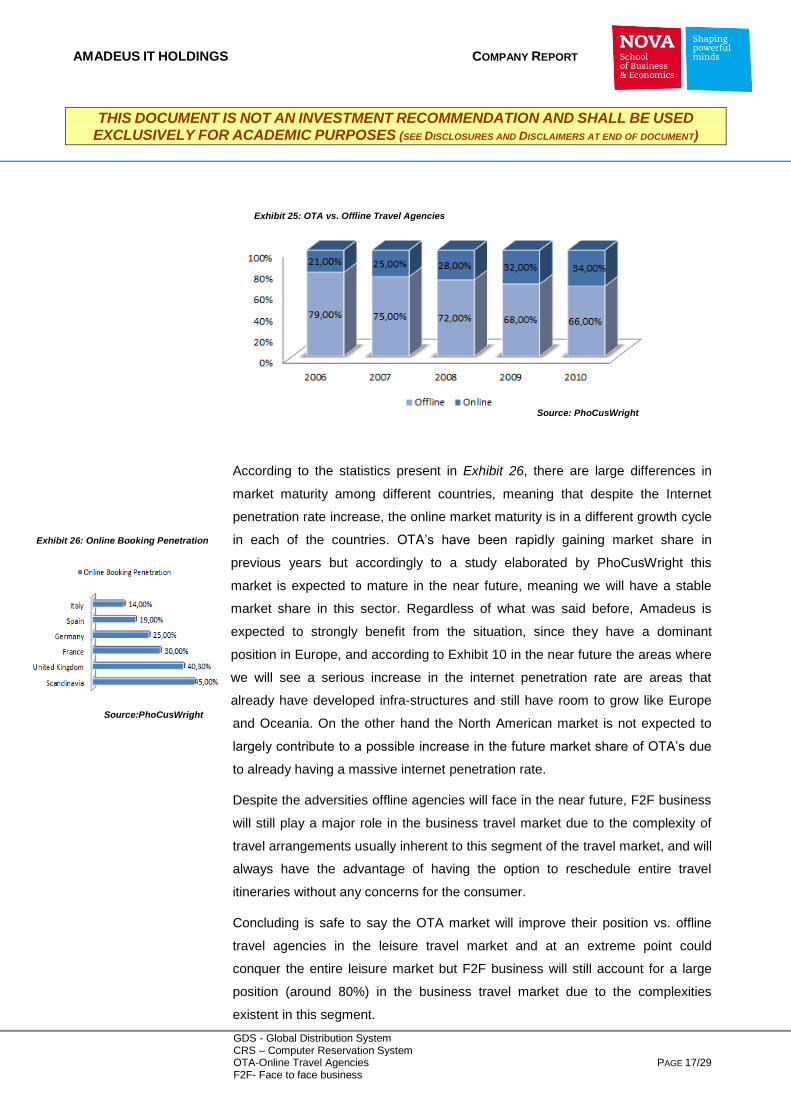
According to the statistics present in Exhibit 26, there are large differences in
market maturity among different countries, meaning that despite the Internet
penetration rate increase, the online market maturity is in a different growth cycle
in each of the countries. OTA’s have been rapidly gaining market share in
previous years but accordingly to a study elaborated by PhoCusWright this
market is expected to mature in the near future, meaning we will have a stable
market share in this sector. Regardless of what was said before, Amadeus is
expected to strongly benefit from the situation, since they have a dominant
position in Europe, and according to Exhibit 10 in the near future the areas where
we will see a serious increase in the internet penetration rate are areas that
already have developed infra-structures and still have room to grow like Europe
and Oceania. On the other hand the North American market is not expected to
largely contribute to a possible increase in the future market share of OTA’s due
to already having a massive internet penetration rate.
Despite the adversities offline agencies will face in the near future, F2F business
will still play a major role in the business travel market due to the complexity of
travel arrangements usually inherent to this segment of the travel market, and will
always have the advantage of having the option to reschedule entire travel
itineraries without any concerns for the consumer.
Concluding is safe to say the OTA market will improve their position vs. offline
travel agencies in the leisure travel market and at an extreme point could
conquer the entire leisure market but F2F business will still account for a large
position (around 80%) in the business travel market due to the complexities
existent in this segment.
Exhibit 25: OTA vs. Offline Travel Agencies
Source: PhoCusWright
Exhibit 26: Online Booking Penetration
Source:PhoCusWright

AMADEUS IT HOLDINGS COMPANY REPORT
THIS DOCUMENT IS NOT AN INVESTMENT RECOMMENDATION AND SHALL BE USED
EXCLUSIVELY FOR ACADEMIC PURPOSES (SEE DISCLOSURES AND DISCLAIMERS AT END OF DOCUMENT)
GDS - Global Distribution System CRS – Computer Reservation System
OTA-Online Travel Agencies PAGE 18/29 F2F- Face to face business
Overview of Amadeus debt structure
Amadeus used different types of debt instruments to finance their operations.
The rationale to use different instruments is the flexibility, maturity extension and
cost reduction these instruments provide to the company. The current debt
structure is composed by an emission of an Eurobond in the amount of 750€M,
maturing in July 2016, with a coupon of 4.85% and with an assigned rating of
BBB- by S&P (last level of investment grade bonds), by a bridge loan in the
amount of 456€M maturing in May 2013 in order to provide flexibility to approach
markets in due course and finally an amortizing term loan in the amount of
900€M maturing in Nov 2015. Below Exhibit 27 shows a visual description of
Amadeus debt structure.
The company has also secured a 300€M credit, that is currently unused with the
goal of using it to cover working capital needs.
The only debt that was publicly issued was the 750€M Eurobond, with a coupon
of 4.85% if the company is able to keep their investment grade rating otherwise
there would be a penalty where the company would have to pay 1% more in the
coupon or 5.85% total. The yield paid by Amadeus in the remaining 1354€M is
not disclosed by the company but is possible to make an estimate using the
current yield paid by the Euro Area 5y BBB- Composite Index which is around
5.05%. We thought using a five years maturity was the best match for our
scenario since we have a debt average maturity of 3.4 years. The current market
value of Amadeus debt is 2.396B€.
Exhibit 27:Amadeus Debt Structure
Source:Amadeus

AMADEUS IT HOLDINGS COMPANY REPORT
THIS DOCUMENT IS NOT AN INVESTMENT RECOMMENDATION AND SHALL BE USED
EXCLUSIVELY FOR ACADEMIC PURPOSES (SEE DISCLOSURES AND DISCLAIMERS AT END OF DOCUMENT)
GDS - Global Distribution System CRS – Computer Reservation System
OTA-Online Travel Agencies PAGE 19/29 F2F- Face to face business
In order to guarantee these credits the company had to sign two covenants,
where the first says the company can only have a maximum of 3x Net
Debt/EBITDA and the second says the company needs a minimum of 3x interest
coverage. According to our forecast the company will not have any problem
meeting these requirements as the current Net Debt/EBIDTA ratio is 1.1 and is
expected to get lower in the future and the current interest coverage is 4.3 and is
expected to increase in the short term.
Valuation
The valuation model used to estimate the fair value of Amadeus IT Holdings was
an enterprise discounted cash flow model that uses weighted average cost of
capital as a discount factor. The main reason for using this type of model was the
relatively stable debt-to-value ratio the company expects to maintain in the future.
Amadeus currently has a market value D/V ratio of 30.85% and consequently a
69.15% E/V ratio and expects it to remain stable in the near future. Despite
having more than one method to implement the enterprise discounted cash flow
model we decided to use a four step model. Firstly the total value of the
company’s operations was obtained by summing up all the discounted free cash
flows of the company for the next five years (2012-2016) and adding to that a
terminal value of the company. Secondly the calculation of the net debt market
value was calculated by adding up the market value of the long term and short
term debt and subtracting the cash and cash equivalents. The next step was the
subtraction of the net debt value from the company value of operations that
resulted in the equity value of the company and the last step but not the least was
the division of this result by the total number of shares outstanding.
In order to obtain the most accurate estimate of the company value, we decided
to value the company in a sum-of-the-parts basis instead of taking the company
as a whole approach. To be able to execute such task each sector of the
company was separately valued and future forecasts were made using different
growth drivers depending on the sector where they were performed. Both of the
sectors where the company operates: the distribution sector and the IT sector
were also subdivided, the distribution sector in booking and non-booking, and the
IT sector in transactional and non-transactional segment.
To be able to predict the percentage that each of this sectors and sub-sectors will
account for in the future of the company we had to estimate the future revenues
of each one of this sectors and sub-sectors.
Exhibit 28: Average Fee per Booking (€)
Exhibit 29: Amadeus Number of
Bookings
Source:Nova Equity Research
Source:Nova Equity Research

AMADEUS IT HOLDINGS COMPANY REPORT
THIS DOCUMENT IS NOT AN INVESTMENT RECOMMENDATION AND SHALL BE USED
EXCLUSIVELY FOR ACADEMIC PURPOSES (SEE DISCLOSURES AND DISCLAIMERS AT END OF DOCUMENT)
GDS - Global Distribution System CRS – Computer Reservation System
OTA-Online Travel Agencies PAGE 20/29 F2F- Face to face business
REVENUES FORECAST
We started by forecasting the revenues of the booking segment, which were
obtained by multiplying the predicted average fee of each booking by the total
number of booking predicted for that year. The average fee of each booking was
forecasted by adding the inflation rate expected for that period of time while the
number of booking was estimated by first calculating the total number of bookings
in the travel market using the formula NºBookings(n) = NºBookings(n-1)*(Air
Traffic Growth Rate Weighted Average) and finally multiplying this value by the
expected market share of Amadeus in the distribution sector. Since the non-
bookings segment revenue derivate from fees charged to only have access to
the technology content available on the Amadeus platform we decided to forecast
this revenue by only adding the inflation rate expected for that period to the value
of the previous year. In the IT sector, revenues were forecasted as a whole
instead of being divided by segments, because the non-transactional revenue is
very unstable and only accounts for a minor percentage of the total revenue of
the sector, therefore the total revenue for the sector for the next years was
calculated using as a growth rate a weighted arithmetic average of the last three
years. The reporting currency of Amadeus is the Euro and as a result of the
multinational orientation of the business it is subject to foreign exchange rate
risks derived from the fluctuations of many currencies. Their foreign exchange
hedging strategy is to protect the EUR value of the consolidated foreign currency
denominated operating cash flows. In order to do that their strategy for USD
exposures is to use a natural hedge by matching future USD denominated
operating cash flows with the USD payments of principals of the USD
denominated debt. The other main foreign currencies the company is exposed
are expenditures denominated in GBP, AUD and SEK and in order to hedge a
significant amount of the short exposures (net expenditures) the company uses
derivative contracts with banks such as: currency forwards, currency options and
combinations of currency options.
OPERATING COSTS FORECAST
The cost of revenue was forecasted by using a percentage target of the total
revenues, since it is internal policy of the company to aim at a total cost of
revenue around 25.2% of the entire value of the revenues. Personnel and related
Exhibit 30: Distribution Sector Revenue
Exhibit 31: IT sector Revenue
Source:Nova Equity Research
Source:Nova Equity Research
Exhibit 32: Total Distribution Rev (thou)
Source: Nova Equity Research
Exhibit 33: Total IT Rev (thou)
Source: Nova Equity Research
AMADEUS IT HOLDINGS COMPANY REPORT
THIS DOCUMENT IS NOT AN INVESTMENT RECOMMENDATION AND SHALL BE USED
EXCLUSIVELY FOR ACADEMIC PURPOSES (SEE DISCLOSURES AND DISCLAIMERS AT END OF DOCUMENT)
GDS - Global Distribution System CRS – Computer Reservation System
OTA-Online Travel Agencies PAGE 21/29 F2F- Face to face business
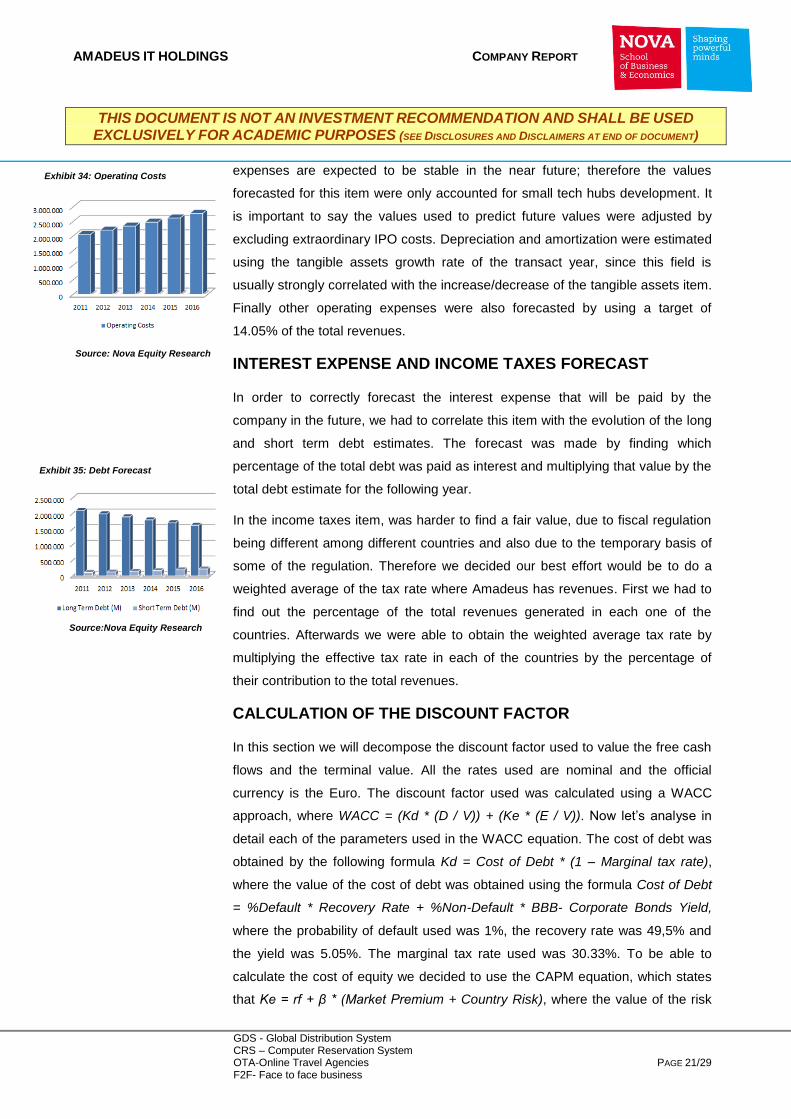
expenses are expected to be stable in the near future; therefore the values
forecasted for this item were only accounted for small tech hubs development. It
is important to say the values used to predict future values were adjusted by
excluding extraordinary IPO costs. Depreciation and amortization were estimated
using the tangible assets growth rate of the transact year, since this field is
usually strongly correlated with the increase/decrease of the tangible assets item.
Finally other operating expenses were also forecasted by using a target of
14.05% of the total revenues.
INTEREST EXPENSE AND INCOME TAXES FORECAST
In order to correctly forecast the interest expense that will be paid by the
company in the future, we had to correlate this item with the evolution of the long
and short term debt estimates. The forecast was made by finding which
percentage of the total debt was paid as interest and multiplying that value by the
total debt estimate for the following year.
In the income taxes item, was harder to find a fair value, due to fiscal regulation
being different among different countries and also due to the temporary basis of
some of the regulation. Therefore we decided our best effort would be to do a
weighted average of the tax rate where Amadeus has revenues. First we had to
find out the percentage of the total revenues generated in each one of the
countries. Afterwards we were able to obtain the weighted average tax rate by
multiplying the effective tax rate in each of the countries by the percentage of
their contribution to the total revenues.
CALCULATION OF THE DISCOUNT FACTOR
In this section we will decompose the discount factor used to value the free cash
flows and the terminal value. All the rates used are nominal and the official
currency is the Euro. The discount factor used was calculated using a WACC
approach, where WACC = (Kd * (D / V)) + (Ke * (E / V)). Now let’s analyse in
detail each of the parameters used in the WACC equation. The cost of debt was
obtained by the following formula Kd = Cost of Debt * (1 – Marginal tax rate),
where the value of the cost of debt was obtained using the formula Cost of Debt
= %Default * Recovery Rate + %Non-Default * BBB- Corporate Bonds Yield,
where the probability of default used was 1%, the recovery rate was 49,5% and
the yield was 5.05%. The marginal tax rate used was 30.33%. To be able to
calculate the cost of equity we decided to use the CAPM equation, which states
that Ke = rf + β * (Market Premium + Country Risk), where the value of the risk
Exhibit 34: Operating Costs
Exhibit 35: Debt Forecast
Source:Nova Equity Research
Source: Nova Equity Research

AMADEUS IT HOLDINGS COMPANY REPORT
THIS DOCUMENT IS NOT AN INVESTMENT RECOMMENDATION AND SHALL BE USED
EXCLUSIVELY FOR ACADEMIC PURPOSES (SEE DISCLOSURES AND DISCLAIMERS AT END OF DOCUMENT)
GDS - Global Distribution System CRS – Computer Reservation System
OTA-Online Travel Agencies PAGE 22/29 F2F- Face to face business
free rate used was the German bunds yield, the levered beta for Amadeus was
obtained by regressing the stock returns against EuroSTOXX50 index returns.
After calculating the regression the value founded to the beta was 0.65, which
tells us that Amadeus tends to have smaller oscillations in their stock price than
the EUROSTOXX50 index. The widely accepted range for market premium
values tends to be between 4%-6%, therefore due to the macroeconomic
environment currently lived in Europe and the strong correlation between
recession scenarios and high market risk premiums we decided to use the top
value of our range: 6%.
Country risk was obtained by measuring the sovereign debt yields of the
countries Amadeus is exposed to, and after subtracting the yield of the German
bunds to the value of the sovereign debt yields. The sovereign debt yields were
measured over a period of two years in order to reduce the volatility of recent
spikes in the yields of sovereign debt. In our case our gross revenues are only
recognized in three different countries: Spain, France and Germany, so to be
able to obtain only one value as our country risk premium we had to make a
revenue-weighted average of the yields of each country. Below there is a table
with all the data used to process all the calculations above explained, regarding
the country risk premium.
Risk Free Rate (German Bunds yield) Market Premium Country Risk Premium Beta g
2.75% 6% 2.15% 0.65 2.15%
TERMINAL VALUE
In order to determine the terminal value of the company also known as
disposable value, we used the following formula: Terminal Value = FCFF * (1 + g)
/ (WACC – g), where g is the constant rate the company will grow in the future.
To obtain a good estimate of g we decided the best approach would be to
forecast the future values of the nominal GDP growth rate for the near future and
after, forecast what will be the exposure of Amadeus to each region. Our
Cost of Debt Cost of Equity E/V D/V WACC Spain Sov. Debt France Sov. Debt
3.84% 8.03% 69.15% 30.85% 6.74% 5% 3.23%
Table 2: Discount Factor parameters
Source:Nova Equity Research
Table 3: Discount Factor parameters
Source: Nova Equity Research

AMADEUS IT HOLDINGS COMPANY REPORT
THIS DOCUMENT IS NOT AN INVESTMENT RECOMMENDATION AND SHALL BE USED
EXCLUSIVELY FOR ACADEMIC PURPOSES (SEE DISCLOSURES AND DISCLAIMERS AT END OF DOCUMENT)
GDS - Global Distribution System CRS – Computer Reservation System
OTA-Online Travel Agencies PAGE 23/29 F2F- Face to face business
assumptions regarding the GDP growth of Amadeus were that the company will
have an exposure to the Euro Area GDP growth of 80% and an exposure to the
World GDP growth of 20%. Below there is a table with all the forecasts regarding
g.
GDP Growth (%) 2012 2013 2014 2015 2016 Avg
Euro Area 1.09% 1.53% 1.69% 1.71% 1.72% 1.55%
World 4% 4.47% 4.69% 4.80% 4.86% 4.56%
As can be seen by all data provided at Table 4 we arrive at a final value for g of
2.15%. Our terminal value accounts for around 80% of the enterprise value,
which is not uncommon for companies that are tech dependent like Amadeus
and are present in markets that have not matured yet.
MULTIPLE SCENARIOS
Due to the volatility currently present in the economy we decided it would not be
prudent to only use a base scenario to predict our future cash flows where
everything goes as expected and historical data proves to be reliable. Instead we
developed three different scenarios: a crisis scenario with 15% of probability of
happening, a better than expected scenario with 5% of probability and a base
scenario where everything goes accordingly to plan as was said before with a
probability of 80%. The main parameters that were changed from scenario to
scenario were the drivers that are responsible for increasing or decreasing the
revenue of each sector. In the distribution sector the key driver that was
accounted for was the air traffic growth and in the IT sector the key driver was
the total number of contracted airlines. Below we have a table with the growth
rate of the key drivers for each one of the scenarios developed.
% Air Traffic Growth Rate Contracted Airlines Growth Rate
Crisis Scenario 0.51% 4.5%
Base Scenario 4.97% 9%
Boom Scenario 5.97% 11%
Table 4: GDP Growth Rate
Source:Nova Equity Research
Table 5: Key Drivers Growth rate for multiple scenarios
Source:Nova Equity Research

AMADEUS IT HOLDINGS COMPANY REPORT
THIS DOCUMENT IS NOT AN INVESTMENT RECOMMENDATION AND SHALL BE USED
EXCLUSIVELY FOR ACADEMIC PURPOSES (SEE DISCLOSURES AND DISCLAIMERS AT END OF DOCUMENT)
GDS - Global Distribution System CRS – Computer Reservation System
OTA-Online Travel Agencies PAGE 24/29 F2F- Face to face business
The final FCFF considered for our valuation was obtained by doing a weighted
average of the FCFF calculated in each scenario accordingly to weights
previously defined. We have also included all the data used to obtain the final
value of the FCFF as an annex.
Conclusion
Current macroeconomic conditions are not what could be called stable at the
moment, from the Europe sovereign debt turmoil to the emerging markets growth
slowdown a lot of uncertain is still pairing in the air. Despite all this turbulence
there are good news for Amadeus IT Holdings, since the World GDP growth is
expected to pick up from 2012 onwards and as was explained above there is a
strong correlation between GDP growth and the key drivers responsible for the
growth in the sectors the company operates.
Taking a closer look to both sectors where Amadeus operates: distribution and IT
solutions we can easily see the company is the global leader in both of them and
not only expects to remain the global leader but also to increase the margin of
their lead. In the distribution sector Amadeus already holds a market share of
around 37% and this value is expected to grow to 39% until 2016. In the IT sector
the company is also the global leader with 30% of the passengers boarded
during 2010 being processed by Amadeus software and expecting to almost
double this number to 700 million in 2014. In spite of already having this
advantage in the IT sector the company still has a lot of room to grow since they
are currently working on expanding their portfolio of IT solutions to the hotel, rail
and airport business in the very short term.
On the debt front the company has also used the money collected during the
IPO and from the sale of OPODO to substantially reduce their debt levels. In the
last two years the company went from having 4.3€ billion of debt to 2.2€ billion.
Finally after taking into account every variable we thought should be accounted
for we arrived at an expected value per share of 16.04€, which represents a
potential upside of 27.6% from the current price of the company. Despite not
yielding a huge premium our valuation took into account moderate scenarios,
which means we used mild forecasts for each of the growth drivers and therefore
if the valuation falls short of the expectations it should be on the low side.
AMADEUS IT HOLDINGS COMPANY REPORT
THIS DOCUMENT IS NOT AN INVESTMENT RECOMMENDATION AND SHALL BE USED
EXCLUSIVELY FOR ACADEMIC PURPOSES (SEE DISCLOSURES AND DISCLAIMERS AT END OF DOCUMENT)
GDS - Global Distribution System CRS – Computer Reservation System
OTA-Online Travel Agencies PAGE 25/29 F2F- Face to face business
References
Mckinsey & Company Inc. 2010. Valuation: Measuring and Managing the value
of companies.
Damodaran, Aswath. 2006. Damodaran on Valuation: Analysis for Investment
and Corporate Finance.
Damodaran, Aswath. 2002. Investment Valuation: Tools and Techniques for
Determining the Value of Any Asset.
Mckinsey & Company Inc. 2010. Value: The Four Cornerstone of Corporate
Finance
IATA. 2011. “Industry Outlook Presentation September 2011”.
Oxford Economics. 2011. “The Travel Gold Rush 2020”.
PhoCusWright. 2009. “The role and Value of the Global Distribution Systems in
Travel Distribution”.
Internet World Stats. 2011. “Internet Users in the World Distribution by World
Regions”.
Boeing. 2010. “Current Market Outlook 2011-2030”.
PhoCusWright. 2010. “Technology and Independent Distribution in the European
Travel Industry”.
DKMA. 2007. “Global Traffic Forecast 2006-2025”.
Fitzgerald, Chicke. 2011. “Who is the biggest GDS?”

AMADEUS IT HOLDINGS COMPANY REPORT
THIS DOCUMENT IS NOT AN INVESTMENT RECOMMENDATION AND SHALL BE USED
EXCLUSIVELY FOR ACADEMIC PURPOSES (SEE DISCLOSURES AND DISCLAIMERS AT END OF DOCUMENT)
GDS - Global Distribution System CRS – Computer Reservation System
OTA-Online Travel Agencies PAGE 26/29 F2F- Face to face business
Appendix
Financial Statements
(in thousands) 2012 2013 2014 2015 2016
Revenue 3.002.604 3.232.892 3.473.366 3.734.835 4.010.732
Cost of Revenue (756.656) (814.689) (875.288) (941.178) (1.010.704)
Personnel and related expenses (665.901) (679.219) (692.803) (706.659) (720.792)
Depreciation and Amortization (362.562) (394.008) (421.112) (449.104) (485.079)
Other Operating Expenses (421.754) (454.100) (487.878) (524.605) (563.358)
Operating Income (EBIT) 795.732 890.876 996.284 1.113.288 1.230.798
Interest Expense (123.537) (118.646) (114.145) (110.120) (106.541)
Exchange Gains - - - - -
Other Income 815 1.510 1.667 1.774 1.954
Profit before Income taxes (EBT) 673.011 773.740 883.807 1.004.943 1.126.212
Income Taxes (202.377) (232.377) (265.764) (302.190) (338.656)
Profit after taxes 470.634 541.073 618.043 702.753 787.555
Share in profit from associates and joint
ventures
5.000 5.000 5.000 5.000 5.000
Profit from continuing operations 475.634 546.073 623.043 707.753 792.555
Profit from discontinuing operations - - - - -
PROFIT FOR THE YEAR 475.634 546.073 623.043 707.753 792.555
(in thousands) 2012 2013 2014 2015 2016
(+)Net Income 475.634 546.073 623.043 707.753 792.555
(+)Depreciation 362.562 394.008 421.112 449.104 485.079
(+)Change in Operating Assets (32.520) (35.000) (33.226) (39.798) (41.106)
(+)Change in Operating Liabilities 45.873 47.834 42.187 55.614 56.099
CASH FLOW FROM OPERATING ACTIVITIES 851.549 952.915 1.053.116 1.172.673 1.292.628
(-)Capex (390.052) (429.063) (479.341) (515.500) (552.329)
(-)Other Financial Investments (19.912) (35.128) (39.229) (19.093) (29.974)
(+)Other cash flows from operating activities 79.010 88.274 92.487 104.930 108.136
CASH FLOW FROM OPERATING ACTIVITIES (329.952) (375.917) (426.083) (429.664) (474.168)
(+)Change in equity (135.634) (429.073) (509.043) (601.753) (688.555)
(+)Increase in Debt (87.512) (80.545) (72.024) (64.043) (55.923)
CASH FLOW FROM FINANCING ACTIVITIES (223.145) (509.619) (581.066) (665.796) (744.478)
Change in cash 298.451 67.380 45.967 77.213 73.982
Initial cash 350.000 648.451 715.831 761.798 839.011
Ending cash 648.451 715.831 761.831 839.011 912.9
Table 6: Income Statement
Source: Nova Equity Research
Table 7: Cash Flow Statement
Source: Nova Equity Research

AMADEUS IT HOLDINGS COMPANY REPORT
THIS DOCUMENT IS NOT AN INVESTMENT RECOMMENDATION AND SHALL BE USED
EXCLUSIVELY FOR ACADEMIC PURPOSES (SEE DISCLOSURES AND DISCLAIMERS AT END OF DOCUMENT)
GDS - Global Distribution System CRS – Computer Reservation System
OTA-Online Travel Agencies PAGE 27/29 F2F- Face to face business
2012 2013 2014 2015 2016
Goodwill 2.000.000 2.000.000 2.000.000 2.000.000 2.000.000
INTANGIBLE ASSETS 1.590.547 1.600.749 1.633.312 1.666.722 1.700.947
TANGIBLE ASSETS 361.268 386.120 411.786 444.772 477.797 Investments in joint ventures and associate 17.313 18.589 20.145 21.572 23.170
Other non-current financial assets 44.825 48.850 53.007 56.606 60.774 Non-current financial derivative financial assets 0 0 0 0 0
Deferred tax assets 61.692 65.448 70.152 75.933 81.442
Other non-current assets 0 0 0 0 0
TOTAL NON-CURRENT ASSETS 4.075.645 4.119.757 4.188.403 4.265.604 4.344.130
Trade accounts receivable 247.060 266.655 281.567 305.217 327.787
Income taxes receivable 45.569 50.668 56.164 58.981 63.398
TRADE AND OTHER RECEIVABLES 292.629 317.323 337.731 364.198 391.185
Other current financial assets 9.909 14.589 15.703 16.591 17.863
Current derivative financial assets 7.240 7.771 8.659 9.122 9.811
Other current assets 154.236 164.541 177.360 190.691 204.810
Cash and cash equivalents 648.451 715.831 761.798 839.011 912.993
Assets classified as held for sale 167.828 188.687 215.498 222.433 239.172
TOTAL CURRENT ASSETS 1.280.292 1.408.743 1.516.748 1.642.047 1.775.834
TOTAL ASSETS 5.355.937 5.528.500 5.705.151 5.907.652 6.119.964
EQUITY 1.440.000 1.557.000 1.671.000 1.777.000 1881.000
Non-current provisions 37.356 40.838 44.377 47.277 50.785
Non-current debt 1.995.000 1.895.000 1.800.488 1.710.463 1.624.940
Other non-current financial liabilities 34.983 37.517 40.397 43.405 46.622 Other non-current derivative financial liabilities 78.999 79.993 78.719 89.250 96.084
Deferred tax liabilities 640.888 687.887 734.740 793.351 851.697
Other non-current liabilities 42.207 45.415 51.108 53.794 57.727
TOTAL NON-CURRENT LIABILITIES 2.829.433 2.786.900 2.749.830 2.737.540 2.727.855
Current Provisions 27.424 29.472 31.439 33.886 36.418
Current Debt 128.040 147.244 169.983 195.964 225.565
Other current financial liabilities 146.555 159.418 171.317 183.774 197.372 Other current derivative financial liabilities 35.064 36.854 41.590 43.765 47.047
Trade accounts payable 600.196 647.770 688.941 743.423 798.767
Income taxes payable 10.007 10.267 11.283 12.416 13.171
Other current liabilities 74.291 80.820 86.525 92.938 99.843
Liabilities associated with assets classified as held for sale 64.928 72.755 83.244 86.947 92.927
TOTAL CURRENT LIABILITIES 1.086.505 1.184.600 1.284.321 1.393.112 1.511.109
TOTAL LIABILITIES 3.915.937 3.971.500 4.034.151 4.130.652 4.238.964
TOTAL EQUITY AND LIABILITIES 5.355.937 5.528.500 5.705.151 5.907.652 6.119.964
Table 8: Balance Sheet Statement
Source: Nova Equity Research

AMADEUS IT HOLDINGS COMPANY REPORT
THIS DOCUMENT IS NOT AN INVESTMENT RECOMMENDATION AND SHALL BE USED
EXCLUSIVELY FOR ACADEMIC PURPOSES (SEE DISCLOSURES AND DISCLAIMERS AT END OF DOCUMENT)
GDS - Global Distribution System CRS – Computer Reservation System
OTA-Online Travel Agencies PAGE 28/29 F2F- Face to face business
(thousands) 2012 2013
2014 2015 2016
EBIT*(1-t) 571.793 653.865 746.052 850.597 958.289
Depreciation 362.562 394.008 421.112 449.104 485.079
Capex (390.052) (429.063) (479.341) (515.500) (552.329)
Net Working Capital (193.787) (224.143) (232.427) (248.936) (264.725)
FCFF 350.516 394.668 455.396 535.265 626.314
Terminal Value 13.944.223
Discounted FCFF 328.388 346.412 374.482 412.373 452.058
(thousands) 2012 2013 2014 2015 2016
EBIT*(1-t) 509.758 521.552 534.795 550.248 558.671
Depreciation 362.562 394.008 421.112 449.104 485.079
Capex (390.052) (429.063) (479.341) (515.500) (552.329)
Net Working Capital (193.787) (224.143) (232.427) (248.936) (264.725)
FCFF 288.482 262.355 244.139 234.916 226.696
Terminal Value 3.642.906
Discounted FCFF 270.270 230.277 200.761 180.981 163.624
(thousands) 2012 2013 2014 2015 2016
EBIT*(1-t) 556.452 622.452 696.698 778.518 860.692
Depreciation 362.562 394.008 421.112 449.104 485.079
Capex (390.052) (429.063) (479.341) (515.500) (552.329)
Net Working Capital (193.787) (224.143) (232.427) (248.936) (264.725)
FCFF 335.174 363.788 406.042 463.186 528.717
Terminal Value 11.771.326
Discounted FCFF 294.193 299.151 312.819 334.316 357.524
Crisis Scenario Base Scenario Boom Scenario
Enterprise Value 3.675.272 10.094.252 11.978.306
Net Debt 2.046.598 2.046.598 2.046.598
Equity Value 1.628.674 8.047.655 9.931.708
Value per Share 3.64 17.98 22.19
Potential Upside (71.12%) 42.70% 76.11%
Table 9:Boom Scenario FCFF
Source: Nova Equity Research
Table 10: Crisis Scenario FCFF
Source:Nova Equity Research
Table 11: Base Scenario FCFF
Source: Nova Equity Research
Table 12: Multiple Scenarios Valuation
Source: Nova Equity Research

AMADEUS IT HOLDINGS COMPANY REPORT
THIS DOCUMENT IS NOT AN INVESTMENT RECOMMENDATION AND SHALL BE USED
EXCLUSIVELY FOR ACADEMIC PURPOSES (SEE DISCLOSURES AND DISCLAIMERS AT END OF DOCUMENT)
GDS - Global Distribution System CRS – Computer Reservation System
OTA-Online Travel Agencies PAGE 29/29 F2F- Face to face business
Disclosures and Disclaimer
Research Recommendations
Buy Expected total return (including dividends) of more than 15% over a 12-month period.
Hold Expected total return (including dividends) between 0% and 15% over a 12-month period.
Sell Expected negative total return (including dividends) over a 12-month period.
This report was prepared by a Masters of Finance student, following the Equity Research – Field Lab Work Project, exclusively for academic purposes. Thus, the author, which is a Masters in Finance student, is the sole responsible for the information and estimates contained herein and for the opinions expressed, which reflect exclusively his/her own personal judgement. All opinions and estimates are subject to change without notice. NOVA SBE or its faculty accepts no responsibility whatsoever for the content of this report nor for any consequences of its use. The information contained herein has been compiled by students from public sources believed to be reliable, but NOVA SBE or the students make no representation that it is accurate or complete, and accept no liability whatsoever for any direct or indirect loss resulting from the use of this report or its content. The author hereby certifies that the views expressed in this report accurately reflect his/her personal opinion about the subject company and its securities. He/she has not received or been promised any direct or indirect compensation for expressing the opinions or recommendation included in this report. The author of this report may have a position, or otherwise be interested, in transactions in securities which are directly or indirectly the subject of this report. NOVA SBE may have received compensation from the subject company during the last 12 months related to its fund raising program. Nevertheless, no compensation eventually received by NOVA SBE is in any way related to or dependent on the opinions expressed in this report. The NOVA School of Business and Economics does not deal for or otherwise offers any investment or intermediation services to market counterparties, private or intermediate customers. This report is not an investment recommendation as defined by Article 12.º-A of the Código do Mercado de Valores Mobiliários. The students of NOVA School of Business and Economics are not registered with Comissão do Mercado de Valores Mobiliários as financial analysts, financial intermediaries or entities or persons offering any services of financial intermediation, to which Regulamento 3.º/2010 of CMVM would be applicable. This report may not be reproduced, distributed or published without the explicit previous consent of its author, unless when used by NOVA SBE for academic purposes only. At any time, NOVA SBE may decide to suspend this report reproduction or distribution without further notice.