04-038 concept mapping
TRANSCRIPT

8/13/2019 04-038 Concept Mapping
http://slidepdf.com/reader/full/04-038-concept-mapping 1/24

8/13/2019 04-038 Concept Mapping
http://slidepdf.com/reader/full/04-038-concept-mapping 2/24
76 Maas and Leauby
INTRODUCTION
T
he accounting profession has generated a litany of calls demanding that accounting educationchange the content covered, teaching methods used, pedagogies employed, and explicitly
develop professional competencies and skills (AAA, 1986; Perspectives, 1989; AECC, 1990;Kimmel, 1995; Porter and Carr, 1999; AICPA, 2000a; AICPA, 2000b; Demski and Zimmerman,2000; Albrecht and Sack, 2000). In 1995, Kimmel observed, “traditional accounting programs
emphasize algorithmic exercises and focuses excessively on development of rote knowledge” (p.
299). Albrecht and Sack (2000) described this as a “perilous” state of accounting education,
observing that educators do not promote meaningful learning in the classroom and have failed todevelop students’ thinking skills. Even the AACSB, the premier business school and accounting
program accreditation body, revised its standards by emphasizing mission-based strategic planning
and recognized the need for continuous curriculum improvements to meet the needs of the profession. Clearly, as accounting educators, we must take these charges and concerns seriously.
Concept mapping, an approach discussed in this paper, is one way to implement a classroom
pedagogy that promotes meaningful learning and also helps develop students’ thinking skills.
What is Concept Mapping?
Concept mapping is an innovative classroom tool and technique that can deepen our
curricula as students advance through an accounting program. It is an enabling skill to enhance thedevelopment of students’ thinking skills through more meaningful learning activities. By “enabling”
we mean that the skill, once learned, can help students to organize what they know and think in more
complex ways.Concept maps are drawings or diagrams that show the mental connections and association
patterns a student makes on knowledge learned (Angelo and Cross, 1993). In its simplest form, a
concept map is only two concepts connected by a linking word (Novak and Gowin, 1984). For example, “accounting requires complex thinking” represents a simple map forming a valid statement
about the concepts “accounting” and “complex thinking.” The art of externalizing knowledge,
through drawings or diagrams in the form of concept maps, is called concept mapping. Figure 1illustrates this simple concept map.
Figure 1. Illustration of a simple concept map.
8/13/2019 04-038 Concept Mapping
http://slidepdf.com/reader/full/04-038-concept-mapping 3/24
Concept Mapping 77
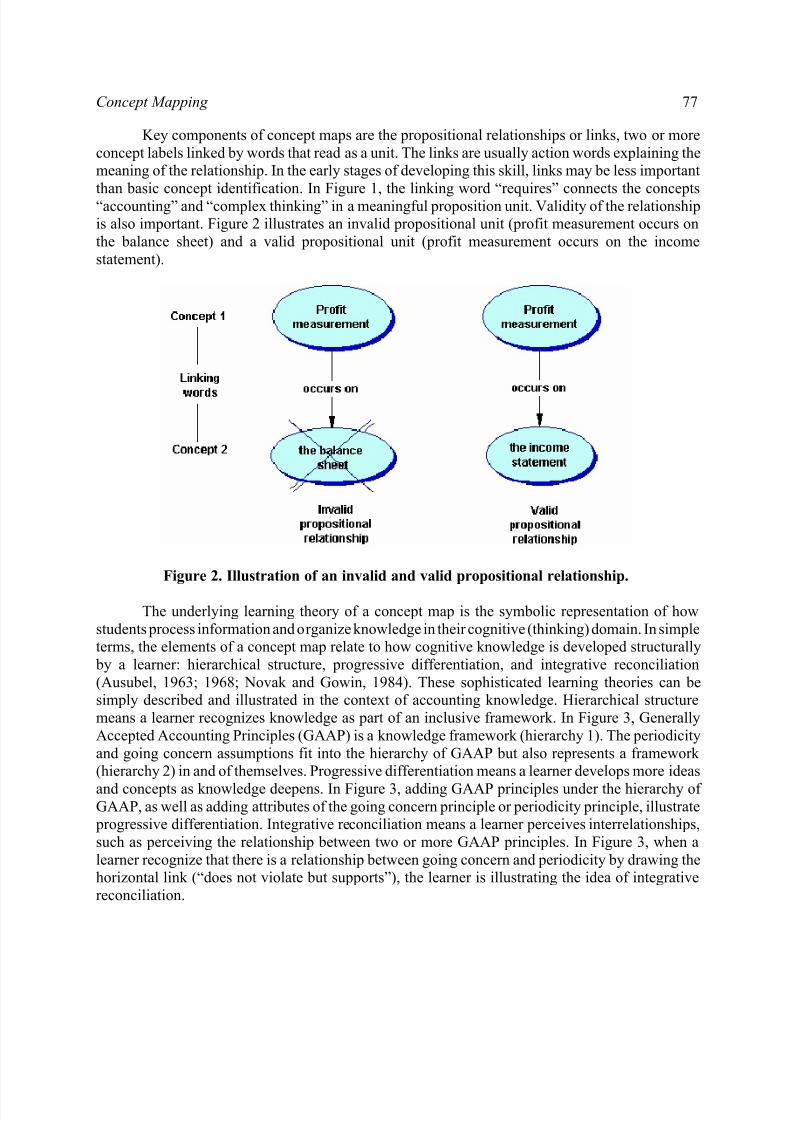
Key components of concept maps are the propositional relationships or links, two or more
concept labels linked by words that read as a unit. The links are usually action words explaining themeaning of the relationship. In the early stages of developing this skill, links may be less important
than basic concept identification. In Figure 1, the linking word “requires” connects the concepts“accounting” and “complex thinking” in a meaningful proposition unit. Validity of the relationshipis also important. Figure 2 illustrates an invalid propositional unit (profit measurement occurs on
the balance sheet) and a valid propositional unit (profit measurement occurs on the income
statement).
Figure 2. Illustration of an invalid and valid propositional relationship.
The underlying learning theory of a concept map is the symbolic representation of how
students process information and organize knowledge in their cognitive (thinking) domain. In simpleterms, the elements of a concept map relate to how cognitive knowledge is developed structurally
by a learner: hierarchical structure, progressive differentiation, and integrative reconciliation
(Ausubel, 1963; 1968; Novak and Gowin, 1984). These sophisticated learning theories can besimply described and illustrated in the context of accounting knowledge. Hierarchical structure
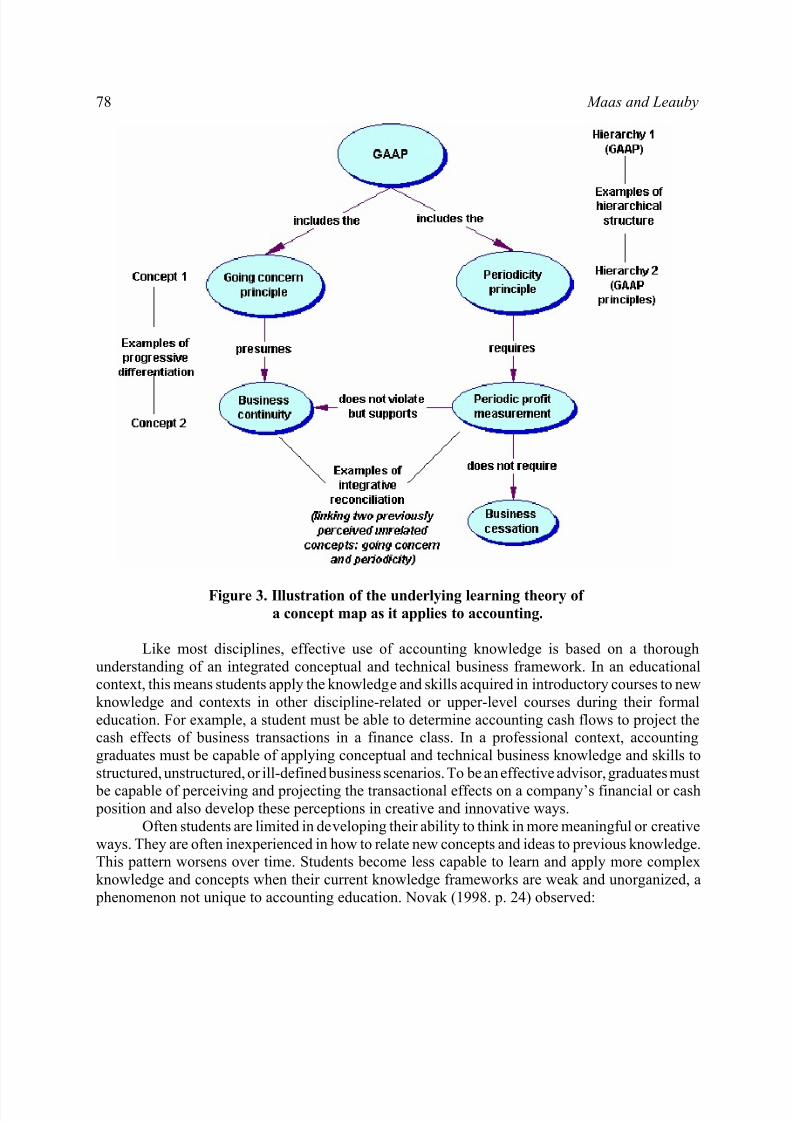
means a learner recognizes knowledge as part of an inclusive framework. In Figure 3, Generally
Accepted Accounting Principles (GAAP) is a knowledge framework (hierarchy 1). The periodicity
and going concern assumptions fit into the hierarchy of GAAP but also represents a framework (hierarchy 2) in and of themselves. Progressive differentiation means a learner develops more ideas
and concepts as knowledge deepens. In Figure 3, adding GAAP principles under the hierarchy of GAAP, as well as adding attributes of the going concern principle or periodicity principle, illustrate progressive differentiation. Integrative reconciliation means a learner perceives interrelationships,
such as perceiving the relationship between two or more GAAP principles. In Figure 3, when a
learner recognize that there is a relationship between going concern and periodicity by drawing thehorizontal link (“does not violate but supports”), the learner is illustrating the idea of integrative
reconciliation.
8/13/2019 04-038 Concept Mapping
http://slidepdf.com/reader/full/04-038-concept-mapping 4/24
78 Maas and Leauby
Figure 3. Illustration of the underlying learning theory of
a concept map as it applies to accounting.
Like most disciplines, effective use of accounting knowledge is based on a thorough
understanding of an integrated conceptual and technical business framework. In an educationalcontext, this means students apply the knowledge and skills acquired in introductory courses to new
knowledge and contexts in other discipline-related or upper-level courses during their formal
education. For example, a student must be able to determine accounting cash flows to project thecash effects of business transactions in a finance class. In a professional context, accounting
graduates must be capable of applying conceptual and technical business knowledge and skills to
structured, unstructured, or ill-defined business scenarios. To be an effective advisor, graduates must
be capable of perceiving and projecting the transactional effects on a company’s financial or cash position and also develop these perceptions in creative and innovative ways.
Often students are limited in developing their ability to think in more meaningful or creative
ways. They are often inexperienced in how to relate new concepts and ideas to previous knowledge.This pattern worsens over time. Students become less capable to learn and apply more complex
knowledge and concepts when their current knowledge frameworks are weak and unorganized, a
phenomenon not unique to accounting education. Novak (1998. p. 24) observed:

8/13/2019 04-038 Concept Mapping
http://slidepdf.com/reader/full/04-038-concept-mapping 5/24
Concept Mapping 79
The more we learn and organize knowledge in a given domain, the easier it is to
acquire and use new knowledge in that domain. The curse is that when we try tolearn new knowledge in a domain where we know little, and/or what we know is
poorly organized, meaningful learning is difficult, usually time consuming and tiring.Too often, we may escape the challenge by resorting to rote learning, even thoughwe know that what we learn will soon be forgotten and it will not be of value in
future learning.
Novak’s observations seem common knowledge among us as accounting educators. Indeed,these issues have been at the heart of concern to the accounting profession over the last two decades.
If we are committed to include meaningful learning activities to help develop students’ thinking
skills as educators, then we must seriously consider concept mapping as a viable classroom-learningtool.
The research findings and implications for accounting educators are discussed in the next
section of the paper. Following the research findings and implications are ideas for integratingconcept mapping in the accounting classroom. This latter section offers ready-to-use maps, a step-
by-step discussion of how to introduce concept mapping to students, possible learning outcomes
based on a preliminary research study, and constraints. The paper concludes with a summary of the
benefits of concept mapping and the call for further research to transfer those benefits to accountingeducation.
RESEARCH FINDINGS AND IMPLICATIONS
FOR ACCOUNTING EDUCATION
In this section, the major research findings are documented from a variety of disciplines. In
addition, the relevant implications of these findings are linked to accounting education.
Research Findings
The idea of “concept mapping” was first introduced by Joseph Novak to enhance conceptlearning in science education. Ausubel’s assimilation learning theory (1963; 1968), mentioned
briefly in our introduction, heavily influenced Novak’s work and provided the learning theory from
which concept mapping was born. In perhaps the most classic concept mapping research published,
Novak and Gowin (1984) defined concept mapping as an educational tool developed “specificallyto tap into a learner’s cognitive structure and to externalize, for both the learner and the teacher to
see, what the learner already knows” (p. 40). This research focused on using concept mapping to
enable learners to acquire their own meaning of science concepts (analogous to basic accountingconcepts), finding that concept maps were remarkably revealing of students’ perceived knowledge.
We now see that concept maps can play a role in teaching, learning, curriculum, andgovernance. For the learner, they help to make evident the key concepts and
propositions to be learned, and also suggest, linkages between the new knowledge
and that which he or she already knows. For the teacher, concept maps can be used
to determine pathways for organizing meanings and for negotiating meanings withstudents, as well as to point out students’ misconceptions. In curriculum planning
and organization, concept maps are useful for separating significant from trivial
information and for choosing examples. With respect to governance, concept maps

8/13/2019 04-038 Concept Mapping
http://slidepdf.com/reader/full/04-038-concept-mapping 6/24
80 Maas and Leauby
may help students understand their role as learners; they also clarify the teacher’s
role and create a learning atmosphere of mutual respect…(pp. 22-23)
Over time, the effective use and versatility of concept mapping has been further documentedin a wide range of disciplines (e.g., art, history, literature, marketing, math, music, religion, biology,ecology, social sciences, and sports). As such, our discussion of the existing research focuses on the
following five themes: (1) to understand what students know and help them organize and build
frameworks of knowledge, (2) to build bridges and promote students’ thinking about relationships
between concepts and ideas, (3) to tackle more complex tasks and promote development of higher-order thinking skills, (4) to integrate effective pedagogical tools to promote meaningful learning,
and (5) to promote competency in using computer-based visual learning tools.
Concept mapping helps educators understand what students know by the process of externalizing this knowledge; it provides an observable and assessable record of the student’s
conceptual schemata and starting knowledge points (Angelo and Cross, 1993). This is the foundation
of Novak and Gowin’s (1984) initial work and a strong common thread through the relatedliterature. It also helps students organize information and build better frameworks of knowledge,
which is critical as new knowledge is acquired. Concept mapping is a visual learning tool that
corresponds to thinking processes, allowing students to organize ideas and read, write, and think
better. It also provides a technique to organize knowledge into a progressively more complexconceptual framework (Hyerle, 1996; Jonassen, et al., 1997).
Concept mapping supports the idea of building better frameworks of knowledge by
enhancing the relationship-building between concepts and ideas. It serves as a pedagogical deviceto encourage learners to visualize interrelationships, to identify misconceptions, and to build bridges
between two concepts or ideas (Cross and Steadman, 1996); a powerful learning strategy to force
a learner to think actively about the relationship between terms (Dorough and Rye, 1997). Its usein post-secondary education emerges in this theme, illustrating its effectiveness in bridging the gap
for students between critical ideas of information as an object and information as sense-making
(Todd and Kirk, 1995). This illustration is analogous to accounting as information and a decision-making tool in our own discipline. Post-secondary data developed by Schau and Mattern (1997)
found statistically significant increases in perceived accuracy of introductory statistical concepts by
continually using mapping techniques. “Students who have ‘isolated’ information about various
statistical concepts, but do not understand how these concepts are interrelated (and differentiated),remain novices. Connected understanding is a prerequisite for effective and efficient statistical
reasoning and problem-solving” (p. 171). Leauby and Brazina (1998) first introduced concept
mapping in teaching college level introductory accounting. This work showed limited resultssuggesting potential effectiveness of concept mapping, and also called for controlled empirical
studies to validate their initial findings. However, none have been published since their proposal.
Using empirical methods, Jegede, Alaiyemola and Okebukola (1990) validated theusefulness of concept mapping activities not only as a way to enhance bridge building in 10 gradeth
biology classes to improve achievement, but to also reduce anxiety in learning. Thus, this study
draws in a very important idea that concept mapping might be effective not only in the more familiar
cognitive domain [as set forth in Bloom’s Taxonomy (1956)] but also in the less often discussed butequally important affective domain [as described by Krathwohl, Bloom and Masia (1964)].
Affective behaviors include such non-cognitive but important learning behaviors as receiving,

8/13/2019 04-038 Concept Mapping
http://slidepdf.com/reader/full/04-038-concept-mapping 7/24
Concept Mapping 81
willingness to receive, responding, and willingness to respond. Stimulated positive affective
behavioral attributes can promote more meaningful learning.The dependent variables in the Jegede, Alaiyemola and Okebukola (1990) study were
achievement and anxiety. Achievement was measured by a 50-item multiple-choice instrument previously validated and anxiety was measured by the Zuckerman’s Affect Adjective Checklist,which asks students to describe how they feel about learning science, i.e. biology in this case). The
results of a control group (n = 29) exposed to traditional instructional methods for biology were
compared to the results of an experimental group (n = 22) on the same instruments, but after the
experimental group had been exposed to concept mapping as the primary instructional strategy. T-tests carried out on the pretest data for both achievement and anxiety showed no significant
difference, leading to the conclusion that the control and experimental groups had equivalent entry
behaviors on the variables, However, using a 2 X 2 analysis of variance on the post-test score, asignificant difference was observed, leading the authors to conclude that concept mapping led to a
significantly greater reduction in anxiety level of students (which in turn led to improved
achievement). While limited, this study adds an interesting new perspective on the value of conceptmapping.
As students acquire more sophisticated sets of knowledge and skills, expectations demand
that they demonstrate an ability to successfully think through and apply their knowledge and skills
to more difficult situations. The literature demonstrates that concept mapping provides a framework to develop a student’s structural knowledge in a domain that, in turn, promotes development of
higher order thinking skills essential for complex learning tasks (Jonassen, et al., 1993; Jonassen,
1996). “Structure is inherent in all knowledge, so understanding the structural foundation of anycontent domain improves comprehension…structural knowledge is essential to problem-solving”
(Jonassen, 2000. p. 61). This tool has also proved effective in small group tasks to help students
resolve more complex assignments (Angelo and Cross, 1993).Under the theme that concept mapping is effective to tackle more complex tasks and promote
development of higher-order thinking skills, there have been some additional observations and
empirical findings. Peresich, Meadows and Sinatra (1990) discuss somewhat astonishing results that point to the effectiveness of using concept mapping across a curriculum and across disciplines as
the primary instructional strategy to improve students’ level of comprehension in basic state-
mandated reading skills assessments tests. In this study, 11 grade student test scores usingth
traditional instruction and concept mapping instruction were observed and compared. Readingcomprehension improved from 77.0% to a 99.2% pass rate, an improvement of 22.2%; written
communication improved from 85% to a 97.5% pass rate, an improvement of 12.5%; theme writing
improved from 47% to a 100% pass rate, an improvement of 53%. Particularly noteworthy aboutthis line of research is the authors’ observations that concept mapping activities significantly
improved students ability to think and work at the three highest domains in Bloom’s (1956)
taxonomy (analysis, synthesis, and evaluation), where higher-order thinking occurs.Beissner (1992) followed this theme using empirical methods, validating the effectiveness
of using concept mapping to promote higher-order problem-solving skills in 52 physical therapy and
8 athletic training college majors. In this study, regression analysis was used to compare the results
on a problem-solving test (dependent variable) given to a control group and an experimental group.A control group (n = 29) studied a 2,000-word text passage using traditional methods while an
experimental group (n = 29) studied the same text passage by drawing concept maps. Regression
analysis showed that there was a significant difference in the problem-solving ability of the
8/13/2019 04-038 Concept Mapping
http://slidepdf.com/reader/full/04-038-concept-mapping 8/24
82 Maas and Leauby
experimental group as compared to the control group. While limited, this study adds further support
suggesting that concept mapping may be an effective means of improving students’ problem-solvingability, an educational outcome highly desired in accounting education
The classroom is a multi-dimensional environment; students learn in different ways anddifferent approaches must be used to help students learn. An important segment of the literaturedemonstrates how concept mapping can be an effective pedagogical tool to support different types
of classroom tasks designed to promote learning: to illustrate major ideas or units during a semester
(Novak and Gowin, 1984), to extract meaning from assigned textbook or other readings (Novak and
Gowin, 1984; Jonassen, 1996), to plan a paper or essay (Novak and Gowin, 1984; Angelo and Cross,1993), to stimulate idea-creation and brainstorming (Ditson et al., 1998), and to wrap up and
synthesize a unit of instruction (Odom and Kelly, 1998). In MBA programs, concept mapping
fundamentals formed the key process by which students synthesized key ideas and lessons learnedfrom course material (Mento et al., 1999; Mento and Jones, 1999).
The last line of research demonstrates the usefulness of concept mapping in a computer-
based environment. “The mechanics of drawing a concept map often get in the way of ideas studentswant to represent. Modern visual outlines [such as visual learning tool technologies] take the eraser
dust out of concept mapping” (Anderson-Inman and Zeitz, 1993, emphasis supplied, p. 6).
Anderson-Inman and Horney (1997) observed the growing popularity of computer-based concept
mapping:
Concept mapping in an electronic environment facilitates the visual thinking that
underlies this form of knowledge representation, making it more accessible and lessfrustrating. In the same way that word processing has revolutionized writing and
writing instruction, computer-based concept mapping is revolutionizing this
important form of visual expression and literacy enhancement. Using a computer tocreate a concept map encourages revisions to correct errors as well as alterations to
reflect changes in thinking over time. The electronic medium is flexible and
forgiving. (p. 302)
Jonassen is a noteworthy contributor in the area of computer-based semantic networking
tools. This contribution to the literature validates concept mapping as a cognitive learning tool to
promote higher-order thinking. In addition, it demonstrates how concept mapping and informationtechnology can be combined to create a powerful tool for meaningful learning in the classroom:
Semantic networking is the process of constructing…concept maps – of identifyingimportant concepts, arranging those concepts spatially, identifying relationships
among those concepts, and labeling the nature of the semantic relationship among
those concepts. These maps are used by learners to represent what they know or arelearning as multidimensional networks of concepts…semantic networking programs
[engage]…learners in critical thinking by engaging them in organizing the
underlying ideas in the content being studied…Any tool that can externalize mental
ideas has to be powerful. (Jonassen, 2000. pp. 59-60)
Table 1 summarizes some of the web sites that offer visual learning tools suitable for concept
mapping and available for 30-day free trials, except where noted. All of the computer-based maps

8/13/2019 04-038 Concept Mapping
http://slidepdf.com/reader/full/04-038-concept-mapping 9/24
Concept Mapping 83
in this paper were prepared using the software Inspiration®, which is clearly the most widely used.
However, there are a myriad of other equally effective classroom-based visual learning tools.
Implications for Accounting EducationThe research findings are persuasive. Concept mapping is an effective and versatile tool thatenhances meaningful learning in the classroom. These findings tell us concept mapping is a well-
entrenched and proven tool across a wide range of disciplines; an effective enabling skill to improve
how students learn, how they interconnect what they learn, and how they develop more sophisticated
thinking skills.
TABLE 1
Web Sites That Offer Visual Learning Tool Technologies for 30-day Free Trials
Name of Software Web Address
Inspiration www.inspiration.com
Smartdraw www.smartdraw.comDecision Explorer www.banxia.com/dexplore/demo.html
SemNet www.biologylessons.sdsu.edu/about/semnetdown.htmlVisual Mind www.visual-mind.com
MindManager X5Pro www.mindjet.com/US/ (21-day trial)
Cmap http://cmap.ihmc.us/
VisiMap Professional www.coco.co.uk/Smart Ideas www2.smarttech.com/st/en-US/Products/SMART+Ideas
As educators, we are challenged to change our teaching methods and to enhance the students’
learning environment. Non-traditional tools, such as concept mapping, hold great promise toimprove what students learn and simultaneously develop the desired thinking skill competencies
demanded by the accounting profession. The underlying learning theory of concept mapping
(hierarchical structure, progressive differentiation, and integrative reconciliation), coupled with itsclassroom versatility, provides a basic foundation to achieving the tall task we face as accounting
educators. If we are committed to developing meaningful learning activities, then serious
consideration should be given to introducing concept mapping as a viable classroom tool early instudents’ formal accounting education.
INTEGRATING CONCEPT MAPPING ACTIVITIES
IN THE ACCOUNTING CLASSROOM
This section provides an overview, drawn from research findings, of how to integrate
concept mapping in the classroom. A few ready-to-use concept maps are provided as a simple way
to introduce concept mapping as a learning tool in accounting. In the body of this section, a step-by-step approach is offered to successfully introduce this skill to students, since the greatest benefits
of concept mapping come when students create their own maps. This step-by-step approach is based
on our own experience and success in using concept mapping in group tasks in our accountingclasses. In addition, this section discusses possible learning outcomes based on an experimental
study as well as constraints that must be considered.

8/13/2019 04-038 Concept Mapping
http://slidepdf.com/reader/full/04-038-concept-mapping 10/24
84 Maas and Leauby
The research findings portray concept mapping as a versatile and enriching tool that can be
used in different ways to achieve classroom-learning tasks. The focus of this paper is using conceptmapping as a conclusion to a unit of instruction (as a learning tool); however, the tool can be used
at any point in the learning process. Figure 4 depicts the three principal points where conceptmapping is useful in fulfilling classroom tasks: as a planning tool (to plan instruction and providestudents with a visualization of what is to be learned and how it connects), as a learning tool (to
reinforce concepts learned in a unit of instruction), or as an evaluation tool (to validate learning by
mapping out a perception of what has been learned).
Figure 4. Concept Mapping Classroom Triangle.
Ready-to-Use Map Inventory
As noted earlier, while Leauby and Brazina (1998) suggested that accounting educators
experiment with concept mapping, to date no empirical studies or new articles are published relatingto concept mapping. The most obvious reason for this lack of experimentation is the amount of time
it takes to learn the methodology, the effort to teach students how to construct concept maps, and
the process to integrate the tool into courses. To jump-start the process, an inventory of twelve
ready-to-use concept maps suitable for introductory accounting courses has been created. Appendix1 describes these maps and provides ideas on using them.
Using the ready-to-use map inventory allows accounting educators to circumvent the amount
of time it takes to introduce concept mapping in the classroom, eliminating the need for either faculty or students to learn the skill. The intent allows instructors to pick ready-to-use maps that
meet their needs and to generate ideas for creating and experimenting with concept maps as
meaningful learning tools. As suggested by Todd and Kirk (1995), introducing concept maps inintroductory courses allows students to gain a skill that can be used throughout their entire college

8/13/2019 04-038 Concept Mapping
http://slidepdf.com/reader/full/04-038-concept-mapping 11/24
Concept Mapping 85
In W atson’s et. al. (2003) accounting ed ucation literature review she no tes, “what is needed most in the accounting1
literature is empirical evidence about ho w to impro ve the educational setting” and “how to integrate technology into
accounting education so as to enhance student learning” (311). B oth of these objectives can be accomp lished by
using concept mapp ing in a rigorously defined experimental setting.
experience and beyond. In addition, further experimentation by faculty and the development of
empirical evidence to support its real benefits may result.The goal in using any concept map is to help supplement what an instructor is already doing
in a course. Students learn from various mediums and the visual impact of concept maps can greatlyimprove meaningful learning. While the design and content of these maps is intended for introductory accounting, the maps are also useful in other accounting courses (i.e., intermediate
accounting).1
A suggested approach offers the ready-to-use maps to a class after finishing a relevant unit
of study. For example, after completing a chapter on basic financial statements, students can be placed in small groups to discuss the purpose of one or more of the financial statements. One of the
ready-to-use maps in the inventory could be used to elaborate and provide additional reinforcement
to the students’ learning process. As an illustration, after a discussion of the statement of cash flows,Map 4 (Click here to open) can summarize and wrap up a discussion of the three principal
components of the statement (operating, investing, and financing). Students could be encouraged
or assigned the task of developing other valid concepts or examples that add breadth and scope tothe map. By using the map as the focal point of discussion, students learn how to organize their
knowledge into useful frameworks supported by the underlying learning theory of concept mapping:
hierarchy, progressive differentiation, and integrative reconciliation.
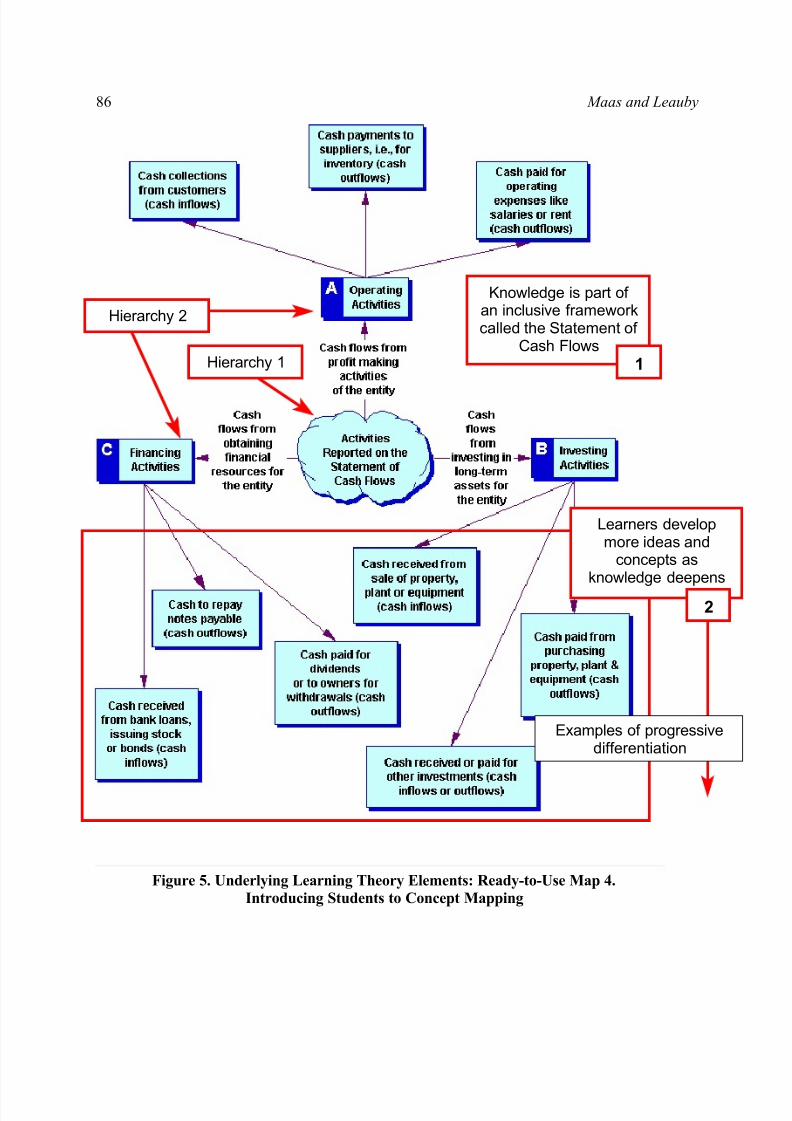
Figure 5 illustrates one method of applying the underlying learning theory to Map 4. Thereare two primary hierarchies (meaning the information therein is part of some inclusive framework)
illustrated in this map: Hierarchy 1 is the main idea of the map, or the statement of cash flow;
Hierarchy 2 is represented by the individual cash flow components (marked A, B, and C: operating,investing, and financing). Progressive differentiation (as learners develop more ideas and concepts,
knowledge deepens) is illustrated by the activities that define each of the individual components.
As an example, progressive differentiation is illustrated by the concept example “Cash to repaynotes payable (Cash outflows),” which defines and elaborates on the concept of financing activities.
This particular map has nine illustrations of progressive differentiation; students could be
encouraged to add more or to elaborate on the ones provided or even add additional hierarchies toexpand the concepts.
The third aspect of the learning theory, integrative reconciliation (meaning that learners
begin to perceive interrelationships among concepts and components not previously recognized) is
not illustrated in Map 4 because of the map’s purposeful simplicity. However, it could be added,making the map more complex, by engaging in a classroom discussion or assigning the students the
task of examining how the statement of cash flow is related to the balance sheet and income
statement, and then how each of the components (operating, investing, and financing) play a rolein that interrelationship. As an alternative to creating an overly complex map, which can sometimes
be overwhelming to students initially, a new map could be developed that focuses just on the
interrelationships of the statement of cash flows, either as an activity guided by the instructor or bystudents in groups as an in-class assignment. Such a map would contain its own set of hierarchies,
progressive differentiations, and integrative reconciliations. In any way the maps are used, they
8/13/2019 04-038 Concept Mapping
http://slidepdf.com/reader/full/04-038-concept-mapping 12/24
86 Maas and Leauby
Figure 5. Underlying Learning Theory Elements: Ready-to-Use Map 4.
Introducing Students to Concept Mapping
Knowledge is part of an inclusive frameworkcalled the Statement of
Cash Flows
Learners developmore ideas and
concepts asknowledge deepens
Hierarchy 1
Hierarchy 2
1
2
Examples of progressivedifferentiation
8/13/2019 04-038 Concept Mapping
http://slidepdf.com/reader/full/04-038-concept-mapping 13/24
Concept Mapping 87
become valuable learning aids to the classroom topics and effective ways to help students
structurally organize their knowledge.Concept mapping can be a fun and effective classroom tool to learn in meaningful ways.
Students benefit from the ready-to-use map inventory approach without the need for either faculty or students to first acquire the skill of concept mapping. However, we hope thisencourages educators to eventually introduce the skill to students (since this maximizes the value
as a learning tool) as well as experiment further with the use of the maps as instructional tools.
Planning is essential before introducing a student-prepared concept-mapping task.
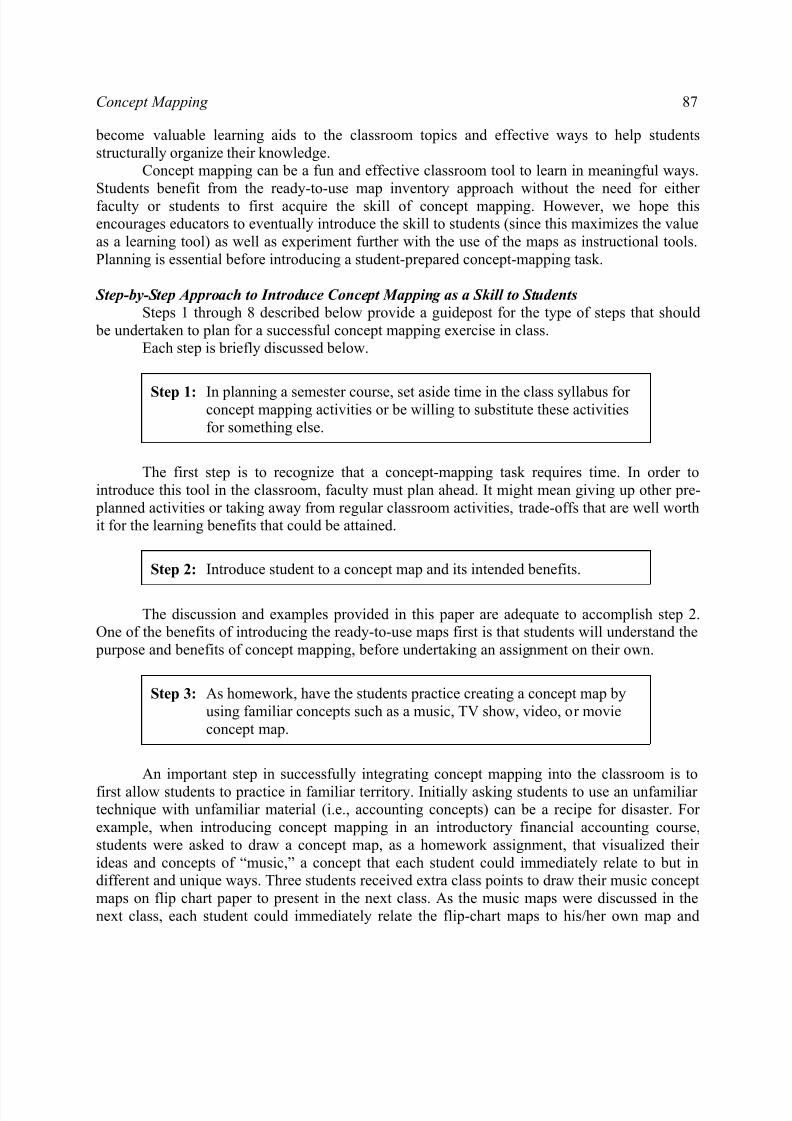
Step-by-Step Approach to Introduce Concept Mapping as a Skill to Students
Steps 1 through 8 described below provide a guidepost for the type of steps that should
be undertaken to plan for a successful concept mapping exercise in class.Each step is briefly discussed below.
The first step is to recognize that a concept-mapping task requires time. In order to
introduce this tool in the classroom, faculty must plan ahead. It might mean giving up other pre-
planned activities or taking away from regular classroom activities, trade-offs that are well worthit for the learning benefits that could be attained.
The discussion and examples provided in this paper are adequate to accomplish step 2.One of the benefits of introducing the ready-to-use maps first is that students will understand the
purpose and benefits of concept mapping, before undertaking an assignment on their own.
An important step in successfully integrating concept mapping into the classroom is to
first allow students to practice in familiar territory. Initially asking students to use an unfamiliar technique with unfamiliar material (i.e., accounting concepts) can be a recipe for disaster. For
example, when introducing concept mapping in an introductory financial accounting course,
students were asked to draw a concept map, as a homework assignment, that visualized their
ideas and concepts of “music,” a concept that each student could immediately relate to but indifferent and unique ways. Three students received extra class points to draw their music concept
maps on flip chart paper to present in the next class. As the music maps were discussed in the
next class, each student could immediately relate the flip-chart maps to his/her own map and
Step 1: In planning a semester course, set aside time in the class syllabus for concept mapping activities or be willing to substitute these activities
for something else.
Step 2: Introduce student to a concept map and its intended benefits.
Step 3: As homework, have the students practice creating a concept map by
using familiar concepts such as a music, TV show, video, or movie
concept map.
8/13/2019 04-038 Concept Mapping
http://slidepdf.com/reader/full/04-038-concept-mapping 14/24
88 Maas and Leauby
compare it to classmates. This shows how concept maps are different yet similar, how a concept
map is created, and how ideas and concepts are linked. These initial activities enable students to become comfortable with the mechanics of drawing concept maps before tackling a less familiar
and more challenging subject in the accounting domain.
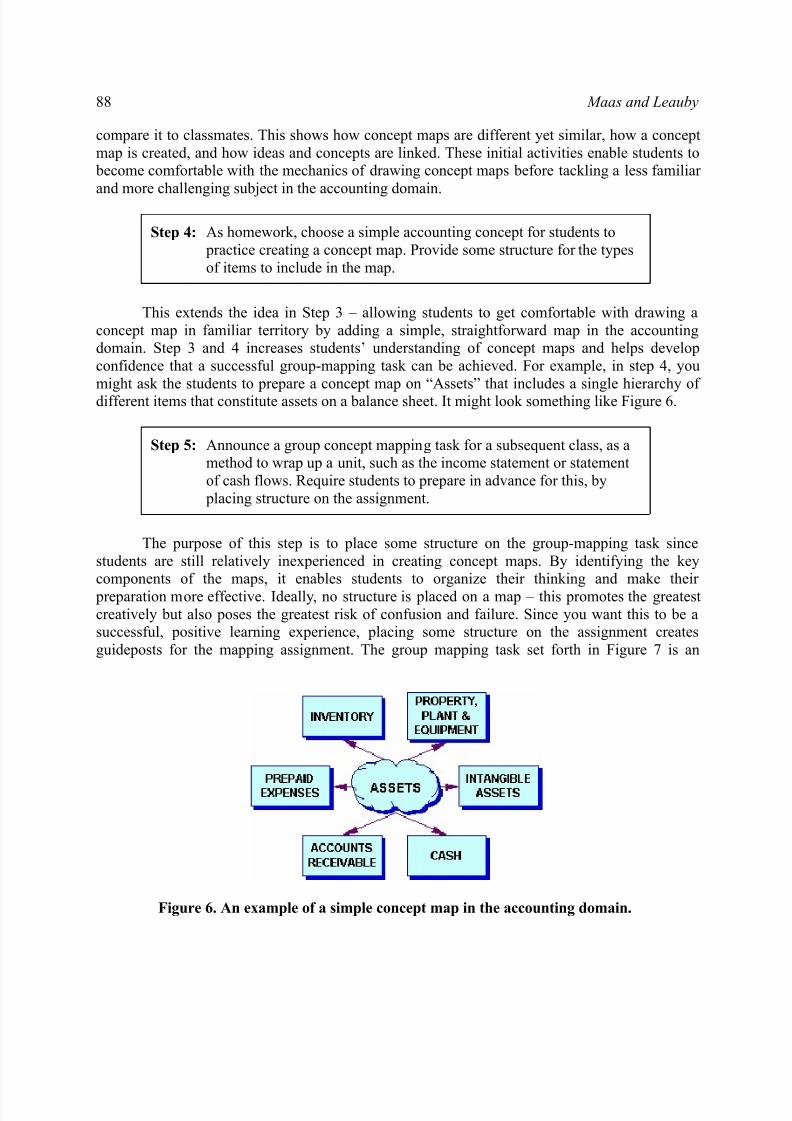
This extends the idea in Step 3 – allowing students to get comfortable with drawing a
concept map in familiar territory by adding a simple, straightforward map in the accountingdomain. Step 3 and 4 increases students’ understanding of concept maps and helps develop
confidence that a successful group-mapping task can be achieved. For example, in step 4, you
might ask the students to prepare a concept map on “Assets” that includes a single hierarchy of different items that constitute assets on a balance sheet. It might look something like Figure 6.
The purpose of this step is to place some structure on the group-mapping task since
students are still relatively inexperienced in creating concept maps. By identifying the keycomponents of the maps, it enables students to organize their thinking and make their
preparation more effective. Ideally, no structure is placed on a map – this promotes the greatest
creatively but also poses the greatest risk of confusion and failure. Since you want this to be asuccessful, positive learning experience, placing some structure on the assignment creates
guideposts for the mapping assignment. The group mapping task set forth in Figure 7 is an
Figure 6. An example of a simple concept map in the accounting domain.
Step 4: As homework, choose a simple accounting concept for students to
practice creating a concept map. Provide some structure for the types
of items to include in the map.
Step 5: Announce a group concept mapping task for a subsequent class, as amethod to wrap up a unit, such as the income statement or statement
of cash flows. Require students to prepare in advance for this, by
placing structure on the assignment.
8/13/2019 04-038 Concept Mapping
http://slidepdf.com/reader/full/04-038-concept-mapping 15/24
Concept Mapping 89
See Wo lcott, etc. for an excellent discussion on how to p lan and improve a research design when testing and2
developing critical thinking skills.
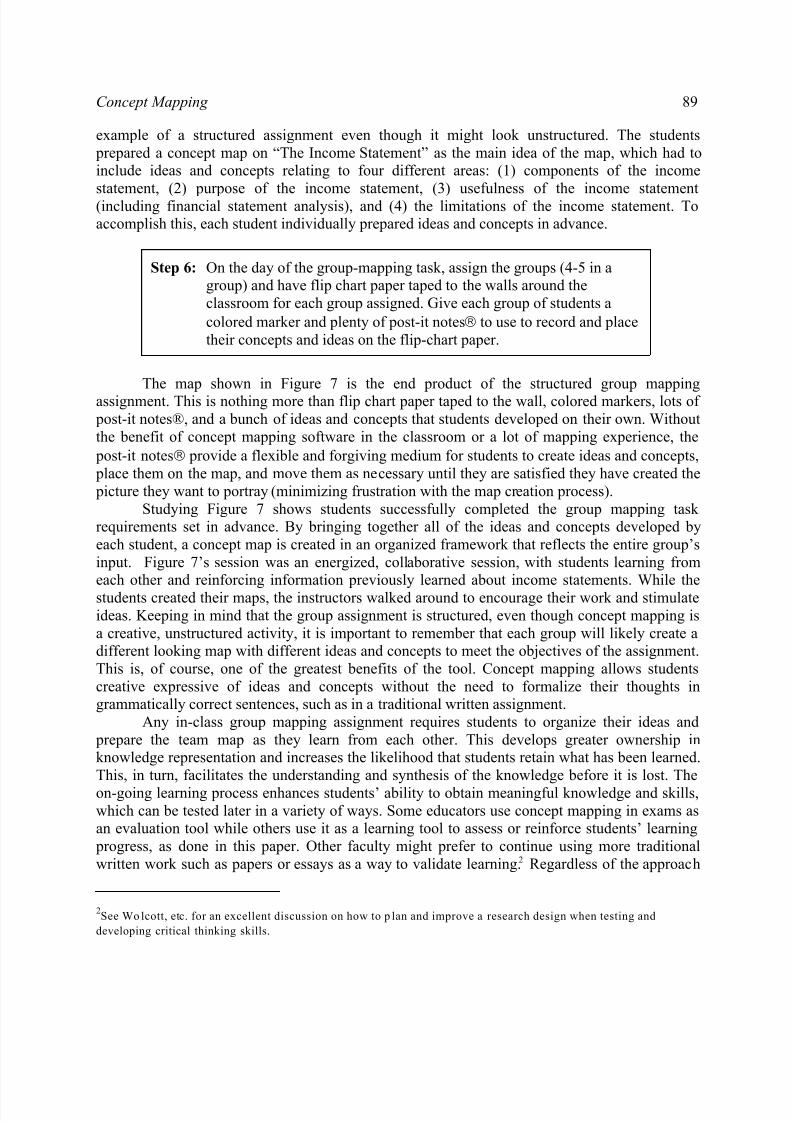
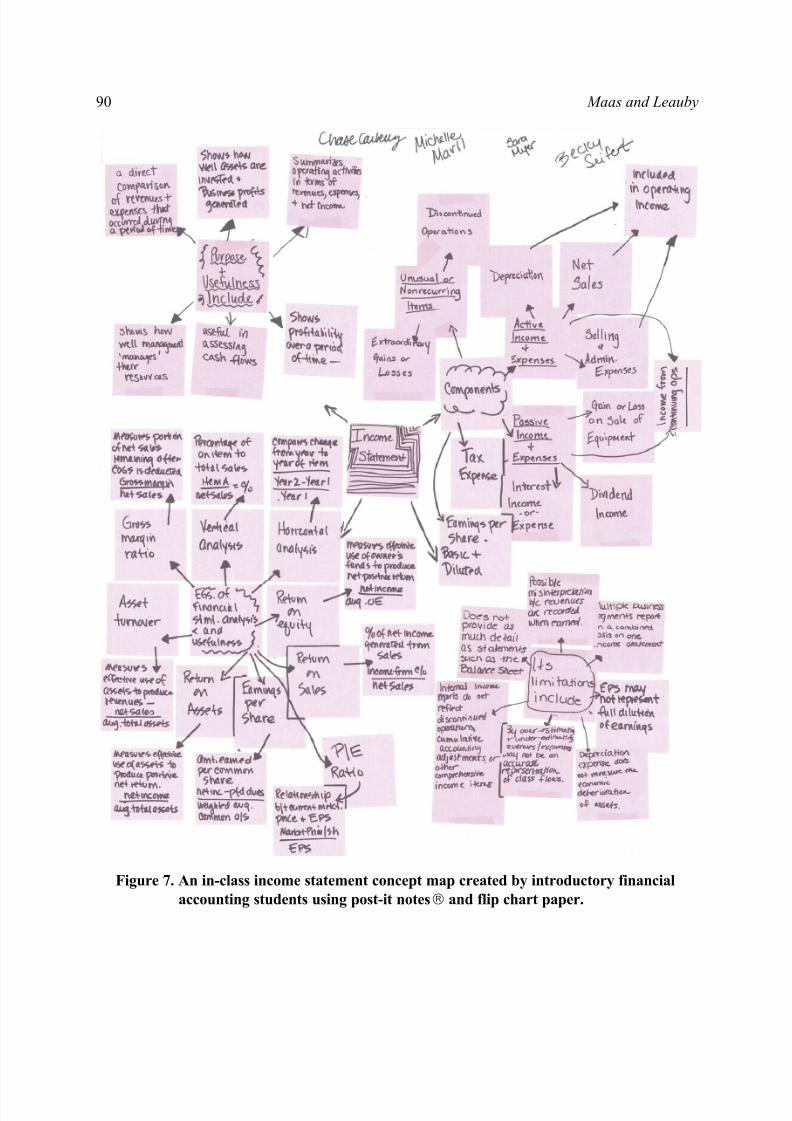
example of a structured assignment even though it might look unstructured. The students
prepared a concept map on “The Income Statement” as the main idea of the map, which had toinclude ideas and concepts relating to four different areas: (1) components of the income
statement, (2) purpose of the income statement, (3) usefulness of the income statement(including financial statement analysis), and (4) the limitations of the income statement. Toaccomplish this, each student individually prepared ideas and concepts in advance.
The map shown in Figure 7 is the end product of the structured group mappingassignment. This is nothing more than flip chart paper taped to the wall, colored markers, lots of
post-it notes®, and a bunch of ideas and concepts that students developed on their own. Without
the benefit of concept mapping software in the classroom or a lot of mapping experience, the
post-it notes provide a flexible and forgiving medium for students to create ideas and concepts,
place them on the map, and move them as necessary until they are satisfied they have created the
picture they want to portray (minimizing frustration with the map creation process).
Studying Figure 7 shows students successfully completed the group mapping task requirements set in advance. By bringing together all of the ideas and concepts developed by
each student, a concept map is created in an organized framework that reflects the entire group’s
input. Figure 7’s session was an energized, collaborative session, with students learning fromeach other and reinforcing information previously learned about income statements. While the
students created their maps, the instructors walked around to encourage their work and stimulate
ideas. Keeping in mind that the group assignment is structured, even though concept mapping is
a creative, unstructured activity, it is important to remember that each group will likely create adifferent looking map with different ideas and concepts to meet the objectives of the assignment.
This is, of course, one of the greatest benefits of the tool. Concept mapping allows students
creative expressive of ideas and concepts without the need to formalize their thoughts ingrammatically correct sentences, such as in a traditional written assignment.
Any in-class group mapping assignment requires students to organize their ideas and
prepare the team map as they learn from each other. This develops greater ownership inknowledge representation and increases the likelihood that students retain what has been learned.
This, in turn, facilitates the understanding and synthesis of the knowledge before it is lost. The
on-going learning process enhances students’ ability to obtain meaningful knowledge and skills,
which can be tested later in a variety of ways. Some educators use concept mapping in exams asan evaluation tool while others use it as a learning tool to assess or reinforce students’ learning
progress, as done in this paper. Other faculty might prefer to continue using more traditional
written work such as papers or essays as a way to validate learning. Regardless of the approach2
Step 6: On the day of the group-mapping task, assign the groups (4-5 in agroup) and have flip chart paper taped to the walls around the
classroom for each group assigned. Give each group of students a
colored marker and plenty of post-it notes to use to record and place
their concepts and ideas on the flip-chart paper.
8/13/2019 04-038 Concept Mapping
http://slidepdf.com/reader/full/04-038-concept-mapping 16/24
90 Maas and Leauby
Figure 7. An in-class income statement concept map created by introductory financial
accounting students using post-it notes and flip chart paper.
8/13/2019 04-038 Concept Mapping
http://slidepdf.com/reader/full/04-038-concept-mapping 17/24
Concept Mapping 91
There is a scoring model for grading concept maps (see Novak and Gowin, 198 4. pp. 36-37).3
used, concept-mapping activities help students organize what they know and prepare more
organized responses to traditional assignments since it facilitates the structure of knowledge.
One of the natural fears of using an assignment like this is how to grade it. It is
unstructured and does not lend itself easily to traditional grading grids. Thus, step 7 is important3
advice. Grade the group work on a “big picture” qualitative basis, without getting into how many
ideas or concepts each group actually created or why each group map looks different. Ask
yourself some of the following questions in deciding on an appropriate grade: Did the groupcomplete the structured task as assigned? Did everyone in the group seem to participate equally
and collaboratively to achieve the group task? Does the map portray an informational picture of
the required elements? Do the ideas and concepts appear to represent valid items? Are thereincomplete or invalid ideas and concepts represented (you might take off points for these)?
Ask students immediately for their input in the next class. Allow them to communicate
anonymously, if that produces more input. Was the group-mapping task helpful to learningwhatever subject was the focus of the activity? How could the activity be improved for the next
group-mapping task?
If you followed the steps suggested, the students will have had time to understand whatconcept mapping is all about, practiced doing a few simple non-accounting and accounting
maps, and have had a positive experience in the group-mapping activity. However, each class
experience is different. Your own individual comfort level and class experience, coupled withyour willingness to spend time on these activities, will dictates how much you can do and how
much students will benefit.
POSSIBLE LEARNING OUTCOMES DERIVED FROM A LIMITED
RESEARCH STUDY ON INTRODUCTORY ACCOUNTING STUDENTS
Most of the research findings on concept mapping are classroom-research oriented, but
some empirical studies exist to validate its effectiveness (relevant empirical studies are discussedunder the research finding). While these studies infer quantifiable outcomes from the use of
concept mapping, none relate to the accounting discipline. This is not surprising due to the very
non-traditional nature of the very strategies discussed by the authors in this paper, and given thefact that accounting pedagogies have typically focused on “numbers.”
While there have been no published empirical findings in the accounting discipline, the
authors have collected some preliminary research data that suggest quantifiable learning benefit
outcomes by using end-of-unit concept mapping activities as set forth in this paper. The research
Step 7: Grade the group work on an overall qualitative basis; don’t get intothe detail.
Step 8: Ask for written feedback in the next class regarding the activity.
8/13/2019 04-038 Concept Mapping
http://slidepdf.com/reader/full/04-038-concept-mapping 18/24
92 Maas and Leauby
claims need further validation, but these data coupled with the step-by-step implementation
guide, provide an initial framework for future studies to be conducted.The research question addressed in this study was, “Do Accounting 202 [second semester
introductory accounting students] who are exposed to instructional methods that involve conceptmapping achieve significantly higher interim unit test grades than Accounting 202 students whoare exposed to traditional instructional methods?” The sample in the study consisted of 64
students during the fall and spring semesters in a comprehensive state university. The sample
was believed to be a random sample based on the nature of course population. The fall semester
class of 29 students was labeled the control group. The results of interim unit exams of thecontrol group were evaluated after traditional instructional methods were used. The spring
semester class of 35 students was labeled the experimental group. The results of interim unit
exams were evaluated for this group after the group participated in two end-of-unit conceptmapping activities (one relating to each interim exam). Figure 7 illustrates a typical end-of-unit
activity that resulted from the concept mapping activities undertaken in the experimental group.
Since the study involved the investigation of events that had already occurred, an ex postfacto design was utilized. The level of significance utilized was p value = .01 and the decision in
this study was directional in nature. The researchers were only interested in the results if the
means of the experimental group exceeded the means of the control group. Thus, the region of
rejection was one-tailed; 1% at the upper end of the scale.The study tested a directional hypothesis relating to the difference between the means of
two independent samples. A t-test assuming equal variance was used for two reasons. First, the t-
test is the most common statistical test to compare differences between two groups and can beused with either independent or dependent samples. The samples in this study were independent
samples because the two groups had no relationship to each other and it was assumed that the
subjects were randomly assigned from a common population. Second, the presumption that thesubjects were randomly assigned dictated equal variances rather than unequal variances.
The independent variable was the method of instruction applied prior to the conduct of
the study: traditional instructional method versus instruction method that involves end-of-unitconcept mapping activities. The dependent variable was the test grades earned by students. The
test grades used an interval scale. The demographic data of the sample was analyzed using
descriptive statistics (number of observations (“n”)), mean, standard deviation, degrees of
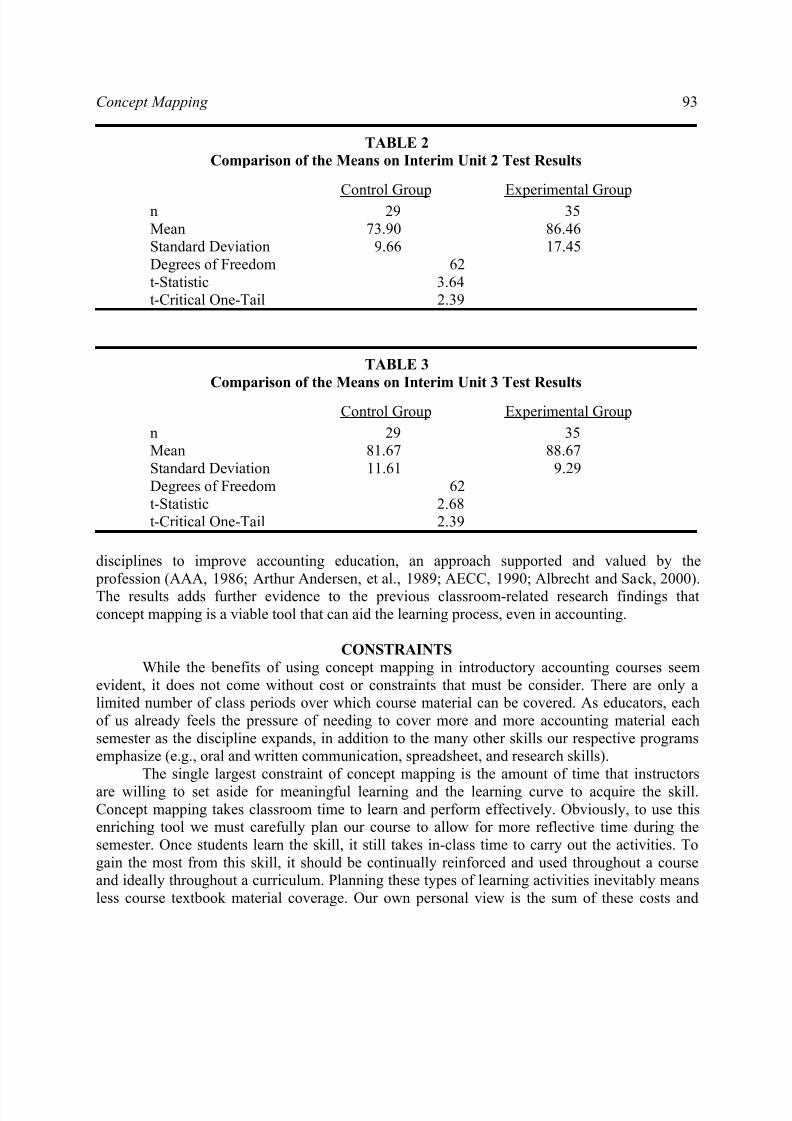
freedom, t statistic, and t critical value.Table 2 presents the results of comparing the mean unit test of each group on the Unit 2
interim test (the income statement) at the p = .01 level of significance. Table 3 presents the
results of comparing the mean unit test grades of each group for the Unit 3 interim test(statement of cash flows) at the p = .01 level of significance.
On both interim unit tests, the results of the study rejected the null hypothesis (that there
would be no significant difference) at the stated level of significance, thereby supporting thehypothesis that “Introductory accounting students exposed to instructional methods that include
concept mapping will have statistically higher means on the interim unit test grades than
introductory accounting students exposed to traditional instructional methods.” While limited
given the sample size, the results of this study were significant in several ways. First, at arigorous level, it provided initial empirical data that concept mapping might be a viable
instructional strategy and tool to improve learning outcomes in accounting. It also provided
evidence of the investigative value of non-traditional and innovative techniques from other
8/13/2019 04-038 Concept Mapping
http://slidepdf.com/reader/full/04-038-concept-mapping 19/24
Concept Mapping 93
TABLE 2
Comparison of the Means on Interim Unit 2 Test Results
Control Group Experimental Groupn 29 35
Mean 73.90 86.46Standard Deviation 9.66 17.45
Degrees of Freedom 62
t-Statistic 3.64t-Critical One-Tail 2.39
TABLE 3
Comparison of the Means on Interim Unit 3 Test Results
Control Group Experimental Group
n 29 35Mean 81.67 88.67
Standard Deviation 11.61 9.29
Degrees of Freedom 62
t-Statistic 2.68t-Critical One-Tail 2.39
disciplines to improve accounting education, an approach supported and valued by the
profession (AAA, 1986; Arthur Andersen, et al., 1989; AECC, 1990; Albrecht and Sack, 2000).The results adds further evidence to the previous classroom-related research findings that
concept mapping is a viable tool that can aid the learning process, even in accounting.
CONSTRAINTS
While the benefits of using concept mapping in introductory accounting courses seem
evident, it does not come without cost or constraints that must be consider. There are only alimited number of class periods over which course material can be covered. As educators, each
of us already feels the pressure of needing to cover more and more accounting material each
semester as the discipline expands, in addition to the many other skills our respective programsemphasize (e.g., oral and written communication, spreadsheet, and research skills).
The single largest constraint of concept mapping is the amount of time that instructors
are willing to set aside for meaningful learning and the learning curve to acquire the skill.Concept mapping takes classroom time to learn and perform effectively. Obviously, to use thisenriching tool we must carefully plan our course to allow for more reflective time during the
semester. Once students learn the skill, it still takes in-class time to carry out the activities. To
gain the most from this skill, it should be continually reinforced and used throughout a courseand ideally throughout a curriculum. Planning these types of learning activities inevitably means
less course textbook material coverage. Our own personal view is the sum of these costs and

8/13/2019 04-038 Concept Mapping
http://slidepdf.com/reader/full/04-038-concept-mapping 20/24
94 Maas and Leauby
constraints are tradeoffs well worth it, if indeed we are committed to focus on improving how
students learn and how we enable them to learn.A second constraint arises due to the nature of concept mapping activities. Concept
mapping is a highly individual and creative process. Although scoring systems have beendeveloped (Novak and Gowin,1984), there is no quantitative solution to a concept mappingexercise. Each student or each group of students will produce something different. Thus, an
important limitation arises in the ability of the instructor to accept and gain comfort in this
creative process, realizing that students (or groups of students) will create different, yet valid
work products. In many respects, it requires the instructor to become more visually oriented andnurture their own creative abilities. Not every instructor will be comfortable in this zone.
CONCLUSION
The ideas and materials presented in this paper are intended to stimulate further reflection
and experimentation on the value of concept mapping as a meaningful learning tool in the
accounting classroom. More meaningful learning activities improve accounting students’thinking skills. It can work well for introductory accounting courses as well as in more advanced
courses as an “enabling” skill, where knowledge complexity and synthesis are even more
critical. A wealth of research exists on the effectiveness and flexibility of this tool in other
disciplines that merit serious consideration in our own. Our own classroom experiences, asdescribed in this paper, have been positive and fruitful learning experiences for students. In
addition, our limited research study shows increased learning outcomes, as measured by
improved test scores. We encourage others to experiment with concept mapping to further validate the evidence found to generalize the results to the entire spectrum of accounting.
Concept mapping is not the only answer to introducing meaningful learning activities in
the classroom. However, the tool is symbolic of the kind of pedagogy we need to introduce toachieve the developmental goals of the early change agents in our profession and aid in reversing
the “perilous” trend that Albrecht and Sack (2000) have envisioned.
REFERENCES
Accounting Education Change Commission. 1990. The Objectives of Education for
Accountants: Position Statement Number One. Issues in Accounting Education (Vol. 5, No. 2)
307-312.Albrecht, W. S., and Sack, R. J. 2000. Accounting Education: Charting the Course through a
Perilous Future. American Accounting Association Series, Volume no. 16.
American Accounting Association. 1986. Special Report on the Future Structure, Content, and Scope of Accounting Education - Future Accounting Education: Preparing for the Expanding
Profession (Bedford Report). Issues in Accounting Education (Vol. 1, No. 1) 168–195.
American Institute of Certified Public Accountants. 2000a. AICPA Core Competency
Framework for Entry into the Accounting Profession. Retrieved November 6, 2000 from the
World Wide Web: http://ceae.aicpa.org.
_______. 2000b. CPA Vision 2011 and Beyond – Vision Statement, Core Purpose and Vision
Elements. Retrieved September 13, 2000 from the World Wide Web: http://www.cpavision.org.
8/13/2019 04-038 Concept Mapping
http://slidepdf.com/reader/full/04-038-concept-mapping 21/24
Concept Mapping 95
Anderson-Inman, L., and Horney, M. 1997. Computer-based Concept Mapping: Enhancing
Literacy With Tools for Visual Thinking. Journal of Adolescent and Adult Literacy (Vol. 40, No. 4) 302-306.
_______, and Zeitz, L. 1993. Computer-based concept mapping: Active studying for active learners. The Computing Teacher (Vol. 21, No. 1) 6-11.Angelo, T. A., and Cross, K. P. 1993. Classroom Assessment Techniques: A Handbook for College Teachers (2nd ed.). San Francisco, CA.: Jossey-Bass.
Arthur Andersen and Co., Arthur Young, Coopers and Lybrand, Deloitte, Haskins and Sells,
Ernst and Whinney, Peat, Marwick, Main and Co., Price Waterhouse, and Touche Ross (“Perspectives”). 1989. Perspectives on Education: Capabilities for Success in the
Accounting Profession.
Ausubel, D. P. 1963. The Psychology of Meaningful Verbal Learning . New York, NY: Grune and Stratton.
_______. 1968. Educational Psychology: A Cognitive View. New York, NY: Holt, Rinehart and
Winston.Beissner, K.L. 1992. Use of Concept Mapping to Improve Problem Solving. Journal of Physical Therapy Education (Vol. 6, No. 1) 22-27.
Bloom, Benjamin S. (Ed.). 1956. Taxonomy of educational objectives: Book I Cognitive Domain.
White Plains, NY: Longman.Cross, K. P. , and Steadman, M. H. 1996. Classroom Research: Implementing the Scholarship of
Teaching . San Francisco, CA: Jossey-Bass.
Demski, J. S., and Zimmerman, J. L. 2000. On “Research vs. Teaching”: A Long Perspective. Accounting Horizons (Vol. 14, No. 3) 343-352.
Ditson, L. A., Kessler, R., Anderson-Inman, L., and Mafit, D. 1998. Concept Mapping
Companion. Eugene, Or.: International Society for Technology in Education.Dorough, D. K. , and Rye, J. A. 1997. Mapping for Understanding. The Science Teacher 36-41.
Hyerle, D. 1996. Thinking Maps: Seeing is Understanding. Educational Leadership 85-89.
Jegede, O.J., Alaiyemola, F.F., and Okebulola, P.A. 1990. The Effect of Concept Mapping on Student Anxiety and Achievement in Biology. Journal of Research in Science Teaching (Vol.
27, No. 10) 951-960.
Jonassen, D. H. 2000. Computers as Mindtools for Schools: Engaging Critical Thinking . Upper
Saddle River, NJ: Merrill. _______. 1996. Computers in the Classroom: Mindtools for Critical Thinking . Trenton, NJ:
Prentice Hall.
_______, Beissner, K., and Yacci, M. 1993. Structural Knowledge: Techniques for Representing, Conveying, and Acquiring Structural Knowledge. Trenton, NJ: Lawrence
Erlbaum Associates, Inc.
_______, Reeves, T. C., Hong, N., Harvey, D., and Peters, K. 1997. Concept Mapping as Cognitive Learning and Assessment Tools. Journal of Interactive Learning Research 290–308.
Krathwohl, D.R., Bloom, B.S., and Masia, B.B. 1964. Taxonomy of Educational Objectives:
Book 2 Affective Domain. New York, NY: Longman.Kimmel, P. 1995. A Framework for Incorporating Critical Thinking into Accounting Education.
Journal of Accounting Education 299-318.
8/13/2019 04-038 Concept Mapping
http://slidepdf.com/reader/full/04-038-concept-mapping 22/24
96 Maas and Leauby
Leauby, B, and Brazina, P. 1998. Concept Mapping: Potential Uses in Accounting Education.
Journal of Accounting Education 123-138.Mento, A. J., Martinelli, P. and Jones, R. M. 1999. Mind Mapping in Executive Education:
Applications and Outcomes. Journal of Management Development 390-407. _______, and Jones, R. M. 1999. The Application of an Explicit Conceptually Transparent
Learning Model to Facilitate Meaningful Learning . In Emerging Business and Technology
Conference 1999 Proceedings, Myrtle Beach, SC 281-291.
Novak, J. D. 1998. Learning, Creating and Using Knowledge: Concept Maps as Facilitative
Tools in Schools and Corporations. Trenton, NJ: Lawrence Erlbaum Associates, Inc. _______, and Gowin, D. B. 1984. Learning How to Learn. Sydney, AU: Cambridge University
Press.
Odom, A. P., and Kelly, P. V. 1998. Making Learning Meaningful. The Science Teacher 33-37.Peresich, M.L., Meadows, J.D., and Sinatra, R. 1990. Content Area Cognitive Mapping for
Reading and Proficiency. Journal of Reading (Vol. 33, No. 3) 424-432.
Porter, B. A., and Carr, S. A. 1999. From Strategic Plan to Practical Realities: Developing and Implementing a Zero-Based Accounting Curriculum. Issues in Accounting Education Vol. 14,
No. 4) 565-588.
Schau, C., and Mattern, N. 1997. Use of Map Techniques in Teaching Applied Statistics
Courses. The American Statistician 171-175.Todd, R. I., and Kirk, J. 1995. Concept Mapping in Information Science. Education for
Information 333-347.
Watson, S.F., Apostolou, B., Hassell, J.M., and Webber, S.A. 2003. Accounting Education Literature Review (2000-2002). Journal of Accounting Education 267-325.
Wolcott, S.K., Baril, C.P., Cunningham, B.M., Fordham, D.R. and St. Pierre, K. 2002. Critical
thought on critical thinking research. Journal of Accounting Education: 85-103.
8/13/2019 04-038 Concept Mapping
http://slidepdf.com/reader/full/04-038-concept-mapping 23/24
Concept Mapping 97
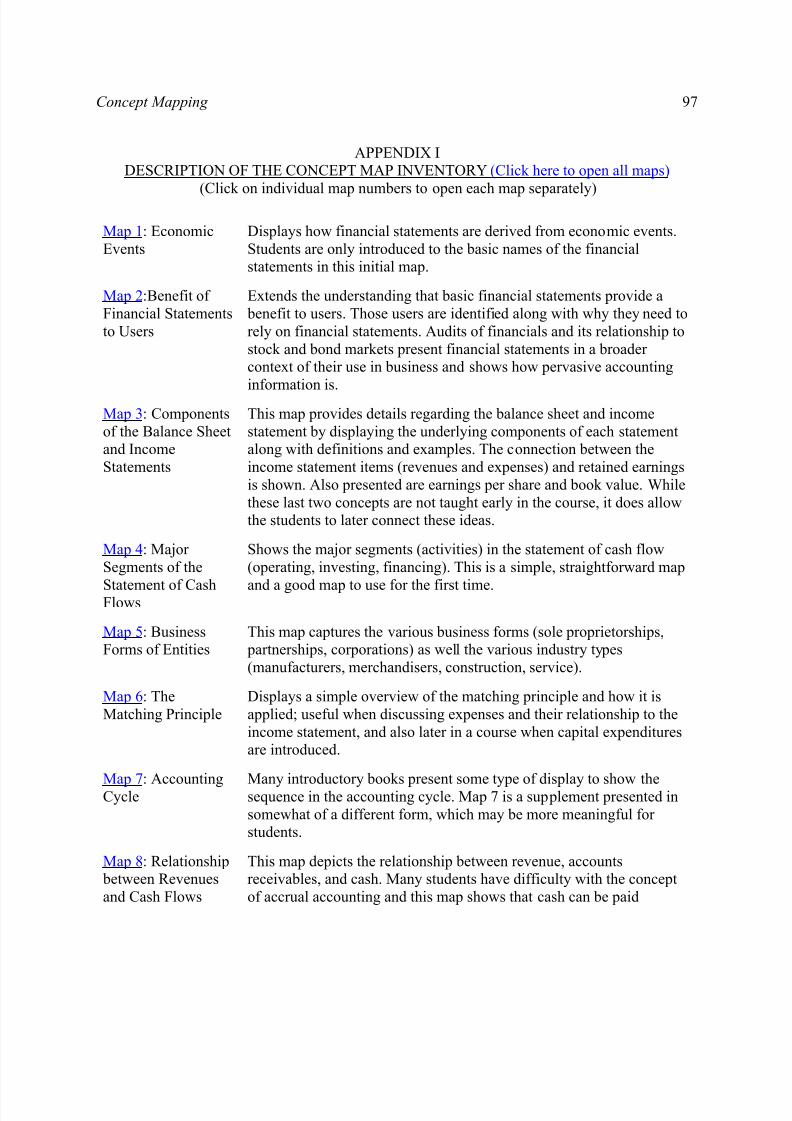
APPENDIX IDESCRIPTION OF THE CONCEPT MAP INVENTORY (Click here to open all maps)
(Click on individual map numbers to open each map separately)
Map 1: Economic
Events
Displays how financial statements are derived from economic events.
Students are only introduced to the basic names of the financialstatements in this initial map.
Map 2:Benefit of
Financial Statements
to Users
Extends the understanding that basic financial statements provide a
benefit to users. Those users are identified along with why they need to
rely on financial statements. Audits of financials and its relationship to
stock and bond markets present financial statements in a broader context of their use in business and shows how pervasive accounting
information is.
Map 3: Components
of the Balance Sheetand Income
Statements
This map provides details regarding the balance sheet and income
statement by displaying the underlying components of each statementalong with definitions and examples. The connection between the
income statement items (revenues and expenses) and retained earnings
is shown. Also presented are earnings per share and book value. While
these last two concepts are not taught early in the course, it does allowthe students to later connect these ideas.
Map 4: Major
Segments of the
Statement of CashFlows
Shows the major segments (activities) in the statement of cash flow
(operating, investing, financing). This is a simple, straightforward map
and a good map to use for the first time.
Map 5: BusinessForms of Entities
This map captures the various business forms (sole proprietorships, partnerships, corporations) as well the various industry types
(manufacturers, merchandisers, construction, service).
Map 6: The
Matching Principle
Displays a simple overview of the matching principle and how it is
applied; useful when discussing expenses and their relationship to the
income statement, and also later in a course when capital expendituresare introduced.
Map 7: AccountingCycle Many introductory books present some type of display to show thesequence in the accounting cycle. Map 7 is a supplement presented in
somewhat of a different form, which may be more meaningful for students.
Map 8: Relationship between Revenues
and Cash Flows
This map depicts the relationship between revenue, accountsreceivables, and cash. Many students have difficulty with the concept
of accrual accounting and this map shows that cash can be paid
8/13/2019 04-038 Concept Mapping
http://slidepdf.com/reader/full/04-038-concept-mapping 24/24
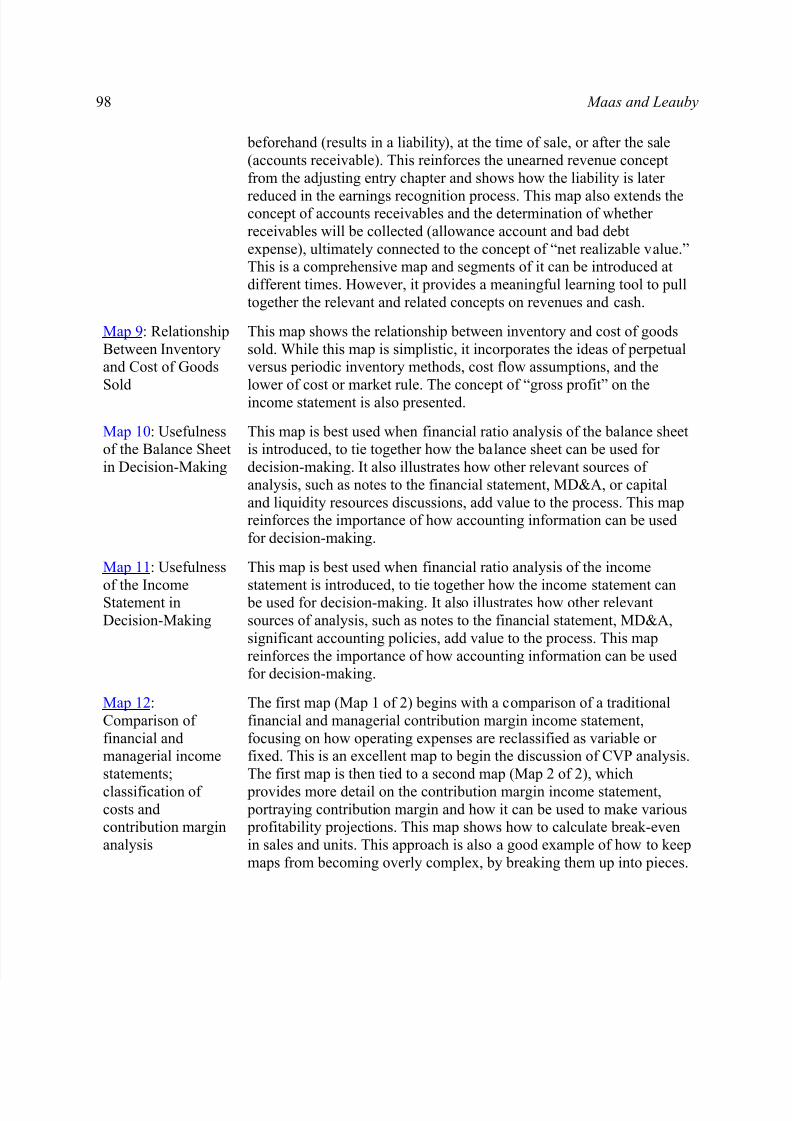
98 Maas and Leauby
beforehand (results in a liability), at the time of sale, or after the sale
(accounts receivable). This reinforces the unearned revenue concept
from the adjusting entry chapter and shows how the liability is later
reduced in the earnings recognition process. This map also extends theconcept of accounts receivables and the determination of whether
receivables will be collected (allowance account and bad debt
expense), ultimately connected to the concept of “net realizable value.”This is a comprehensive map and segments of it can be introduced at
different times. However, it provides a meaningful learning tool to pull
together the relevant and related concepts on revenues and cash.
Map 9: Relationship
Between Inventoryand Cost of Goods
Sold
This map shows the relationship between inventory and cost of goods
sold. While this map is simplistic, it incorporates the ideas of perpetualversus periodic inventory methods, cost flow assumptions, and the
lower of cost or market rule. The concept of “gross profit” on the
income statement is also presented.
Map 10: Usefulnessof the Balance Sheet
in Decision-Making
This map is best used when financial ratio analysis of the balance sheetis introduced, to tie together how the balance sheet can be used for
decision-making. It also illustrates how other relevant sources of
analysis, such as notes to the financial statement, MD&A, or capital
and liquidity resources discussions, add value to the process. This mapreinforces the importance of how accounting information can be used
for decision-making.
Map 11: Usefulness
of the IncomeStatement in
Decision-Making
This map is best used when financial ratio analysis of the income
statement is introduced, to tie together how the income statement can be used for decision-making. It also illustrates how other relevant
sources of analysis, such as notes to the financial statement, MD&A,
significant accounting policies, add value to the process. This map
reinforces the importance of how accounting information can be usedfor decision-making.
Map 12:
Comparison of
financial andmanagerial income
statements;
classification of costs andcontribution margin
analysis
The first map (Map 1 of 2) begins with a comparison of a traditional
financial and managerial contribution margin income statement,
focusing on how operating expenses are reclassified as variable or fixed. This is an excellent map to begin the discussion of CVP analysis.
The first map is then tied to a second map (Map 2 of 2), which
provides more detail on the contribution margin income statement, portraying contribution margin and how it can be used to make various profitability projections. This map shows how to calculate break-even
in sales and units. This approach is also a good example of how to keep
maps from becoming overly complex, by breaking them up into pieces.