concept mapping and education
TRANSCRIPT
Concept Mapping and Education
Printed Edition of the Special Issue Published in Education Sciences
www.mdpi.com/journal/education
AMM Sharif UllahEdited by
Concept Mapping and Education • AM
M Sharif U
llah

Concept Mapping and Education

Concept Mapping and Education
Editor
AMM Sharif Ullah
MDPI • Basel • Beijing • Wuhan • Barcelona • Belgrade • Manchester • Tokyo • Cluj • Tianjin

Editor
AMM Sharif Ullah
Faculty of Engineering,
Kitami Institute of Technology
Japan
Editorial Office
MDPI
St. Alban-Anlage 66
4052 Basel, Switzerland
This is a reprint of articles from the Special Issue published online in the open access journal
Education Sciences (ISSN 2227-7102) (available at: https://www.mdpi.com/journal/education/
special issues/Concept Mapping and Education).
For citation purposes, cite each article independently as indicated on the article page online and as
indicated below:
LastName, A.A.; LastName, B.B.; LastName, C.C. Article Title. Journal Name Year, Article Number,
Page Range.
ISBN 978-3-03943-392-6 (Hbk) ISBN 978-3-03943-393-3 (PDF)
c© 2020 by the authors. Articles in this book are Open Access and distributed under the Creative
Commons Attribution (CC BY) license, which allows users to download, copy and build upon
published articles, as long as the author and publisher are properly credited, which ensures maximum
dissemination and a wider impact of our publications.
The book as a whole is distributed by MDPI under the terms and conditions of the Creative Commons
license CC BY-NC-ND.
Contents
About the Editor . . . . . . . . . . . . . . . . . . . . . . . . . . . . . . . . . . . . . . . . . . . . . . vii
AMM Sharif Ullah
Concept Map and KnowledgeReprinted from: Educ. Sci. 2020, 10, 246, doi:10.3390/educsci10090246 . . . . . . . . . . . . . . . . 1
Yining Zhou
A Concept Tree of Accounting Theory: (Re)Design for the Curriculum DevelopmentReprinted from: Educ. Sci. 2019, 9, 111, doi:10.3390/educsci9020111 . . . . . . . . . . . . . . . . . 3
Ian M. Kinchin, Aet Mollits and Priit Reiska
Uncovering Types of Knowledge in Concept MapsReprinted from: Educ. Sci. 2019, 9, 131, doi:10.3390/educsci9020131 . . . . . . . . . . . . . . . . . 19
Ian M. Kinchin
The Salutogenic Management of Pedagogic Frailty: A Case of Educational Theory DevelopmentUsing Concept MappingReprinted from: Educ. Sci. 2019, 9, 157, doi:10.3390/educsci9020157 . . . . . . . . . . . . . . . . . 33
Javier Gonzalez Garcia and Tirtha Prasad Mukhopadhyay
The Role and Efficacy of Creative Imagination in Concept Formation: A Study of Variables forChildren in Primary SchoolReprinted from: Educ. Sci. 2019, 9, 175, doi:10.3390/educsci9030175 . . . . . . . . . . . . . . . . . 47
AMM Sharif Ullah
Fundamental Issues of Concept Mapping Relevant to Discipline-Based Education: APerspective of Manufacturing EngineeringReprinted from: Educ. Sci. 2019, 9, 228, doi:10.3390/educsci9030228 . . . . . . . . . . . . . . . . . 65
v

About the Editor
AMM Sharif Ullah is Chair of the Intelligent Machines and Biomechanics Program and Director of
the Advanced Manufacturing Engineering Laboratory at the Kitami Institute of Technology. He is
an active researcher in the areas of engineering design and intelligent manufacturing. He received
his first degree, Bachelor of Science in Engineering (Mechanical), from the Bangladesh University
of Engineering and Technology in 1992. He received his Master’s and Doctoral Degrees from
Kansai University in 1996 and 1999, respectively. Before joining his current employer in October
2009, he worked as a full-time faculty member at the Asian Institute of Technology (Assistant
Professor, 2000–2002) and the United Arab Emirates University (Assistant Professor, 2002–2006;
Associate Professor, 2006–2009). He has mentored more than 120 undergraduate/graduate
students coming from different countries. He researches knowledge-based systems for product
realization, emphasizing creativity, design, manufacturing, operations, materials, sustainability,
and systems. He published more than 120 technical articles in reputed peer-reviewed journals,
edited books, and international conference proceedings. He serves on the editorial boards of several
peer-reviewed international journals. His current research focuses on Industry 4.0, 3D printing,
engineering design, sustainable product development, reverse engineering, precision manufacturing,
and engineering education.
vii


education sciences
Editorial
Concept Map and Knowledge
AMM Sharif Ullah
Division of Mechanical and Electrical Engineering, Kitami Institute of Technology, 165 Koen-cho,Kitami 090-8507, Japan; [email protected]; Tel./Fax: +81-157-26-9207
Received: 14 September 2020; Accepted: 14 September 2020; Published: 15 September 2020 ���������������
Based on Piaget’s genetic epistemology, Ausubel developed the assimilation theory of verballearning [1,2]. This theory is considered the foundation of meaningful learning. The outcomes ofmeaningful learning take the form of concept maps—networks of some selected linguistic expressionsand concepts [3]. Thus, concept map-based education helps avoid rote learning. Additionally, it helpsprepare content for effective on-ground and e-learning. Moreover, it helps measure learning outcomesat the course, program, and institutional levels. As a result, concept map-based education has beenused at school, college, university, and professional levels.
This Special Issue on Concept Mapping and Education solicited manuscripts on the theoreticalfoundations of concept mapping and its application areas, including (but not limited to) conceptmapping in school, higher and professional education; concept mapping in active learning,problem-based learning, and project-based learning; and distance learning. Finally, this SpecialIssue published five selected articles, each of which went through a rigorous peer-review process.The editor would like to acknowledge the authors and reviewers for their invaluable contributions thatenrich concept map-based education in particular and education science in general.
“A Concept Tree of Accounting Theory: (Re)Design for the Curriculum Development” [4]contributes to accounting and concept mapping literature by depicting a concept tree based on theAccounting Theory curriculum. The proposed tree-shaped concept map graphically interprets thesophisticated accounting theories and concepts and their complex interrelationships. In teachingpractices, this concept tree promotes curriculum development, systematizing relevant topics,and exam-taking.
“Uncovering Types of Knowledge in Concept Maps” [5] uncovers the types of knowledge inconcept maps. Concept maps represent different types of knowledge (e.g., procedural and conceptual).The authors used Legitimation Code Theory (LCT) to analyze concept maps in semantic gravity andsemantic density. It was found that different types of knowledge are considered necessary to achieveprofessional knowledge or expert understanding. The author used examples to demonstrate students’learning patterns towards gaining expert knowledge. The authors described the implication of thestudy for curriculum design and teaching evaluation.
“The Salutogenic Management of Pedagogic Frailty: A Case of Educational Theory DevelopmentUsing Concept Mapping” [6] reinterprets “pedagogic frailty” using concept maps, focusing on thesalutogenesis of teachers such as assets, wellness, and sense of coherence. The concept maps definethe complex relationship between pedagogic frailty and salutogenesis. This study paves the wayto an educational theory for enhancing university-wide mental health literacy and avoiding themisapplication of existing teaching quality enhancement models. As a result, it has a greater utility foruniversity managers.
“The Role and Efficacy of Creative Imagination in Concept Formation: A Study of Variables forChildren in Primary School” [7] is a contribution towards creative concept formation, which is one ofthe main concerns of assimilation theory-based concept mapping. The 8–12-year-old school childrenwere tested using four subtests. Three of the subtests were designed to evaluate narrative (verbal)
Educ. Sci. 2020, 10, 246; doi:10.3390/educsci10090246 www.mdpi.com/journal/education1

Educ. Sci. 2020, 10, 246
creativity, and the other was designed to evaluate drawing (i.e., graphic) creativity. The tests indicatethe child’s learning ability regarding fluency, flexibility, originality in narrative representations, andgraphics. The study can be used to evaluate concept map-based learning, focusing on creative thinking.
“Fundamental Issues of Concept Mapping Relevant to Discipline-Based Education: A Perspectiveof Manufacturing Engineering” [8] addresses some fundamental concept mapping issuesrelevant to discipline-based education (e.g., manufacturing education). This article argues thatknowledge-type-aware concept mapping is a solution to create and analyze the semantic web-embeddeddynamic knowledge bases for both human and machine learning from the perspective of Industry 4.0.Accordingly, this article defines five types of knowledge, namely, analytic a priori knowledge, synthetica priori knowledge, synthetic a posteriori knowledge, meaningful knowledge, and skeptic knowledge.These types of knowledge help find some rules and guidelines to create and analyze concept maps forhuman and machine learning. The presence of these types of knowledge is elucidated using a real-lifemanufacturing knowledge representation case.
In sum, a problem cannot be solved without applying knowledge. Therefore, educators embarkon how to disseminate knowledge to students. At the same time, students embark on how to learnrelevant knowledge. Both knowledge dissemination and learning can be carryout using appropriatelydesigned concept maps. In this case, the concept maps must manage the myriad proximal anddistal relationships between knowledge and other relevant entities (human/machine learning, logicalinferences, experimental data, analytical results, creative thinking, and cognitive reflections). As aresult, knowledge-type-aware concept mapping is an effective means of education and learning [9].Let us cherish this notion.
Funding: This research received no external funding.
Conflicts of Interest: The author declares no conflict of interest.
References
1. Ausubel, D.; Novak, J.; Hanesian, H. Educational Psychology: A Cognitive View, 2nd ed.; Holt, Rinehart & Winston:New York, NY, USA, 1978.
2. Seel, N.M. Assimilation theory of learning. In Encyclopedia of the Sciences of Learning; Seel, N.M., Ed.; Springer:Boston, MA, USA, 2012. [CrossRef]
3. Novak, J.D. Learning, Creating, and Using Knowledge: Concept Maps as Facilitative Tools in Schools and Corporations,2nd ed.; Rutledge: New York, NY, USA, 2012; p. 105644.
4. Zhou, Y. A Concept Tree of Accounting Theory: (Re)Design for the Curriculum Development. Educ. Sci.2019, 9, 111. [CrossRef]
5. Kinchin, I.M.; Möllits, A.; Reiska, P. Uncovering Types of Knowledge in Concept Maps. Educ. Sci. 2019,9, 131. [CrossRef]
6. Kinchin, I.M. The Salutogenic Management of Pedagogic Frailty: A Case of Educational Theory DevelopmentUsing Concept Mapping. Educ. Sci. 2019, 9, 157. [CrossRef]
7. Gonzalez Garcia, J.; Mukhopadhyay, T.P. The Role and Efficacy of Creative Imagination in Concept Formation:A Study of Variables for Children in Primary School. Educ. Sci. 2019, 9, 175.
8. Ullah, A.S. Fundamental Issues of Concept Mapping Relevant to Discipline-Based Education: A Perspectiveof Manufacturing Engineering. Educ. Sci. 2019, 9, 228. [CrossRef]
9. Ullah, A.S. What is knowledge in Industry 4.0? Eng. Rep. 2020, 2, e12217. [CrossRef]
© 2020 by the author. Licensee MDPI, Basel, Switzerland. This article is an open accessarticle distributed under the terms and conditions of the Creative Commons Attribution(CC BY) license (http://creativecommons.org/licenses/by/4.0/).
2

education sciences
Article
A Concept Tree of Accounting Theory: (Re)Design forthe Curriculum Development
Yining Zhou
Sydney City School of Business, Top Education Institute, Eveleigh, NSW 2015, Australia;[email protected]
Received: 10 March 2019; Accepted: 16 May 2019; Published: 21 May 2019
Abstract: This study contributes to both accounting and concept mapping literature through thedepiction of a concept tree based on the Accounting Theory curriculum, which has undergone recentand rapid expansion of its knowledge and has hence outgrown the previous limited mapping work.This tree-shaped concept map not only accounts for a particular mapping approach little studied andscarcely exemplified in literature, but also signifies a creative model that graphically interprets thesophisticated system of accounting theories and concepts as well as their complex interrelationships.In teaching practices, this concept tree has attested a potential to promote curriculum development,as evidenced in sequence and cohesion of topics and by being linked meaningfully to exam design.
Keywords: concept map; concept tree; accounting theory; accounting education; curriculum development
1. Introduction
Concept maps have been proven to be a useful educational technique, integrating semanticrelationships between concepts into node–link diagrams [1,2]. A traditional or Novakian conceptmap is made up of nodes of concepts, links, and linking phrases that articulate how these conceptnodes relate to each other [3]. Through the provision of visual and abstract evident graphic depictions,concept maps can be used to aid organization, preparation, and presentation of information concerninga topic, a lecture, a course, or even a discipline of knowledge [2]. In higher education, concept mappinghas been well regarded as a powerful and versatile tool to facilitate learning (particularly beneficialfor lower performance students) [4,5], to enhance learners’ problem-solving abilities [6,7], to fosterknowledge sharing and social artefacts between students [7], to further teacher–learner dialogue [8],and to renew assessment modes from rote recall of isolated knowledge pieces towards connectionsbetween ideas [9].
Given its extensive use in a variety of (particularly science-based) disciplines, concept mappinghas not received much attention in accounting education [10,11]. Of particular concern is its limitedapplication in the Accounting Theory (and Application) course, where only one curriculum conceptmap (Simon 2007) has been found from literature thus far [4]. The essential problem is a map-knowledgemismatch. Proposed more than one decade ago and laid on a traditional financial position, Simon’smap is unable to sufficiently and appropriately account for the current state of curriculum knowledge,as the system has been profoundly reshaped by theorizing accountability that triggers emergence anddevelopment of non-financial accountings [12–15]. Another inadequacy of this map is that it portraysonly simple hierarchical relationships used to distinguish between “more general” and “more specific”concepts and is thus unable to make references to curriculum themes such as accounting evolutionand sector-specificity, which are required to address the connections and the interconnections amongaccounting theories and models across different categories. It has been highlighted that concept mapscan serve as powerful tools for educators and students to tackle the challenge emerging from theincreasing amount and complexity of knowledge, where more sophisticated and alternative thoughts
Educ. Sci. 2019, 9, 111; doi:10.3390/educsci9020111 www.mdpi.com/journal/education3

Educ. Sci. 2019, 9, 111
to the existing understanding are continuously generated [5,9]. In this regard, concept maps enable a“knowledge integration” process towards a higher level of knowledge, through which the connectionsbetween the old and the new ideas are rigorously explored, and the repertoire of all these inconsistentideas is systematically rearranged [9]. From this perspective, it is necessary to update the curriculumconcept map specified on both the extended, nonfinancial knowledge domain of accounting alternativesto traditional financial accounting [1,16], and the intricate (inter)relationships within.
On the other hand, a particular form of concept maps is to symbolize the system of knowledge orinformation in a tree structure [17,18]. The presentational effectiveness of tree models is highly praisedin such a knowledge system where an evolutionary strain is implicated among concepts, or they aredistinctively diversified in contexts of meanings or fields of applications [19,20]. This characteristicinherent to the tree model provides the opportunity to redesign the concept map for the AccountingTheory curriculum, where the financial and the non-financial accounting contexts have been distinctlydifferentiated but still share the same root of accountability.
The purpose of this paper is to contribute an instructor-prepared tree-like concept map stipulatedon the Accounting Theory curriculum. Two insights are concluded from this study. First, the concepttree stands for a creative model that visualizes the sophisticated system of accounting theories andconcepts, as well as their complex interrelationships. Second, this tree has proven its potentialto promote curriculum development, as evidenced by the sequence and cohesion of topics and ameaningful linkage to exam design. An additional contribution made by this paper is the enrichment ofthe concept mapping methodology. In doing so, this paper constructs a concrete account to explore thetree-shape as a particular mapping technique that has been rarely studied and inadequately exemplifiedin literature.
2. Concept Map in Accounting Education and a Critique of the Old Curriculum Map
The theoretical ground of concept mapping is traced back to Ausubel’s meaningful learningtheory [21,22], which is based on the idea that memory-testing or rote learning cannot achieve anefficient learning process. In Ausubel’s view, a successful learning process requires a platform orscaffolding through which new knowledge can be absorbed and integrated to the previously-attainedknowledge. This platform or scaffolding comes from the notion of “advance organizers”, which refersto a knowledge construction method where general or abstract ideas work to depict an overview toassimilate new knowledge, and fragments of texts are reasonably linked [23,24].
Ausulbel’s meaningful learning theory [21–23] provides critical insights for Novak’s groundworkfor the development of concept mapping [1,24], which has been versatile and flexible in its applicationfor a variety of educational purposes. The underpinning idea of concept mapping is that meaningfullearning can be realized by means of graphic representation, where the already-acquired knowledgepieces are organized into an integrated system, and this system opens to new knowledge as its futurecomponents [1,10,25,26]. Novak and Gowin [1] refine three fundamentals of Ausubel’s learning theoryas the base of concept mapping:
• Hierarchical structure refers to knowledge as part of an inclusive and systematic framework.• Progressive differentiation is defined as engendering new concepts and ideas as knowledge deepens.• Integrative reconciliation elucidates interrelationships between concepts.
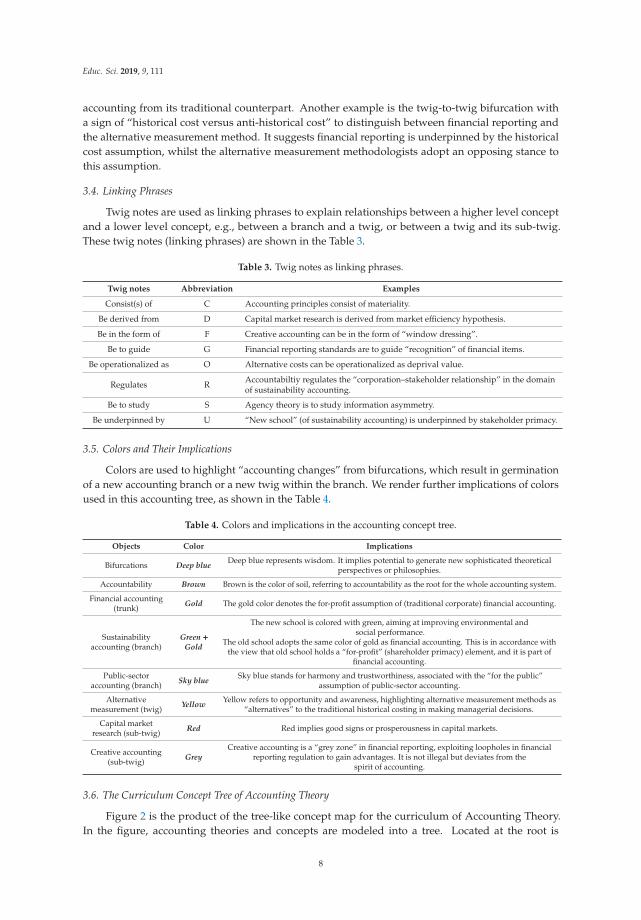
Concept mapping has been regarded as an effective teaching and learning tool in accountingeducation. Relevant studies fall into to three schemes: making instructor-prepared accounting conceptmaps, teaching accounting students how to make concept maps, and assessing effectiveness of conceptmaps. These research themes are shown in the Table 1.
In the first scheme, the researchers themselves act as the creators of concept maps and use thesemaps as educational tools for the purpose of enhancing students’ understandings of academic content.In the second scheme, the researchers, as concept map educators, equip students with the knowledge ofhow to design concept maps. Consequently, students create their own concept maps from a particular
4
Educ. Sci. 2019, 9, 111
topic of accounting, and they are expected to be able to use this useful tool in other fields of accountingand non-accounting disciplines. The third scheme targets assessing the effectiveness of concept mapsin contributing to the improvement of education quality; this is normally done by comparing studentswith experience using concept maps in the curriculum with those who have no such experience.
Table 1. Research schemes of concept mapping in accounting education.
Research Schemes Articles
Makinginstructor-prepared
concept maps toenhance learning
Simon (2007) designs a curriculum concept map for Accounting Theory [10];Handy and Polimeni (2017) propose six concept maps that correspond to six topicsof the Introductory Managerial Accounting curriculum [27];Mass and Leauby (2014) introduce a concept map for the topic of financial reportingstandards in the financial accounting curriculum [28].
Teaching accountingstudents to produce
concept maps
After informing students about the steps of concept mapping, Shimerda (2007)presents student-prepared concept maps for the accounting equation topic, thenindicates usefulness of concept mapping in accounting education [29].Simon (2007) shows some instructor-prepared maps as the guidance for accountingstudents to create their own concept maps [25].
Assessing effectivenessof concept maps in
accounting
Mass and Leauby (2005) compare two groups of students undertaking twoaccounting topics of income statement and cash flow statement. Its finding claimsthat the group using concept maps had a better understating of the two topics thanthe other group taught under the traditional instruction method [30].Leauby et al. (2010) appraise concept maps as a valuable learning tool as a resultfrom the survey response from students who used the concept map method in theintroductory accounting courses [11].
This paper appertains to the first research scheme in an attempt to redesign a concept map toimprove the Accounting Theory curricula. Given that current literature has highly appraised thestudent-generated concept mapping activities and teacher-student interactive mapping process fortheir contributions to an active learning environment, teacher-prepared or expert-made concept mapsmaintain an essential role in teaching practices [5,9,31]. Schewendimann emphasizes that teacher-madeconcepts “could support integrative understanding” and that, compared to student-generated maps,teacher-made maps seemingly “have an equally positive effect on improving students’ achievement” [5](p. 82). In particular, students suffering weak verbal ability or insufficient prior knowledge benefitgreatly from expert-made or instructor-prepared concept maps by recalling more central ideas fromthese maps than from texts [5].
The new curriculum concept map developed in this paper provides an alternative to the oldversion of mapping (Simon 2007), which draws on a narrow financial accounting perspective andmakes weak presentations of the connections between concepts [10]. Simon’s map is shown in Figure 1.
Simon’s work stands as the singular concept mapping attempt for the Accounting Theorycurriculum in previous literature, but it suffers from some serious limitations [10]. First, drawing ona financial orientation, this map has lost its comprehensiveness in depicting up-to-date curriculumknowledge system, where the accounting academy has highlighted non-financial development andtheorized accountability as the accounting base [12–15].
Second, Simon’s map fails to capture the intricate interconnections among accounting theories,concepts, and models. This problem places this map at a disadvantage in teaching some curriculumthemes that draw on these interrelationships, such as accounting evolution and sector-specificity ofaccounting practices (that is, practices of the same accounting principles vary significantly acrossdifferent accounting sectors).
Third, the linking phrases such as “can be” and “e.g.” substantively used in this map are toosimple, superficial, and unprofessional to effectively characterize the relationships between concepts.Canas, Novak, and Reiska comment that “excellent maps are explanatory, not descriptive”—that is,the quality of maps depends on their “depth of explanation” (p. 15) [8]. Therefore, the real problem
5

Educ. Sci. 2019, 9, 111
for concept mappers is not an ability to identify concepts to be linked, but the ability to determinepropositions to provide a clear explanation, including the professional narratives labeled on theselinks [8]. Kinchin highlights that concept mapping expertise is evidenced in “technical terms to applyin linking phrases to increase the explanatory power of the map” (p. 291) [32]. Simon’s map tends tobe of underdeveloped maps, which, as Kinchin critiques, “have used simple linking phrases to join theconcepts together” (p. 298) [32].
Figure 1. The old version of the curriculum concept map for (financial) Accounting Theory, sourcedfrom Simon (2007) [10] with trivial modifications.
All the aforementioned problems are tackled in this paper by means of a new curriculum conceptmap using a tree model. How this concept tree is designed and how it differs from the previousmapping work are subjects further discussed in the following sections.
3. Design of the Concept Tree for the Curriculum of Accounting Theory
3.1. The Tree Concept Map and Accounting Theory Knowledge
The tree form of concept maps, or the concept tree model, has been recognized in literature as oneof the basic structures of concept maps [17,18]. Normally, concept trees are suitable for a knowledgesystem where concepts can be sorted into distinctly comparative classes and sub-classes. Recentdevelopment of the accountability perspective provides the opportunity to use a concept tree to(re)model the knowledge system of accounting theories. First, theorizing accountability as the baseof accountings has become a generally accepted perspective and a robust thread throughout variousaccounting practices [13,15,33]. An accountability structure involves two interrelated social actors,called “accountor” and “accountee”, where the accountor has an obligation to give an accountthat justifies her/his performance to the accountee [34–37]. As Shearer notes, “accounting practicesenact accountability” (p. 569) [15], and accountability pervades the entire accounting phenomenon.To illustrate this, the ultimate purpose of traditional financial accounting is to enable a governing bodyof the reporting entity to discharge accountability to shareholders [37]. Comparatively, the objective ofsustainability accounting is for the entity to discharge accountability to stakeholders [33,38–41].
Second, the diversification of accounting contexts/sectors is justified from an analytic perspectiveof accountability. Table 2 presents the accountability relationships that regulate practices in the threemain accounting contexts/sectors, including corporate financial accounting, public-sector accounting,and sustainability accounting.
6

Educ. Sci. 2019, 9, 111
Table 2. Accountability and accounting contexts/sectors.
AccountingContexts/Sectors
Accountor Accountee Account
Corporate financialaccounting
Corporation/business entity Shareholders General-purpose financial reports
Sustainability accounting Corporation/business entity Stakeholders Formal and informal environmental and
social reports
Public sector accounting Government The public The government fiscal reports and audit reports
Note: this table integrates knowledge claims from [33,35,42].
3.2. The Sketch of the Concept Tree
In this redesign, the concept tree comprises the root, the trunk, the branches, the twigs,and the sub-twigs, all of which correspond to different concepts in different levels of the curriculumknowledge system.
Root: accountability denotes the root of the knowledge system, for it is the base of all accountingpractices.
Trunk: the trunk is symbolized by the traditional (corporate) financial accounting as the mainstreamaccounting knowledge sphere. Financial accounting acts as the prototype for other accounting systems,including public-sector accounting and sustainability accounting. Both non-financial accountingsystems entail a stage of simulating the traditional financial accountancy. It has been a zealous beliefthat public sector accounting originates from, mirrors, and keeps in line with corporate financialaccounting [43–45]. Likewise, sustainability accounting is developed from the track of the financialaccounting system [12,46].
Branches: sustainability accounting and public-sector accounting are denoted as two branchesdiversified from the trunk, which stands for the mainstream (corporate financial) accounting.Their emergence and development are attributed to critical stances against the conventional accountancy,and standards and practical models associated with the two accounting systems are comparable tobut significantly different from the financial accounting venue [12,44]. For example, sustainabilityaccounting standards are inhered with non-financial and not-for-profit elements in establishing theaccounting scopes, principles, and procedures [39,40]. Barton compares public-sector accounting andcorporate financial accounting, attributing the considerable variances between the two systems to“differences in the roles and operating environment of governments and business” [44].
Twigs and sub-twigs: twigs signify academic schools and streams within an accountingcontext/sector (branch). Associated with the schools or streams are sector-specific standards, principles,and theories, which are denoted as sub-twigs. For example, the stream of capital market research is atwig of the financial accounting branch, including sub-twigs such as the efficient market hypothesis.There are lower levels of sub-twigs, such as the practical models to operationalize the standards andthe principles. For example, the historical cost alternative (sub-twig) is operationalized into lower-levelsub-twig models of economic value, net realized value, replacement cost, and deprival value.
3.3. Bifurcations
Bifurcations address the idea of “threshold concept”, which refers to “a transformed way ofunderstanding, or interpreting, or viewing something” (p. 1) [45]. A bifurcation symbolizes a thresholdfrom which a new accounting branch/twig emerges from the conventional accounting venue. It marksthe conflicting assumptions between two accounting branches or twigs that can be alternative to eachother. The signposts labeled in bifurcations are used to express the rationales that underpin suchinconsistencies and conflicts between concepts or theories. For example, the bifurcation betweenthe financial accounting trunk and the sustainability accounting branch is labeled with the signpost,“financial versus non-financial”, denoting the non-financial element that distinguishes sustainability
7
Educ. Sci. 2019, 9, 111
accounting from its traditional counterpart. Another example is the twig-to-twig bifurcation witha sign of “historical cost versus anti-historical cost” to distinguish between financial reporting andthe alternative measurement method. It suggests financial reporting is underpinned by the historicalcost assumption, whilst the alternative measurement methodologists adopt an opposing stance tothis assumption.
3.4. Linking Phrases
Twig notes are used as linking phrases to explain relationships between a higher level conceptand a lower level concept, e.g., between a branch and a twig, or between a twig and its sub-twig.These twig notes (linking phrases) are shown in the Table 3.
Table 3. Twig notes as linking phrases.
Twig notes Abbreviation Examples
Consist(s) of C Accounting principles consist of materiality.
Be derived from D Capital market research is derived from market efficiency hypothesis.
Be in the form of F Creative accounting can be in the form of “window dressing”.
Be to guide G Financial reporting standards are to guide “recognition” of financial items.
Be operationalized as O Alternative costs can be operationalized as deprival value.
Regulates R Accountabiltiy regulates the “corporation–stakeholder relationship” in the domainof sustainability accounting.
Be to study S Agency theory is to study information asymmetry.
Be underpinned by U “New school” (of sustainability accounting) is underpinned by stakeholder primacy.
3.5. Colors and Their Implications
Colors are used to highlight “accounting changes” from bifurcations, which result in germinationof a new accounting branch or a new twig within the branch. We render further implications of colorsused in this accounting tree, as shown in the Table 4.
Table 4. Colors and implications in the accounting concept tree.
Objects Color Implications
Bifurcations Deep blue Deep blue represents wisdom. It implies potential to generate new sophisticated theoreticalperspectives or philosophies.
Accountability Brown Brown is the color of soil, referring to accountability as the root for the whole accounting system.
Financial accounting(trunk) Gold The gold color denotes the for-profit assumption of (traditional corporate) financial accounting.
Sustainabilityaccounting (branch)
Green +Gold
The new school is colored with green, aiming at improving environmental andsocial performance.
The old school adopts the same color of gold as financial accounting. This is in accordance withthe view that old school holds a “for-profit” (shareholder primacy) element, and it is part of
financial accounting.
Public-sectoraccounting (branch) Sky blue Sky blue stands for harmony and trustworthiness, associated with the “for the public”
assumption of public-sector accounting.
Alternativemeasurement (twig) Yellow Yellow refers to opportunity and awareness, highlighting alternative measurement methods as
“alternatives” to the traditional historical costing in making managerial decisions.
Capital marketresearch (sub-twig) Red Red implies good signs or prosperousness in capital markets.
Creative accounting(sub-twig) Grey
Creative accounting is a “grey zone” in financial reporting, exploiting loopholes in financialreporting regulation to gain advantages. It is not illegal but deviates from the
spirit of accounting.
3.6. The Curriculum Concept Tree of Accounting Theory
Figure 2 is the product of the tree-like concept map for the curriculum of Accounting Theory.In the figure, accounting theories and concepts are modeled into a tree. Located at the root is
8

Educ. Sci. 2019, 9, 111
accountability, which represents the foundation of accounting practices. The accountability rootbuttressed the financial accounting trunk (main branch) and the branches of public-sector accountingand sustainability accounting. This layout visualizes the theory that accountability underlies allaccounting phenomena, and different accountor–accountee relationships regulate various sector-specificaccounting practices [33,42,46–48]. The bifurcation signposts indicate the difference between accountingsectors (branches), academic schools and streams (twigs), and sector-specific standards, principles,and practical models (sub-twigs and lower-level sub-twigs).
Corporate Financial
accounting
Financial reporting standards
Substance
over form Going concerns
Materiality
Reporting
entity
Prudency
Accountability (root) (accountor-accountee relationship)
Corporation – Stakeholders (sustainability accounting)
Corporation – Shareholders (corporate financial accounting)
Government - public (public-sector accounting)
Capital market research
Market
efficiency
hypothesi
Positive accounting theory in context
Agency theory
in context
Agency problem
Agency cost
Information
asymmetry
Industrial policy implications vs. individual entity requirements
Creative accounting
Off-balance
sheet financing Window
dressing
Profit smoothing
Aggressive earning
Regulation vs. loophole exploitation
Completenes
Stakeholder-oriented vs. shareholder-oriented
Normative accounting
theory in context
Financial vs. non-financial
Normative accounting theory in context
Government vs. corporate business Not-for-profit vs. for-profit
Normative accounting theory in context
Economic value
Displacement cost
Alternative costs
Realisable value
Deprival value
Alternative accounting Systems
Current
purchasing
power
accounting
Current cost
accounting
Alternative
Measurements
Historical cost vs. anti-historical cost
Normative accounting theory in context
Principles Recognition
Liabilities Assets
Equity
Expense
Revenues
Rules of thumb model
O
U
C
O
U U
U
U
O
O
R R R
C
O
C
D
S
U
S
S F
F
F F
C
C
C
C
O
O O
O
U G
C
C
C
C C C C
C O
C
Figure 2. The concept tree of Accounting Theory.
9
Educ. Sci. 2019, 9, 111
3.7. A Comparison between the Two Curriculum Concept Maps
Table 5 outlines some main characteristics of this concept tree in contrast to Simon (2007)’scurriculum concept map of financial accounting theory.
Table 5. The main differences between Simon’s map and the concept tree.
ComparativeThemes
The Old Concept Map(Simon 2007) [4]
The Concept Tree(Developed in this Paper)
Comments on the Redesign
Accountability Not included.Highlighted as the
foundation of accountingpractices.
Addressing the exceptionally importantaccountability perspective to
accounting.
Public sectoraccounting Not covered.
Public-sector accounting isdiverged from traditional
(corporate) financialaccounting.
Addressing public-sector accountingthat is not for profit and not applied in
the business environment.
Environmental andsocial perspectives of
accounting
Taken as part of financialaccounting.
Sustainability(environmental and social)accounting is diversifiedfrom financial accounting
and encompasses twostreams.
The old school having ashareholder-primacy orientation is
closely related to financial accounting,intimating the traditional view
presented in Simon’s map.The new school holding non-financialand stakeholder-based elements hasbecome mainstream in sustainability
accounting. The new school is beyondthe scope of Simon’s map.
Comparison andcontrast
It fails to recognize thealternative perspectives and
lacks comparisons andcontrasts between them.
Comparisons betweenconcepts are used to indicate
how accountingcontexts/sectors and streams
are diversified.
Addressing accounting evolution;justifying how new accounting systems
and streams/schools were developedfrom the traditional venue.
Linking phrasesFocuses on only two simpleterms, “can be” and “e.g.”,
to describe the relationships.
Uses multiple technicalterms to indicate the
relationships.
Elucidating the complex relationshipsbetween accounting concepts.
Accounting researchmethodology
Presented asindividual streams.
Consolidated in accountingcontexts/sectors.
Providing a concrete understanding onaccounting research methodology.
4. Educational Insights
Embedded with a research-centered element, the Accounting Theory curriculum is destined toassist students in comprehending the consolidation of accounting thoughts and discoveries, opening adoor for them to probe into the nature of accounting phenomena. The concept tree plays an informativerole to substantiate this essential aspect of the curriculum.
4.1. Feeling the Pulses of Accountancy Development
As an alternative to the old curriculum map [4], this concept tree embraces the advancedperspectives that have profoundly reframed the system of accounting knowledge. It enables studentsto update their theoretical understanding on accounting and then feel the pulses of accountancydevelopment. In teaching practices, students are advised to compare the old and the new conceptmap and to clarify the major changes in accounting theories, including the general acceptance of theaccountability-root view and the classification of accounting contexts/sectors that are regulated bydifferent accountor–accountee relationships.
The elucidation is then prolonged according to this tree layout through introducing and commentingon the most recent theoretical debates associated with non-financial accountings, such as “business-likepublic sector accounting”, “intelligent accountability”, “theological or religious aspect of accountability”,and “non-human stakeholders in sustainability accounting”. These debates involve sharp critiquesand radical ideas that have not been generally accepted or have remained exceptionally unpopular.However, they do represent cutting-edge understandings and brave attempts to promote advancementof accounting theories. Informed by the tree map, students not only acknowledge the new imperative
10

Educ. Sci. 2019, 9, 111
accounting philosophies that have reformed the knowledge system, but also develop a precious spiritof critical thinking voiced from the infrequent endeavors in challenging the status quo.
4.2. Addressing Accounting Evolution
An advantage of this concept tree is its capacity to display and justify how accounting evolvedand is evolving, which is attributed to the use of bifurcation signposts between different branches andbetween different twigs in a branch. To illustrate this, in contrast to the mainstream financial accounting(trunk) in pursuit of financial profits for individual business entities, public-sector accounting (branch)rests on a not-for-profit and public interest element, and sustainability accounting (branch) is developedto address non-financial and non-profit concerns. The bifurcation signposts between the trunk andthe two new accounting branches characterize the base and the vein of how the two non-financialaccounting systems emerged from critiques of the traditional accounting suppositions.
In a teaching setting, this concept tree is integrated in a story-telling method, where studentscan learn the accounting theories from a historical perspective. It was found that this innovativeapproach not only raised students’ interests in studying theories themselves, but also triggered theirenthusiasm in exploring the socio-economic backgrounds on which these theories were engendered.For example, presentation of the history of deprival value is complemented by the concept tree in thelecture. The bifurcation signpost between the twigs of financial reporting and alternative measurementinforms that the deprival value contends an opposing stance against the historical cost assumption onwhich financial reporting standards are based. Associated with this bifurcation is a sequence of criticalthinking questions regarding the invention of deprival value: (1) What were the problems of historicalcost assumption when applied in practice? (2) How did the deprival value enable one to solve theseproblems? (3) How did the deprival value influence a generation of accounting scholars? (4) Whatlessons and experiences can we learn from this story regarding accounting evolution? These questions,ascribed to the historic story of deprival value, led students to probe into a deeper understanding ofthis accounting concept, motivating them to deliberate the nature and the practical implications ofaccounting evolution.
4.3. Understanding Accounting Research Methodology in Contexts
The distinction between the two research methods—normative accounting and positiveaccounting—is basic knowledge in this curriculum. Compared to the traditional way of parallelingthe accounting research methodology to the practical accounting systems (as shown in Simon’s map(2007) [10], this concept tree integrates the methodological understanding across and within accountingcontexts. For instance, the concept tree illustrates the origin of positive accounting in the field (twig) ofcapital market research [49,50], and the normative accounting research is associated with the critiqueof existing theories and the exploration of alternative theories (refer to the bifurcation signposts).This is evidenced in the emergence of new branches or twigs in the concept tree. Sustainabilityaccounting can be understood as one example of normative theory, for this new accounting systemwith a non-financial element is used to substitute for the traditional financial accounting routines indealing with non-financial environmental and social issues [12]. The alternative measurements can beviewed as another example of normative theory, in which the historical cost assumption is refused dueto its inability to reflect current value and future benefit.
4.4. Enhancing Understanding of Sector-Specific Accounting Practices
The context- or sector-specificity of accounting practices as a relatively new philosophic perspectivehas gained prominence in the accounting academy [42,51,52]. It argues that, provided an accountingprinciple is applicable to different accounting sectors/contexts (such as financial business accounting,governmental accounting, and sustainability accounting), practical models and operationalizationmethods of this principle vary significantly across these accounting sectors [12,42,44,53]. The concepttree reinforces the understandability of this important perspective, guiding students to observe,
11
Educ. Sci. 2019, 9, 111
deliberate, and analyze the sector-dependent nature of accounting phenomena. For example, the GRIsustainability reporting standards and the financial reporting standards symbolize sub-twigs fromdifferent accounting branches in the concept tree. This graphic outlook enables an immediate grasp of thedifferences between the two reporting systems and provides a foundation for the later implementationof concrete cases, through which these differences are investigated in detail, from reporting principlesto procedures and formats.
Another application exemplar is the research case of operationalizing the materiality principle inpractices. The accounting academy has observed that public-sector accountants and auditors tendto apply a much stricter materiality level (significance of an issue) than their corporate financialpeers [53,54]. That is, an issue that is considered insignificant from the view of corporate accountantsand auditors may be regarded as significant for public-sector accounting practices. Theorists attributethis variance to the different scopes of accountability, where financial accounting practitioners areaccountable to only a small group of shareholders, whilst public-sector accountants/auditors bearaccountability to the whole society [53,55]. The concept tree enables a graphic reference to understandthis phenomenon, where the materiality sub-twigs appear in the different branches of traditionalfinancial accounting and public-sector accounting, and the two branches are regulated by differentaccountor–accountee relationships. This graphic reference drawn from the concept tree has been usedto introduce the sector-specific materiality phenomenon and the relevant theoretical explanations,thereby enhancing a meaningful learning manner through which the theories are visualized [21,22].
5. Notes to the Curriculum Design
The concept tree performs a function of designing and steering the curriculum. The curriculumdesign experiences pertinent to its application are documented as follows.
5.1. Sequence of Lecture Topics
Concept mapping is a useful vehicle for educators to “consider sequencing of topics” (p. 305) [11],a critical requirement for curricula due to the linear nature of instructional processes [1]. The concepttree endorses a sequence of curriculum topics. To begin, the concept tree is introduced in the initiallecture (Topic 1) to outline the overall curriculum knowledge system. Topic 1 also involves a briefexplanation of the accountability theory and the accounting research methodology as they pertain tonormative and positive theories. The other topics of the curriculum are sequenced and correspond todifferent parts of the tree, such as: financial reporting system (Topic 2, mainstream/trunk), alternativemeasurements to historical costs (Topic 3, twig), capital market research (Topic 4, twig), accountabilitytheory (Topic 5, root), sustainability accounting (Topic 6, branch), public-sector accounting (Topic 7,branch), and advanced issues in accounting theory (Topic 8). Except for the introductory Topic 1,the sequencing starts from the financial reporting system (Topic 2) and its closely related Topics 3and 4, and then to the non-financial accounting Topics 5, 6, and 7. The final topic, Topic 8, concernsprogressive theses, antitheses, and debates in accounting studies, covering all previous topics.
The rationale inherent to this sequencing is in line with Ausubel’s meaningful learning theory [21,22],which holds that an efficient learning process is produced when new knowledge can be related toknowledge already known. A prerequisite for the Accounting Theory (and Application) curriculum isthe unit of Principles of Accounting, which conjoins with the topic of corporate financial reporting.As this topic contains knowledge that students are familiar with before they start the curriculum, it isset as the second topic immediately following the introductory topic. Accountability theory (Topic 5)is allocated before sustainability accounting (Topic 6). This arrangement is in accordance with anepistemic perspective that accountability theory is the ethical foundation for the development ofsustainability accounting [13].
12

Educ. Sci. 2019, 9, 111
5.2. Cohesion of Topics
A problem pertains to the complex multifaceted content presented in the curriculum, wherestudents often get lost in lectures due to difficulty relating individual knowledge pieces to thecomprehensive picture [2]. To address this concern, the concept tree is displayed at the beginning ofeach lecture, highlighting the place of the current topic in the whole system of curriculum knowledge.During each lecture, students are inspired to use the bifurcation signposts to compare the currenttopic and the topics previously learned. For example, the bifurcation signpost, “industrial policyimplications versus individual entity accounting requirements”, indicates the difference of scope andpurpose between the two topics/twigs—capital market research and financial reporting system. In thelecture of capital market research (Topic 3), this signpost provides hints for students to further developtheir understanding by referring to Topic 2:
(1) how positive accounting researchers, whose work is to discover behavioral modes ofcompanies in response to different accounting (Topic 3), play different roles from corporate accountants,who prepare financial reports according to the pre-set standards (Topic 2); and
(2) how to apply the agency theory in the capital market context (Topic 3) to prevent creativeaccounting problems associated with financial reporting standards (Topic 2).
5.3. A Meaningful Learning Mode of Exam Design
To our teaching experiences, exam questions prepared for this curriculum are easily designedon “a mode of rote learning” [21], which requires students to restate the definitions of accountingtheories and concepts. The memory-test exam questions fail to assess whether students have reallycomprehended the theoretical knowledge and whether they are able to apply theories to practices.The concept tree can be useful to design consolidated case-based exam questions that integrate differentaccounting models, therefore attaining “the mode of meaningful learning” [21]. This application isshown in the following sample exam questions (Box 1).
Box 1. Memory-test (rote learning) questions prepared for the exam.
Question 1: Define the normative accounting theory;Question 2: Define the historical cost assumption;Question 3: Discuss the advantages and the disadvantages of the historical cost method;Question 4: Present the straight-line depreciation model to recognize a fixed asset;Questions 5: Explain these values: market value, net realizable value, economic value.
These exam questions simply require students to remember the textbook-based definitions andcalculation formulas. The memory-test method to which the sample questions adhere is typical of rotelearning and has been seriously critiqued in educational literature [1,21,22,56].
It is an attempt to redesign these questions in favor of a meaningful learning style. The first stepis to establish a reference for these questions in the tree-shaped concept map, as shown in Table 6.
The bifurcation signpost, “historical cost versus anti-historical cost”, indicates the fundamentaldifferences between the two different twigs to which the financial reporting and the alternative costsbelong, respectively. Furthermore, this signpost links to the adjacently noted “in-context normativetheory”, which was developed on the critique of the traditional historical cost. These connections formthe condition under which it is possible to design a case used to integrate the separated knowledgepieces into a consolidated body for the exam, which is shown in Box 2.
Compared to exam questions in Box 1, which require students to replicate the definitions ofindividual concepts or formulas of the models, the exam redesign (Box 2) inspired by the concepttree synthesizes different knowledge pieces into a concrete, sophisticated, and practice-based case,which enables a more effective test of students’ conceptual understandings and practical applications.
13
Educ. Sci. 2019, 9, 111
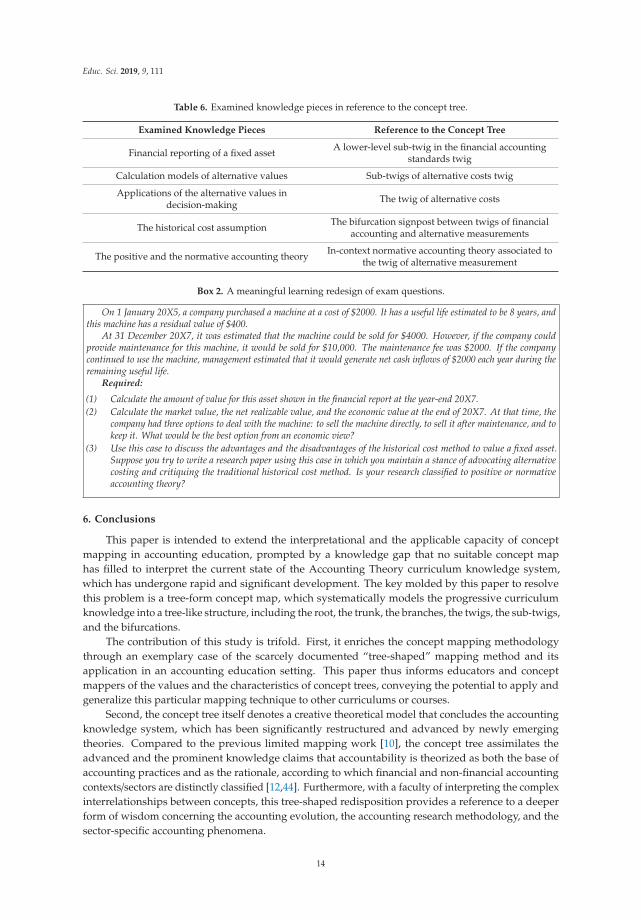
Table 6. Examined knowledge pieces in reference to the concept tree.
Examined Knowledge Pieces Reference to the Concept Tree
Financial reporting of a fixed asset A lower-level sub-twig in the financial accountingstandards twig
Calculation models of alternative values Sub-twigs of alternative costs twig
Applications of the alternative values indecision-making The twig of alternative costs
The historical cost assumption The bifurcation signpost between twigs of financialaccounting and alternative measurements
The positive and the normative accounting theory In-context normative accounting theory associated tothe twig of alternative measurement
Box 2. A meaningful learning redesign of exam questions.
On 1 January 20X5, a company purchased a machine at a cost of $2000. It has a useful life estimated to be 8 years, andthis machine has a residual value of $400.
At 31 December 20X7, it was estimated that the machine could be sold for $4000. However, if the company couldprovide maintenance for this machine, it would be sold for $10,000. The maintenance fee was $2000. If the companycontinued to use the machine, management estimated that it would generate net cash inflows of $2000 each year during theremaining useful life.
Required:
(1) Calculate the amount of value for this asset shown in the financial report at the year-end 20X7.(2) Calculate the market value, the net realizable value, and the economic value at the end of 20X7. At that time, the
company had three options to deal with the machine: to sell the machine directly, to sell it after maintenance, and tokeep it. What would be the best option from an economic view?
(3) Use this case to discuss the advantages and the disadvantages of the historical cost method to value a fixed asset.Suppose you try to write a research paper using this case in which you maintain a stance of advocating alternativecosting and critiquing the traditional historical cost method. Is your research classified to positive or normativeaccounting theory?
6. Conclusions
This paper is intended to extend the interpretational and the applicable capacity of conceptmapping in accounting education, prompted by a knowledge gap that no suitable concept maphas filled to interpret the current state of the Accounting Theory curriculum knowledge system,which has undergone rapid and significant development. The key molded by this paper to resolvethis problem is a tree-form concept map, which systematically models the progressive curriculumknowledge into a tree-like structure, including the root, the trunk, the branches, the twigs, the sub-twigs,and the bifurcations.
The contribution of this study is trifold. First, it enriches the concept mapping methodologythrough an exemplary case of the scarcely documented “tree-shaped” mapping method and itsapplication in an accounting education setting. This paper thus informs educators and conceptmappers of the values and the characteristics of concept trees, conveying the potential to apply andgeneralize this particular mapping technique to other curriculums or courses.
Second, the concept tree itself denotes a creative theoretical model that concludes the accountingknowledge system, which has been significantly restructured and advanced by newly emergingtheories. Compared to the previous limited mapping work [10], the concept tree assimilates theadvanced and the prominent knowledge claims that accountability is theorized as both the base ofaccounting practices and as the rationale, according to which financial and non-financial accountingcontexts/sectors are distinctly classified [12,44]. Furthermore, with a faculty of interpreting the complexinterrelationships between concepts, this tree-shaped redisposition provides a reference to a deeperform of wisdom concerning the accounting evolution, the accounting research methodology, and thesector-specific accounting phenomena.
14

Educ. Sci. 2019, 9, 111
The curriculum development that the concept tree facilitates is the third contribution. The tree-shapedconcept map sets visual guidelines for educators to sequence and cohere topics, thereby enablingstudents to concisely communicate the voluminous and complex information that encompasses manyaspects of the curriculum [57]. In addition, this concept tree has proved to be a useful device indesigning exam questions, by which the pedagogy is redirected from a memory-test mode towarda meaningful learning track, where students are required to make efforts to comprehend, integrate,and apply their theoretical knowledge into concrete practices.
Funding: This research received no external funding.
Conflicts of Interest: The author declares no conflict of interest.
References
1. Novak, J.D.; Gowin, D.B. Learning How to Learn; Cambridge University Press: New York, NY, USA, 1984.2. Canas, A.J. A Summary of Literature Pertaining to the Use of Concept Mapping Techniques and Technologies
for Education and Performance Support; The Institute for Human and Machine Cognition: Pensacola, FL,USA, 2003.
3. Schwendimann, B. Concept mapping. In Encyclopedia of Science Education; Gunstone, R., Ed.; Springer:Amsterdam, The Netherlands, 2015.
4. Wise, A.M. Map It: How Concept Mapping Affects Understanding of Evolutionary Processes. Ph.D. Thesis,University of California, Davis, CA, USA, 2009.
5. Schwendimann, B.A. Concept maps as versatile tools to integrate complex ideas: From kindergarten tohigher and professional education. Knowl. Manag. E-Learn. 2015, 7, 73–99.
6. Bridges, S.M.; Corbet, E.F.; Chan, L.K. Designing problem-based curricula: The role of concept mapping inscaffolding learning for the health sciences. Knowl. Manag. E-Learn. 2015, 7, 119–133.
7. Hay, D.B.; Proctor, M. Concept maps which visualise the artifice of teaching sequence: Cognition, linguisticand problem-based views on a common teaching problem. Knowl. Manag. E-Learn. 2015, 7, 36–55.
8. Cañas, A.J.; Novak, J.D.; Reiska, P. How good is my concept map? Am I a good Cmapper? Knowl. Manag.E-Learn. 2015, 7, 6–19.
9. Kinchin, I.M. Concept Mapping as a Learning Tool in Higher Education: A Critical Analysis of RecentReviews. J. Contin. High. Educ. 2014, 62, 39–49. [CrossRef]
10. Simon, J. Concept mapping in a financial accounting theory course. Acc. Educ. 2007, 16, 273–308. [CrossRef]11. Leauby, B.A.; Szabat, K.; Mass, J.D. Concept mapping—An empirical study in introductory financial
accounting. Acc. Educ. 2010, 19, 279–300. [CrossRef]12. Lamberton, G. Sustainability accounting—A brief history and a conceptual framework. Acc. Forum 2005, 29,
7–26. [CrossRef]13. Roberts, J. No one is perfect: The limits of transparency and an ethic for ‘intelligent’ accountability.
Acc. Organ. Soc. 2009, 34, 957–970. [CrossRef]14. Schaltegger, S.; Burritt, R.L. Sustainability accounting for companies: catchphrase or decision support for
business leaders? J. World Bus. 2010, 45, 375–384. [CrossRef]15. Shearer, T. Ethics and accountability: from the for-itself to the for-the-other. Acc. Organ. Soc. 2002, 27,
541–573. [CrossRef]16. Simon, J. Curriculum changes using concept maps. Acc. Educ. 2010, 19, 301–307. [CrossRef]17. Vanides, J.; Yin, Y.; Tomita, M.; Ruiz-Primo, M.A. Using concept maps in the science classroom. Sci. Soc.
2005, 28, 27–31.18. Solvie, P.A.; Sungur, E. Concept maps/graphs/trees/vines in education. Presented at the 5th WSEAS
International Conference on E-ACTIVITIES, Venice, Italy, 20 November 2006.19. Gilmour, S.J. Daz Sint Noch Ungelogenius Wort: A Literary Linguistic Commentary on Gurnemanz, Episode.
In Book III of Wolfram’s Parzival; Universitatsverlag Winter: Heidelberg, Germany, 2000.20. Alexandre, F. Trees, waves and linkages: models of language diversification. In The Routledge Handbook of
Historical Linguistics; Bowern, B., Evans, C., Eds.; Routledge: New York, NY, USA, 2014; pp. 161–189.21. Ausubel, D. The Psychology of Meaningful Verbal Learning; Grune & Stratton: Oxford, UK, 1963.
15
Educ. Sci. 2019, 9, 111
22. Ausubel, D. The Acquisition and Retention of Knowledge: A Cognitive View; Springer: Amsterdam,The Netherlands, 2012.
23. Ausubel, D. The use of advance organizers in the learning and retention of meaningful verbal material.J. Educ. Psychol. 1960, 5, 267–272. [CrossRef]
24. Mayer, R.E. Can advance organizers influence meaningful learning? Rev. Educ. Res. 1979, 49, 371–383.[CrossRef]
25. Ausubel, D. Educational Psychology: A Cognitive View; Holt, Rinehart and Winston: New York, NY, USA, 1968.26. Rovira, C. Theoretical foundation and literature review of the study of concept maps using eye tracking
methodology. Prof. Inf. 2016, 25, 59–73. [CrossRef]27. Handy, S.A.; Polimeni, R.S. Concept mapping—A graphical tool to enhance learning in an introductory cost
or managerial accounting course. J. Acad. Bus. Educ. 2017, 18, 161–174.28. Mass, J.D.; Leauby, B.A. Active learning and assessment: A student guide to using concept mapping in
financial accounting. Glob. Perspect. Acc. Educ. 2014, 11, 41–63.29. Shimerda, T.A. Concept mapping: A technique to aid meaningful learning in business and accounting
education. Indian J. Econ. Bus. 2007, 6, 117–124.30. Mass, J.D.; Leauby, B.A. Concept mapping—Exploring its value as a meaningful learning tool in accounting
education. Glob. Perspect. Acc. Educ. 2005, 2, 75–98.31. Cañas, A.J.; Novak, J.D. Concept mapping using cmap tools to enhance meaningful learning. In Knowledge
Cartography: Software Tools and Mapping Techniques; Okada, A., Shum, S.B., Sherborne, T., Eds.; Springer-Verlag:London, UK, 2008; pp. 25–46.
32. Kinchin, I.M. Pedagogic frailty: A concept analysis. Knowl. Manag. E-Learn. 2017, 9, 295–310.33. Gray, R.; Adams, C.; Owen, D. Accountability, Social Responsibility and Sustainability: Accounting for Society and
the Environment; Pearson Education Limited: London, UK, 2014.34. Goetz, A.; Jenkins, R. Voice, Accountability and Human Development: The Emergence of a New Agenda;
United Nations Development Programme: New York, NY, USA, 2002.35. Mashaw, J. Accountability and institutional design: Some thoughts on the grammar of governance.
In Public Accountability: Designs, Dilemmas and Experiences; Dowdle, M.W., Ed.; Cambridge University Press:Cambridge, UK, 2006; pp. 115–156.
36. Schedler, A. Conceptualizing accountability. In The Self-Restraining State: Power and Accountability in NewDemocracies; Schedler, A., Diamond, L., Plattner, M., Eds.; Lynne Rienner Publishers: London, UK, 1999;pp. 13–28.
37. Bovens, M. Analysing and assessing accountability: A conceptual framework. Eur. Law J. 2007, 13, 447–468.[CrossRef]
38. Australia Auditing Standard Board. Materiality and Audit Adjustments AUS 306; Australian AccountingResearch Foundation: Melbourne, Australia, 2001.
39. Global Reporting Initiative. G4 Sustainability Reporting Guidelines (GRI G4); GRI: Amsterdam, The Netherlands, 2013.40. AccountAbility. AA1000 AccountAbility Principles Standard 2008 (AA1000APS 2008); AccountAbility: London,
UK, 2008.41. Murninghan, M. Redefining Materiality II: Why it Matters, Who’s Involved, and What it Means for Corporate
Leaders and Boards; AccountAbility: London, UK, 2013.42. Zhou, Y. Materiality in Sustainability Accounting: A Critical Realist Perspective. Ph.D. Thesis, Southern
Cross University, Lismore, Australia, 2017.43. Anon. IFAC Public Sector Meets in New Zealand. Acc. J. 1993, 72, 34–37.44. Barton, A. Professional accounting standards and the public sector—A mismatch. Abacus 2005, 41, 138–158.
[CrossRef]45. Meyer, J.; Land, R. Threshold Concepts and Troublesome Knowledge: Linkages to Ways of Thinking and Practising
within the Disciplines; University of Edinburgh: Edinburgh, UK, 2003; pp. 412–424.46. Christensen, M.; Newberry, S.; Potter, B. Enabling global accounting change: Epistemic communities and the
creation of a ‘more business-like’ public sector. Crit. Perspect. Acc. 2019, 58, 53–76. [CrossRef]47. Herath, G. Sustainable development and environmental accounting: the challenge to the economics and
accounting profession. Int. J. Soc. Econ. 2005, 32, 1035–1050. [CrossRef]48. Hardy, L.; Ballis, H. Accountability and giving accounts. Acc. Audit. Acc. J. 2013, 26, 539–566. [CrossRef]
16
Educ. Sci. 2019, 9, 111
49. Ball, R.; Brown, P. An empirical evaluation of accounting income numbers. J. Acc. Res. 1968, 6, 159–178.[CrossRef]
50. Watts, R.L.; Zimmerman, J.L. Towards a positive theory of the determination of accounting standards.Acc. Rev. 1978, 53, 112–134.
51. Modell, S. In defence of triangulation: A critical realist approach to mixed methods research in managementaccounting. Manag. Acc. Res. 2009, 20, 208–221. [CrossRef]
52. Modell, S. Critical realist accounting: In search of its emancipatory potential. Crit. Pers. Acc. 2017, 42, 20–35.[CrossRef]
53. Zhou, Y.; Zhou, G. Establishing judgement about materiality in government audits: Experience from Chineselocal government auditors. Int. J. Gov. Audit. 2011, 38, 9–14.
54. Raman, K.; Van Daniker, R. Materiality in government auditing. J. Acc. 1994, 177, 71–76.55. DeZoort, T.; Harrison, P.; Taylor, M. Accountability and auditors’ materiality judgments: the effects of
differential pressure strength on conservatism, variability, and effect. Acc. Organ. Soc. 2006, 31, 373–390.[CrossRef]
56. Novak, J.D. Learning, Creating, and Using Knowledge: Concept Maps as Facilitative Tools in Schools and Corporations;Lawrence Erlbaum Association: Mahwah, NJ, USA, 1998.
57. Edmondson, K.M. Concept maps as reflectors of conceptual understanding. J. Res. Sci. Teach. 1983, 13, 19–26.
© 2019 by the author. Licensee MDPI, Basel, Switzerland. This article is an open accessarticle distributed under the terms and conditions of the Creative Commons Attribution(CC BY) license (http://creativecommons.org/licenses/by/4.0/).
17


education sciences
Article
Uncovering Types of Knowledge in Concept Maps
Ian M. Kinchin 1,*, Aet Möllits 2 and Priit Reiska 3
1 Department of Higher Education, University of Surrey, Guildford GU2 7XH, UK2 School of Educational Sciences, Tallinn University, Narva mnt 25, 10120 Tallinn, Estonia; [email protected] School of Natural Sciences and Health, Tallinn University, Narva mnt 25, 10120 Tallinn, Estonia; [email protected]* Correspondence: [email protected]
Received: 27 May 2019; Accepted: 7 June 2019; Published: 13 June 2019
Abstract: Concept maps have been shown to have a positive impact on the quality of student learningin a variety of disciplinary contexts and educational levels from primary school to university byhelping students to connect ideas and develop a productive knowledge structure to support futurelearning. However, the evaluation of concept maps has always been a contentious issue. Some authorsfocus on the quantitative assessment of maps, while others prefer a more descriptive determinationof map quality. To our knowledge, no previous consideration of concept maps has evaluated thedifferent types of knowledge (e.g., procedural and conceptual) embedded within a concept map,or the ways in which they may interact. In this paper we consider maps using the lens provided by theLegitimation Code Theory (LCT) to analyze concept maps in terms of semantic gravity and semanticdensity. Weaving between these qualitatively, different knowledges are considered necessary toachieve professional knowledge or expert understanding. Exemplar maps are used as illustrations ofthe way in which students may navigate their learning towards expertise and how this is manifestedin their concept maps. Implications for curriculum design and teaching evaluation are included.
Keywords: semantic density; semantic gravity; Legitimation Code Theory; expertise; theory-practice
1. Introduction
The primary focus of 21st century education is to support students to develop meaningfulknowledge that can be applied to a range of evolving, real-world settings [1–3]. The world with all itscomplexity—including a rapid growth of information and knowledge, along with increased pressureson the educational system—creates a challenge to help students to develop the skills to navigate thesecomplexities. Therefore, the key role of curricula at school and at university is to promote theoreticalknowledge that underpins evolving practice, and to help students to navigate between theoretical andeveryday knowledge and between different kinds of theoretical knowledge [3]. Additionally, learnersin higher education have to be prepared with appropriate, authentic contextual knowledge to ensuregraduate employability [4].
In any discipline, novices tend to have loosely organized knowledge, where concepts andstrategies are not well linked, while experts have a highly organized and well-structured knowledgebase that allows them to use information meaningfully to solve problems [5,6]. Rather thanadopting a trial-and-error approach that is typical for a novice, we need experts that can usea principles-based approach to solve problems [7]. With this in mind, several researchers havedemonstrated the benefits of concept mapping in teaching, learning and assessing scientific subjects.The use of concept maps has been shown repeatedly to be an effective tool for improving conceptualunderstanding [8–12], developing higher-order thinking skills [13], revealing misconceptions [14,15]and eliciting achievements and grades [16]. Therefore, we ask: what do concept maps reveal if weexplore different types of knowledge (novice, theoretical, practical and professional) in students’concept maps?
Educ. Sci. 2019, 9, 131; doi:10.3390/educsci9020131 www.mdpi.com/journal/education19
Educ. Sci. 2019, 9, 131
The scoring of concept maps and the awarding of a single number to summarize map qualitymay give an indication of how much information a student has acquired during his/her study, but itdoes not provide any indication of the types of knowledge that have been acquired (e.g., conceptualor procedural) or the relationships that the student has identified between knowledge types. Thisrecognition if different knowledges has been described as essential for developing the basic characteristicof the expert student [17] who needs to recognize the existence and complementary purposes ofdifferent knowledge structures. This has been overlooked in the research literature on concept mappingthat has tended to foreground the development of conceptual knowledge to the exclusion of proceduralknowledge. The focus on the development of a discrete single map structure has emphasized thisbias in knowledge type, with procedural knowledge often being buried within a map of conceptualknowledge. Kinchin and Cabot have discussed how expertise requires the oscillation between linearstructures of procedural knowledge and networked structures of underpinning conceptual knowledge,but they did not offer any framework to assess the relationship between the two or how this mayevolve over time [18].
In this paper we explore how different types of knowledge are embedded within a conceptmap and interact to each other. Concept maps that represent learners’ knowledge structures havebeen associated with meaningful learning theory [19] and the promotion of higher order thinkingskills [13]. Here, we present a major shift in emphasis in concept map evaluation by considering theanalysis of concept maps in relation to the semantics dimension of Legitimation Code Theory [20].This not only provides a commentary on the student’s progress, but also offers a critique of thecurriculum experienced and the way in which it facilitates (or not) a student’s development fromnovice to expert. Here, expertise is considered to be derived from the purposeful interaction of differentknowledges (as described by [21]). We present examples of student maps that illustrate the way inwhich students may navigate the curriculum and argue that, in most cases, students do not reach thelevel of professional understanding.
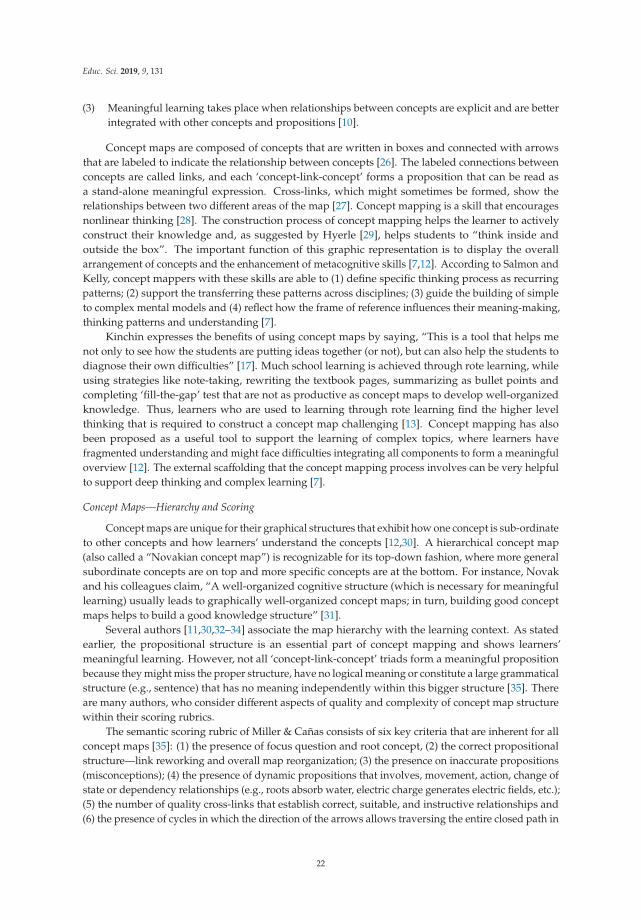
The expert structure that represents professional knowledge is explicit in the integrated nature oftheoretical knowledge and the way in which this underpins the procedural knowledge that constitutesthe visible practice that defines a professional [22]. The derivation of chains of practice from theoreticalknowledge is one of the hallmarks of expert knowledge [18]. However, we should not be surprisedthat this expertise is rarely exhibited by students, who grapple with their understanding of conceptsbefore they are able to distinguish between conceptual and procedural knowledge, or that it is rarelydepicted in concept maps that generally aim to combine procedural and conceptual knowledge withina single structure. The example of professional knowledge given in Figure 1 (of local anesthetics indentistry) shows how knowledge that has a high semantic density and low semantic gravity, SD+SG-(such as physiology and pharmokinetics), determines the structure of the theoretical knowledge tothe right, whilst the chain of practice to the left is composed of concepts such as instrument assemblyand techniques, which exhibit lower semantic density and high semantic gravity (SD-SG+). In thispaper, we explore the possibility of locating elements from the practical and the theoretical in students’emerging understanding of a discipline as an indicator of their current status on the journey throughsecondary and higher education towards professional knowledge.
20

Educ. Sci. 2019, 9, 131
relatesinfluences
part of
understanding
understanding
influences selection from
appropriate
determines
determines
consider
determineinfluence
include
consideration of
determines
requires appropriate
ensures safe
followed by
understanding
Figure 1. The semantic plane in which each quadrant has been populated by the archetypal mapmorphology (spoke, chain and network) that is likely to be found there, with (inset below) an exampleof a well-defined expert knowledge structure in which practice and theory are clearly delineated ascomplementary chain of practice and network of understanding [17,20,23].
2. Theory of Concept Maps
Concept maps have their roots in Ausubel’s meaningful learning theory, and they emphasize theconnections among concepts that represent individuals’ knowledge structure [10,24,25]. There arethree elements from Ausubel’s theory that Novak and his research team found useful to develop in theconcept mapping method:
(1) Construction of new meaning involves conceptual connections between new information andprior knowledge.
(2) Hierarchically organized cognitive structure where more general concepts are higher level in thehierarchy and less general are positioned under the more general concepts.
21
Educ. Sci. 2019, 9, 131
(3) Meaningful learning takes place when relationships between concepts are explicit and are betterintegrated with other concepts and propositions [10].
Concept maps are composed of concepts that are written in boxes and connected with arrowsthat are labeled to indicate the relationship between concepts [26]. The labeled connections betweenconcepts are called links, and each ‘concept-link-concept’ forms a proposition that can be read asa stand-alone meaningful expression. Cross-links, which might sometimes be formed, show therelationships between two different areas of the map [27]. Concept mapping is a skill that encouragesnonlinear thinking [28]. The construction process of concept mapping helps the learner to activelyconstruct their knowledge and, as suggested by Hyerle [29], helps students to “think inside andoutside the box”. The important function of this graphic representation is to display the overallarrangement of concepts and the enhancement of metacognitive skills [7,12]. According to Salmon andKelly, concept mappers with these skills are able to (1) define specific thinking process as recurringpatterns; (2) support the transferring these patterns across disciplines; (3) guide the building of simpleto complex mental models and (4) reflect how the frame of reference influences their meaning-making,thinking patterns and understanding [7].
Kinchin expresses the benefits of using concept maps by saying, “This is a tool that helps menot only to see how the students are putting ideas together (or not), but can also help the students todiagnose their own difficulties” [17]. Much school learning is achieved through rote learning, whileusing strategies like note-taking, rewriting the textbook pages, summarizing as bullet points andcompleting ‘fill-the-gap’ test that are not as productive as concept maps to develop well-organizedknowledge. Thus, learners who are used to learning through rote learning find the higher levelthinking that is required to construct a concept map challenging [13]. Concept mapping has alsobeen proposed as a useful tool to support the learning of complex topics, where learners havefragmented understanding and might face difficulties integrating all components to form a meaningfuloverview [12]. The external scaffolding that the concept mapping process involves can be very helpfulto support deep thinking and complex learning [7].
Concept Maps—Hierarchy and Scoring
Concept maps are unique for their graphical structures that exhibit how one concept is sub-ordinateto other concepts and how learners’ understand the concepts [12,30]. A hierarchical concept map(also called a “Novakian concept map”) is recognizable for its top-down fashion, where more generalsubordinate concepts are on top and more specific concepts are at the bottom. For instance, Novakand his colleagues claim, “A well-organized cognitive structure (which is necessary for meaningfullearning) usually leads to graphically well-organized concept maps; in turn, building good conceptmaps helps to build a good knowledge structure” [31].
Several authors [11,30,32–34] associate the map hierarchy with the learning context. As statedearlier, the propositional structure is an essential part of concept mapping and shows learners’meaningful learning. However, not all ‘concept-link-concept’ triads form a meaningful propositionbecause they might miss the proper structure, have no logical meaning or constitute a large grammaticalstructure (e.g., sentence) that has no meaning independently within this bigger structure [35]. Thereare many authors, who consider different aspects of quality and complexity of concept map structurewithin their scoring rubrics.
The semantic scoring rubric of Miller & Cañas consists of six key criteria that are inherent for allconcept maps [35]: (1) the presence of focus question and root concept, (2) the correct propositionalstructure—link reworking and overall map reorganization; (3) the presence on inaccurate propositions(misconceptions); (4) the presence of dynamic propositions that involves, movement, action, change ofstate or dependency relationships (e.g., roots absorb water, electric charge generates electric fields, etc.);(5) the number of quality cross-links that establish correct, suitable, and instructive relationships and(6) the presence of cycles in which the direction of the arrows allows traversing the entire closed path in
22
Educ. Sci. 2019, 9, 131
a single direction. All of these six levels are also translated to the content-quality scale that is followedby the categories of unevaluated, very low, low, intermediate, high and very high.
Other studies have suggested that the structure of the concept map carries important informationabout the understanding and quality of learners’ knowledge [11,12,30,36]. Many authors [7,30,37–40]emphasize the effectiveness of the qualitative scheme that differentiates three morphological types ofconcept map categories—spoke, chain and network [11]. Their model is based on map morphologythat has following characteristics [12,41,42]:
(1) Spoke graphical structure—(a) concepts form only a single level and all subordinate conceptsare in relation to the root concept; (b) subordinate concept are not connected to the neighboringsubordinate concepts; (c) deleting concepts from the map (except deleting the root concept), doesnot impact the overall structure; d) the links that are built-in to the spoke structure are simple, donot create cross links and do not impact neighboring subordinate concepts.
(2) Chain graphical structure—(a) the root concept is linked to the subordinate concept and formsa sequence with the next concepts. There is no hierarchy, but concepts are listed in multiplelevels in relation to the root concept; (b) subordinate concepts are connected only with the nextfollowing concept; (c) deleting concepts impacts only the subordinate concept lower down in thesequence; (d) the links are compound and therefore the meaning is readable only as a whole.
(3) Network graphical structure—(a) concepts are related to the root concept and form multiplelevels defined as a “highly integrated and hierarchical network (of concepts) demonstrating adeep understanding of the topic” [11]; (b) removing or adding concepts does not impact theoverall structure, as the cross links maintain the integrity of the map; (c) network is structuredacross different levels with interconnections, and indicates deep understanding and meaningfullearning strategies.
Extreme versions of each of these morphological types are depicted within the quadrants of thesemantic plane (Figure 1) to indicate the stereotypical structures that may be found to depict noviceknowledge, theoretical knowledge and practical knowledge. However, each of these extremes is not‘fixed’ and may evolve into another in response to student learning. For example, a spoke structure maydevelop into a chain or a network over a period of time as the student’s understanding develops and ismore systemized and complex in response to further learning [12]. Besides that, Kinchin discusses whatis a “good” and “poor” map by comparing the exam results with the maps [12,43]. He concludes that“poor” maps are not always indicators of poor performance and “good” maps not always predictors ofgood performance. There is no one common determination whether a concept map is really good interms of indicating the presence of a sophisticated understanding. In addition, Kinchin [17] claims,“bigger does not always mean better when evaluating concept maps.”
Cañas [31] uses the idea of an “excellent map,” and considers that both content and structureare important to determine the map quality. Cañas and colleagues [31] describe excellent conceptmaps as being concise and explanatory, exhibiting a high degree of clarity and presenting a clearmessage. In addition, excellent maps should also be well balanced, well-structured and demonstratelearners’ understanding.
3. Materials and Methods
Exemplar student concept maps (here constructed by students during school science lessons) aretranslated into commentaries on the types of knowledge depicted by converting the linking phrasesbetween concepts into descriptions of their semantic density and semantic gravity (see Figure 2).In terms of semantic gravity (SG), each proposition is considered in relation to the way in which thestudent has articulated the degree to which the knowledge is either tied to a particular context (SG+)or offers a more generalizable view (SG-) (see Table 1). We distinguish here between knowledge thatis very context bound (SG++) and that which is less tightly bound (SG+) to offer a more nuanceddescription of the knowledge quality. Propositions are also evaluated according to the semantic density
23

Educ. Sci. 2019, 9, 131
that is depicted (SD), where students may be using simple, everyday descriptions in their explanations(SD-) or may be offering much more technical summaries that exhibit considerable condensation ofmeaning (SD+). Again, the degree of condensation is considered by using SD+, SD++, SD- and SD–(see Table 1). In this way, each of the quadrants of the semantic plane itself has four sub-quadrants intowhich propositions may be plotted, giving up to 16 variants across the semantic plane. Once eachproposition has been translated to indicate its semantic profile (SD±SG±), this is then plotted on thesemantic plane (Figure 2) to indicate the semantic range depicted within the map. When using thismethod, researchers may need to establish the degree of inter-rater reliability to decide on ++ or + andon – or -. In this study we had three authors who were familiar with the content and agreed upon thelevel of density and gravity within each proposition.
Figure 2. A three step process of map construction (1), translation (2) and plotting (3) on thesemantic plane.
24

Educ. Sci. 2019, 9, 131
Table 1. Proposition analysis translation device. Modified from [44].
Novice Knowledge
SD-;SG-
SD-- student needs to interpret only one concept to form atheoretically/scientifically correct proposition- proposition does not need to be manipulated to the givencontext (the whole concept map)
SG-- student uses concept from different sections of curriculum- propositions create unified theory that is applicable to abroader context
SD-;SG–
SD-- student needs to interpret only one concept to form atheoretically/scientifically correct proposition- proposition does not need to be manipulated to the givencontext (the whole concept map)
SG–- student uses abstract concepts (e.g., biology, chemistry, physics)and integrates them with general everyday knowledge that isapplicable in a wide range of contextspropositions might unify scientific principles by highlightinglinks between ideas
SD–;SG-
SD–- student uses general everyday language and there is notheoretical knowledge needed to form a proposition- forming a proposition does not need understanding orinterpretation of scientific terminology (e.g., biology,chemistry, etc.)
SG-- student uses concepts from different sections of curriculum- propositions relate to ideas that are applicable to a broadercontext
SD–;SG–
SD–- student uses general everyday language and there is notheoretical knowledge needed to form a proposition- forming a proposition does not need understanding orinterpretation of scientific terminology (e.g., biology,chemistry, etc.)
SG–- student uses abstract concepts (e.g., biology, chemistry, physics)and integrates them with general everyday knowledge that isapplicable in a wide range of contexts- propositions might unify scientific principles by highlightinglinks between ideas
Theoretical Knowledge
SD+;SG-
SD+- student uses specialized scientific concepts- student needs to identify concepts before they can beinterpreted to form a meaningful proposition
SG-- student uses concepts from different sections of curriculum- propositions relate to ideas that are applicable to a broadercontext
SD+;SG–
SD+- student uses specialized scientific concepts- student needs to identify concepts before they can beinterpreted to form a meaningful proposition
SG–- student uses abstract concepts (e.g., biology, chemistry, physics)and integrates them with general everyday knowledge that isapplicable in a wide range of contexts- propositions might unify scientific principles by highlightinglinks between ideas
SD++;SG-
SD++- student needs to identify concepts (multiple steps required) toform a meaningful/scientifically correct proposition thatinteracts with the whole concept map
SG-- student uses concepts from different sections of the curriculum- propositions relate to ideas that are applicable to a broadercontext
SD++;SG–
SD++- student needs to identify concepts (multiple steps required) toform a meaningful/scientifically correct proposition thatinteracts with the whole concept map
SG–- student uses abstract concepts (e.g., biology, chemistry, physics)and integrates them with general everyday knowledge that isapplicable in a wide range of contexts- propositions might unify scientific principles by highlightinglinks between ideas
Practical Knowledge
SD-;SG+
SD-- student needs to interpret only one concept to form atheoretically/scientifically correct proposition- proposition does not need to be manipulated to the givencontext (the whole concept map)
SG+- student uses scientific concepts that are embedded in practicalcontexts- proposition might express an example that is used commonlyin everyday life
SD-;SG++
SD-- student needs to interpret only one concept to form atheoretically/scientifically correct proposition- proposition does not need to be manipulated to the givencontext (the whole concept map)
SG++- student uses scientific concepts that only require a recall of thedefinition or rule- proposition expresses the knowledge that is located in aspecific section of a curriculum
SD–;SG+
SD–- student uses general everyday language and there is notheoretical knowledge needed to form a proposition- forming a proposition does not need understanding orinterpretation of scientific terminology (e.g., biology,chemistry, etc.)
SG+- student uses scientific concepts that are embedded in practicalcontexts- proposition might express an example that is used commonlyin everyday life
SD–;SG++
SD–- student use general everyday language andthere is no theoretical knowledge needed to form a proposition- forming a proposition does not need understanding orinterpretation of scientific terminology (e.g., biologychemistry, etc.)
SG++- student uses scientific concepts that only require a recall of thedefinition or rule- proposition expresses the knowledge that is located in aspecific section of a curriculum
25

Educ. Sci. 2019, 9, 131
Table 1. Cont.
Professional Knowledge
SD+;SG+
SD+- student uses specialized scientific concepts- student needs to identify concepts before they can beinterpreted to form a meaningful proposition
SG+- student uses scientific concepts that are embedded in practicalcontexts- proposition might express an example that is used commonlyin everyday life
SD+;SG++
SD+- student uses specialized scientific concepts- student needs to identify concepts before they can beinterpreted to form a meaningful proposition
SG++- student uses scientific concepts that only require a recall of thedefinition or rule- proposition expresses the knowledge that is located in aspecific section of the curriculum
SD++;SG+
SD++- student needs to identify concepts (multiple steps required) toform a meaningful/scientifically correct proposition thatinteracts with the whole concept map
SG+- student uses scientific concepts that are embedded in practicalcontexts- proposition might express an example that is used commonlyin everyday life
SD++;SG++
SD++- student needs to identify concepts (multiple steps required) toform a meaningful/scientifically correct proposition thatinteracts with the whole concept map
SG++- student uses scientific concepts that only require recall of thedefinition or rule- proposition expresses the knowledge that is located in aspecific section of the curriculum
4. Results
The maps considered here were constructed by students aged 16–17 years in an Estonian highschool. This data collection was a part of the large-scale study (LoTeGym) that was undertaken from2012–2014 [45]. The concept mapping instrument was linked with interdisciplinary scenarios from acognitive test. The test instrument consisted of four interdisciplinary everyday life related scenarios,where each focused on one science subject (biology, chemistry, geography and physics). The aim ofthe test was to evaluate students’ ability to give a scientific explanation, pose scientific questions,solve scientific problems and to make reasoned decisions. Students were given 30 different typesof concepts (science processes, everyday social issues-relates, etc.) to map on the topic of ‘Milk—isit always healthy?’ Some of these concepts were representations of ‘everyday’ knowledge (i.e., thepractical application of the theoretical concepts derived from biology, chemistry and physics). After aperiod of training to see exemplar maps and to gain some familiarity with the software, a cohort of187 students were given 45 min to construct a concept map. The concept mapping was carried outusing the computer program CmapTools. To ensure consistency of the data collection, the introductorytraining sessions before the concept mapping task was undertaken by the same researcher. All studentswere given an example of how to construct a concept map before the main maps were constructed. Onesupervisor was in the classroom to assist with possible technical problems and to ensure adherenceto the structural grammar of Novakian concept maps [26]. Whilst it was noted from preliminaryobservation that most of the maps display a gross morphology indicative of novice understanding(a spoke structure), there was a large degree of variation in the ways in which the concepts werearranged and in the quality of the propositions used to link concepts. From this cohort, two exemplarsare illustrated below as worked examples to showcase the method for map analysis.
Figure 3 shows the map produced by one student. A quick observation indicates this to be aspoke-type map [11], in which chains of propositions radiate out from the central concept, but littlecross-linking is evident between the chains. Once the propositions are converted to indicate the degreeof semantic density and semantic gravity, it can be seen that >1/3 of the propositions are categorizedas SG-SD- (indicative of novice knowledge). The remaining propositions are divided almost equallybetween the theoretical and practical quadrants of the plane, but none are ascribed to the lower righthand quadrant (professional knowledge).
26

Educ. Sci. 2019, 9, 131
Map construction to optimise linking phrases
Convert linking phrases to SGSD (see table 1)
Plot SGSD on semantic plane
Figure 3. An example of a student map exhibiting a strong ‘spoke’ structure that suggests a noviceunderstanding, which is emphasized by the presence of 8 propositions in the top left quadrant of thesemantic plane.
The map in Figure 4 may also be designated as a novice map; however, there appears to besome development from the map in Figure 3, as the student here shows a greater attempt to showsome cross-linking of concepts, moving from the spoke structure towards a more integrated networkstructure [11]:
27
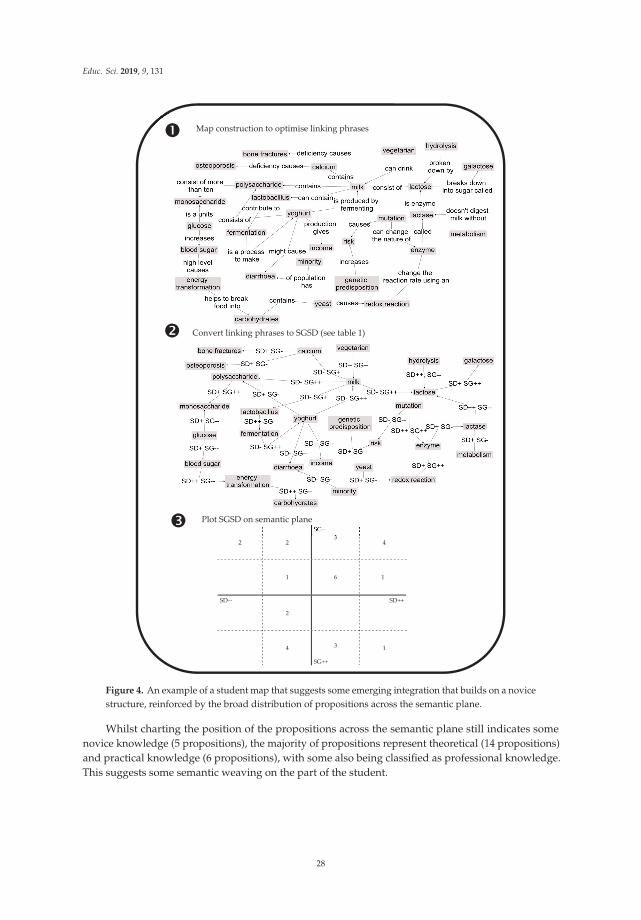
Educ. Sci. 2019, 9, 131
Map construction to optimise linking phrases
Convert linking phrases to SGSD (see table 1)
Plot SGSD on semantic plane
Figure 4. An example of a student map that suggests some emerging integration that builds on a novicestructure, reinforced by the broad distribution of propositions across the semantic plane.
Whilst charting the position of the propositions across the semantic plane still indicates somenovice knowledge (5 propositions), the majority of propositions represent theoretical (14 propositions)and practical knowledge (6 propositions), with some also being classified as professional knowledge.This suggests some semantic weaving on the part of the student.
28

Educ. Sci. 2019, 9, 131
5. Discussion
Disagreements within the research community about the most appropriate methods of analysisof concept maps have the potential to inhibit the widespread classroom use of the tool to supportlearning [43]. The benefits and drawbacks of traditional quantitative or qualitative approaches tomap analysis are compounded by the fact that researchers have not previously discriminated betweenthe types of knowledge that have been embedded within maps. The application of the semanticsdimension of Legitimation Code Theory offers a new approach that is explicit in the need to considerunderstanding to be composed of qualitatively different knowledges that need to communicate witheach other in the pursuit of expertise.
The consideration of the degree of semantic density and semantic gravity exhibited within mappropositions offers a more nuanced consideration of map quality that is achieved by considering mapmorphology alone. However, it allows for the consideration of that which is ‘yet-to-be-known’ (ratherthan assessment of ‘correctness’) so that maps of contested values and beliefs can be assessed usingthe same approach as maps of agreed factual content [17]. The significance of the semantic profilesthat students exhibit in their concept maps offers a window into some of the issues they experience ontheir educational journey—particularly as they move between school, university and professional life.For example, the differences in the structuring of knowledge that exist between a high school and auniversity biology curriculum (that has been observed by Kelly-Laubscher and Luckett [46]), suggestthe existence of a possible mismatch between the semantic range that students are expected to navigateat university against that which they will have experienced in secondary school. This may causeproblems for students’ transition from school to university when their school education is assumed tohave given them the necessary prerequisite knowledge to embark upon their undergraduate studies.Tracing the changes in the semantic profiles that students exhibit provides a visualization of theprogress that students are making against desired outcomes, offering a way of monitoring studentprogression and curriculum effectiveness. However, we cannot assume homogeneity of the knowledgequality held by students as they enter university, even when they have covered the same content atschool. The two examples shown here display differences in students’ semantic profiles such thatthe student represented in Figure 4 appears to exhibit a greater semantic range within his knowledgestructure of this content area, suggesting a better preparedness of undergraduate study. To confirmthis, we need to explore a greater range of curriculum content with the students to see how key areasof the curriculum have been structured in the students’ minds.
6. Conclusions
This new approach to concept map analysis raises a number of new opportunities and challengesfor the research community:
By considering concept maps to be composed of different types of knowledge, it offers thepossibility of asking a new set of research questions that might be addressed through concept mapping.Where powerful knowledge [47] is seen as the goal of professional education, then the semanticweaving between theory and practice is required to achieve expertise [21]. The assessment of thisplurality of knowledges requires the mapping of semantic density and semantic gravity.
Beyond just assessing the ‘correctness’ of propositions within a map, the application of LegitimationCode Theory to concept mapping allows for the assessment of the ways in which the mapper is able tolink theoretical knowledge with practical knowledge. This lifts the map above the assessment of factualrecall and considers the higher order thinking skills that are required for students to achieve masteryof their discipline. This mastery has been shown to be dependent upon the learner’s ability to oscillatebetween complementary knowledge structures consisting of chains of practice (exhibiting low semanticdensity and high semantic gravity), and underpinning networks of understanding (exhibiting highsemantic density and low semantic gravity) [18,22]. The method of applying Legitimation Code Theoryto concept mapping described in this paper provides a way to make the knowledges that underpin thatexpert practice explicit, so that they may be modeled for students. Further, this paper suggests that
29

Educ. Sci. 2019, 9, 131
when assessing students’ knowledge using concept maps, the use of a single map may be insufficientin order to obtain an authentic representation. As procedural and conceptual knowledge may beconstructed differently and activated in different contexts, it may be better to encourage students toseparate them structurally, whilst also recognizing the ways in which they interact in expert practice(as in Figure 1). This represents a significant methodological shift from many of the research papers thathave previously explored learning using concept maps and that had assumed that complex knowledgemay be captured in a single map structure.
Author Contributions: Conceptualization, I.M.K.; methodology, I.M.K. and A.M.; formal analysis, I.M.K. andA.M.; data curation, A.M.; writing—original draft preparation, I.M.K. and A.M.; writing—review and editing,I.M.K. and P.R.; supervision, P.R.
Funding: This research received no external funding.
Conflicts of Interest: Authors declare no conflict of interest.
References
1. You, H.S.; Marshall, J.A.; Delgado, C. Assessing Students’ Disciplinary and Interdisciplinary Understandingof Global Carbon Cycling. J. Res. Sci. Teach. 2018, 55, 377–398. [CrossRef]
2. Rimini, M.; Spiezia, V. Skills for a digital world: Background report 2016. Knowl. Manag. E-Learn. 2016, 9,348–365.
3. Wheelahan, L. How Competency-Based Training Locks the Working Class out of Powerful Knowledge:A Modified Bernsteinian Analysis. Br. J. Sociol. Educ. 2007, 28, 637–651. [CrossRef]
4. Barnett, R. Knowing and Becoming in the Higher Education Curriculum. Stud. High. Educ. 2009, 34, 429–440.[CrossRef]
5. Ruiz-Primo, M.A. On the use of concept maps as an assessment tool in science: What we have learned so far.Rev. Electrón. Investig. Educ. 2000, 2, 29–52.
6. Bransford, J.D.; Brown, A.L.; Cocking, K.R. How People Learn: Brain, Mind, Experience, and School; NationalAcademy Press: Washington, DC, USA, 2000; p. 38.
7. Salmon, D.; Kelly, M. Using Concept Mapping to Foster Adaptive Expertise: Enhancing Teacher MetacognitiveLearning to Improve Student Academic Performance; Peter Lang: New York, NY, USA, 2015; p. 7.
8. Zimmerman, R.; Maker, C.J.; Gomez-Arizaga, M.P.; Pease, R. The Use of Concept Maps in FacilitatingProblem Solving in Earth Science. Gift. Educ. Int. 2012, 27, 274–287. [CrossRef]
9. BouJaoude, S.; Attieh, M. The Effect of using concept maps as study tools on achievement in chemistry.Eurasia J. Math. Sci. Technol. Educ. 2008, 4, 233–246. [CrossRef]
10. Novak, J.D.; Cañas, A.J. The Theory Underlying Concept Maps and How to Construct and Use Them; Institute forHuman and Machine Cognition: Pensacola, FL, USA, 2008; pp. 1–36. Available online: http://cmap.ihmc.us/docs/pdf/theoryunderlyingconceptmaps.pdf (accessed on 7 May 2019).
11. Kinchin, I.M.; Hay, D.B.; Adams, A. How a Qualitative Approach to Concept Map Analysis Can Be Used toAid Learning by Illustrating Patterns of Conceptual Development. Educ. Res. 2000, 42, 43–57. [CrossRef]
12. Kinchin, I.M. Visualising Knowledge Structures in Biology: Discipline, Curriculum and StudentUnderstanding. J. Biol. Educ. 2011, 45, 183–189. [CrossRef]
13. Cañas, A.J.; Reiska, P.; Möllits, A. Developing Higher-Order Thinking Skills with Concept Mapping: A Caseof Pedagogic Frailty. Knowl. Manag. E-Learn. 2017, 9, 348–365.
14. Gouli, E.; Gogoulou, A.; Grigoriadou, M. A Coherent and Integrated Framework Using Concept Maps forVarious Educational Assessment Functions. J. Inf. Technol. Educ. Res. 2017, 2, 215–240. [CrossRef]
15. Burrows, N.L.; Mooring, S.R. Using Concept Mapping to Uncover Students’ Knowledge Structures ofChemical Bonding Concepts. Chem. Educ. Res. Pract. 2015, 16, 53–66. [CrossRef]
16. Karakuyu, Y. The Effect of Concept Mapping on Attitude and Achievement in a Physics Course. Int. J.Phys. Sci. 2010, 5, 724–737.
17. Kinchin, I.M. Visualising Powerful Knowledge to Develop the Expert Student: A Knowledge Structures Perspectiveon Teaching and Learning at University; Sense: Rotterdam, The Netherlands, 2016; pp. 15, 73.
18. Kinchin, I.M.; Cabot, L.B. Reconsidering the Dimensions of Expertise: From Linear Stages towards DualProcessing. Lond. Rev. Educ. 2010, 8, 153–166. [CrossRef]
30
Educ. Sci. 2019, 9, 131
19. Romero, C.; Cazorla, M.; Buzón, O. Meaningful Learning Using Concept Maps as a Learning Strategy.J. Technol. Sci. Educ. 2017, 7, 313–332. [CrossRef]
20. Maton, K. Knowledge and Knowers: Towards a Realist Sociology of Education; Routledge: London, UK, 2014.21. Maton, K. Building Powerful Knowledge: The Significance of Semantic Waves. In Knowledge and the Future of
the Curriculum. Palgrave Studies in Excellence and Equity in Global Education; Barrett, B., Rata, E., Eds.; PalgraveMacmillan: London, UK, 2014; pp. 181–197.
22. Kinchin, I.M. Accessing expert understanding: The value of visualising knowledge structures in professionaleducation. In Ensuring Quality in Professional Education; Trimmer, K., Newman, T., Thorpe, D., Padro, F., Eds.;Palgrave McMillan: London, UK, 2019; Volume 2, pp. 71–89.
23. Clarke, F. Injecting expertise: Developing an expertise-based pedagogy for teaching local anaesthesia indentistry. High. Educ. Netw. J. 2011, 2, 29–43.
24. Ausubel, D. Educational Psychology: A Cognitive View; Holt Rinehart: New York, NY, USA, 1968.25. Novak, J.D.; Gowin, D.B. Learning How to Learn; Cambridge University Press: Cambridge, UK, 1984.26. Novak, J.D. Learning Creating and Using Knowledge: Concept Maps As Facilitative Tools in Schools and Corporations,
2nd ed.; Routledge: London, UK, 2009; pp. 1–317. [CrossRef]27. Novak, J.D.; Cañas, A.J. The Origins of the Concept Mapping Tool and the Continuing Evolution of the Tool.
Inf. Vis. 2006, 5, 175–184. [CrossRef]28. Crandall, B.; Klein, G.; Hoffman, R.R. Working Minds: A Practitioner’s Guide to Cognitive Task Analysis; The MIT
Press: Cambridge, MA, USA, 2006; p. 54.29. Hyerle, D. Visual Tools for Transforming Information into Knowledge, 2nd ed.; Crowin Press: Thousand Oaks,
CA, USA, 2009; p. 91.30. Nousiainen, M.; Koponen, I. Concept Maps Representing Knowledge of Physics: Connecting Structure and
Content in the Context of Electricity and Magnetism. Nord. Stud. Sci. Educ. 2010, 6, 155–172. [CrossRef]31. Cañas, A.J.; Novak, J.D.; Reiska, P. How good is my concept map? Am I a good Cmapper? Knowl. Manag.
E-Learn. 2015, 7, 6–19.32. Vanides, J.; Yin, Y.; Tomita, M.; Ruiz-Primo, M.A. Using concept maps in the science classroom. Sci. Scope
2005, 28, 27–31.33. Kinchin, I.M.; De-Leij, F.A.A.M.; Hay, D.B. The evolution of a collaborative concept mapping activity for
undergraduate microbiology. J. Furth. High. Educ. 2005, 29, 1–14. [CrossRef]34. Ingeç, S.K. Analysing concept maps as an assessment tool in teaching physics and comparison with the
achievement Tests. Int. J. Sci. Educ. 2009, 31, 1897–1915. [CrossRef]35. Miller, N.L.; Cañas, A.J. A Semantic Scoring Rubric for Concept Maps: Design and Reliability. In Concept
Maps Connecting Educators, Proceedings of the Third International Conference Concept Mapping, Tallinn, Estonia,22–25 September 2008; Tallinn University: Tallinn, Estonia, 2008; pp. 60–67.
36. Hay, D.; Kinchin, I. Using concept mapping to measure learning quality. Educ. Train. 2008, 50, 167–182.[CrossRef]
37. Yin, Y.; Vanides, J.; Ruiz-Primo, M.A.; Ayala, C.C.; Shavelson, R.J. Comparison of Two Concept-MappingTechniques: Implications for Scoring, Interpretation, and Use. J. Res. Sci. Teach. 2005, 42, 166–184. [CrossRef]
38. Gerstner, S.; Bogner, F.X. Concept map structure, gender and teaching methods: An investigation of students’science learning. Educ. Res. 2009, 51, 425–438. [CrossRef]
39. Meagher, T. Looking inside a Student’s Mind: Can an Analysis of Student Concept Maps Measure Changesin Environmental Literacy? Electron. J. Sci. Educ. 2009, 13, 85–112.
40. Subramaniam, K.; Harrell, P.E. An Analysis of Prospective Teachers’ Knowledge for Constructing ConceptMaps. Educ. Res. 2015, 57, 217–236. [CrossRef]
41. Hay, D.; Kinchin, I.; Lygo-Baker, S. Making Learning Visible: The Role of Concept Mapping in HigherEducation. Stud. High. Educ. 2008, 33, 295–311. [CrossRef]
42. Kinchin, I.M.; Streatfield, D.; Hay, D.B. Using Concept Mapping to Enhance the Research Interview. Int. J.Qual. Methods 2010, 9, 52–68. [CrossRef]
43. Kinchin, I.M. Concept mapping as a learning tool in higher education: A critical analysis of recent reviews.J. Contin. High. Educ. 2014, 62, 39–49. [CrossRef]
44. Rootman-le Grange, I.; Blackie, M.A.L. Assessing Assessment: In Pursuit of Meaningful Learning. Chem. Educ.Res. Pract. 2018, 19, 484–490. [CrossRef]
31

Educ. Sci. 2019, 9, 131
45. Rannikmäe, M.; Soobard, R.; Reiska, P.; Rannikmäe, A.; Holbrook, J. Õpilaste loodusteadusliku kirjaoskusetasemete muutus gümnaasiumiõpingute jooksul. Eesti Haridusteaduste Ajakiri 2017, 5, 59–98.
46. Kelly-Laubscher, R.F.; Luckett, K. Differences in curriculum structure between high school and universitybiology: The implications for epistemological access. J. Biol. Educ. 2016, 50, 425–441. [CrossRef]
47. Young, M.; Muller, J. On the powers of powerful knowledge. Rev. Educ. 2013, 1, 229–250. [CrossRef]
© 2019 by the authors. Licensee MDPI, Basel, Switzerland. This article is an open accessarticle distributed under the terms and conditions of the Creative Commons Attribution(CC BY) license (http://creativecommons.org/licenses/by/4.0/).
32

education sciences
Article
The Salutogenic Management of Pedagogic Frailty: ACase of Educational Theory Development UsingConcept Mapping
Ian M. Kinchin
Department of Higher Education, University of Surrey, Guildford GU2 7XH, UK; [email protected]
Received: 29 May 2019; Accepted: 21 June 2019; Published: 25 June 2019
Abstract: This paper explores the development of educational theory (pedagogic frailty) that hasemerged through the application of concept maps to understand teachers’ conceptions of their roleswithin the complex higher education environment. Within this conceptual paper, pedagogic frailtyis reinterpreted using the lens offered by the concept of salutogenesis to place the model in a morepositive frame that can offer greater utility for university managers. This development parallelschanges in the consideration of mental health literacy (MHL) across university campuses and avoidsmisapplication of a deficit model to the professional enhancement of teaching quality. For a detailedexplication of this wider perspective of pedagogic health literacy (PHL), the connections with relatedand supporting concepts need to be explained. These include ‘assets’, ‘wellness’ and a ‘sense ofcoherence’. Links between these concepts are introduced here. This reframing of the model hasused concept mapping to explore the relationship between two complex ideas—pedagogic frailtyand salutogenesis. It emphasizes pedagogic health as a continuum operating between frailty andresilience. Brief implications for academic development are included.
Keywords: concept mapping; salutogenesis; pedagogic health; academic development; teaching
1. Introduction
The current literature on teaching in university is increasingly populated with references aboutstress and burnout among academics [1,2]. This should raise concerns about the physical and mentalhealth of colleagues working within this system [3], and about the pedagogic health of the highereducation system overall. Numerous stressors can be seen to act within the academy. For example, newacademics report dissonance between expectations of their role and actual teaching experiences [4]. Inaddition, competing agendas within universities seem to be adding to the pressures of work [5], whilepolitical changes in the system appear to be at odds with the values that drew many academics intoacademia in the first place [6]:
Academics are experiencing a growing sense of disconnection between their desires todevelop students into engaged, disciplined and critical citizens and the activities that appearto count in the enterprise university. (p. 526)
This generates strong feelings among academics, such as those described so colourfully byLeitch [7] who talks about feeling as though she is “riding two horses at the same time, being propelledsimultaneously in opposing directions” (p. 166). The negative consequences of too much stress withinthe university workforce have been summarised by Mtsweni [8] in his analysis of responses to stressamong university administrators:
the person may attempt to reduce the amount of information to be dealt with by opting for asimplified belief system which denies the true complexity of the issues involved. Typically
Educ. Sci. 2019, 9, 157; doi:10.3390/educsci9020157 www.mdpi.com/journal/education33

Educ. Sci. 2019, 9, 157
this might entail a move towards polarised problem solving with a simplistic yes/no orright/wrong analysis. This diminished judgement can involve an increased personalisationof issues or a hostile egocentricity. In this case the sufferer can only see their limitedviewpoint and begins to feel persecuted, interpreting neutral events as being directed atthem. Lack of balance is completed by magnification and minimisation whereby trivial aregiven undue emphasis whilst key factors are played down or ignored. This unsupportablelevel of cognition eventually leads to fatigue and a state of under-alertness, characterised byforgetfulness, foggy thinking and disorganisation which may be wrongly attributed to a lackof motivation. (p. 20)
Within the context of teaching in higher education, these stress symptoms can be observed to beexhibited by colleagues and these can impede the innovative development of teaching and encouragethe rise of ‘play safe’ classroom practices [9]. Such stress can lead colleagues to consider innovationin teaching practice in a binary manner as either ‘good’ or more typically ‘bad’ without consideringthe wider implications of change and possible benefits to students. The manifestation of hostileegocentricity referred to by Mtsweni can be observed through everyday comments such as, “It justwon’t work in our department—the management don’t understand that we are a special case!” Andfinally, small changes to relatively minor procedural issues (e.g., which line-spacing should studentsuse in their essays [10]) are often discussed extensively and with passion whilst the ‘elephant in theroom’ is left for another time. The combined effect of these unproductive tensions and workplacestressors that cause ‘foggy thinking and disorganisation’ can result in an environment exhibitingpedagogic frailty, where elements of the teaching environment seem to be working in oppositionto each other so that teachers retreat into a conservative status quo [9] that may be professionallyunsatisfying and pedagogically unsound [11]. To address these problems, the model of pedagogicfrailty is aligned to key aspects of salutogenesis, to make it more amenable to university managers asa developmental tool. This paper is aimed at those who influence or deliver teaching at university,including teachers, technicians, administrators and managers, as all these roles have an impact on thediscourses of learning and on the student experience. Whilst the literature on teaching understandablytends to focus on teachers, it is evident that other roles have an impact on what goes on and how itis reported.
2. Pedagogic Frailty and Salutogenesis
The model of pedagogic frailty arose from a fortuitous confluence of personal and professionalexperiences with a theoretical exploration of university teaching [12]. This drew on three decades ofwork in teaching and academic development by the author that included several hundred structuredteaching observations during which observed teachers often talked about the positive and negativefactors influencing their teaching. The author also drew on professional examination of key factorsinfluencing practice in the design of new academic programmes of teacher development [13]. Theevolution of the model was also informed by personal encounters with clinical frailty [14] during whichthe overlap between the literature examining clinical experience and teaching experience becameapparent, combined with the theoretical exploration of the visualisation of ‘powerful knowledge’ [15].In combination, this gave rise to the conditions in which the model of pedagogic frailty could emerge(Figure 1).
By using the four key dimensions within the model (that have already been explored extensively inthe literature [16,17]) to add structure to reflections on teaching practice, so that personal perspectivesmay be used as a basis for developmental dialogue (such as the example inserted below the model inFigure 1). Although the focus of research on pedagogic frailty considers the university system (i.e.,the ways in which the various roles in the institution contribute to teaching), investigations need tostart by uncovering the range of perceptions held by individuals within that system. Numerous casestudies have revealed the variety of perspectives held by academics across the spectrum of academic
34

Educ. Sci. 2019, 9, 157
disciplines from the arts to the sciences [17] and the ways in which tensions might develop resultingfrom conflicting perspectives. The model of pedagogic frailty focuses on four key areas:
• The nature of the discourse on teaching and learning and whether this concentrates onthe mechanisms and procedures of teaching (timetabling, assessments, feedback, etc.) oron the underpinning pedagogy (teacher expectations, professional values, student learningapproaches, etc.).
• The relationship between the pedagogy and the discipline and whether teaching offers an authenticinsight to the discipline in terms of relating theory and practice.
• How the research within the department relates to the teaching in the department, and how theselinks are exploited in teaching strategies and made explicit in the programme.
• How the teaching is regulated and evaluated and what appreciation there is of the role of theindividual academic in the decision-making processes of the institution.
In studies published so far, the model seems to resonate with university academics who readilyrelate to the idea of frailty and the notion that aspects of the professional environment can createtensions that impede the development of teaching practice [18,19]. However, the negative undertonesof the term ‘frailty’ have been recognised in the clinical literature [20] and may be seen as problematicby university managers when considering the professional development of university academics as itsuggests a deficit model. We may attempt to overcome this by adopting an assets-based approach to theconsideration of the wider concept of pedagogic health as a continuum linking the extremes of frailtyand resilience. The consideration of assets updates the clinical analogy from which pedagogic frailtyemerged by offering a parallel to increased consideration of health assets [21,22] within a continuumof health as proposed by Antonovsky in his exploration of salutogenesis [23,24]. Salutogenesis isdefined as the study of ‘why’ and ‘how’ people stay well [25]. Staying well is related to the ability ofindividuals to manage tension, that is, how they respond to stressors. The management of tensionhelps to maintain health. The pathological model is analogous to a deficit model of health, whilstsalutogenesis pays more attention to the management of assets that contribute to wellness, and socan be seen to offer links with the ideas of pedagogic health as a continuum between the extremes ofpedagogic frailty and pedagogic resilience.
How individuals manage tension and stress in their daily lives and stay well has been referred toas ‘salutogenic functioning’ [8]. Reframing in this way firstly requires us to discard the dichotomyof diseased/healthy in favour of Antonovsky’s health-ease/dis-ease continuum (reframed here asfrailty–resilience for the educational context). This is reflected by the application of concept mappingthat enables us to visualise nuanced academic perceptions of their ‘pedagogic health’ [17] in which thediversity of perspectives is valued, and an inappropriate binary good–bad distinction is never made.
35

Educ. Sci. 2019, 9, 157
increases with perceived distance toincreases with lack of
explicit and shared
increases with lack of embeddedness
between
increases with unresolved tensions
within the
Informs
links between
requires agentic engagement with
must
inform
requires
iterative dialogue
with
drives motivates
Interact strategically
with the
demanded by bodies
representing
delivers want access todesigned to be memorised by
Figure 1. The overall pedagogic frailty model (above) with (inset below) one academic’s view of theregulative discourse dimension (After Kinchin [15,26]).
Whilst most previous applications of salutogenesis in universities have been concerned with thephysical or mental health of individuals working within a university [27], in this paper I have turnedthis around and am focusing on the health of the system (i.e., the university) where the individualsare working. However, these two perspectives are clearly related to each other and the distinctionbetween a ‘healthy academic’ and a ‘pedagogically healthy’ university may be blurred across thenumerous interactions between the individual and the institution. The consideration of salutogenesisas a frame for pedagogic health requires a parallel consideration of a number of other associatedconcepts (particularly assets, wellness and sense of coherence) that need to be part of the network ofconcepts that will help to generate a robust context to inform practice. Concept mapping offers a toolto allow the visualisation of these ideas and the ways they may be linked (Figure 2).
This visualization of the relationship between salutogenesis and pedagogic frailty represents theauthor’s perspective of the main concepts involved and the relationships between them. The conceptmap was generated by reducing the problem to include only the main concepts involved and arrangedto emphasize the relationships between them. The linking phrases have been constructed to offer themaximum explanatory power in the minimum amount of text in an attempt to produce what has beentermed an ‘excellent concept map’ in the research literature [15]. This provides the reader with a map
36
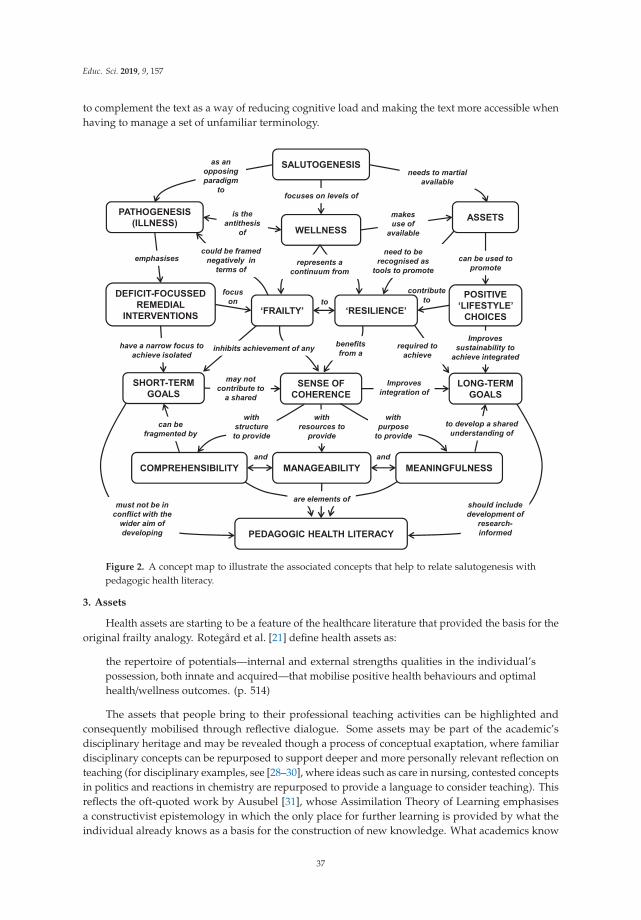
Educ. Sci. 2019, 9, 157
to complement the text as a way of reducing cognitive load and making the text more accessible whenhaving to manage a set of unfamiliar terminology.
emphasises
benefits from a
to develop a shared understanding of
with resources to
provide
and and
focus on
contribute to to
is the antithesis
of
focuses on levels of
needs to martial available
can be used to promote
as an opposing paradigm
to
makes use of
available
represents a continuum from
have a narrow focus to achieve isolated
Improves integration of
with structure to provide
Improves sustainability to
achieve integrated
with purpose
to provide
may not contribute to
a shared
need to be recognised as
tools to promote
are elements ofshould include development of
research-informed
must not be in conflict with the
wider aim of developing
required to achieve
inhibits achievement of any
can be fragmented by
could be framed negatively in
terms of
Figure 2. A concept map to illustrate the associated concepts that help to relate salutogenesis withpedagogic health literacy.
3. Assets
Health assets are starting to be a feature of the healthcare literature that provided the basis for theoriginal frailty analogy. Rotegård et al. [21] define health assets as:
the repertoire of potentials—internal and external strengths qualities in the individual’spossession, both innate and acquired—that mobilise positive health behaviours and optimalhealth/wellness outcomes. (p. 514)
The assets that people bring to their professional teaching activities can be highlighted andconsequently mobilised through reflective dialogue. Some assets may be part of the academic’sdisciplinary heritage and may be revealed though a process of conceptual exaptation, where familiardisciplinary concepts can be repurposed to support deeper and more personally relevant reflection onteaching (for disciplinary examples, see [28–30], where ideas such as care in nursing, contested conceptsin politics and reactions in chemistry are repurposed to provide a language to consider teaching). Thisreflects the oft-quoted work by Ausubel [31], whose Assimilation Theory of Learning emphasisesa constructivist epistemology in which the only place for further learning is provided by what theindividual already knows as a basis for the construction of new knowledge. What academics know
37
Educ. Sci. 2019, 9, 157
best is their disciplinary knowledge and ways of thinking. This echoes the view of frailty managementoffered by D’Avanzo et al. [32]:
if we want frailty to be approached as a malleable and preventable condition, a bottom-upapproach is needed [and] the tools through which frailty can be managed should come from[participants’] own context and resources. (p. 16)
Rather than providing a rather inert list of assets, a process of ‘asset mapping’ is suggested in theliterature as a process that can help to emphasise the dynamic connections between assets as a way toincrease their overall utility [21]. In the case of pedagogic frailty, this asset mapping probably needs tostart from the individual perspectives held by academics (as in the case studies illustrated by Kinchinand Winstone [17]) which can then facilitate and structure the essential dialogue between members ofan academic community [33,34] to start to map community assets. Distinguishing between individual,community or institutional assets may be helpful in operationalising the pedagogic health model andtargeting resources to support the management of a developing sense of coherence [35].
4. Wellness
In parallel with the increased focus on health assets within the healthcare literature, there hasbeen an increased focus on the concept of wellness as a way of moving towards health-promotingbehaviours. Wellness has been defined by McMahon and Fleury [36] as:
A purposeful process of individual growth, integration of experience, and meaningfulconnections with others, reflecting personally valued goals and strength, and resulting inbeing well and living values. (p. 48)
The idea of ‘living values’ clearly addresses the comment made by Manathunga in the introductionto this paper, whilst ‘meaningful connections with others’ is a necessary prerequisite for the mappingof shared assets (such as personal traits or disciplinary skills) mentioned above.
5. Sense of Coherence
By linking elements of innovative practice to the frailty model, we are able to support academicsin their construction of a greater sense of coherence with regard to the fragmented and contradictorydiscourses of higher education. Developing a greater sense of coherence within academics of theirteaching environments has always been one of the explicit intentions of the application of the pedagogicfrailty model [17]. Within the salutogenic paradigm, Antonovsky [23] has defined the sense of coherence(SOC) in terms of its three subcomponents (comprehensibility, manageability and meaningfulness) as:
a global orientation that expresses the extent to which one has a pervasive, enduring thoughdynamic feeling of confidence that:
(1) the stimuli deriving from one’s internal and external environments in the course of livingare structured, predictable and explicable (comprehensibility);
(2) the resources are available to one to meet the demands posed by these stimuli(manageability);
(3) these demands are challenges, worthy of investment and engagement (meaningfulness)(p. 19)
The sense of comprehensibility is supported by consistent, structured information and isconfounded by stimuli that are chaotic, random, accidental or inexplicable. Unfortunately,Brookfield [37] reports that some teachers describe their work to be ‘bafflingly chaotic’—a situation thataugurs badly for the development of a sense of coherence among university academics—presenting achallenge for university managers. A well-developed sense of coherence seems to be related to theability of academics to cope with stress [38] and is likely to support the development of a positiveapproach to asset management and wellness.
38

Educ. Sci. 2019, 9, 157
6. Individuals in the System
One important difference between clinical frailty and pedagogic frailty (as previously madeexplicit in the literature) is that studies of clinical frailty have a focus on the wellbeing of the individual,and consider assessment and treatment of the individual, whereas pedagogic frailty has a broaderfocus on the system in which that individual operates. This means that any given configuration for anindividual may initiate or promote pedagogic frailty in one environment, but promote resilience inanother, more receptive, environment. This can be seen in particularly sharp contrast when academicsmove from one national context to another and find that assets that were valued at home are nolonger recognised when they move abroad [39]. However, the structure of individual profiles mightpredict the potential for frailty, or in other words, certain scripts act as indicators of ‘prefrailty’. Inan extreme case, a hypothetical, stereotypic academic who is a new arrival at a university mightstate that “he doesn’t care what his colleagues do, he will not adapt any aspect of his teaching tofit current fashions because he has been teaching for twenty years and has established an efficientroutine that fits his lifestyle and allows his research to flourish”. Such a person might be expected tohave difficulties integrating into a new environment that might exhibit a more progressive attitude toinnovative teaching approaches. More subtle issues might be predicted where academics map theirperceptions of the dimensions of frailty and produce knowledge structures with morphologies thatare undeveloped and do not provide sufficient structure to indicate critical reflection on practice. Anadditional difference between clinical and pedagogic frailty concerns age. Whereas clinical frailty ismore prevalent in older patients, pedagogic frailty occurs at any stage of an academic’s career and maybe repeated as conditions change or as academics take on new roles [40,41].
Research suggests that frailty is a dynamic process that does not sit comfortably in thedisease-centred paradigm that dominates medicine [42], and that there are opportunities alongits pathway to transition out of, manage and/or prevent its adverse consequences. Considering clinicalfrailty, Gwyther et al. [43] write:
Superficially, there appeared to be a dichotomy in beliefs about frailty management. On onehand, some policy-makers appeared to support a greater medicalisation of frailty, a need forfrailty to be recognised as an authentic clinical issue by medical professionals and treated assuch. On the other, there were views that frailty should be demedicalised and that frailtymanagement should be conceived of as an adaptation to life stages and be embraced as asocietal issue with ownership devolved to a wider societal network. (p. 4)
Again, there are direct analogies to be drawn from the comments above to the concept of pedagogicfrailty. Rather than a medicalisation of pedagogic frailty, the modern educational world seeks to adoptgreater managerialism and accountability to address any frailty in the system, so it may be ‘treated’.This is exemplified by the classic “you said, we did” type of management response to student voice.The devolution of management offers a different strategy [44] that would decentralise ownershipof the teaching environment that might facilitate frailty management as ‘adaptation to professionallife stages’.
7. Benefits of a Salutogenic Gaze towards Pedagogic Health
By adopting Antonovsky’s salutogenic gaze [23,24] to reframe the recent literature on pedagogicfrailty [16,17], we might consider the issues that act on teaching in terms of the broader concept of‘pedagogic health’. This requires a modification of the original model of pedagogic frailty (Figure 1) toemphasize the dynamic continuum between frailty and resilience (Figure 3). Introducing the concept of‘pedagogic health’ and modifying the linking phrases within the model provides a subtle yet importantdevelopment for a number of reasons, as it:
•Adopts a more affirmative language (pedagogic health literacy) that may be more appealingto senior managers, having a more positive subtext than frailty.
39

Educ. Sci. 2019, 9, 157
As an analogy, the increased recognition of mental health issues among both university staffand students has moved from a pathological model (dealing with problems after they havearisen) towards one advocating greater awareness of mental health literacy for all. Oneof the problems of dealing with student wellbeing within the current Higher Educationenvironment is that ‘students approach services when their mental wellbeing is alreadyaffecting their ability to cope’ [45]. Rather than wait for problems to surface, it may be better toincrease the mental health literacy (MHL) of everyone on campus as students with problemsalso have the potential to affect others including roommates, classmates and staff [3,46–48].It is, therefore, an issue that affects us all, whatever our own state of mental health. Likewise,before waiting for academics to experience difficulties through frailty within their teaching,moving to the proactive promotion of greater pedagogic health literacy (PHL) across thecampus is likely to have a more positive outcome for the institutional community.
• Avoids a potential misuse of the model through adoption of a simplistic harmful binary,the use of which to ‘classify’ staffwould in itself be an indicator of prefrailty.
Within the managerial culture of the neoliberal university, there is pressure to find simplistic,instrumental measures that can be adopted for use as performance indicators [49]. Theemerging body of work on pedagogic frailty has demonstrated an underpinning complexityto the teaching environment that cannot be adequately represented by a simple metric. Thisprevents the concept of pedagogic frailty (or pedagogic health) to be subverted for politicalmeans and to prevent the disconnections between expectations and practice described byManathunga et al. [6].
• Indicates a continuum where no system is likely to exhibit ‘total health’ and so creates noarbitrary endpoint to prematurely terminate professional development.
The case studies of academics explored by Kinchin and Winstone [17] concentrate onacademics who were already recognised as successful teachers. Therefore, each of them hasthe potential to contribute to pedagogic resilience within their institution. However, I noteagain here that individual success is not necessarily an indicator of resilience (rather thanfrailty) across the system, and that even the most successful teaching teams do not exhibit‘total health’ (i.e., there is always something new to learn or a new skill to acquire). Thisdepends on developing healthy, positive links between the individuals within a system (e.g.,department) for that system to function well.
The learning and development of academics within this perspective do not have a predictable,linear trajectory with an easily defined or predicted endpoint. Rather, ‘[learning] is anentangled, nonlinear, iterative and recursive process, in which [academics] travel in irregularways through the various landscapes of their experience (university, family, work, sociallife) and bring those landscapes into relation with each other’ [50]. As such, it resembles therhizomatic view of learning where knowledge is susceptible to constant modification as itresponds to individual or social factors [51].
• The points listed above together help to make utilization of the model more‘management-friendly’ and from which management activities are not removed.
It is assumed that senior managers may be reluctant to investigate frailty within the systemsover which they preside, and of which they are an active part. The pathological modelmight be seen as a poisoned chalice. Therefore, by looking at pedagogic health, we havea perspective from which we hope senior managers would not feel the need to excludethemselves—something that would invalidate the whole enterprise.
40

Educ. Sci. 2019, 9, 157
varies with perceived distance to
varies with degree of explicitness and
sharing of
varies with degree of embeddedness
between
varies with the level of unresolved
tensions within the
Informs
links between
requires agentic engagement with
must
inform
requires
iterative dialogue
with
exhibits extremes
of
exhibits extremes
of
on a continuum with
Figure 3. A revised model of pedagogic health to indicate the salutogenic continuum between extremesof frailty and resilience.
8. Conclusions
The development of a productive teaching environment is key to the success of a modern university.However, in the contemporary economic and political climate of higher education, there are manyconflicting and competing discourses that need to be accommodated. Colleagues occupying differentroles within the university structure (teacher, administrator, manager) will each have a differentperspective on the university—what is important and what should be the institutional focus for thecoming years. Inevitably, the development of teaching is a compromise between what we dream ofbeing able to do and what is possible within the current constraints. In order for a university to moveforward with a sense of coherence of purpose, the stakeholders within the institution need to have ashared vision of the key elements that make up the teaching environment. When this is achieved, wecan talk about the pedagogic health of the institution in positive terms. Where this is not achieved, wemight view the pedagogic health in less positive terms—tending towards frailty.
The adoption of appropriate language is an important issue when trying to initiate buy-in fromacademics (and their managers) to support interventions to enhance teaching quality. Use of the term‘frailty’ in this context may invoke fatalistic connotations that were not the intention when originallyapplying the clinical analogy [26]. Buta et al. [52] have explored the language used in the literaturesurrounding clinical frailty and have identified some more positive expressions that can be usedto better reflect the underlying philosophy of this work (for example, characterizing frailty as ‘anopportunity for self-awareness and reflection’) that sit better with the original pedagogic frailty model.This can be enhanced using a salutogenic gaze. In order for a salutogenic perspective on PHL to beoperationalised within an institution, the network of understanding (Figure 2) needs to be relatedto productive chains of practice (sensu Kinchin and Cabot [53]), that will need to be context-specific.To this end, a modified model of pedagogic frailty is presented (Figure 3). In terms of practicalapplication of this model, the diversity of perspectives revealed by concept mapping is important tohelp avoid a simplistic binary classification (frail–resilient) as that would preclude the development ofindividualised routes towards coping and adjustment [32]. Uncovering personal perspectives on theteaching environment [17] provides a shared lexicon to open up the potential for more collaborativediscussions, helping to promote the development of a shared perspective underpinned by a set of
41

Educ. Sci. 2019, 9, 157
common values [54]. This is likely to promote more productive dialogue about teaching, and thepromotion of an environment that supports greater pedagogic health.
Within the author’s university, moves towards a more salutogenic perspective of pedagogic healthcurrently involve initiatives such as supporting a gradual transition from a ‘responding-to-student-voice’mode of operation towards a greater degree of ‘student–staff partnership’ [55], as indicated in Figure 2as a ‘life-style choice’ for the institution. Such a move is seen to have ‘the potential to remedy neoliberaluniversity models and performance self-regulation by offering a counternarrative to these dominanttrends that imagine a different model of learning between students and staff’ [56]. Analysis of thepracticalities of developing a salutogenic gaze towards PHL across a university is not anticipated to bestraightforward within institutions that have developed particular cultures and ways of doing thingsover many years. It is particularly important that the senior managers in an institution demonstrate acommitment to the counternarrative to ensure that the values that are espoused by the teachers workingin partnership with the students are reflected in the language used by and actions demonstrated by themanagement [57].
The clinical literature continues to provide the basis for analogy in describing the variation inthe way that frailty is experienced by individuals as they struggle to maintain their daily routinesin the context of complicated transitions that create uncertainty [58]. Work on pedagogic frailtysuggests a need to raise awareness among professionals (academics and university managers) of themalleability and preventability of frailty and the benefits of having an informed ‘navigator’ [43] or‘interpreter’ [59]—which, in the case of pedagogic frailty, would be an academic developer [60] orlearning developer [61]—to assist in steering a route through appropriate interventions. This providesa modified perspective in the role of the academic community as a whole, through a more distributedownership of pedagogic health [44]. It also requires academic developers to be in a position to supportthe process of conceptual exaptation of disciplinary concepts for the enhancement of teaching. Thismay be achieved most effectively when academic development becomes a distributed activity [62], andthose involved are actively engaged in research with their disciplinary peers [63]. This still requireseffort on the part of all stakeholders to engage in professional development to ensure a positivedirection of travel along the frailty—resilience continuum. As explained by D’Avanzo et al. [32], ‘Theresilience of people who succeed is achieved through continuous active development on numerousfronts’ (p. 15).
In summary, it makes no sense to consider interrelated aspects of university teaching in isolation.Educational theory and analysis of practice needs to be considered as a connected whole. Thesalutogenic model of pedagogic health provides a lens to help achieve this goal, and concept mappingprovides a tool that emphasises connectivity. Jonas [64] has referred to salutogenesis as an ‘anchoringprinciple’ to unify all dimensions of a healthcare system. I suggest here that salutogenesis offers greatpotential as a concept that can be repurposed to add clarity and a sense of coherence to the teachingendeavour. This added coherence is particularly important in the current context of political andeconomic uncertainty about the future of higher education and the need to care for our students [65]. Toreinterpret comments by Becker et al. [66] by placing them into the discourse of teaching, ‘A salutogenicgaze works prospectively by considering how to create, enhance, and improve resilience and providesa framework for researchers, and practitioners to help individuals, and organizations to move towardsoptimal pedagogic health’ (p. 25). This potential seems worth exploring, and the application of conceptmapping offers a nuanced methodology to do this.
Funding: This research received no external funding.
Conflicts of Interest: The author declares no conflict of interest.
References
1. Darabi, M.; Macaskill, A.; Reidy, L. Stress among UK academics: Identifying who copes best. J. Furth. High.Educ. 2017, 41, 393–412. [CrossRef]
42

Educ. Sci. 2019, 9, 157
2. Mark, G.; Smith, A.P. A qualitative study of stress in university staff. Adv. Soc. Sci. Res. J. 2018, 5, 238–247.[CrossRef]
3. Gulliver, A.; Farrer, L.; Bennett, K.; Griffiths, K.M. University staffmental health literacy, stigma and theirexperience of student with mental health problems. J. Furth. High. Educ. 2017, 43, 434–442. [CrossRef]
4. McLean, N.; Price, L. Identity formation among novice academic teachers—A longitudinal study.Stud. High. Educ. 2017, 44, 1–14. [CrossRef]
5. Locke, P.; Maton, K. Serving two masters: How vocational educators experience marketisation reforms.J. Voc. Educ. Train. 2019, 71, 1–20. [CrossRef]
6. Manathunga, C.; Selkrig, M.; Sadler, K.; Keamy, K. Rendering the paradoxes and pleasures of academic life:Using images, poetry and drama to speak back to the measured university. High. Educ. Res. Dev. 2017, 36,526–540. [CrossRef]
7. Leitch, R. On being transgressive in educational research! An autoethnography of borders. Irish Educ. Stud.2018, 37, 159–174. [CrossRef]
8. Mtsweni, S.H. Salutogenic Functioning Amongst University Administrative Staff ; University of South Africa:Pretoria, South Africa, 2010.
9. Bailey, G. Accountability and the rise of ‘play safe’ pedagogical practices. Educ. Train. 2014, 56, 663–674.[CrossRef]
10. Johansen, E.; Harding, T. ‘So I forgot to use 1.5 line spacing! It doesn’t make me a bad nurse!’ The attitudesto and experiences of a group of Norwegian postgraduate nurses to academic writing. Nurs. Educ. Pract.2013, 13, 366–370. [CrossRef]
11. Kinchin, I.M. Mapping the terrain of pedagogic frailty. In Pedagogic Frailty and Resilience in the University;Kinchin, I.M., Winstone, N.E., Eds.; Sense Publishers: Rotterdam, The Netherlands, 2017; pp. 1–16.
12. Kinchin, I.M. Pedagogic frailty: A concept analysis. Knowl. Manag. E Learn. 2017, 9, 295–310.13. Kinchin, I.M.; Hosein, A.; Medland, E.; Lygo-Baker, S.; Warburton, S.; Gash, D.; Rees, R.; Loughlin, C.;
Woods, R.; Price, S.; et al. Mapping the development of a new MA programme in higher education:Comparing private perceptions of a public endeavour. J. Furth. High. Educ. 2017, 41, 155–171. [CrossRef]
14. Kinchin, I.M.; Wilkinson, I. A single-case study of carer agency. J. Nurs. Educ. Pract. 2016, 6, 34–45. [CrossRef]15. Kinchin, I.M. Visualising Powerful Knowledge to Develop the Expert Student: A Knowledge Structures Perspective
on Teaching and Learning at University; Sense Publishers: Rotterdam, The Netherlands, 2016.16. Kinchin, I.M.; Winstone, N.E. (Eds.) Pedagogic Frailty and Resilience in the University; Sense Publishers:
Rotterdam, The Netherlands, 2017.17. Kinchin, I.M.; Winstone, N.E. (Eds.) Exploring Pedagogic Frailty and Resilience: Case Studies of Academic
Narrative; Brill: Leiden, The Netherlands, 2018.18. Kinchin, I.M.; Alpay, E.; Curtis, K.; Franklin, J.; Rivers, C.; Winstone, N.E. Charting the elements of pedagogic
frailty. Educ. Res. 2016, 58, 1–23. [CrossRef]19. Kostromina, S.N.; Gnedykh, D.S.; Ruschack, E.A. Russian university teachers’ ideas about pedagogic frailty.
Knowl. Manag. E Learn. 2017, 9, 311–328.20. Nicholson, C.; Gordon, A.L.; Tinker, A. Changing the way “we” view and talk about frailty. Age Ageing 2017,
46, 349–351. [CrossRef] [PubMed]21. Rotegård, A.K.; Moore, S.M.; Fagermoen, M.S.; Ruland, C.M. Health assets: A concept analysis. Int. J.
Nurs. Stud. 2010, 47, 513–525. [CrossRef]22. Whiting, L.; Kendall, S.; Wills, W. An asset-based approach: An alternative health promotion strategy.
Commun. Pract. 2012, 85, 25–28.23. Antonovsky, A. Unravelling the Mystery of Health: How People Manage Stress and Stay Well; Jossey-Bass:
San Francisco, CA, USA, 1987.24. Antonovsky, A. The salutogenic model as a theory to guide health promotion. Health Prom. Int. 1996, 11,
11–18. [CrossRef]25. Antonovsky, A. Health, Stress and Coping; Jossey-Bass: San Francisco, CA, USA, 1979.26. Kinchin, I.M. Pedagogic frailty: An initial consideration of aetiology and prognosis. Paper Presented at the
Annual Conference of the Society for Research into Higher Education (SRHE), Wales, UK, 9–11 December2015. Available online: https://www.srhe.ac.uk/conference2015/abstracts/0026.pdf (accessed on 24 June 2019).
43

Educ. Sci. 2019, 9, 157
27. Dooris, M.; Doherty, S.; Orme, J. The application of salutogenesis in universities. In The Handbook ofSalutogenesis; Mittelmark, M.B., Sagy, S., Eriksson, M., Bauer, G.F., Pelikan, J.M., Lindström, B., Espnes, G.A.,Eds.; Springer: New York, NY, USA, 2017; pp. 237–245.
28. Derham, C. Nursing. In Exploring Pedagogic Frailty and Resilience: Case Studies of Academic Narrative;Kinchin, I.M., Winstone, N.E., Eds.; Brill: Leiden, The Netherlands, 2018; pp. 61–75.
29. Usherwood, S. Politics. In Exploring Pedagogic Frailty and Resilience: Case Studies of Academic Narrative;Kinchin, I.M., Winstone, N.E., Eds.; Brill: Leiden, The Netherlands, 2018; pp. 91–103.
30. Whelligan, D. Chemistry. In Exploring Pedagogic Frailty and Resilience: Case Studies of Academic Narrative;Kinchin, I.M., Winstone, N.E., Eds.; Brill: Leiden, The Netherlands, 2018; pp. 17–31.
31. Ausubel, D.P. The Acquisition and Retention of Knowledge: A Cognitive View; Kluwer Academic Publishers:Dordrecht, The Netherlands, 2000.
32. D’Avanzo, B.; Shaw, R.; Riva, S.; Apostolo, J.; Bobrowicz-Campos, E.; Kurpas, D.; Holland, C. Stakeholders’views and experiences of care and interventions for addressing frailty and pre-frailty: A meta-synthesis ofqualitative evidence. PLoS ONE 2017, 12, e0180127.
33. Wiley, C.; Franklin, J. Framed autoethnography and pedagogic frailty: A comparative analysis of mediatedconcept maps. In Pedagogic Frailty and Resilience in the University; Kinchin, I.M., Winstone, N.E., Eds.; SensePublishers: Rotterdam, The Netherlands, 2017; pp. 17–32.
34. Gkritzali, A.; Morgan, N.; Kinchin, I.M. Pedagogic frailty and conventional wisdom in tourism education. InProceedings of the 7th International Critical Tourism Studies Conference, Palma de Mallorca, Spain, 25–29June 2017.
35. Bonmatí-Tomás, A.; del Carmen Malagón-Aguilera, M.; Bosch-Farré, C.; Gelabert-Vilella, S.; Juvinyà-Canal, D.;Gil, M.D.M.G. Reducing health inequities affecting immigrant women: A qualitative study of their availableassets. Glob. Health 2016, 12, 37. [CrossRef]
36. McMahon, S.; Fleury, J. Wellness in older adults: A concept analysis. Nurs. Forum 2012, 47, 39–51. [CrossRef][PubMed]
37. Brookfield, S. Pedagogical peculiarities: An introduction. In Pedagogical Peculiarities: Conversations at the Edgeof University Teaching and Learning; Medland, E., Watermeyer, R., Hosein, A., Kinchin, I.M., Lygo-Baker, S.,Eds.; Sense Publishers: Rotterdam, The Netherlands, 2018; pp. 1–16.
38. Kinman, G. Work stressors, health and sense of coherence in UK academic employees. Educ. Psychol. 2008,28, 823–835. [CrossRef]
39. Hosein, A.; Rao, N.; Yeh, C.S.-H.; Kinchin, I.M. (Eds.) International Academics’ Teaching Journeys: PersonalNarratives of Transitions in Higher Education; Bloomsbury Publishing: London, UK, 2018.
40. Lygo-Baker, S. The role of values in higher education: The fluctuations of pedagogic frailty. In PedagogicFrailty and Resilience in the University; Kinchin, I.M., Winstone, N.E., Eds.; Sense Publishers: Rotterdam, TheNetherlands, 2017; pp. 79–91.
41. Read, B.; Leathwood, C. Tomorrow’s a mystery: Constructions of the future and ‘un/becoming’ amongst‘early’ and ‘late’ career academics. Int. Stud. Soc. Educ. 2018, 27, 333–351. [CrossRef]
42. Junius-Walker, U.; Onder, G.; Soleymani, D.; Wiese, B.; Albaina, O.; Bernabei, R.; Marzetti, E. The essence offrailty: A systematic review and qualitative synthesis on frailty concepts and definitions. Eur. J. Int. Med.2018, 56, 3–10. [CrossRef] [PubMed]
43. Gwyther, H.; Shaw, R.; Dauden, E.A.J.; D’Avanzo, B.; Kurpas, D.; Bujnowska-Fedak, M.; Holland, C.Understanding frailty: A qualitative study of European healthcare policy-makers’ approaches to frailtyscreening and management. BMJ Open 2018, 8, e018653. [CrossRef] [PubMed]
44. Jones, S. Academic leadership. In Pedagogic Frailty and Resilience in the University; Kinchin, I.M., Winstone, N.E.,Eds.; Sense Publishers: Rotterdam, The Netherlands, 2017; pp. 163–178.
45. Broglia, E.; Millings, A.; Barkham, M. Challenges to addressing student mental health in embeddedcounselling services: A survey of UK higher and further education institutions. Br. J. Guid. Couns. 2017, 46,441–455. [CrossRef]
46. Kitzrow, M.A. The mental health needs of today’s college students: Challenges and recommendations.NASPA J. 2003, 41, 167–181. [CrossRef]
47. Kutcher, S.; Wei, Y.; Coniglio, C. Mental health literacy: Past, present and future. Can. J. Psychiatry 2016, 61,154–158. [CrossRef]
44
Educ. Sci. 2019, 9, 157
48. Gorczynski, P.; Sims-Schouten, W.; Hill, D.; Wilson, J.C. Examining mental health literacy, help seekingbehaviours, and mental health outcomes in UK university students. J. Ment. Health Train. Educ. Pract. 2017,12, 111–120. [CrossRef]
49. Kenny, J. Re-empowering academics in a corporate culture: An exploration of workload and performativityin a university. High. Educ. 2018, 75, 365–380. [CrossRef]
50. Taylor, C.A.; Harris-Evans, J. Reconceptualising transition to Higher Education with Deleuze and Guattari.Stud. High. Educ. 2018, 43, 1254–1267. [CrossRef]
51. Deleuze, G.; Guattari, F. A Thousand Plateaus: Capitalism and Schizophrenia; Massumi, B., Ed.; Athlone Press:London, UK, 2004.
52. Buta, B.; Leder, D.; Miller, R.; Schoenborn, N.L.; Green, A.R.; Varadham, R. The use of figurative language todescribe frailty in older adults. J. Frailty Aging 2018, 7, 127–133. [PubMed]
53. Kinchin, I.M.; Cabot, L.B. Reconsidering the dimensions of expertise: From linear stages towards dualprocessing. Lond. Rev. Educ. 2010, 8, 153–166. [CrossRef]
54. Aguiar, J.G.; Thumser, A.E.; Bailey, S.G.; Trinder, S.L.; Bailey, I.; Evans, D.L.; Kinchin, I.M. Scaffolding acollaborative process through concept mapping: A case study on faculty development. PSU Res. Rev. 2019.[CrossRef]
55. Gravett, K.; Yakovchuk, N.; Kinchin, I.M. Enhancing Student-Centred Teaching in Higher Education: TheLandscape of Student-Staff Partnerships; Palgrave Macmillan: London, UK, 2019.
56. Matthews, K.E.; Dwyer, A.; Russell, S.; Enright, E. It is a complicated thing: leaders’ conceptions of studentsas partners in the neoliberal university. Stud. High. Educ. 2018, 1–12. [CrossRef]
57. Gravett, K.; Kinchin, I.M.; Winstone, N.E. ‘More than customers’: Conceptions of students as partners heldby students, staff, and institutional leaders. Stud. High. Educ. 2019, 1–14. [CrossRef]
58. Skilbeck, J.K.; Arthur, A.; Seymour, J. Making sense of frailty: An ethnographic study of the experience ofolder people living with complex health problems. Int. J. Older People Nurs. 2018, 13, e12172. [CrossRef]
59. Gravett, K.; Winstone, N.E. ‘Feedback interpreters’: The role of learning development professionals infacilitating university students’ engagement with feedback. Teach. High. Educ. 2018, 1–16. [CrossRef]
60. Barnett, L. Learning Development. In Exploring Pedagogic Frailty and Resilience: Case Studies of AcademicNarrative; Kinchin, I.M., Winstone, N.E., Eds.; Brill: Leiden, The Netherlands, 2018; pp. 187–203.
61. Medland, E. Academic Development. In Exploring Pedagogic Frailty and Resilience: Case Studies of AcademicNarrative; Kinchin, I.M., Winstone, N.E., Eds.; Brill: Leiden, The Netherlands, 2018; pp. 153–168.
62. Healey, M.; Jenkins, A. The role of academic developers in embedding high-impact undergraduate researchand inquiry in mainstream higher education: Twenty years’ reflection. Int. J. Acad. Dev. 2018, 23, 52–64.[CrossRef]
63. Kinchin, I.M.; Heron, M.; Hosein, A.; Lygo-Baker, S.N.; Medland, E.; Morley, D.; Winstone, N.E. Researcher-ledacademic development. Int. J. Acad. Dev. 2019, 23, 339–354. [CrossRef]
64. Jonas, W.B. Salutogenesis: The defining concept for a new healthcare system. Glob. Adv. Health Med. 2014, 3,82–91. [CrossRef] [PubMed]
65. Barnacle, R.; Dall’Alba, G. Committed to learn: Student engagement and care in higher education. High. Educ.Res. Dev. 2017, 36, 1326–1338. [CrossRef]
66. Becker, C.M.; Glascoff, M.A.; Felts, W.M. Salutogenesis 30 Years Later: Where do we go from here? Glob. J.Health Educ. Promot. 2010, 13, 25–32.
© 2019 by the author. Licensee MDPI, Basel, Switzerland. This article is an open accessarticle distributed under the terms and conditions of the Creative Commons Attribution(CC BY) license (http://creativecommons.org/licenses/by/4.0/).
45

education sciences
Article
The Role and Efficacy of Creative Imagination inConcept Formation: A Study of Variables for Childrenin Primary School
Javier Gonzalez Garcia 1,* and Tirtha Prasad Mukhopadhyay 2
1 Department of Music and Performing Arts; University of Guanajuato, Guanajuato 36000, México2 Department of Art and Business, University of Guanajuato, Salamanca 36766, México* Correspondence: [email protected]
Received: 10 May 2019; Accepted: 30 May 2019; Published: 5 July 2019
Abstract: Children’s creative imagination is tested through tasks involving narrative and drawingabilities for participants between the age of 8 and 12 years. The test determines the relative importanceof ‘narrative’ against ‘graphic’ imagination in interpretive, problem-solving strategies, and alsoconsiders how such distinctive functions of the creative imagination could affect ‘general’ creativity ofthe child learner. Participants were chosen from designated primary schools in the state of Guanajuato,Mexico. The test on creativity complements facts from observational methodology in a population ofmixed Castilian-speaking children. The name of the test is Prueba de Imaginación Creativa Niños (2008)or ‘Test of Creative Imagination in Children’, the Castilian acronym being PIC-N. It comprised foursub-tests: Three designed to evaluate narrative (verbal) creativity, and one for drawing (i.e., graphic)creativity. The first three ‘exercises’ in the suite indicates (a) fluency, (b) flexibility, and (c) originality innarrative representations, whereas the fourth indexes (d) graphic abilities of the child learner. Resultssuggest that creative imagination causes variations in specific aspects of creativity, like narrative andgraphic improvisation, and also modifies ‘general’ creativity as understood from the perspective of adevelopmental psychology of learning abilities in growing children within the defined age group.
Keywords: creative imagination; drawing; storytelling; primary education; psychometric analysis
1. Introduction to Creativity
Creative Imagination appears to be active from an early age and is instrumental in learning andproblem-solving strategies. Indeed, such imagination is one of the major ways in which childrenascribe meaning and communicate information, attributing new meaning to objects they did not knowpreviously, and to form new experiences from verbal stimuli, images, and also patterns of sound(which was not examined for this project). The archaic research on children’s creativity was undertakenby Vygotsky [1], following Piaget [2], but in a manner that predicts the trajectory of the imaginationfor children’s learning and interpretative abilities. Vygotsky’s premises constitute some basic laws ofdevelopmental psychology for, more specifically, what he was to call “creativity”, a term denotingpsychomotor processes for producing both mental and physical representations in the material world.Also, ‘creativity’, as Vygotsky defined it, refers to a correlate of what he called ‘imagination’. The latter,in fact, seems to have a more mental and even neural substratum. In this paper, we shall use the term‘creative imagination’ to denote integrated neurobehavioral functions that employ imagination [3].
Vygotsky’s basic proposition revealed how children could use creative imagination to make senseof this world. As such, the Vygotskian proposition lends itself to later speculations in psychology ofchildren where importance has been laid on the methods of constructing narratives of imaginationby children for strategies of interpretation and meaning creation [4]. What is of more immediatevalue for this research is the controversy regarding the intrinsic nature of creative imagination.
Educ. Sci. 2019, 9, 175; doi:10.3390/educsci9030175 www.mdpi.com/journal/education47
Educ. Sci. 2019, 9, 175
Is children’s imagination manifested in organized reproductions of experience already available inreal life as Piaget originally claimed, or did it have innate properties that manifested itself in variousfaculties, like verbal processing or visual memory? Harris’ experiments, in this regard, use moreof an active developmental angle to explain the process of creative imagination. Harris advocatesmultiple ontologies that suggest that the imagination functions as a cluster of discrete neurobehavioralfaculties, like a multitasking function. Research on children’s fantasy undertaken in the 1980s and1990s underscore how imagination could control a child’s understanding of corresponding aspects ofreality [5–8]. Assuming that various aspects of the imaginative intelligence could be isolated and testedfor their efficacy in the developmental process is perhaps of essence for this project. We consider thesingular paradigm of creativity but we are generally inclined to show that facets of language, verbalprocessing, and visual-imaginative precepts may constitute separate enclaves in children’s mindsand that it is possible that one or other aspect may be instrumental in the execution of predefinedtasks. Interestingly, it should also show that creativity progresses by means of both selective andsynchronic organization of elements, and that practical engagement with such elements can leadto a general development for children’s interpretative or learning abilities. Among other things,the test packet employed here explains functions of at least two important faculties. Furthermore,observation confirms that such practice could influence development on a long-term basis, for whichother temporally spaced tests might be necessary.
Research here indicates that applications of the principle may be effective for teaching and learningat the elementary and middle school levels [9].
We intended to measure how verbal stimuli, generated from reading and storytelling, actuallycompletes and transforms levels of knowledge in the child. We set imaginative tasks to stimulate thissense of meaning and interest in relation to real life problems and to explore why children’s fantasyworlds are “so significant and interesting” and see how, as Egan said, we can use “what we learn fromthis process for educational purposes” [10]. Imagination is a “new psychological process” for the child.It represents a “specifically human form of conscious activity”. Like all functions of knowledge, itarises originally from “action” [11]. Since creative imagination can be discovered in the products ofcreative life, especially of children, we tried to see how elements of representation, by story-telling ordrawing, are incorporated in meaningful representations. The task of narrating or drawing objectsinvolves analysis and reintegration, reproducing arrays, and objectivity in complex formations. Hence,the justification for the methodology adopted for the test.
2. The Quantitative Framework
There are disputes with the psychometric approach to studies on creativity and creative imagination.Many scholars doubt that it is possible to quantify something as delicate as creative imaginationthrough standardized tests [12,13]. Consistently, in keeping with this line of thinking, Ausubel et al. [14]proposed that creativity was an ‘innate capacity’; that is, a particularized and substantial capacity andborn with the individual, but it would be difficult to develop it under influences of environment. Thereare some creative traits, however, that if developed, could turn to function as supportive instrumentsfor the intellect and the personality of a child.
We demonstrate similarly that categorical re-inforcements might actually help children inour designated age group not only to deal with immediate instruments, but also learn to applycreative imagination to such instruments for better alternatives. If proven, intrinsic abilities withincreative-imaginative modules may be shown to have positive effects children in the primary schoolsegment. As we said, this proposition is not new in the literature, but our research could probablyconfirm the presence of variables in the project. We observed creativity in children to hypothesize ifcertain elements already singled out in the literature are also not instrumental in domain of the tasks forthe experiment. We got to confirm that, among other suggested variables, creative imagination involvesat least the following steps: (1) ‘Encounter’, since any process begins with the presentation of a tangibleproblem to the individual who engages with it [15]. (2) ‘Incubation’, during which an individual
48
Educ. Sci. 2019, 9, 175
is continuously inspired by the reality of the problem [16]. (3) ‘Enlightenment’, corresponding tothe results of the process [17]. (4) Self-induced evaluation and verification, in which the participanttakes time to check the best options and ideas adopted [18]. We also endorse the profile of thecreative subject in terms of nine aspects, among several recognized instruments realized in suchauthorities as Guilford [19] and Torrance [20]: These are originality, flexibility, production or fluency,elaboration, analysis, synthesis, mental opening, communication and sensitivity to problem, and levelof inventiveness [21]. These factors are reduced to more computable categories for the experiment, asare outlined in the section on methodology. Finally, what remains to be said is that these factors, aftercareful extraction, are set aside specifically for verbal and visual creativity—the two more commonsensory functions responsible for semantically valid constructs.
3. Existing Models of Creativity: Review and Suggestions
The evaluation of creativity is, thus, a hotly debated topic ranging from skepticism about thepossibility of evaluation to asserting that creativity must be evaluated for purposes of improvement andinstruction. De la Torre [22] is one author that bets on evaluation. He proposed that creativity requiresinter and transdisciplinary approaches, since it has psychological, pedagogical, neurobiological, andsociological connotations [23]. The importance of evaluation of is also defended by authors suchas Kaufman [24], who states that creativity is evaluated not only to measure the performance of anindividual, but to promote the same type of creativity through stimuli and incentives.
In order to evaluate creativity, different instruments have been employed, all of which have takeninto account the three major avenues to its understanding—namely, that of ‘creative process’ [25–27],and finally, that of quantifying the ‘creative product’ [28].
We should, thus, draw attention to these attempts in a systematic manner to follow the debate onhow attempts have been made to quantify, use, and develop creative practices in real terms. First of all,studies on creative persons are usually aimed at identifying ‘personality’, ‘motivation’, ‘intelligence’,‘cognitive styles’, and ‘knowledge’ that creative people possess or employ [29–31]. Most of thesestudies conclude that there are certain factors or personality traits that are often associated with highcreativity in very different areas. These factors could be increased tolerance for ambiguity, willingnessto take risk, self-regulation, interest etc. In this sense, the creative person is described as being moresensitive to problems and information gaps and seems to manifest a need to construct more hypotheses,to investigate and to evaluate problems [26]. Some personality traits appear to be more frequent inpeople who stand out for their artistic creativity and yet there are others that are more frequentlyvisible in fields of scientific inventions [28].
The other approach to factorial analysis of creative activity has been to consider the conditionsresponsible for execution of novel tasks. The main models in this group attempts to describe mentaloperations or phases that a person goes through or experiences during the making of a creative product,such as exploration, incubation, insight, evaluation, etc. This approach also invites categorizationof creative thinking in terms that suggest that it is different from non-creative thinking: Such as,for example, the extent to which creative thinking involves conscious, as distinct from unconsciousprocesses, or to what extent creative thinking is the result of external effects such as luck, or of long-termefforts such as persistence and hard work. An example of this process-centered approach is the“Geneplore” model proposed by Finke, Ward, and Smith [31] in which they identify two phases in thecreative process: A first of “generation”, generating many possible ideas that can solve a problem anda second phase of “exploration”, in which the different possible solutions are evaluated to select themost appropriate one. Another well-known approach is the one proposed by Csikszentmihaly [25],which introduces, as we well know, the notion of “flow”. We do take cognizance of this model, as wellthe former one, with their insistence on personality and processual actions.
But the third existing model seems to be more viable, especially for children where personalityis less complex, and products of creativity, such as drawing, are easier to deconstruct. Creativityis a fundamental aspect of cognitive development and is behaviorally manifested, and hence, its
49
Educ. Sci. 2019, 9, 175
measurement depends on variables reflected in the immediate products of psychomotor functions, andthis is perhaps more readily visible in children [32]. It is necessary to both evaluate and quantify thebehavioral manifests of creativity in order to understand if there are relevant correlations of elementswithin constituents of those products.
So, as for this creative product model of creative imagination, scholars like Sternberg [33] andKaufman [24] point out that most creative ideas are characterized by the presence of three components.First, that the creative idea must refer to something different, original, new, or innovative. Second,creative ideas must lead to a quality product. Third, creative ideas will have to be appropriate forthe task or problem that is presented. In short, it could be said that a creative product must be novel,of recognizably high quality, and relevant. Studies focusing on the creative ‘product’ try to determine asto how to judge whether a particular work (poem, musical composition, drawing, etc.) is creative or not.In this sense, some researchers propose to use the consensual assessment technique while estimatingthe creativity of products or achievements of people or groups [13]. This technique involves judgesor experts in an area of knowledge, assigning scores to real products such as a written composition,a poem, or a drawing. We would like to argue in favor of the fact that creativity should always beevaluated in such concrete domains. An evaluative-quantitative approach centered on the product hasthe potential of being more objective, although it would have the drawback of not allowing us to knowhow the subject reaches the end product. It also makes it possible to identify subjects that have beenremarkably creative, but it does not make it easier to identify subjects whose creative potential are yetto be developed [34].
The fourth factor, the pressures of the environment, emphasizes how the social environment, themodels to which one is exposed and the cultural values and attitudes that surround us contribute,sometimes to a great extent, to foment or inhibit our creativity.
4. Creativity Testing in Children
Torrance [35] has made great contributions to the study of creativity; he became interested inthings that can be done before, during, and after a lesson to increase creative thinking. He indicatedthat creativity is a process that is expressed in changes discovered, is a capacity that can be developedand, in children, it is something that is confirmed through their productions, such as stories, fantasies,and drawings. In addition, he designed a test to evaluate the four basic skills that reflect creativity:Namely, fluency, flexibility, originality, and elaboration. In the most recent version of his test publishedin 2008, he proposed some changes to the proposed indicators: Fluidity here refers to the ability toproduce a large number of ideas; originality now involves, for him, the ability to contribute ideas orsolutions that are far from the obvious, common, or established; elaboration appears as the aptitude ofdetailing ideas; finally, again, titles for creativity refer in the latest version of the analysis to the abilityto generate ideas that capture the essence of drawings and sensory reproductions. Torrance also speaksof the ability to generate original ideas, with intense images and details in addition to the stimulus.
The Torrance’s Creative Thinking Test [36] is based on Guilford’s theory of intellect [37] and is a usefultool for evaluating both quantitative and qualitative aspects of divergent thinking, especially creativeproducts [38]. This instrument consists of a group of useful tests to evaluate the creative process as awhole and also the specific skills that define it. The figurative expression section of Form 1A evaluatesthe level of imagination in constructs like drawings and computes the products of the three followingactivities: (a) Composition, (b) finish, and (c) parallels. The definition of creativity is far from reachingan unanimity among members of the scientific community, but despite the diversity of perspectives,most authors agree that it is a complex and multifaceted construct. Davis and Wechsler [39] andVendramini and Oakland [40] validate the Torrance test for the evaluation of divergent thinking; theseauthors recognize the accuracy and validity of the assumptions regarding the structure of the novelimage. Most other similar studies report on the structural validity of the dimensions assessed in thesubtests of this test (fluidity, flexibility, originality, and elaboration) and even establish high correlations
50
Educ. Sci. 2019, 9, 175
between them. The works of Guilford [19] and Torrance [35] set a milestone in the study and evaluationof creativity based on psychometric and factorial perspectives.
Empirical evidence supporting the test proposed by Torrance [35] had its beginnings with the1959 analyses of high school students where the three of the components of his test—fluidity, flexibility,and originality—were extensively confirmed and agreed upon as being the best predictors of creativeachievement. Five years later, Torrance resent a questionnaire to the entire population that participatedin the research of 1959 and found that all predictors of creativity were significant at a level of 0.01.In order to examine the relationship between the various indicators, a later study used Plucker’sstructural model in which it was argued that intelligence also has a positive effect on Torrance’s test [41].Increments in the four factors—fluidity, flexibility, originality, and elaboration—when evaluated byjudgments of experts, reinforced the predictive validity of the test. In Plucker’s research, data wereexamined under a Pearson product-moment correlation and a positive relationship was found betweenthe indicators of creativity and the criteria of intelligence in creative achievement. Various analysessuch as Plucker’s have confirmed that the Torrance test is highly predictive of creative production ineach of its indicators. Research of Terman and Oden (1959), Bloom (1985) [42], and Torrance (1993)with highly intelligent and talented individuals emphasized the critical role of personality factors,opportunity, experiences, and other environmental aspects that could play a role relevant to thedevelopment of creativity. However, it is very clear that there are other additional factors that can helpor prevent the recognition of creative characteristics.
5. The Socio-Educational Context
Several authors such as Sánchez, García, and Valdés [43] have indicated that in a country likeMexico, there are no valid or reliable instruments of measuring children’s creativity. Therefore, itwas considered indispensable to validate Torrance’s creative thinking test for a sample of Mexicanstudents and to confirm psychometric properties of creativity in the population analyzed. Creativedevelopment provides a path of maturation in which creative activity manifests itself at different levelsand in different ways. The present research aimed to analyze the incidence of imaginative strategiessolely for the narrative and drawing tasks assigned to the children of the fifth grade in primary schoolsin Guanajuato, Mexico. The application consisted of a set of imaginative strategies in narrative anddrawing tasks for an experimental group, and also for children not subject to the program, or thecontrol group.
The assumptions of Torrance [35] and the later Torrance (2008) were considered as the startinghypotheses. Individuals who exhibit high levels of creativity have a greater potential to benefit fromcreative educational experiences and could be compared to groups of children with high and lowlevels of creativity [34] as is also evidenced in the research of Olveira, Ferrándiz, Ferrando, Sainz, andPrieto [44]. As for the only specific precedence, Soto and colleagues [45] already analyzed the constructvalidity of the Torrance creative thinking test with a sample of 500 students from a primary schoollocated in an urban-marginal zone of the Iztapalapa delegation in the Federal District of Mexico.
Soto and his colleagues found that children with high scores showed an increase in graphic (visual)creativity and also originality, elaboration, fluency, better title construction, and closure. Childrenwith low scores demonstrated increases in visual creativity and indicators of fluidity, originality, andtitles. It is important to note that, although significant improvement in total creativity was achieved inboth groups, a separate analysis was done for the group of highly creative children. Positive changeswere observed in all the indicators, while in the group with low observed creativity, increase wasrecorded only in fluency, originality, and title-writing. Likewise, a decrease in the values of elaborationand closure was found for the same by Soto and his colleagues. Differences in individual parameterssupport the need of considering a variety of indicators for evaluating creativity, since the scoresexhibited significant increases in both intragroup and intergroup creativity, as well as in each oneof the indicators discussed. Different aspects of the same construct of creativity may show a certainindependence from one another and this may be a desirable quality of the instruments of measurement.
51

Educ. Sci. 2019, 9, 175
Likewise, performance tests, questionnaires, self-reports, and tests involving subjective judgmenthave been used to assess creativity in children from other Latin American countries [23,46,47]. The testsof performance or skill that quantify the creative process, primarily of divergent thinking, are the teststhat have focused most on the psychometric factors of creativity. In this sense, López-Martinez andNavarro-Lozano [47] talks about tests of divergent thinking that are elaborated from Guilford’s SOItest. We also refer to Perez and Avila [48], whose tests are based on Guilford’s multifactorial theory ofintelligence, which states that creativity is not an independent dimension, but is integrated in contextsof many cognitive functions. Performance tests in Spanish made considerable use of versions of thePIC instrument. In addition to performance tests, the PIC has related assessment tools: Self-report,questionnaires, inventories, and scales that evaluate the characteristics of members in the sample.But these tests have limitations and are specific to the objective of research. Based on what has beensaid, this study aims to analyze if there is a statistical relationship between the scores obtained innarrative and drawing manifests of creative imagination and, unlike Ramirez or Lopez’s study ofadditional variables, aims to be a comparative analysis of factors that are agreed upon in the literature.The PIC-A tests is based on the Guilford test battery, the turtle test, and latest versions of Torrance, andmay be explained in detail for purposes of arriving at conclusions regarding merits of relative factorsin creativity and also their synergic relationship to the broad question of how creative imaginationfunctions as a system.
6. Methodology
The PIC, or Prueba de Imaginación Creativa Niños [49], was applied to count creativity for theexperimental group (as well as the control group). The PIC may be translated as the ‘Test of CreativeImagination in Children’. Generally, the PIC may be defined as a test of divergent thinking that evaluatescreativity by examining how individuals use creative imagination in their creative representations.There are three versions of the PIC, for the levels of children PIC-N, adolescents PIC-J, and adultsPIC-A, respectively, but all three versions have a similar structure of factorial measure for both verbalcreativity and visual or graphic creativity.
Its application can be either individual or collective; in our case, the PIC was applied toparticipants individually. It also measures a ‘general’ creativity index for each participant. The scopeof the experiment was restricted to school children between the third and sixth year of their primaryeducation (with ages between 8 to 12 years). In terms of duration, the application could be variable,although for our experiment, a time-frame of approximately 40 min was chosen. For this duration, thePIC could be used to measure things like the ability to: (a) Formulate hypotheses (Exercise 1), (b) tothink in an unconventional way (Exercise 2), (c) to exploit imagination and fantasy (Exercise 3), and(d) to employ, specifically, the graphic or imagistic imagination (Exercise 4). Results for the PIC areexpressed in percentile for each variable studied and for each course of activity. Finally, we need tosay that the materials for the test application was comprised of a test manual, an exercise copy, and acorrection booklet.
7. Sample
The sample consisted of 300 children, 150 of them belonging to the experimental group (75 boysand 75 girls), and 150 corresponding to the control group (75 boys and 75 girls) from two public schoolsin Guanajuato, Mexico. The ages of the children ranged from 8 years to 12 years; students had tomeet the following selection criteria: (a) Children could not have repeated or failed courses, (b) theycould not have taken art classes (like drawing or painting) or literature classes, in which parents orguardians in charge might have influenced them in one of these two areas by demonstrating preceptsof imaginative instruction and interpretation. These aforementioned variables, namely those of art orliterature, were considered to restrict any prior intervention of factors that could have either affected orstrengthened children’s awareness or employment of creative imagination in some way or the other.Children who had this prior stimulus may have had higher scores. To evade the intervention of these
52

Educ. Sci. 2019, 9, 175
variables, we had to make sure that the children population were equivalent in both the experimentaland control groups.
8. Instruments
The PIC 2004, as we said, evaluates narrative creativity and graphic creativity to obtain a result ofgeneral creativity for the imagination of children between 8 and 12 years. The 4 “tests” or “exercises”are used to count four different facets of creativity originally suggested by Torrance (1966): Namely,fluidity, flexibility, elaboration, and originality, both in their narrative and graphic aspects. It offersscores on each of these facets and gives then a sum of both narrative and graphic aspects to render atotal score of creativity. It may be characterized as a simple instrument, easy to apply or readjust withthe help of guidelines given in the test manual. The term “game” is used on the front cover of the testsin order to minimize the impression of an evaluation or examination for participating subjects, and toobtain results of the application in an environment free from strict regulations since this encouragesthe ludic tendencies of creative subjects. The first game evaluates fluidity and flexibility with thehelp of an image in which children must write something by using given phrases to represent all theideas that they consider may be passing through their minds. In the second, fluidity, flexibility, andoriginality are evaluated through a score for arrangement of one or several rubber tubes of differentsizes. The third test poses an unexpected situation for the young participants, which is that they wouldneed to imagine what would happen under implausible conditions, like in a situation in which asquirrel would suddenly turn into a dinosaur. Finally, four incomplete drawings are presented in thefourth game. Here, children had to complete each inchoate figure by drawing out something no onehas thought of before.
A pre-test and post-test were applied, for evaluating fluidity, flexibility, originality, and elaborationaccording to the following criteria:
• Fluency: Evaluated in games 1, 2, and 3. One point is registered for each proposed idea. Repeatedand non-pertinent answers are eliminated. To obtain score the total points for the individualgames (1, 2, and 3) has to be added and placed in the corresponding box.
• Flexibility: This is evaluated in games 1, 2, and 3. Again, one point is registered for each differentcategory. The number of categories is counted. To obtain the total, points from individual games(1, 2, and 3) must be added and then placed in the corresponding box.
• Originality: This is evaluated in games 2, 3, and 4. Scores are obtained by multiplying thecoefficient that appears on the right, to obtain the total; similarly, all points must be added andplaced in the corresponding box. This score is given on a range of 0 to 3. In game 4, originalityis evaluated graphically by comparing the given answers of each drawing with the tables oforiginality that are provided. A score of 0, 1, 2, or 3 has to be assigned depending on the matchingstatistical frequency of the response.
• Elaboration: The answer given to each drawing was assigned a score of 0 to 2 according to theamount of details in it.
The application of the test was carried out individually, since it was assumed that the creativeimagination is a process that is strengthened individually.
9. Description of Experimental Procedure
To achieve the objectives set out in this research, which is to determine how creativeimagination augments learning and interpretive abilities, we examined an experimental groupwith pretest-and-post-test measurement, with a control group.
This measurement was made to determine the effects of a set of imaginative strategies (independentvariables) on the dependent variable (creative imagination). In order to increase the internal validity ofthe study, intervening variables were controlled, thus excluding variables such as training and repetition.
53

Educ. Sci. 2019, 9, 175
10. A Detailed Report of the Pre-Test Activity
(1) A pre-test procedure was carried out, in order to ascertain the initial level of creative imaginationin participants of both groups. This was done on an individual basis, in the same school, and on thesame day.
Teachers and parents were informed of the objectives of the study and were solicited forconfidentiality. The families of the students gave authorization to carry out the study.
Prior to the application of the program, the group classes that were to constitute the experimentalgroup where the program was applied, and the group that was to constitute the control group, inwhich only the PIC was applied, were randomly selected. The test was applied before and after thedevelopment of the program in the experimental groups. The program was carried out in two centers.
The PIC pass is made during class hours and in a classroom where students are alone andseparated from their peers. It is a sunny classroom, well ventilated, and noise-free, following theoriginal instructions of the test manuals [49]. The application is made by the school counselor ofthe center.
Each child received a copy of the application booklet. During the application, the children had avaried material to paint (pens, waxes, markers, pencil sharpeners, erasers, etc.). The instructions wereadapted to the children’s age and comprehension skills. The applications were collective respectingthe distribution by classrooms, in a single session.
The test is applied at the beginning (pretest) and at the end (post-test) of the program developmentto both the control group and the experimental group.
(2) Subsequently, it was applied to the strategies of the creative imagination that contained newactivities in the experimental group. The first strategy for increasing fluency and flexibility requiredfour activities (Guilford circles, mystery problems, brainstorming, other uses of everyday objects).The other strategy for incremental originality and elaboration was shaped by five activities (verbalanalogies, relaxation and imagination, the best animal in the world, improvement of designs, andthe machine without use), which sought to increase the participants’ creative imagination throughindicators raised by Guilford (1950) and confirmed and developed by Torrance. Once again, these arefluency, flexibility, originality, and elaboration.
11. Requirements and Exercises
The test consists of the accomplishment of exercises of complementation of drawings or graphspreviously designed and proposed so that the students complete them; they must provide all thenecessary ideas to make the drawing interesting. The test evaluates the creativity from the use thatthe individual makes of his imagination. It consists of four exercises: The first three assess verbal ornarrative creativity and the fourth evaluates graphic creativity.
Exercise 1. In this exercise, from a situation that is reflected in a drawing, the individual has towrite everything that could be happening in the scene. The presented stimulus varies according to theversion of the PIC in question: In the PIC-N, a boy opening a chest; in the PIC-J, a boy and a girl ina lake; and in the PIC-A, an ambiguous scene is presented in the street, in which several charactersappear. This game allows the person to express their curiosity and imagination and has been includedto explore the ability to formulate hypotheses and think in terms of the possible. The test allows theexpression of curiosity and speculative attitude; the ability to go beyond the information provided bythe stimulus, by posing different possibilities with respect to what is imagined to occur on the scene.
Exercise 2. This exercise consists of a test, in which a list of possible uses of an object must beelaborated, according to Artola et al. [49]. In this case, it is: “Uses of a rubber tube”; in this exercise orsubtest, the stimulus presented is the same in PIC-N as in PIC-J and PIC-A. This test is included as ameasure of the ability of individuals to free their mind and think in an unconventional way; allows theevaluation of the “redefinition” of problems, that is, the ability to find uses, functions, and applicationsdifferent from the usual ones; to quicken the mind; and to offer new interpretations or meanings to
54
Educ. Sci. 2019, 9, 175
familiar objects, to give them a new use or meaning. Subjects can use the number and size of tubesthey want. As in the first exercise, there is a list from 1 to 38, and it starts with an example.
Exercise 3. The exercise proposes subjecting subjects to unlikely situations. The situation presentedvaries according to the version of the PIC. In PIC-N, the situation is as follows: “Imagine what wouldhappen if each squirrel suddenly became a dinosaur”; in the PIC-J, the situation is: “Imagine whatwould happen if the ground were elastic”; in the PIC-A: “Imagine what would happen if we did notstop remembering”. The exercise evaluates the fantasy aspect of the imagination. This way of thinkingseems very important in creative behavior. This exercise identifies the capacity for fantasy and theability to handle unconventional ideas, which the subject probably would not dare to express in moreserious situations, as well as openness and receptivity to novel situations. It is interesting how the testallows for the evaluation of the ability of “penetration” of the subject or ability to delve into experiences.Some of the consequences of the presented situation are obvious and simple to discover, while others,more remote, require a deeper study of the matter.
Exercise 4. This exercise is a graphic imagination test, inspired by the items of the Torrance Test(1966), according to Artola et al. [49]; in it, the subject must complete four drawings from a given strokeand put a title to each one of them. According to the authors, the incomplete figures used in game fourhave been selected, after presenting several figures to a sample of people considered as very creative(included in a program for gifted individuals), selecting the four that are most suggestive for them.The only premise, before starting the test, is to ask them to try to draw a picture that no other personcould imagine; equally, the answers must give all the ideas necessary to make the drawing interesting.
12. Post-Test Assessments
(1). Nine activities were planned with three sessions per week. These activities took into accounteveryday situations and objects that allowed participant children to express their imaginationthrough free expressions and reflecting them in a concrete way. Especially, narrative and graphicaspects were stimulated given that both aspects are exercised in different areas of activity in school.
(2). After the intervention, the post-test evaluation was performed for both groups individually. Theobjective was to analyze the impact of imaginative strategies in the narrative and the drawingreflected in the context of a significant increase of score in the experimental group.
(3). After the post-test evaluation, an open interview with the teachers was used to compare theresults obtained and to develop a more in-depth discussion of the results of the intervention.(Appendix A).
13. Results
Exercises 1–4, in their individual and combined applications, yielded the following results for thefour conditions underlined by Torrance [35] and developed in contexts of schoolchildren in Mexicoby Ramirez and colleagues [45], and also for investigative paradigm among primary school childrenin Chile by Lubart [38]; Lopéz and Navarro [23] indicate a p-value < 0.01 for general creativity for acomparative analysis of experiment and control groups in these categories.
Through Tables 1 and 2 we can observe the evolution of results before and after the program ofnine activities for creative development. Through the evolution of means and standard deviations,the impact of the imaginative strategies in the narrative and the reflected drawing is observed in thecontext of a significant increase in the score in the experimental group.
55

Educ. Sci. 2019, 9, 175
Table 1. Mean and standard deviation calculated on EXCEL for pre-test variables of creativity for theindividual components suggested in the literature following Torrance (1966).
Variable Group Median Standard Deviation
Narrative Fluidity Experimental 19.3 3.42Control 20.2 3.49
NarrativeFlexibility
Experimental 17.6 3.31Control 18.6 3.43
NarrativeOriginality
Experimental 11.2 2.91Control 11.5 2.87
Graphic Originality Experimental 6.1 2.03Control 5.9 2.19
Special Details Experimental 0.2 0.12Control 0.2 0.11
TitleExperimental 2.1 1.03
Control 2.2 1.05
Color and ShadeExperimental 0.3 0.07
Control 0.4 0.13
ElaborationExperimental 2 0.4
Control 1.8 0.45
Table 2. Standard deviation in post-test variables for individual Torrance components of narrative andgraphic creativity for individually tested experimental and control groups.
Variable Group Mean Deviation
Narrative Fluidity Experimental 25.4 3.82Control 23.5 3.19
NarrativeFlexibility
Experimental 21.2 3.05Control 19.1 3.13
NarrativeOriginality
Experimental 15.3 3.41Control 14.5 3.07
Graphic Originality Experimental 6.1 1.92Control 5.9 2.01
Special Details Experimental 0.2 0.24Control 0.2 0.15
TitleExperimental 2.4 0.93
Control 2.3 1.12
Color and ShadeExperimental 0.3 0.07
Control 0.4 0.13
ElaborationExperimental 1.6 0.41
Control 1.7 0.42
Table 3 shows results of inferential analysis obtained from the differences following interventionsrelated to each one of the variables, namely of verbal and figurative creativity. In the first column, themean change score is presented; in the second, standard deviation; while in the third column, thesignificance of this difference is presented. In the follow-up test, the test scores of the TCTT and thePIC-J are not comparable to each other at intra-group level because they are measured on differentscales of measurement. For this reason, only the differences observed at the intergroup level areanalyzed (Table 3).
56
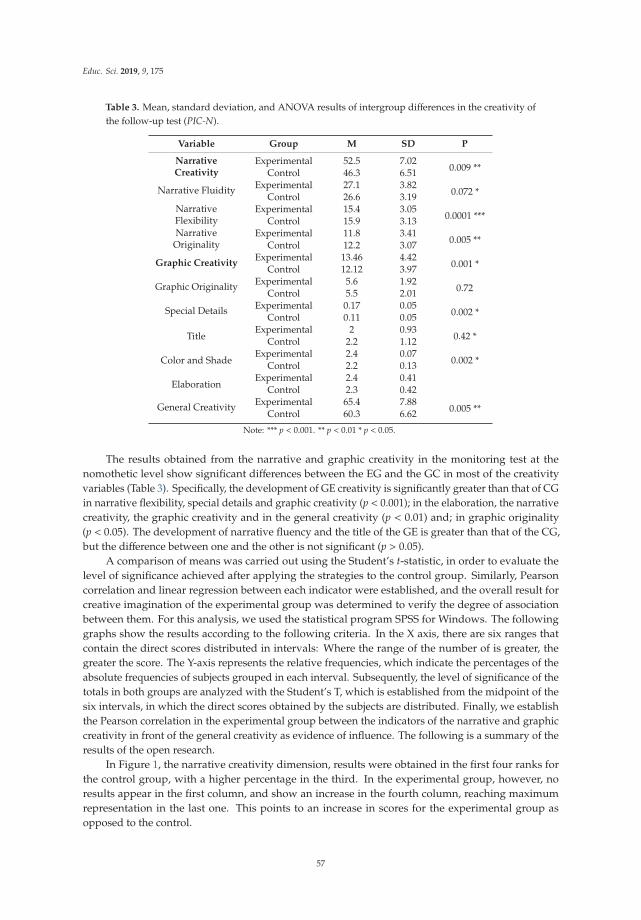
Educ. Sci. 2019, 9, 175
Table 3. Mean, standard deviation, and ANOVA results of intergroup differences in the creativity ofthe follow-up test (PIC-N).
Variable Group M SD P
NarrativeCreativity
Experimental 52.5 7.020.009 **Control 46.3 6.51
Narrative Fluidity Experimental 27.1 3.820.072 *Control 26.6 3.19
NarrativeFlexibility
Experimental 15.4 3.050.0001 ***Control 15.9 3.13
NarrativeOriginality
Experimental 11.8 3.410.005 **Control 12.2 3.07
Graphic CreativityExperimental 13.46 4.42
0.001 *Control 12.12 3.97
Graphic Originality Experimental 5.6 1.920.72Control 5.5 2.01
Special Details Experimental 0.17 0.050.002 *Control 0.11 0.05
TitleExperimental 2 0.93
0.42 *Control 2.2 1.12
Color and ShadeExperimental 2.4 0.07
0.002 *Control 2.2 0.13
ElaborationExperimental 2.4 0.41
Control 2.3 0.42
General Creativity Experimental 65.4 7.880.005 **Control 60.3 6.62
Note: *** p < 0.001. ** p < 0.01 * p < 0.05.
The results obtained from the narrative and graphic creativity in the monitoring test at thenomothetic level show significant differences between the EG and the GC in most of the creativityvariables (Table 3). Specifically, the development of GE creativity is significantly greater than that of CGin narrative flexibility, special details and graphic creativity (p < 0.001); in the elaboration, the narrativecreativity, the graphic creativity and in the general creativity (p < 0.01) and; in graphic originality(p < 0.05). The development of narrative fluency and the title of the GE is greater than that of the CG,but the difference between one and the other is not significant (p > 0.05).
A comparison of means was carried out using the Student’s t-statistic, in order to evaluate thelevel of significance achieved after applying the strategies to the control group. Similarly, Pearsoncorrelation and linear regression between each indicator were established, and the overall result forcreative imagination of the experimental group was determined to verify the degree of associationbetween them. For this analysis, we used the statistical program SPSS for Windows. The followinggraphs show the results according to the following criteria. In the X axis, there are six ranges thatcontain the direct scores distributed in intervals: Where the range of the number of is greater, thegreater the score. The Y-axis represents the relative frequencies, which indicate the percentages of theabsolute frequencies of subjects grouped in each interval. Subsequently, the level of significance of thetotals in both groups are analyzed with the Student’s T, which is established from the midpoint of thesix intervals, in which the direct scores obtained by the subjects are distributed. Finally, we establishthe Pearson correlation in the experimental group between the indicators of the narrative and graphiccreativity in front of the general creativity as evidence of influence. The following is a summary of theresults of the open research.
In Figure 1, the narrative creativity dimension, results were obtained in the first four ranks forthe control group, with a higher percentage in the third. In the experimental group, however, noresults appear in the first column, and show an increase in the fourth column, reaching maximumrepresentation in the last one. This points to an increase in scores for the experimental group asopposed to the control.
57

Educ. Sci. 2019, 9, 175
Figure 1. Narrative Creativity.
As shown in Figure 2, in the context of graphic or image-based creativity, the experimental groupachieved its highest performance in the third range, followed by in the fourth one where its highestpercentages are noted. This, as well as what we see is the fact that it obtained high percentages inthe last two columns, unlike as in the control group, shows its highest percentages in the first threecolumns, standing out in the second, and without showing results in the last two.
Figure 2. Graphic creativity (post-test).
As for general creativity (Figure 3), the control group scored in the first three ranges with theirhighest score in the third, unlike the experimental group that showed results from the second to thesixth range, but with the exception of the fifth.
Figure 3. General creativity post-test.
58
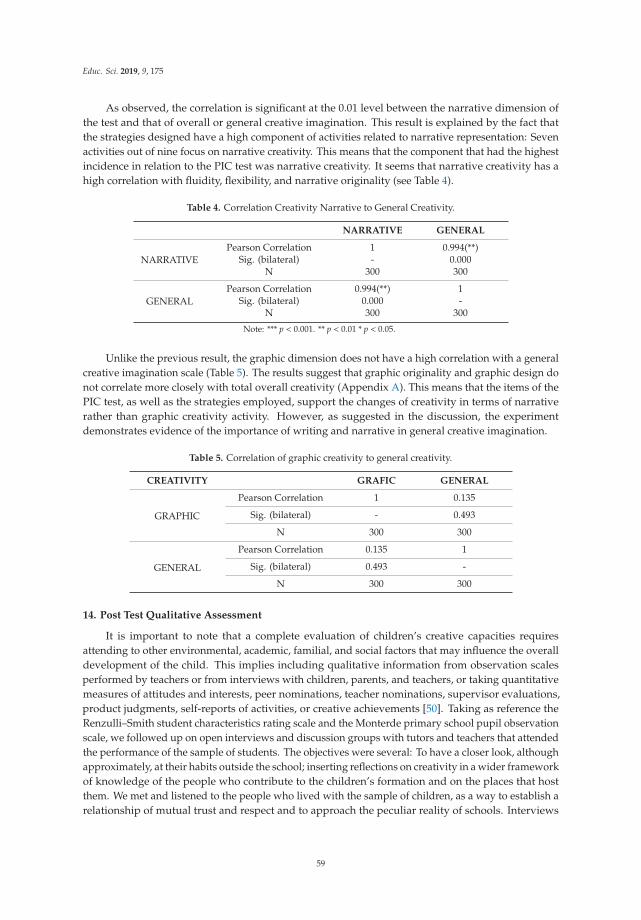
Educ. Sci. 2019, 9, 175
As observed, the correlation is significant at the 0.01 level between the narrative dimension ofthe test and that of overall or general creative imagination. This result is explained by the fact thatthe strategies designed have a high component of activities related to narrative representation: Sevenactivities out of nine focus on narrative creativity. This means that the component that had the highestincidence in relation to the PIC test was narrative creativity. It seems that narrative creativity has ahigh correlation with fluidity, flexibility, and narrative originality (see Table 4).
Table 4. Correlation Creativity Narrative to General Creativity.
NARRATIVE GENERAL
NARRATIVEPearson Correlation 1 0.994(**)
Sig. (bilateral) - 0.000N 300 300
GENERALPearson Correlation 0.994(**) 1
Sig. (bilateral) 0.000 -N 300 300
Note: *** p < 0.001. ** p < 0.01 * p < 0.05.
Unlike the previous result, the graphic dimension does not have a high correlation with a generalcreative imagination scale (Table 5). The results suggest that graphic originality and graphic design donot correlate more closely with total overall creativity (Appendix A). This means that the items of thePIC test, as well as the strategies employed, support the changes of creativity in terms of narrativerather than graphic creativity activity. However, as suggested in the discussion, the experimentdemonstrates evidence of the importance of writing and narrative in general creative imagination.
Table 5. Correlation of graphic creativity to general creativity.
CREATIVITY GRAFIC GENERAL
GRAPHIC
Pearson Correlation 1 0.135
Sig. (bilateral) - 0.493
N 300 300
GENERAL
Pearson Correlation 0.135 1
Sig. (bilateral) 0.493 -
N 300 300
14. Post Test Qualitative Assessment
It is important to note that a complete evaluation of children’s creative capacities requiresattending to other environmental, academic, familial, and social factors that may influence the overalldevelopment of the child. This implies including qualitative information from observation scalesperformed by teachers or from interviews with children, parents, and teachers, or taking quantitativemeasures of attitudes and interests, peer nominations, teacher nominations, supervisor evaluations,product judgments, self-reports of activities, or creative achievements [50]. Taking as reference theRenzulli–Smith student characteristics rating scale and the Monterde primary school pupil observationscale, we followed up on open interviews and discussion groups with tutors and teachers that attendedthe performance of the sample of students. The objectives were several: To have a closer look, althoughapproximately, at their habits outside the school; inserting reflections on creativity in a wider frameworkof knowledge of the people who contribute to the children’s formation and on the places that hostthem. We met and listened to the people who lived with the sample of children, as a way to establish arelationship of mutual trust and respect and to approach the peculiar reality of schools. Interviews
59
Educ. Sci. 2019, 9, 175
were conducted on the same school day, in which tests were applied to children, during recess or at ateacher-free time.
Tutors described boys and girls as generally restless and cheerful, and healthy in the broadestsense of the word. They defined them also as very autonomous in their daily chores. Most childrencome and go by themselves to school, are accustomed to go shopping from the age of seven, have theirgang of friends with whom they go out, and know to organize their games.
In the opinion of the tutors, the areas in which children showed more creativity are organizationof games using resources offered by the environment, the resolution of conflicts between themselves,and their crafts. The tutors agree that the environment in which they live offers endless resources forthe promotion of their creativity. This, in addition to the freedom granted by their parents, helps themto become more aware of their skills and interests. Tutors considered autonomy as a fundamentalaspect of the development of creativity. In their environment, children moved with confidence andresponsibility; outside of it, during cultural visits for example, they seemed to lose their safety andsometimes appeared disoriented. In this case, the difference between those who are accustomedto going out with the family and moving in different contexts and those who are not, were noted.In general, they do not show special fears but are cautious and respectful of the unknown. There areno evident problems of discipline. Children manifest in general self-control and respect towards theschool environment and the tutors.
The group of teachers who either attended or took care of the children reported positive attitudeand motivation after the experience generated by this research project. Regardless of the disciplinaryfield in which they are found, the after-effects of artistic education can be adjusted to all educationalprocesses. A majority of the teachers agreed that transdisciplinary performances were generallyconducive to civic and ethical education, English, mathematics, and Spanish. A second group endorsedtransdisciplinary plastic arts education for better development of precepts in civic formation and ethics,mathematics, and natural sciences. Likewise, this group of teachers expressed that they observedcreative thinking skills in their fourth-grade students, which are similar to those that formed part of theconceptual framework of our research, especially to fluidity of thinking, originality, and elaboration.The rest of the qualities stated by the teachers have little relation to the qualities that reflect creativethinking abilities addressed in the conceptual framework of this research.
Most teachers agree that creativity does not consist of the perfect use of a technique to performan artistic work, because they recognize the need of creativity to solve problems of daily life as well.Creative attitudes are often observed in students, in formats such as socializing and acquainting withnew and unpublished objects or creations, followed by indications that they relate to knowledge fromdifferent fields to express their opinion on a topic. It includes production of novel hypotheses andquestions on introductory topics, in the same way they express gracious analogies about everydaysituations. It is logical to assume that many teachers find it very difficult to drive and follow up onexperiences generating creative thinking skills in their educational plans if they themselves had nochance to experience them during their training processes in their respective training faculties, i.e., itis not enough to learn from the concept of memory or copy the characteristics of such thinking. It isnecessary to make the activity existential [44].
Only two teachers were trained in concrete subjects of education and artistic appreciation, and agreat majority are unaware that children could be educated through the creative imagination. Moreover,those who know him do not know how to do it. This awareness should lead to teachers using innovativestrategies in the classroom, and to believe in education, because children can be educated in other ways.
15. Discussion of Results
The implementation of the set of strategies confirmed the role of creative imagination in generationof intelligible narratives and a smaller degree of its presence in graphic or imagistic solutions. Whileselecting the activities that formed the strategies for the increase of the creative imagination, fourindicators were followed: Fluidity, flexibility, originality, and elaboration. Activities should involve
60

Educ. Sci. 2019, 9, 175
criteria for the strengthening of each indicator, which, as a whole, would allow development of thecreative imagination.
Children could have unique ideas that could be positively valued and could arguably providethem the confidence to freely express their ideas without the fear of being told that they are wrong.
Children who received the treatment showed receptivity and seemed to enjoy the activities.Creative imagination is a capacity that can be enhanced through the implementation of relevantstrategies. Considering that both groups were equivalent with respect to the results of the pre-test,it was clearly noticed that the experimental group, while receiving the treatment, reached significantlyhigher levels of score in general creativity. Achievement of this increment means fluidity, flexibility, andoriginality are causative factors for the process. Indicators of narrative creativity demonstrated a highcorrelation compared to general creativity. This means that narrative indicators are relevant for thestrengthening of the creative imagination. On the other hand, when originality and graphic activitiesare compared, indicators did not appear to reach superior significance levels, but demonstrated lowpositive correlations.
This result, which is still provisional, allows us to believe that despite availability of novel resourcesin direct acts of manufacture (involving things like unused machines, fantasy animals, verbal analogies,improved designs), there is no high impact of graphic or visually concomitant imagination on generalcreativity. If this result is extended to teaching scenarios in preschool and middle school children’seducation, it is possible to suggest that perhaps many graphic or drawing activities, which the teacherasks children to do, have less than expected results or are perhaps redundant in the long run.
Neither is the association of drawing directly relevant to creative imagination. These resultssuggest that creative imagination is not an act of reproduction [49,51], but a mental function that involveselaboration and styles of thought [52], and that part of concrete images, when strengthened withexternal stimuli—which, in this case, is represented by the given set of imaginative exercise—allowsproduction of something novel, something that was reflected in specific actions and involved activitiesof an analytical character like writing.
16. Conclusions
The PIC appears to be a suitable instrument for detecting variations in general creativity. The resultspoint out that not only can there be variations in specific aspects of creativity, but also that generalcreativity can be modified stochastically or otherwise, thus challenging the theoretical considerationof Ausubel et al. (1998), who proposed that multiple intrinsic or extrinsic factors, in their isolated orcombined engagements, do not have a greater incidence on creativity. Though global in its cross-culturalapplications, the proposal for incorporating imaginary worlds in children’s curricula for children inLatin American contexts, such as Bronstein or Bruner suggested, may not be an ineffectual contingency.
The results converge with some of the objectives of the research. The implementation of a programthat develops divergent thinking will favorably influence the creativity of students. It shows that acreativity development program represents an instrument for teachers and children that providestasks and materials with which to rehearse a variety of ways to express their creative potential. Theseresults also suggest that the creative imagination is not an act of representation or reproduction, but amental function that involves thought, which starts from concrete images, and is strengthened withexternal stimuli: In this case, the process is borne out in the set of imaginative strategies that allowedus to effectuate something new. The effects were reflected in specific actions that involved analyticalactivities such as writing. Finally, it should be noted that the PIC proved to be an adequate instrumentfor measurement of variations in general creativity. Even though no pedagogical adaptations havebeen made in the Mexican social context, this study offers evidence that allows its use to be relevant ineducational practice.
61
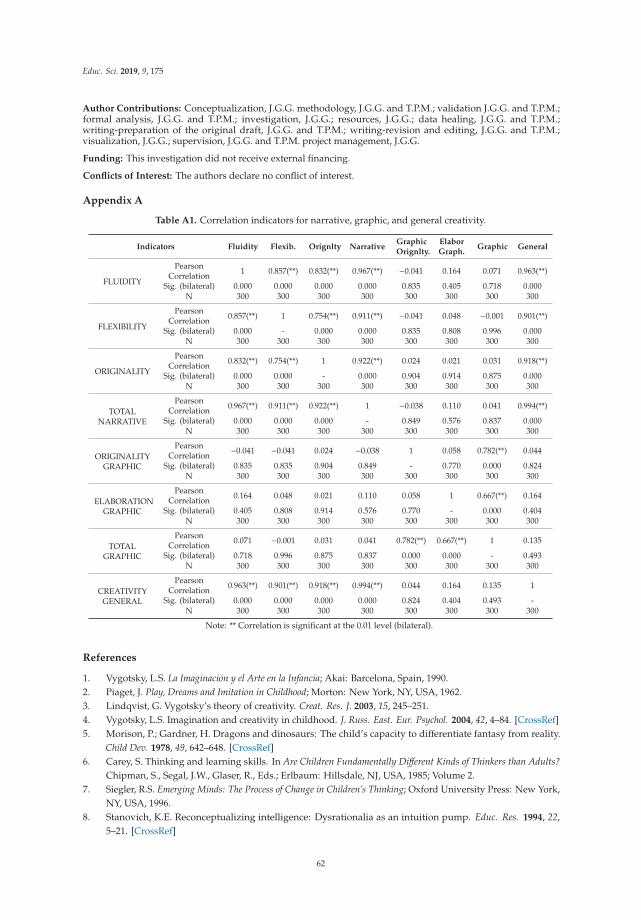
Educ. Sci. 2019, 9, 175
Author Contributions: Conceptualization, J.G.G. methodology, J.G.G. and T.P.M.; validation J.G.G. and T.P.M.;formal analysis, J.G.G. and T.P.M.; investigation, J.G.G.; resources, J.G.G.; data healing, J.G.G. and T.P.M.;writing-preparation of the original draft, J.G.G. and T.P.M.; writing-revision and editing, J.G.G. and T.P.M.;visualization, J.G.G.; supervision, J.G.G. and T.P.M. project management, J.G.G.
Funding: This investigation did not receive external financing.
Conflicts of Interest: The authors declare no conflict of interest.
Appendix A
Table A1. Correlation indicators for narrative, graphic, and general creativity.
Indicators Fluidity Flexib. Orignlty NarrativeGraphicOrignlty.
ElaborGraph.
Graphic General
FLUIDITY
PearsonCorrelation 1 0.857(**) 0.832(**) 0.967(**) −0.041 0.164 0.071 0.963(**)
Sig. (bilateral) 0.000 0.000 0.000 0.000 0.835 0.405 0.718 0.000N 300 300 300 300 300 300 300 300
FLEXIBILITY
PearsonCorrelation 0.857(**) 1 0.754(**) 0.911(**) −0.041 0.048 −0.001 0.901(**)
Sig. (bilateral) 0.000 - 0.000 0.000 0.835 0.808 0.996 0.000N 300 300 300 300 300 300 300 300
ORIGINALITY
PearsonCorrelation 0.832(**) 0.754(**) 1 0.922(**) 0.024 0.021 0.031 0.918(**)
Sig. (bilateral) 0.000 0.000 - 0.000 0.904 0.914 0.875 0.000N 300 300 300 300 300 300 300 300
TOTALNARRATIVE
PearsonCorrelation 0.967(**) 0.911(**) 0.922(**) 1 −0.038 0.110 0.041 0.994(**)
Sig. (bilateral) 0.000 0.000 0.000 - 0.849 0.576 0.837 0.000N 300 300 300 300 300 300 300 300
ORIGINALITYGRAPHIC
PearsonCorrelation −0.041 −0.041 0.024 −0.038 1 0.058 0.782(**) 0.044
Sig. (bilateral) 0.835 0.835 0.904 0.849 - 0.770 0.000 0.824N 300 300 300 300 300 300 300 300
ELABORATIONGRAPHIC
PearsonCorrelation 0.164 0.048 0.021 0.110 0.058 1 0.667(**) 0.164
Sig. (bilateral) 0.405 0.808 0.914 0.576 0.770 - 0.000 0.404N 300 300 300 300 300 300 300 300
TOTALGRAPHIC
PearsonCorrelation 0.071 −0.001 0.031 0.041 0.782(**) 0.667(**) 1 0.135
Sig. (bilateral) 0.718 0.996 0.875 0.837 0.000 0.000 - 0.493N 300 300 300 300 300 300 300 300
CREATIVITYGENERAL
PearsonCorrelation 0.963(**) 0.901(**) 0.918(**) 0.994(**) 0.044 0.164 0.135 1
Sig. (bilateral) 0.000 0.000 0.000 0.000 0.824 0.404 0.493 -N 300 300 300 300 300 300 300 300
Note: ** Correlation is significant at the 0.01 level (bilateral).
References
1. Vygotsky, L.S. La Imaginación y el Arte en la Infancia; Akai: Barcelona, Spain, 1990.2. Piaget, J. Play, Dreams and Imitation in Childhood; Morton: New York, NY, USA, 1962.3. Lindqvist, G. Vygotsky’s theory of creativity. Creat. Res. J. 2003, 15, 245–251.4. Vygotsky, L.S. Imagination and creativity in childhood. J. Russ. East. Eur. Psychol. 2004, 42, 4–84. [CrossRef]5. Morison, P.; Gardner, H. Dragons and dinosaurs: The child’s capacity to differentiate fantasy from reality.
Child Dev. 1978, 49, 642–648. [CrossRef]6. Carey, S. Thinking and learning skills. In Are Children Fundamentally Different Kinds of Thinkers than Adults?
Chipman, S., Segal, J.W., Glaser, R., Eds.; Erlbaum: Hillsdale, NJ, USA, 1985; Volume 2.7. Siegler, R.S. Emerging Minds: The Process of Change in Children’s Thinking; Oxford University Press: New York,
NY, USA, 1996.8. Stanovich, K.E. Reconceptualizing intelligence: Dysrationalia as an intuition pump. Educ. Res. 1994, 22,
5–21. [CrossRef]
62

Educ. Sci. 2019, 9, 175
9. Singer, D.G.; Singer, J.L. The House of Make-Believe: Children’s Play and the Developing Imagination; HarvardUniversity Press: Cambridge, MA, USA, 1990.
10. Egan, K. Fantasía e Imaginación: Su Poder en la Enseñanza; MEC y Morata: Madrid, Spain, 1994.11. Vygotsky, L.S. El Desarrollo de Los Procesos Psicológicos Superiors; Crítica: Barcelona, Spain, 1989.12. Hocevar, D. Measurement of creativity: Review and critique. J. Personal. Assess. 1981, 45, 450–464. [CrossRef]13. Baer, J.; McKool, S.S. Assessing creativity using the consensual assessment technique. In Handbook of Research
on Assessment Technologies, Methods, and Applications in Higher Education; IGI Global: Hershey, PA, USA, 2009;pp. 65–77.
14. Ausubel, D.P. Schemata, cognitive structure, and advance organizers: A reply to Anderson, Spiro, andAnderson. Am. Educ. Res. J. 1980, 17, 400–404. [CrossRef]
15. May, R. Creativity and encounter. Am. J. Psychoanal. 1964, 24, 39–43. [CrossRef]16. Gilhooly, K.J.; Georgiou, G.; Devery, U. Incubation and creativity: Do something different. Think. Reason.
2013, 19, 137–149. [CrossRef]17. Wikander, L.; Gustafsson, C.; Riis, U. (Eds.) Enlightenment, Creativity and Education: Polities, Politics,
Performances; Springer Science & Business Media: New York, NY, USA, 2012; Volume 19.18. Silvia, P.J.; Wigert, B.; Reiter-Plamon, R.; Kaufman, J.C. Assessing creativity with self-report scales: A review
and empirical evaluation. Psychol. Aesthet. Creat. Arts 2012, 6, 19–34. [CrossRef]19. Guilford, J.P. Creativity. Am. Psychol. 1950, 5, 444–445. [CrossRef]20. Torrance, E.P. The nature of creativity as manifest in its testing. In The Nature of Creativity: Contemporary
Psychological Perspectives; Cambridge University Press: New York, NY, USA, 1988; pp. 43–75.21. Lee, Y.J. Effects of Divergent Thinking Training/Instructions on Torrance Tests of Creative Thinking and
Creative Performance. Ph.D. Thesis, University of Tennessee, Knoxville, TN, USA, 2004.22. De La Torre, T. Los cuatro puntos cardinales en la evaluación de la creatividad. In Comprender y Evaluar la
Creatividad; Ediciones Aljibe: Málaga, Spain, 2006; pp. 143–154.23. López-Martínez, O.; Navarro-Lozano, J. Creatividad e inteligencia: Un estudio en educación primaria.
Rev. Investig. Educ. 2010, 28, 283–296.24. Kaufman, J.C. Counting the muses: Development of the kaufman domains of creativity scale (K-DOCS).
Psychol. Aesthet. Creat. Arts 2012, 6, 298–308. [CrossRef]25. Csikszentmihalyi, M. Sociedad, cultura y persona: Una perspectiva sistémica de la creatividad. In La
Naturaleza de la Creatividad; Sternberg, R.J., Ed.; Cambridge University Press: New York, NY, USA, 1988.26. Mccraken, J.R. Design—The creative soul of technology. Essent. Top. Technol. Educ. 2009, 1001, 69–73.27. Feist, G.J. The influence of personality on artistic and scientific creativity. In Handbook of Creativity; Cambridge
University Press: New York, NY, USA, 1999; Volume 14, p. 273.28. Kauffman, J.C.; Beghetto, R.A. Beyond big and little: The four C model of creativity. Rev. Gen. Psychol. 2009,
13, 1–12. [CrossRef]29. Sternberg, R.J.; Lubart, T.I. Desafiando a la Multitud: Cultivar la Creatividad en una Cultura de la Conformidad;
Free Press: New York, NY, USA, 1995.30. Amabile, T.M. Creativity and Innovation in Organizations; Harvard Business School: Cambridge, MA, USA,
1996.31. Baer, J.; Kaufman, J.C. Bridging generality and specificity: The amusement park theoretical (APT) model of
creativity. Roeper Rev. 2005, 27, 158–163. [CrossRef]32. Finke, R.A.; Ward, T.B.; Smith, S.M. Creative Cognition: Theory, Research and Applications, 1st ed.; MIT Press:
Cambridge, MA, USA, 1996.33. Sternberg, R. Assessment of gifted student a new millennium. Learn. Individ. Differ. 2010, 20, 327–336.
[CrossRef]34. Runco, M.A. Divergent thinking, creativity, and giftedness. Gift. Child Q. 1993, 37, 16–22. [CrossRef]35. Torrance, E.P. Torrance Tests of Creative Thinking: Norms-Technical Manual: Verbal Tests, Forms A and B: Figural
Tests, Forms A and B; Personal Press Incorporated: Wichita, KS, USA, 1966.36. Torrance, E.P. Research Review for the Torrance test of Creative Thinking Figural and Verbal Forms A and B;
Scholastic Testing Service: Bensenville, IL, USA, 2008.37. Guilford, J.P. The Nature of Human Intelligence; Mc Graw Hill: New York, NY, USA, 1967.38. Lubart, T. Creativity from a Cognitive Developmental Science Perspective. Available online: http://csjarchive.
cogsci.rpi.edu/ (accessed on 15 August 2017).
63

Educ. Sci. 2019, 9, 175
39. Davis, G.A. Testing for creative potential. Contemp. Educ. Psychol. 1989, 14, 257–274. [CrossRef]40. Wechsler, S.M.; Vendramini, C.M.M.; Oakland, T. Thinking and creative styles: A validity study. Creat. Res. J.
2012, 24, 235–242. [CrossRef]41. Plucker, J.A. Is the proof in the pudding? Reanalyses of Torrance’s (1958 to present) longitudinal data.
Creat. Res. J. 1999, 12, 103–114. [CrossRef]42. Bloom, B.S.; Sosniak, L.A. Developing Talent in Young People; Ballantine Books: New York, NY, USA, 1985.43. Escobedo, P.A.S.; Mendoza, A.G.; Cuervo, A.A.V. Validez y confiabilidad de un instrumento para medir la
creatividad en adolescentes. Rev. Iberoam. Educ. 2009, 50, 1–12.44. Olveira, E.; Ferranndiz, C.; Ferrando, M.; Sainz, M.; Prieto, M. Test de pensamiento creativo de torrance (ttct):
Elementos para la validez de constructo en adolescentes portugueses. Psicothema 2009, 21, 562–567.45. Soto, B.I.C.; Ramirez, F.Z.; Tomasini, G.A. ¿Quiénes son los alumnos con aptitud sobresaliente? Análisis de
diversas variables para su identificación/who are students with outstanding ability? Analysis of differentvariables for identification. Actual. Investig. Educ. 2014, 14, 479–511.
46. Zacatelco, F.; Chavez, B.I.; Gonzalez, A.; Acle, G. Validez de una prueba de creatividad: Estudio en unamuestra de estudiantes mexicanos de educación primaria. Rev. Intercont. Psicol. Educ. 2013, 15, 141–155.
47. Lopez-Martin, O.; Navarro-Lozano, J. Influencia de una metodología creativa en el aula de primaria. Eur.J. Educ. Psychol. 2010, 3, 89–102. Available online: http://www.redalyc.org/articulo.oa?id=129313736007(accessed on 6 September 2017). [CrossRef]
48. Perez, V.H.; Ávila, F. La unificación de criterios en torno a la medición del constructo creativo. Cienc.Empresariales 2014, 23, 16–28.
49. Artola, T.; Barraca, J. Creatividad e imaginación. Un nuevo instrumento de medida: La PIC. EduPsykhé 2004,3, 73–93.
50. Zeng, Y. Environment-based design (EBD). In Proceedings of the ASME 2011 International Design EngineeringTechnical Conferences and Computers and Information in Engineering Conference, Washington, DC, USA,28–31 August 2011; Volume 54860, pp. 237–250.
51. Menchen, F. Atrévete a ser creativo: Pasos para ser creativos. Rev. Iberoam. Sobre Calid. Efic. Cambio Educ.2012, 10, 249–263.
52. Sternberg, R.J.; Grigorenko, E.L. Are cognitive styles still in style? Am. Psychol. 1997, 52, 700–712. [CrossRef]
© 2019 by the authors. Licensee MDPI, Basel, Switzerland. This article is an open accessarticle distributed under the terms and conditions of the Creative Commons Attribution(CC BY) license (http://creativecommons.org/licenses/by/4.0/).
64

education sciences
Article
Fundamental Issues of Concept Mapping Relevant toDiscipline-Based Education: A Perspective ofManufacturing Engineering
AMM Sharif Ullah
Faculty of Engineering, Kitami Institute of Technology, 165 Koen-cho, Kitami 090-8507, Japan;[email protected]
Received: 27 July 2019; Accepted: 26 August 2019; Published: 29 August 2019
Abstract: This article addresses some fundamental issues of concept mapping relevant todiscipline-based education. The focus is on manufacturing knowledge representation from theviewpoints of both human and machine learning. The concept of new-generation manufacturing(Industry 4.0, smart manufacturing, and connected factory) necessitates learning factory (humanlearning) and human-cyber-physical systems (machine learning). Both learning factory andhuman-cyber-physical systems require semantic web-embedded dynamic knowledge bases, which aresubjected to syntax (machine-to-machine communication), semantics (the meaning of the contents),and pragmatics (the preferences of individuals involved). This article argues that knowledge-awareconcept mapping is a solution to create and analyze the semantic web-embedded dynamic knowledgebases for both human and machine learning. Accordingly, this article defines five types of knowledge,namely, analytic a priori knowledge, synthetic a priori knowledge, synthetic a posteriori knowledge,meaningful knowledge, and skeptic knowledge. These types of knowledge help find some rulesand guidelines to create and analyze concept maps for the purposes human and machine learning.The presence of these types of knowledge is elucidated using a real-life manufacturing knowledgerepresentation case. Their implications in learning manufacturing knowledge are also described.The outcomes of this article help install knowledge-aware concept maps for discipline-based education.
Keywords: concept map; learning; semantic web; knowledge representation; epistemology
1. Introduction
This article addresses some fundamental issues regarding concept mapping for discipline-basededucation. The focus is on manufacturing knowledge representation from the viewpoints of bothhuman and machine learning, and the context is new-generation manufacturing (Industry 4.0, smartmanufacturing, and connected factory).
Many authors have studied about how to learn science- and engineering-based subject mattersin the early stage of formal education. Accordingly, it has been found that not only knowing abouta subject matter, but also doing about it (arguing about scientific theories and findings, suggestingplausible solutions, and so on) can enhance learning [1–7]. This kind of education (knowing anddoing simultaneously) requires integration between theoretical and real worlds following threephases, namely, investigating, evaluating, and developing explanations and solutions. As a result,the learning must be driven by the following activities: (1) Asking questions and defining problems,(2) developing and using models, (3) planning and carrying out investigations, (4) analyzing andinterpreting data, (5) using mathematics and computational thinking, (6) constructing explanationsand designing solutions, (7) engaging in argument from evidence, and (8) obtaining, evaluating,and communicating information [8]. Having said that, it might not be true that all learners are freefrom misconceptions [9–12]. Some efforts are required to help learners overcome misconceptions.
Educ. Sci. 2019, 9, 228; doi:10.3390/educsci9030228 www.mdpi.com/journal/education65

Educ. Sci. 2019, 9, 228
When a learner continues her/his science- and engineering-based education at the tertiary level, theabovementioned duality (knower–doer) intensifies due to some predefined educational objectives andoutcomes (e.g., the educational objectives and outcomes of the Accreditation Board for Engineeringand Technology (ABET) [13]).
Regardless of the level of formal education (school, undergraduate, or graduate level), somemotivating factors drive an individual to become a knower and doer simultaneously. The authorbelieves that two of the motivating factors are metacognition and meaningful learning. Metacognition(thinking about thinking) is a higher-order human cognition that allows individuals to monitor andredirect their thinking processes as needed [14,15]. Meaningful learning is perhaps a manifestation ofmetacognition that emotionally attaches an individual to a learning process, resulting in a concept map(a network of concepts) [16–20]. A remarkable feature of meaningful learning is that it integrates newconcepts with existing ones.
Concept map-based education has earned a great deal of attention [20–25]. It has spreadup to discipline-based education, including manufacturing engineering education [25]. As far asmanufacturing engineering education is concerned, concept map-based learning is significant from theviewpoints of both human and machine learning. The significance of concept maps from the viewpointof human learning in manufacturing evolves due to the advent of learning factory [26–28], whereas thesignificance of concept maps in manufacturing from the viewpoint of machine learning evolves dueto the advent of new-generation manufacturing systems [29–31]. Thus, as far as the advancement ofdigital manufacturing is concerned, the construction process of concept maps has become an importantissue. A few authors have researched the construction process of concept maps in general. Someof the noteworthy processes are as follows: Semantic gravity-driven concept mapping [21], process,material, automation, and shape universe-based concept mapping [25], focus-question-based conceptmapping [32], and weighted concept induction-based concept mapping [33]. The remarkable thingis that the contents of a concept map (intended for human or machine learning) boil down to somepropositions. These propositions can be categorized into some types of knowledge [21,31]. Therefore,knowledge-type-aware concept mapping is one of the effective processes of constructing concept maps.For this perspective, this article is written.
Accordingly, this article aims to provide more insights into the general categorization of knowledgeand its representation using concept maps from the perspectives of manufacturing engineeringeducation. Therefore, this article must describe the fundamental issues of manufacturing engineeringknowledge and its ICT-based representation from the perspectives of human and machine learning. Itmust define the knowledge types from a domain-neutral perspective (i.e., epistemology). Lastly, itmust elucidate how to accommodate the knowledge types into the learning activities in manufacturingengineering education through the formation of concept maps. Therefore, the rest of this articleis organized as follows. Section 2 presents the fundamental issue underlying concept mapping inmanufacturing engineering. Section 3 provides a knowledge classification method for organizing themanufacturing engineering-relevant contents for concept mapping. Section 4 analyzes a manufacturingengineering-relevant concept map using the proposed knowledge classification. Section 5 concludesthis study.
2. Fundamental Issues Regarding Manufacturing Knowledge Representation
The previous section states that concept mapping in manufacturing is significant from both humanand machine learning perspectives. The significance in terms of human learning evolves due to theadvent of a concept called learning factory [26–28], whereas the significance in terms of machinelearning evolves due to the advent of a concept called new-generation manufacturing systems [29–31].On the other hand, the concept of learning factory is heavily linked to the concept of new-generationmanufacturing systems. Thus, before eliciting the fundamental issues of manufacturing knowledgerepresentation using concept maps, the relevant aspects of new-generation manufacturing systems
66

Educ. Sci. 2019, 9, 228
must be elucidated. Accordingly, this section presents some of the fundamental issues relevant toknowledge representation that center around new-generation manufacturing systems.
Manufacturing (or production) systems have continuously been evolving under the influence ofinformation and communication technology. As a result, a concept of new-generation manufacturingsystems has been evolved, which is referred to as Industry 4.0, smart manufacturing, connectedfactory, Society 5.0, Made in China 2025, and alike [26–31,34–40]. The primary goal is to achieve anactive collaboration among hardware devices (e.g., machine tools, robots, measuring instruments),software systems (CAD/CAM, ERP, and SCM systems), and human resources on a real-time basisby exchanging the required data, information, and knowledge [34–40]. For achieving this goal, aset of relevant technologies has been introduced, namely, human-cyber-physical systems, digitaltwins, and the Internet of things [26–31,34–40]. Numerous authors have studied these technologies.For example, Zheng et al. [31] reviewed Industry 4.0 and provided a system architecture wherethe data intensiveness of design, monitoring, machining, control, and scheduling are classified intofour layers—namely, sensor and actuator deployment, data collection, big data analysis, and bigdata-driven decision-making. The layers are organized in the order of edge (where an activity occurs),fog (cyber-physical-human-integrated systems), and cloud (an ICT infrastructure for collecting anddisseminating information from/to a wide range of stakeholders). Koren et al. [34] described howto modify the reconfigurable manufacturing systems in order to accommodate the functionalities ofIndustry 4.0 [29,32]. They have emphasized that the human-cyber-physical systems or the systems thatreside in the fog (the mid-wear between edges and cloud) must be populated with the contents calleddigital twin (computable virtual abstraction of real objects, processes, and phenomena). Ullah [30,38]and Ghosh et al. [40] described that there are three kinds of digital twins, namely, object twin,process twin, and phenomenon twin. Among these twins, phenomenon twin is the most challengingtwin to construct because the construction of phenomenon needs stochastic dynamical systems-basedformulation and user-defined technique to capture the dynamics of the underlying phenomenon [38,40].However, Industry 4.0 or smart manufacturing is perhaps in its infancy. A great deal of researchlies ahead. For example, what the best architecture of new-generation manufacturing systemsshould be is not known yet. Some authors consider that network-based architecture is suitable forsmart manufacturing [41]. Other authors consider that hierarchical architecture is suitable for smartmanufacturing [42]. Some authors consider that a shift to system modeling-centric activities from(current) document meeting-centric activities is needed for smart manufacturing from both syntax [43]and semantic [44] viewpoints. Some authors consider that manufacturing decision-relevant data,information, and knowledge must be organized using bio-inspired computational frameworks formachine learning [40–45]. From the human learning viewpoint, on the other hand, manufacturingengineering-relevant educational contents can be organized in ABET-centric means [46] or othere-learning-centric means [47,48]. No matter the intended use (machine learning or human learning), orthe level of sophistication (data, information, model, knowledge, simulation, and digital twin), themanufacturing engineering-relevant contents must be represented by concept maps. The reason isas follows.
Consider the evolution of web technology [49,50], as schematically illustrated in Figure 1. As seenin Figure 1, the evolution of web technology entails two dimensions. One of the dimensions issocialization, and the other is semantics (meaning of the contents). At the initial stage of webtechnology (Web 1.0), the communication was mainly one-way, where the users could only read thecontents available on the web through the Internet. The next era (Web 2.0) materialized two-waycommunication, adding a functionality called writing on top of reading. This era dominates currentweb-based practices. The degree of socialization and semantics in these two eras has been limited.In order to increase this degree, the semantics of the contents must be increased. This leads to aconcept called the semantic web [49]. Centering this new technology (semantic web), the web hasbeen transforming into a new era called Web 3.0/4.0 [50]. The ultimate goal is to materialize personalintelligent devices. To achieve this, the contents originated in different information silos (e.g., big-data
67

Educ. Sci. 2019, 9, 228
coming from different domains) must be integrated. The integration requires “meaning base” of apiece of content on top of the content itself. As a result, ontology-driven data structures of contentpreparation for the semantic web has evolved [51]. Thus, new-generation manufacturing is movingtoward an era where the content preparation points out a scenario, as shown in Figure 2. As seen inFigure 2, in the era of Web 3.0/4.0, the manufacturing contents (i.e., different types of experimental andsensor data, models of products, machine tools, cutting tools, manufacturing processes, scheduling,and models of different manufacturing phenomena) will incorporate both the contents (syntax) andtheir meaning (semantics). The current trend shows that a user-defined description of the meaningof the content must be incorporated along with the content itself [25,26,30,40,45,52]. The descriptionis inclined more toward user-defined linguistic expressions (soft) than toward predefined ontology(hard). This softness in expressing semantics leads to concept map-oriented content preparation. Thismeans that for new-generation manufacturing, concept mapping [19–21,32] becomes a default choice,no matter the content type of contents (model, data, knowledge, and alike) [25,26,30,40].
Sem
antic
s
Socialization
New-generation manufacturing
Figure 1. Evolution of web and new-generation manufacturing.
Figure 2. Manufacturing knowledge representation in the era of semantic web.
Apart from the issue of concept map-based content preparation for new-generation manufacturing,it (new-generation manufacturing) entails some other fundamental issues because the systems involvedin new-generation manufacturing are supposed to operate as open systems. As such, independent
68

Educ. Sci. 2019, 9, 228
domains might be linked as an ad hoc basis. As a result, the contents originated at unknown sourcescan be shared for reuse. At the same time, the contents might be altered without prior notification.This incorporates one more issue, called pragmatics [45], with syntax and semantics, as schematicallyillustrated in Figure 3. The contents relevant to syntax mean codified contents for machine-to-machine(M2M) communication; the contents relevant to semantics mean what does the content mean to thestakeholders. The contents relevant to pragmatics, on the other hand, must ensure that whether ornot the contents are trustworthy to put into action. For the sake of better understanding, the conceptof pragmatics is shown along with syntax, which are schematically illustrated in Figure 4 using anarbitrary example (i.e., the example of flower). Thus, manufacturing system developers must considerthese three aspects while preparing the contents using semantic web-embedded concept maps. Now,one of the ways to tackle pragmatics, along with syntax and semantics, is to rely on the epistemicnature of the contents. This leads to a knowledge-type-aware concept map construction process. Beforedescribing the general process of a knowledge-type-aware concept map construction process, theepistemic classification of knowledge and their origin must be articulated. This issue is described inthe following section.
Figure 3. Fundamental aspects of content sharing in new-generation manufacturing.
Figure 4. The concept of pragmatics, along with syntax and semantics.
3. Epistemic Classification of Knowledge
In general, a piece of knowledge is a proposition that is “justified true belief”. Notably, a pieceof knowledge means facts, principles, theories, and practices that are accumulated by learning; bothcognitive reflections and direct experiences of individuals or groups can contribute to articulate apiece of knowledge [26]. Numerous authors have classified knowledge in different ways. Fromthe viewpoint of an organization, knowledge is categorized into two categories, explicit knowledgeand tacit knowledge [53,54]. Explicit knowledge can be formally represented for reuse, whereastacit knowledge cannot be represented explicitly, because it is in possession of an individual or agroup of individuals working in an organization (e.g., the skill to operate a machine tool). Based onsemantic gravidity, knowledge can be classified into four types, namely, novice knowledge, theoreticalknowledge, practical knowledge, and professional knowledge [21]. However, the author believesthat epistemology (the branch of philosophy that deals with the origin and nature of knowledge) [55]is perhaps the best inspiration for classifying knowledge. Immanuel Kant [56] proposed one of the
69

Educ. Sci. 2019, 9, 228
well-recognized epistemic classifications of knowledge. Kant considered both idealistic and realisticarguments of knowledge formation and proposed that there are three main types of knowledge, namely,analytic a priori, synthetic a priori, and synthetic a posteriori knowledge, as schematically illustratedin Figure 5. Analytic a priori knowledge means the knowledge gained by defining things (e.g., allbachelors are unmarried males; a triangle has three sides; feed rate is the velocity at which a cuttingtool is advanced against the workpiece; and alike). Thus, analytic a priori knowledge is always true(i.e., tautology). On the other hand, synthetic a priori knowledge is the knowledge that is gainedby using a mathematical deduction. Some of the examples of synthetic a priori knowledge are asfollows: 7 + 4 = 11; p = the summation of included angles of a triangle is equal to 180◦; the theoreticalmaximum surface roughness height of a turned surface is given as Rt = 125
(f 2/rε
)μm, where f is the
feed rate (mm/rev) and rε nose radius (mm) of the cutting tool; and alike. Synthetic a priori knowledgeis true within the relevant context. For example, p is true when the triangle is drawn on a plannersurface, not on a curved surface. The same argument is valid for Rt = 125
(f 2/rε
)μm, i.e., it is true
only when the relevant assumptions are obeyed. The other Kantian category of knowledge is calledsynthetic a posteriori knowledge. This category of knowledge evolves from real-world experience (orexperimentation) (e.g., bachelors are rich; an apple is good for health; the feed force is less than thecutting force; and alike). As a result, synthetic a posteriori knowledge can be proven true, partiallytrue, partially false, and even false, i.e., it is true for a stakeholder but may not necessarily be true forothers (i.e., it is a matter of fact).
Figure 5. A knowledge continuum.
However, Kantian knowledge is based on the fact that a human being is primarily a knower, asshown in Figure 5. As mentioned in the first section of this article, a human being can be a knowerand doer at the same time. In the doer mode, a human being remains pragmatic and gives priorityto her/his preferences and judgment, even though everything is not clearly known in terms of otherforms of knowledge. The knowledge gained in pragmatic mode can be of two types. One of thetypes evolves in the analytic mode. It is referred to as meaningful knowledge as if it is the outcome ofmeaningful learning. It thus injects new concepts, as it is the result of an individual’s preference: “Itseems to me that . . . .” For example, consider the following proposition: “A cutting tool having an ovalcross-sectional area performs better than a cutting tool having a circular cross-sectional area whileremoving material around sharps corner of a workpiece in milling.” This is an outcome of meaningfullearning because it injects a new cutting tool (oval-shaped tool) to solve a problem (remove material inthe sharp corners of a workpiece). This proposition cannot be proven true or false until there is a pieceof supportive synthetic a priori or synthetic a posteriori knowledge available. As far as manufacturingis concerned, this type of knowledge can dominate other types of knowledge. The other type of
70
Educ. Sci. 2019, 9, 228
knowledge in doer mode is defined as skeptic knowledge. It evolves in the synthetic mode. It may ormay not inject new concepts. It is directly related to other types of knowledge. Skeptic knowledgeoften leads learners to ponder a course of action to study further. Thus, it is somehow linked toother types of knowledge; that is, it is a purposeful interpretation of an individual based on otheravailable pieces of knowledge. For example, consider the following proposition: “Reduce feed rate toensure a better surface finish.” It is a piece of skeptic knowledge and helps take a course of action (e.g.,optimize a material removal process), even though the rationale is somewhat informal. However, whenskeptic knowledge is directly related to a piece of meaningful knowledge, the skepticism regarding it(meaningful knowledge) manifests the skepticism regarding skeptic knowledge. At the same time, itfollows other concept maps as a part of further study regarding the subject matter. It means that skepticknowledge acts as a tool for enhancing meaningful learning among learners. This is exemplified in thenext section.
Nevertheless, other than the analytic a priori knowledge, all the types of knowledge mentionedabove can be proven false. This means that a learner, either a human being or a machine, can set astrategy to verify or validate whether or not a given piece of knowledge is true before using it. Thestrategy will depend on the type of knowledge. For example, if the type of knowledge is synthetica priori, the learner is supposed to find out the deductive steps and relevant definitions (analytic apriori knowledge) to determine the truthfulness of it. If the type of knowledge is synthetic a posteriori,the learner is supposed to find out the rationales and integrity of the relevant experimental results orexperience to determine the truthfulness of it. If the type of knowledge is meaningful knowledge, thenthe learner must identify the innovative process that leads to the conclusion (meaningful knowledge)or identify the analytical or experimental processes that lead to the meaningful knowledge. If thetype of knowledge is skeptic knowledge, then the learner must extract the pieces of relevant pieces ofbackground knowledge (analytical a priori, systematic a priori, synthetic a posteriori, or meaningfulknowledge) that helped the knowledge formulator to conceive the skeptic knowledge for taking actions.
4. Concept Map Creation and Analysis
Having described the fundamental issues and types of knowledge, it is time to create and analyzea concept map containing manufacturing engineering contents.
It is worth mentioning that many authors have studied subject matter-based educational needsand relevant ICT infrastructures from the viewpoint of new-generation manufacturing [25,46,57–60].Some authors have emphasized a particular type of knowledge structure and its transformation [61]for the sake of active learning and teaching. Some authors have emphasized concept map-basedcontent preparation [25] for enhancing meaningful learning in manufacturing [16–21]. In addition,many concept maps carrying both theoretical and empirical knowledge of manufacturing can befound in [25,30,31,40]. Some of them are for human learning [25], and some of them are for machinelearning [30,31].
However, the concept map-based learning performances of some undergraduate engineeringstudents have been reported in [25]. One of the remarks made by the learners is about the size ofthe concept map (large size makes the content less attractive and cumbersome). Another importantobservation made by the learners is that some of the concepts are controversial, and, thereby, difficultto comprehend, even though excellent illustrations and references are embedded in the conceptmaps. As a result, the central theme of meaningful learning (avoiding memorization [16–21]) getsaffected. The root cause of this is perhaps the presence of synthetic a posteriori knowledge, meaningfulknowledge, and skeptic knowledge in the concept map. This means that some of the conceptsmay appear to be analytic a priori, but they are meaningful knowledge or even skeptic knowledge.In this case, the instructor may put more effort into explaining these pieces of knowledge so thatthe learners avoid memorization or seek other reference materials to grasp the real meaning orcounterexamples. As a result, knowledge-aware concept mapping can make the maps systematic and
71
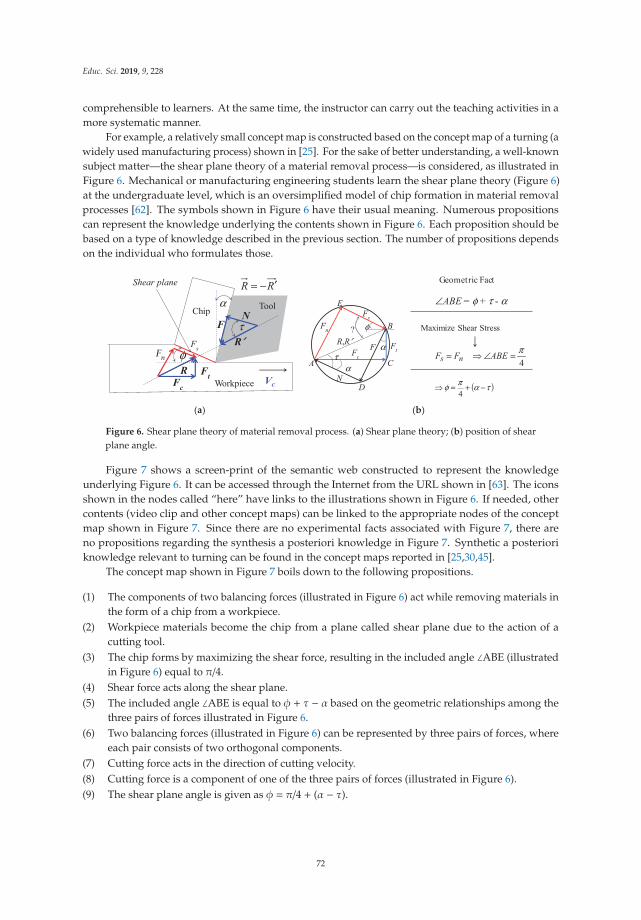
Educ. Sci. 2019, 9, 228
comprehensible to learners. At the same time, the instructor can carry out the teaching activities in amore systematic manner.
For example, a relatively small concept map is constructed based on the concept map of a turning (awidely used manufacturing process) shown in [25]. For the sake of better understanding, a well-knownsubject matter—the shear plane theory of a material removal process—is considered, as illustrated inFigure 6. Mechanical or manufacturing engineering students learn the shear plane theory (Figure 6)at the undergraduate level, which is an oversimplified model of chip formation in material removalprocesses [62]. The symbols shown in Figure 6 have their usual meaning. Numerous propositionscan represent the knowledge underlying the contents shown in Figure 6. Each proposition should bebased on a type of knowledge described in the previous section. The number of propositions dependson the individual who formulates those.
(a) (b)
R
R′F
N
FcFt Vc
τ
RR ′−=α
φ
Shear plane
FsFn
Fn
Fs
F
N
Fc
Ft
A
B
C
D
E
R R′φ
τα
α
∠ABE φ τ α
π=∠= ABEFF ns
( )ταπφ −+=
Figure 6. Shear plane theory of material removal process. (a) Shear plane theory; (b) position of shearplane angle.
Figure 7 shows a screen-print of the semantic web constructed to represent the knowledgeunderlying Figure 6. It can be accessed through the Internet from the URL shown in [63]. The iconsshown in the nodes called “here” have links to the illustrations shown in Figure 6. If needed, othercontents (video clip and other concept maps) can be linked to the appropriate nodes of the conceptmap shown in Figure 7. Since there are no experimental facts associated with Figure 7, there areno propositions regarding the synthesis a posteriori knowledge in Figure 7. Synthetic a posterioriknowledge relevant to turning can be found in the concept maps reported in [25,30,45].
The concept map shown in Figure 7 boils down to the following propositions.
(1) The components of two balancing forces (illustrated in Figure 6) act while removing materials inthe form of a chip from a workpiece.
(2) Workpiece materials become the chip from a plane called shear plane due to the action of acutting tool.
(3) The chip forms by maximizing the shear force, resulting in the included angle ∠ABE (illustratedin Figure 6) equal to π/4.
(4) Shear force acts along the shear plane.(5) The included angle ∠ABE is equal to φ + τ − α based on the geometric relationships among the
three pairs of forces illustrated in Figure 6.(6) Two balancing forces (illustrated in Figure 6) can be represented by three pairs of forces, where
each pair consists of two orthogonal components.(7) Cutting force acts in the direction of cutting velocity.(8) Cutting force is a component of one of the three pairs of forces (illustrated in Figure 6).(9) The shear plane angle is given as φ = π/4 + (α − τ).
72

Educ. Sci. 2019, 9, 228
′
Figure 7. Print-screen of a semantic web-embedded concept map.
Consider the first proposition: The components of two balancing forces (illustrated in Figure 6)act while removing materials in the form of the chip from a workpiece. It is a piece of synthetic a prioriknowledge because it comes from a mathematical deduction that two forces must act along a line butin the opposite directions to maintain a balance. This is true because the external forces acting on theworkpiece makes a static balance; otherwise, the workpiece may move out from the holding devices.
Consider the second statement: Workpiece materials become the chip from a plane called shearplane due to the action of a cutting tool. This proposition is a sophisticated form of knowledge becauseit entails two forms of knowledge, namely, analytic a priori knowledge and meaningful knowledge. Ifthe proposition is rewritten using two propositions, then this duality of knowledge can be understood.For example, consider the following two propositions: (2-1) Workpiece materials become the chip dueto the action of a cutting tool; and (2-2) Workpiece materials become the chip from a plane called shearplane. Proposition 2-1 is a piece of analytic a priori knowledge because it just defines the manufacturingprocess (chip formation is necessary for achieving material removal in machining), as well the roleof a cutting tool. On the other hand, the other proposition (proposition 2-2) is a piece of meaningfulknowledge. The reason is that one has considered this concept (shear plane) to explain chip formation.Chip formation can occur from a region (not a plane) [62]. This means that the idea of the shear planeis somewhat controversial at this point. As far the knowledge-aware construction of concept maps isconcerned, the map shown in Figure 7 needs revision, avoiding the mixing of the types of knowledge.
Consider the third proposition: The chip forms by maximizing the shear force, resulting in theincluded angle ∠ABE (illustrated in Figure 6) equal to π/4. It is also a piece of meaningful knowledgebecause a new concept is injected (maximizing the shear force) to set the value of the angle ∠ABE. Thereare other ways to perceive this case. For example, one can consider instead that “minimizing energy”is the phenomenon that takes place while removing the chip from a workpiece during machining [62].
73
Educ. Sci. 2019, 9, 228
Therefore, comprehending this knowledge requires some effort from the learner’s side and making itcompressible requires efforts from the instructor’s side.
Consider the fourth proposition: Shear force acts along the shear plane. It is a piece of analytica priori knowledge that defines the concept of shear force with respect to shear plane. Even thoughthis proposition is a piece of analytic a priori knowledge, it is coupled with another concept (shearplane) that also needs to be defined. Since the concept of shear plane refers to a piece of meaningfulknowledge, the comprehension regarding the shear force creates an amount of fuzziness amongthe learners. Therefore, this piece of knowledge creates what can be referred to as fuzzy circularity.Therefore, both concepts (shear force and shear plane) must be handled with care during the process oflearning and teaching.
Consider the fifth proposition: The included angle ∠ABE is equal to φ + τ − α based on thegeometric relationships among the three pairs of forces illustrated in Figure 6. It is a piece of synthetica priori knowledge because ∠ABE = φ + τ − α is deduced from the geometric relationships shownin Figure 6. Therefore, if the learns can follow the steps used in the deduction, the validity of theproposition becomes clear to them. The instructor may set some exercises for the learners to masterthe steps.
Consider the sixth proposition: Two balancing forces (illustrated in Figure 6) can be represented bythree pairs of forces, where each pair consists of two orthogonal components. It is a piece of synthetic apriori knowledge because, from a mathematical point of view, a planner force can be deduced intotwo orthogonal components. Regarding the three pairs of forces, the following comments can bemade. Consider, for example, the force acting between the cutting tool surface and the chip (Figure 6).Whenever an object slides against another, friction force occurs, and its magnitude depends on thesurface condition (coefficient of friction) and the force acting normal to the sliding surfaces. This kindof explanation is deductive truth that relates basic knowledge of physics and engineering science.The same arguments hold for the other two pairs of forces. Therefore, there is no problem treatingproposition 6 as a piece of synthetic a priori knowledge.
Consider the seventh proposition: Cutting force acts in the direction of cutting velocity. It is apiece of analytic a priori knowledge because it defines cutting force; that is, a force that acts in thedirection of cutting velocity. Even though this proposition is a piece of analytic a priori knowledge, itis coupled with another concept (cutting velocity) that also needs to be defined. Therefore, this pieceof knowledge creates a circularity. This time it does not entail fuzzy circularity, unlike the case forproposition 4. This time, it is rather a simple circularity. Nevertheless, both concepts (cutting force andcutting velocity) deserve explanation with respect to each other, requiring extra care from both thelearner’s and instructor’s sides.
Consider the eighth proposition: Cutting force is a component of one of the three pairs offorces (illustrated in Figure 6). It is a piece of synthetic a priori knowledge because, from theknowledge of mathematics (vector algebra), it is clear that a planner force can be decomposed intoorthogonal components.
Consider the last proposition: The shear plane angle is given as φ = π/4 + (α − τ). It is a piece ofskeptic knowledge, though it seems a piece of synthetic a priori knowledge. The reasons are two-fold.The first reason is its epistemic nature, and the other reason is its ability to trigger other learningactivities that can incorporate other concept maps. This is schematically illustrated in Figure 8. Asseen in Figure 8, at least two new concept maps, denoted as Map-1 and Map-2, can evolve due to thispiece of skeptic knowledge. While pursuing Map-1, the link of the proposition 9 (skeptic knowledge)with other propositions can be considered. It is directly related to propositions 2, 3, and 4, which entailmeaningful knowledge. Since a great deal of skepticism is already associated with propositions 2, 3, and4, as described above, proposition 9 is automatically subjected to a great deal of skepticism. Therefore,learners can seek other pieces of meaningful knowledge (say, “the chip forms by minimizing energy atthe shear please”) [62]. In this case, the included angle ∠ABE (illustrated in Figure 6) will no longer beequal to π/4, resulting in a relationship other than φ = π/4 + (α − τ). If so, new pieces of knowledge (say,
74

Educ. Sci. 2019, 9, 228
φ = π/4 + 0.5(α − τ)) may evolve [62]. This results in a new concept map, denoted as Map-1. Considerthe concept map Map-2. The learning activity can also be directed toward incorporating some pieces ofsynthetic a posteriori knowledge (experimental facts). In this case, the apparent learning activities areas follows. According to Figure 6, the ratio between the thicknesses of the undeformed material beforechip formation and deformed material after chip formation (denoted as r) is equal to sin(φ)/cos(φ − α).An experiment can be carried out to know r for a predefined α (rake angle). If these experimentallydetermined values of r and φ are input in r = sin(φ)/cos(φ − α), the value of φ can be calculated. Thiscalculated value can be compared to the theoretical one, φ = π/4 + (α − τ). Thus, proposition 9 (skepticknowledge) leads to some learning activities to know about the nature of machining from differentpoints of view, to see whether or not the associated meaningful knowledge can be trusted. In otherwords, proposition 9 can enhance discipline-based education.
Figure 8. Learning enhancement through skeptic knowledge.
5. Conclusions
Though concept mapping has contributed to different levels of education, its construction anddeployment processes require a great deal of study. As far as manufacturing engineering is concerned,both learning factory and human-cyber-physical systems (i.e., human and machining learning) haveopened new opportunities for concept maps and brought new challenges as well. The proposed typesof knowledge (analytic a priori, synthetic a priori, synthetic a posteriori, meaningful, and skepticknowledge) can help exploit the abovementioned opportunities and tackle the challenges. This is clearfrom the contents presented in the previous few sections.
In order to educate students with the basic knowledge of material removal (a common topic thatall manufacturing engineering students study at undergraduate degree level), a nine proposition-basedconcept map has been introduced. The map represents knowledge of the shear plane theory of materialremoval. All types of knowledge are integrated into the map, except synthetic a posteriori knowledge.The remarkable thing is that the learning process directs the learners to form new concept maps,wherein the not-yet-included type of knowledge (in this case, synthetic a posteriori knowledge) islikely to appear. This directs the whole learning process in the direction of meaningful learning.
Instead of the presented concept map, a concept map without embedding synthetic a prioriknowledge can be considered for the same purpose (educating students with the basic knowledgeof material removal) and can be observed whether or not the learners propose another concept mapthat incorporates synthetic a priori knowledge. This means that there is enough room for further
75
Educ. Sci. 2019, 9, 228
investigations showing the education capability of concept maps and, thereby, meaningful learning,while offering manufacturing engineering education.
Funding: This research received materials and financial supports from Kitami Institute of Technology.
Conflicts of Interest: The author declares no conflicts of interest.
References
1. Wilson, S.; Schweingruber, H.; Nielsen, N. (Eds.) Science Teachers’ Learning: Enhancing Opportunities, CreatingSupportive Contexts; The National Academies Press: Washington, DC, USA, 2015. [CrossRef]
2. Bamberger, Y.M.; Davis, E.A. Middle school science students’ scientific modelling performances acrosscontent areas and within a learning progression. Int. J. Sci. Educ. 2013, 35, 213–238. [CrossRef]
3. Berland, L.K.; Reiser, B.J. Making sense of argumentation and explanation. Sci. Educ. 2009, 93, 26–55.[CrossRef]
4. McNeill, K.L. Elementary students’ views of explanation, argumentation and evidence and abilities toconstruct arguments over the school year. J. Res. Sci. Teach. 2011, 48, 793–823. [CrossRef]
5. McNeill, K.L.; Lizotte, D.J.; Krajcik, J.; Marx, R.W. Supporting students’ construction of scientific explanationsby fading scaffolds in instructional materials. J. Learn. Sci. 2006, 15, 153–191. [CrossRef]
6. Lehrer, R.; Schauble, L. Seeding evolutionary thinking by engaging children in modeling its foundations. Sci.Educ. 2012, 96, 701–724. [CrossRef]
7. Smith, C.L.; Wiser, M.; Anderson, C.W.; Krajcik, J. Implications of research on children’s learning forstandards and assessment: A proposed learning progression for matter and the atomic molecular theory.Meas. Interdiscip. Res. Perspect. 2006, 4, 1–98. [CrossRef]
8. National Research Council. How People Learn: Bridging Research and Practice; Donovan, M.S., Bransford, J.D.,Pellegrino, J.W., Eds.; National Academy Press: Washington, DC, USA, 1999.
9. National Research Council. A Framework for K-12 Science Education Practices, Crosscutting Concepts, and CoreIdeas; The National Academies Press: Washington, DC, USA, 2012.
10. Chi, M.T.H. Commonsense conceptions of emergent processes: Why some misconceptions are robust. J. Sci.2005, 14, 161–199. [CrossRef]
11. Chi, M.T.H. Three types of conceptual change: Belief revision, mental model transformation, and categoricalshift. In International Handbook of Research on Conceptual Change; Vosniadou, S., Ed.; Routledge: New York,NY, USA, 2008; pp. 61–82.
12. Singer, S.R.; Nielsen, N.R.; Schweingruber, H.A. (Eds.) Discipline-Based Education Research: Understanding andImproving Learning in Undergraduate Science and Engineering; The National Academies Press: Washington, DC,USA, 2012. [CrossRef]
13. Criteria for Accrediting Engineering Programs, 2019–2020. Available online: https://www.abet.org/accreditation/accreditation-criteria/criteria-for-accrediting-engineering-programs-2019-2020/#GC2 (accessedon 23 July 2019).
14. Brown, A.L. Knowing when, where, and how to remember: A problem of metacognition. In Advances inInstructional Psychology; Glaser, R., Ed.; Lawrence Erlbaum Associates: Hillsdale, NJ, USA, 1978; Volume 2,pp. 77–165.
15. Flavell, J.H. Metacognition and cognitive monitoring: A new area of cognitive-developmental inquiry. Am.Psychol. 1979, 34, 906–911. [CrossRef]
16. Ausubel, D.P. Educational Psychology, a Cognitive View; Holt, Rinehart and Winston: New York, NY, USA, 1968.17. Ausubel, D.P.; Novak, J.D.; Hanesian, H. Educational Psychology: A Cognitive View, 2nd ed.; Holt, Rinehart
and Winston: New York, NY, USA, 1978.18. Ausubel, D.P. The Acquisition and Retention of Knowledge: A Cognitive View; Kluwer Academic: Boston, MA,
USA, 2000.19. Novak, J.D.; Gowin, D.B. Learning How to Learn; Cambridge University Press: New York, NY, USA, 1984.20. Novak, J.D. Learning, Creating, and Using Knowledge: Concept Maps as Facilitative Tools in Schools and Corporations,
2nd ed.; Rutledge: New York, NY, USA, 2012.21. Kinchin, I.M.; Möllits, A.; Reiska, P. Uncovering Types of Knowledge in Concept Maps. Educ. Sci. 2019,
9, 131. [CrossRef]
76

Educ. Sci. 2019, 9, 228
22. Marzetta, K.; Mason, H.; Wee, B. ‘Sometimes They Are Fun and Sometimes They Are Not’: Concept Mappingwith English Language Acquisition (ELA) and Gifted/Talented (GT) Elementary Students Learning Scienceand Sustainability. Educ. Sci. 2018, 8, 13. [CrossRef]
23. Young, J.; Young, J.; Cason, M.; Ortiz, N.; Foster, M.; Hamilton, C. Concept Raps versus Concept Maps:A Culturally Responsive Approach to STEM Vocabulary Development. Educ. Sci. 2018, 8, 108. [CrossRef]
24. Zhou, Y. A Concept Tree of Accounting Theory: (Re)Design for the Curriculum Development. Educ. Sci.2019, 9, 111. [CrossRef]
25. Ullah, A.M.M.S. On the interplay of manufacturing engineering education and e-learning. Int. J. Mech. Eng.Educ. 2016, 44, 233–254. [CrossRef]
26. Abele, E.; Chryssolouris, G.; Sihn, W.; Metternich, J.; ElMaraghy, H.; Seliger, G.; Sivard, G.; ElMaraghy, W.;Hummel, V.; Tisch, M.; et al. Learning factories for future oriented research and education in manufacturing.CIRP Ann. Manuf. Technol. 2017, 66, 803–826. [CrossRef]
27. Baena, F.; Guarin, A.; Mora, J.; Sauza, J.; Retat, S. Learning Factory: The Path to Industry 4.0. Procedia Manuf.2017, 9, 73–80. [CrossRef]
28. Tisch, M.; Hertle, C.; Abele, E.; Metternich, J.; Tenberg, R. Learning factory design: A competency-orientedapproach integrating three design levels. Int. J. Comput. Integr. Manuf. 2016, 29, 1355–1375. [CrossRef]
29. Schuh, G.; Anderl, R.; Gausemeier, J.; Hompel, M.; Wahlster, W. (Eds.) Industrie 4.0 Maturity Index. Managingthe Digital Transformation of Companies (Acatech Study); Herbert Utz Verlag: Munich, Germany, 2017.
30. Ullah, A.M.M.S. Modeling and simulation of complex manufacturing phenomena using sensor signals fromthe perspective of Industry 4.0. Adv. Eng. Inform. 2019, 39, 1–13. [CrossRef]
31. Ullah, A.M.M.S.; Arai, N.; Watanabe, M. Concept Map and Internet-aided Manufacturing. Procedia CIRP2013, 12, 378–383. [CrossRef]
32. Cañas, A.J.; Novak, J.D.; Reiska, P. How good is my concept map? Am I a good Cmapper? Knowl. Manag.E-Learn. 2015, 7, 6–19.
33. Zhao, M.; Wang, H.; Guo, J.; Liu, D.; Xie, C.; Liu, Q.; Cheng, Z. Construction of an Industrial KnowledgeGraph for Unstructured Chinese Text Learning. Appl. Sci. 2019, 9, 2720. [CrossRef]
34. Zheng, P.; Wang, H.; Sang, Z.; Zhong, R.Y.; Liu, Y.; Liu, C.; Mubarok, K.; Yu, S.; Xu, X. Smart manufacturingsystems for Industry 4.0: Conceptual framework, scenarios, and future perspectives. Front. Mech. Eng. 2018,13, 137–150. [CrossRef]
35. Kusiak, A. Smart manufacturing. Int. J. Prod. Res. 2018, 56, 508–517. [CrossRef]36. Lasi, H.; Fettke, P.; Kemper, H.G.; Feld, T.; Hoffmann, M. Industry 4.0. Bus. Inf. Syst. Eng. 2014, 6, 239–242.
[CrossRef]37. Koren, Y.; Gu, X.; Guo, W. Reconfigurable manufacturing systems: Principles, design, and future trends.
Front. Mech. Eng. 2018, 13, 121–136. [CrossRef]38. Ullah, A.M.M.S. Surface Roughness Modeling Using Q-Sequence. Math. Comput. Appl. 2017, 22, 33.
[CrossRef]39. Imran Shafiq, S.; Szczerbicki, E.; Sanin, C. Decisional-DNA Based Smart Production Performance Analysis
Model. Cybern. Syst. 2019, 50, 154–164. [CrossRef]40. Ghosh, A.K.; Ullah, A.M.M.S.; Kubo, A. Hidden Markov Model-Based Digital Twin Construction for
Futuristic Manufacturing Systems. Artif. Intell. Eng. Des. Anal. Manuf. 2019, 33, 317–331. [CrossRef]41. Vogel-Heuser, B.; Kegel, G.; Bender, K.; Wucherer, K. Global Information Architecture for Industrial
Automation. Autom. Prax. 2009, 51, 108–115. [CrossRef]42. Lee, J.; Bagheri, B.; Kao, H.A. A cyber-physical systems architecture for Industry 4.0-based manufacturing
systems. Manuf. Lett. 2015, 3, 18–23. [CrossRef]43. Schroeder, G.N.; Steinmetz, C.; Pereira, C.E.; Espindola, D.B. Digital Twin Data Modeling with AutomationML
and a Communication Methodology for Data Exchange. IFAC-PapersOnLine 2016, 49, 12–17. [CrossRef]44. Madni, A.M.; Madni, C.C.; Lucero, S.D. Leveraging Digital Twin Technology in Model-Based Systems
Engineering. Systems 2019, 7, 7. [CrossRef]45. Ullah, A.M.M.S.; D’Addona, D.; Arai, A. DNA based computing for understanding complex shapes.
Biosystems 2014, 117, 40–53. [CrossRef] [PubMed]46. Ullah, A.S.; Harib, K.H. Tutorials for Integrating CAD/CAM in Engineering Curricula. Educ. Sci. 2018, 8, 151.
[CrossRef]
77

Educ. Sci. 2019, 9, 228
47. Salah, B.; Abidi, M.H.; Mian, S.H.; Krid, M.; Alkhalefah, H.; Abdo, A. Virtual Reality-Based EngineeringEducation to Enhance Manufacturing Sustainability in Industry 4.0. Sustainability 2019, 11, 1477. [CrossRef]
48. Chong, S.; Pan, G.T.; Chin, J.; Show, P.L.; Yang, T.C.K.; Huang, C.M. Integration of 3D Printing and Industry4.0 into Engineering Teaching. Sustainability 2018, 10, 3960. [CrossRef]
49. Berners-Lee, T.; Hendler, J.; Lassila, O. The semantic web. Sci. Am. 2001, 284, 34–43. [CrossRef]50. Pileggi, S.F.; Fernandez-Llatas, C.; Traver, V. When the Social Meets the Semantic: Social Semantic Web or
Web 2.5. Future Internet 2012, 4, 852–864. [CrossRef]51. Khilwani, N.; Harding, J.A.; Choudhary, A.K. Semantic web in manufacturing. Proc. Inst. Mech. Eng. Part B
J. Eng. Manuf. 2009, 223, 905–925. [CrossRef]52. Alkahtani, M.; Choudhary, A.; De, A.; Harding, J.A. A decision support system based on ontology and data
mining to improve design using warranty data. Comput. Ind. Eng. 2019, 128, 1027–1039. [CrossRef]53. Polanyi, M. Personal Knowledge: Towards a Post-Critical Philosophy; The University of Chicago Press: Chicago,
IL, USA, 1958.54. Nonaka, I. A Dynamic Theory of Organizational Knowledge Creation. Organ. Sci. 1994, 5, 14–37. [CrossRef]55. Sosa, E. Epistemology; Princeton University Press: Princeton, NJ, USA, 2017.56. Kant, I. Critique of Pure Reason: The Cambridge Edition of the Works of Immanuel Kant; Guyer, P., Wood, A.W.,
Eds.; Cambridge University Press: Cambridge, UK, 2000.57. Tvenge, N.; Martinsen, K. Integration of digital learning in industry 4.0. Procedia Manuf. 2018, 23, 261–266.
[CrossRef]58. Umachandran, D.K.; Jurcic, I.; Ferdinand-James, D.; Said, M.; Rashid, A. Gearing Up Education Towards
Industry 4.0. IJCT 2018, 17, 7305–7311. [CrossRef]59. Chou, P.N.; Feng, S.T. Using a Tablet Computer Application to Advance High School Students’ Laboratory
Learning Experiences: A Focus on Electrical Engineering Education. Sustainability 2019, 11, 381. [CrossRef]60. Coskun, S.; Kayıkcı, Y.; Gençay, E. Adapting Engineering Education to Industry 4.0 Vision. Technologies 2019,
7, 10. [CrossRef]61. Kolb, D. Experiential Learning as the Science of Learning and Development; Prentice Hall: Englewood Cliffs, NJ,
USA, 1984.62. Astakhov, V.P. On the inadequacy of the single-shear plane model of chip formation. Int. J. Mech. Sci. 2005,
47, 1649–1672. [CrossRef]63. The Semantic Web. Available online: http://cmapspublic3.ihmc.us/rid=1S3G6GN2Q-DYSY2Q-4D2Z/shear-
plane-theory-concept-map.cmap (accessed on 23 July 2019).
© 2019 by the author. Licensee MDPI, Basel, Switzerland. This article is an open accessarticle distributed under the terms and conditions of the Creative Commons Attribution(CC BY) license (http://creativecommons.org/licenses/by/4.0/).
78

MDPISt. Alban-Anlage 66
4052 BaselSwitzerland
Tel. +41 61 683 77 34Fax +41 61 302 89 18
www.mdpi.com
Education Sciences Editorial OfficeE-mail: [email protected]
www.mdpi.com/journal/education


MDPI St. Alban-Anlage 66 4052 Basel Switzerland
Tel: +41 61 683 77 34 Fax: +41 61 302 89 18
www.mdpi.com ISBN 978-3-03943-393-3