031212, automatic control of freeboard and turbine operationvbn.aau.dk/files/122899/031212,...
TRANSCRIPT
Aalborg Universitet
Automatic Control of Freeboard and Turbine Operation
Kofoed, Jens Peter; Frigaard, Peter Bak; Friis-Madsen, Erik; Nimskov, Morten
Publication date:2004
Document VersionPublisher's PDF, also known as Version of record
Link to publication from Aalborg University
Citation for published version (APA):Kofoed, J. P., Frigaard, P. B., Friis-Madsen, E., & Nimskov, M. (2004). Automatic Control of Freeboard andTurbine Operation: Wave Dragon, Nissum Bredning. Aalborg: Department of Civil Engineering, AalborgUniversity. Hydraulics and Coastal Engineering, No. 1
General rightsCopyright and moral rights for the publications made accessible in the public portal are retained by the authors and/or other copyright ownersand it is a condition of accessing publications that users recognise and abide by the legal requirements associated with these rights.
? Users may download and print one copy of any publication from the public portal for the purpose of private study or research. ? You may not further distribute the material or use it for any profit-making activity or commercial gain ? You may freely distribute the URL identifying the publication in the public portal ?
Take down policyIf you believe that this document breaches copyright please contact us at [email protected] providing details, and we will remove access tothe work immediately and investigate your claim.
Downloaded from vbn.aau.dk on: maj 11, 2018

Automatic Control of Freeboard and Turbine Operation
– Wave Dragon, Nissum Bredning
Project:
Sea Testing and Optimization of Power Production on a Scale 1:4.5 Test Rig of the Offshore Wave Energy Converter Wave Dragon
according to EU ENERGIE contract no. ENK5-CT-2002-00603
Jens Peter Kofoed & Peter Frigaard, Aalborg University
Erik Friis-Madsen, Wave Dragon Aps Morten Nimskov, Balslev
February, 2004

DEPARTMENT OF CIVIL ENGINEERING AALBORG UNIVERSITY
SOHNGAARDSHOLMSVEJ 57 DK-9000 AALBORG DENMARK TELEPHONE +45 96 35 80 80 TELEFAX +45 98 14 25 55
Hydraulics and Coastal Engineering No. 1
Automatic Control of Freeboard and Turbine Operation
Wave Dragon, Nissum Bredning
by
Jens Peter Kofoed & Peter Frigaard, Aalborg University Erik Friis-Madsen, Wave Dragon Aps
Morten Nimskov, Balslev
Februar, 2004

Table of contents 1. INTRODUCTION...............................................................................................................................................3 2. PLC/SCADA SYSTEM ......................................................................................................................................4 3. ‘BUOYANCY’ CONTROL................................................................................................................................6
INITIAL BUOYANCY TESTING...................................................................................................................................6 OPERATING EXPERIENCE ........................................................................................................................................7
4. ‘GENERATOR’ CONTROL ...........................................................................................................................10 INITIAL OPERATION EXPERIENCES.........................................................................................................................10 TURBINE PERFORMANCE DATA .............................................................................................................................12 INSTALLATION OF CYLINDER GATE TURBINES.......................................................................................................14
5. LITERATURE ..................................................................................................................................................16

3
1. Introduction This report deals with the modules for automatic control of freeboard and turbine operation on board the Wave Dragon, Nissum Bredning (WD-NB) prototype, and covers what has been going on up to ultimo 2003.
The modules have been implemented on board WD-NB by means of a Siemens PLC. The control and monitoring of the PLC is achieved through a SCADA software package (SIMATIC WinCC V6) running on a Windows 2000 PC situated on board. A preliminary Users manual is available (Nimskov, 2003). The two modules for automatic control of freeboard and turbine operation are denoted ‘Buoyancy’ and ‘Generators’, respectively, in the SCADA system. The ‘Buoyancy’ part controls the freeboard by blowing air into or letting air out of air chambers underneath the structure, and thereby raise or lower it. The ‘generator’ part controls the generators, and thereby the turbines, by switching them on and of in order to maintain the water level in the reservoir within the specified work span. Furthermore, the generators are controlled by frequency converters, so the rotational speed for each turbine is achieved, corresponding to the optimal operation point.
In the following in introduction to the PLC and the SCADA system is given, followed by descriptions of the ‘Buoyancy’ and ‘Generator’ modules.

4
2. PLC/SCADA System The running-in of the PLC/SCADA system has been on going over the period from system power up - 07.04.2003 until 01.06.2003, when the reflectors were re-mounted. During this period the basic control modules (for regulating the floating level and controlling the turbines) were setup.
Fig. 2.1 Connection of WD to the grid
By the end of the period both the floating level and the turbine control systems were running in automatic mode. However, there were still items to solve, as the automatic control systems were often stopped because alarm conditions were activated e.g. due to a stuck valve, and the buoyancy control module has some instability problems, especially for high floating levels.
Screen dumps from the SCADA system and pictures from the running-in of the system are presented in Fig. 2.2 and 2.3.
Fig. 2.2 PC screen and supporting equipment for the SCADA system and the SCADA control system main page.

5
Fig. 2.3 Graphs of turbine step and water level in reservoir (left) and Example of alarms (right) from the SCADA system
Generally, the SCADA system is used for control and configuration of the PLC, and for data presentation. The two main modules ‘Buoyancy’ and ‘Generator’ can be set to run in either manual or automatic mode. When set to manual mode, valves, blowers etc. can be operated manually, while when in automatic mode, the PLC controls the ‘Buoyancy’ and ‘Generator’ modules as set in the configuration part of the SCADA system.
Furthermore, using the SCADA system it is possible to control the Flygt pump and the external lights on board.
Fig. 2.4 The Flygt pump in operation
Fig. 2.4 shows the Flygt pump running which is used for pumping water to the reservoir for testing purposes (in the case of no incoming waves).
For further information on the PLC/SCADA system, please refer to Nimskov, 2003.
6
3. ‘Buoyancy’ control The buoyancy control of the WD-NB is responsible of achieving the wanted floating level, heel and trim. Generally, the target for the heel and trim regulation is to keep the platform level, ie. heel and trim at 0. However, the SCADA configuration page allows for specifying another constant target value for heel and trim. The target floating level (TFL) can be specified using 4 parameters: A and B in the expression TFL = A·Hs + B, where Hs is the significant wave height, and a min. and max. TFL value. Thus, the TFL can be set to a constant value or to be a linear function of the wave height with an upper and lower boundary.
As described by Hald & Friis-Madsen, 2001, the regulation of the freeboard can also be done without measuring the Hs directly. In this case the Hs is estimated based on the current overtopping rate for the current crest freeboard (and an assumption on the relation between the peak period Tp and Hs). Then, from Hs the optimal crest freeboard can be determined. From this it can also be seen than the Hs is merely an intermediate link which actually is not necessary. In principle, the optimal crest freeboard can be determined based on the current overtopping rate and the current crest freeboard alone. However, problems can arise as the measurement of especially the current overtopping rate might be influenced by errors due spilling (the overtopping rate is measured by adding up the outflow through the turbines). Therefore, at the current state of the project this approach has not been utilized.
The buoyancy control adjusts the floating level, heel and trim by regulating the air pressure (and thereby also the water level) in the air chambers underneath the reservoir. These chambers are divided into 5 zones, and air can be blown into or lead out of each of them individually, by means of valves and a blower controlled by the PLC.
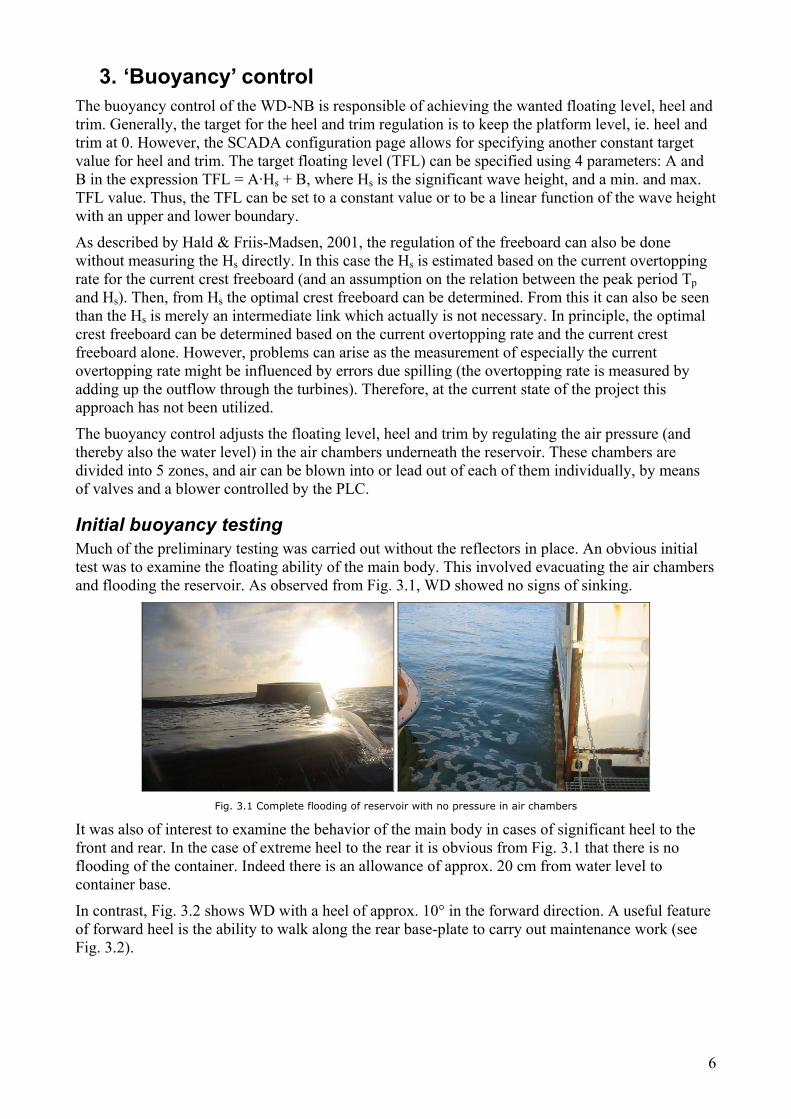
Initial buoyancy testing Much of the preliminary testing was carried out without the reflectors in place. An obvious initial test was to examine the floating ability of the main body. This involved evacuating the air chambers and flooding the reservoir. As observed from Fig. 3.1, WD showed no signs of sinking.
Fig. 3.1 Complete flooding of reservoir with no pressure in air chambers
It was also of interest to examine the behavior of the main body in cases of significant heel to the front and rear. In the case of extreme heel to the rear it is obvious from Fig. 3.1 that there is no flooding of the container. Indeed there is an allowance of approx. 20 cm from water level to container base.
In contrast, Fig. 3.2 shows WD with a heel of approx. 10° in the forward direction. A useful feature of forward heel is the ability to walk along the rear base-plate to carry out maintenance work (see Fig. 3.2).

7
Fig. 3.2 Heel of 10° to the front. This leaves the base-plate uncovered
Operating experience The first layout of the buoyancy control module was able to achieve and maintain the wanted floating level and also to control heel and trim reasonably for lower floating levels. However, for higher floating levels (and thus typically higher wave states), and filled reservoir, the heel and trim regulation becomes quite unstable.
Fig. 3.3 Floating conditions in harsh wave climate using initial control module layout.
The control strategy have been tested and optimized, and the optimization is still in progress. In order enable detailed adjustments of the buoyancy regulation a number of additional control parameters have been included for configuration in the SCADA system.

8
Fig. 3.4 Configurable control parameters, buoyancy regulation on the left.
The current situation is, that the performance of the buoyancy regulation has been improved significantly, see the figures below. However, adjustments and optimization of the regulation will continue.
Fig. 3.5 Buoyancy test sequence in calm waves (no overtopping), no water in reservoir.
First, TFL was changed from 50 to 88 cm, then from 88 to 44 cm.
Fig. 3.6 Buoyancy test sequence in calm waves (no overtopping). First, reservoir is filled by use of Flygt pump. Then, TFL was changed from 44 to 88 cm. However, the water is lost before TFL is reached, see figure below.

9
Fig. 3.7 Basin level during increase of floating level (going from 44 to 88 cm). As it can be seen, the water is lost.
A significant experience has been that the system for measuring actual floating level, heel and trim initially installed on board WD-NB has not performed well. The system was based on 4 pressure transducers place underneath the floating platform (in the front of the ramp, under the turbine area and one in each of the rear corners). It has turned out that these transducers can not produce reliable outputs over long time (months) because of what seems to be a drift in the offset (probably caused be the harsh conditions they are working under – marine growth etc.). It should be noted that the pressure transducers are not accessible for other but a diver. Initially, this was initially worked around by frequently re-adjusting the offsets, but this is not a sustainable solution. Therefore, two inclinometers have been installed for the measurement of heel and trim, and retractable pressure transducer is under installation for measuring the floating level.

10
4. ‘Generator’ control The generator control module consists of a PLC part and a frequency converter and controller unit delivered by West Control (WCU). The different parts play different roles in the control of the generators, and thereby the turbines:
• Based on the relative basin level (a percentage of the basin level work span in which the turbines are active) the PLC decides which turbines should be on. Based on the pressure head over the turbines (calculated from the floating level and basin level), and the turbine characteristics, the optimal turbine speed is set by the PLC for each turbine. The status and the wanted turbine speed for each turbine is send to the WCU. This is applicable for ‘real’ turbines – the siphon and cylinder gate turbines.
• The PLC also controls the activation of the siphon on the siphon turbine and the cylinder gates on the cylinder gate and dummy turbines.
• Based on the wanted speeds sent to the WCU from the PLC, the PLC operates the frequency converters, and thereby the generators in each turbine, to obtain the wanted turbine speed. The actual speeds are then reported back to the PLC, along with information about the power, voltage, current and cos phi, for each turbine/generator.
Initial operation experiences Initial operation of the turbines highlighted the need for some adjustments including:
• Water level switches required for identifying water in aeration tube and lubricating water in siphon turbine (see Fig. 4.1).
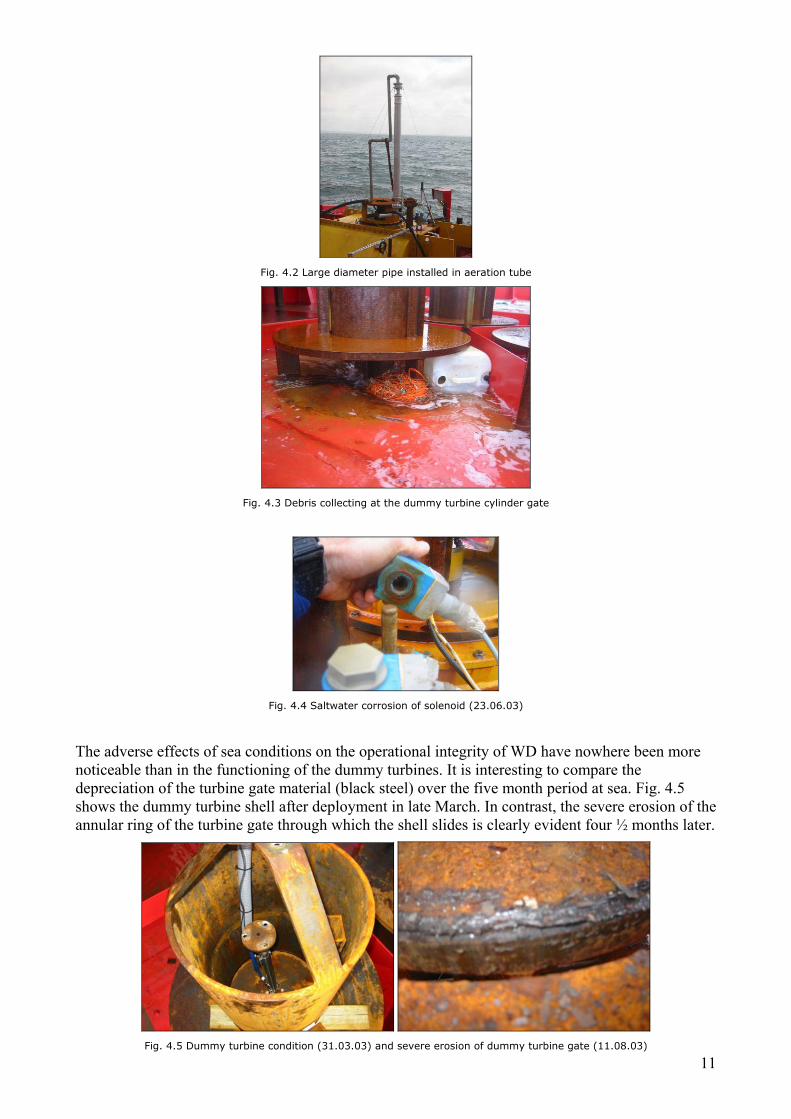
• Large diameter pipe in aeration tube to avoid water in the vacuum pump (see Fig. 4.2).
• Debris collecting at the dummy turbines in cases of heavy overtopping, preventing operation of same. This problem will be eliminated with the planned inclusion of mesh fence to be placed all around the turbine area prior to the start of operation of the cylinder gate turbines (see Fig. 4.3).
• Intrusion of saltwater in solenoids controlling the hydraulic pistons in the turbines. This has on more than one occasion lead to malfunction of the pistons. Shielding of these units has been installed (see Fig. 4.4).
• Corrosion of black steel dummy turbines. More on that below.
Fig. 4.1 Aeration tube water level switch installation and siphon turbine water level switch.
11
Fig. 4.2 Large diameter pipe installed in aeration tube
Fig. 4.3 Debris collecting at the dummy turbine cylinder gate
Fig. 4.4 Saltwater corrosion of solenoid (23.06.03)
The adverse effects of sea conditions on the operational integrity of WD have nowhere been more noticeable than in the functioning of the dummy turbines. It is interesting to compare the depreciation of the turbine gate material (black steel) over the five month period at sea. Fig. 4.5 shows the dummy turbine shell after deployment in late March. In contrast, the severe erosion of the annular ring of the turbine gate through which the shell slides is clearly evident four ½ months later.
Fig. 4.5 Dummy turbine condition (31.03.03) and severe erosion of dummy turbine gate (11.08.03)

12
As a result of this erosion, two of the three dummy turbines jammed. In addition, the hydraulic cylinder in one of the turbines was damaged (bent) in the process of attempting to move it. The cylinder was removed and has since been repaired at the workshop.
In light of theses operational problems, dummy turbine re-conditioning work was carried out. All three turbine shells were extracted individually using the hoist shown in Fig. 4.6 (left) before rust removal and treatment was carried out (Galvafroid and greased). The result is shown in Fig. 4.6 (right).
Fig. 4.6 Hoist used for dummy turbine removal and dummy turbines following maintenance
This allowed the shells to open and close effectively. In addition, the re-conditioned hydraulic cylinder was installed in the appropriate turbine. All three turbines now operate satisfactorily. Doubts remain, however, as to the long term operating ability of same. Efforts need to be concentrated on improving the vertical guidance of the shells with a self-centering system preferred.
Another point of note involves the operation of the siphon turbine. It was reported (11.08.03) that the hydraulic cylinder for operating the aeration valve on the siphon turbine did not work. Without any corrective action in the interim, this valve was found to function on the visit dating 15.09.03. Despite this, it is planned to carry out inspection tests on all turbines (dummy and otherwise). A good opportunity to carry out this work may be to correspond with the installation of the systems on the six new Kössler turbines (Danfoss).
Turbine performance data The specific speed, as obtained from turbine calibration data (Kofoed & O’Donovan, 2003), was used in the evaluation of actual (overtopping) power production data (see Fig. 4.7). A similar approach to that used in the evaluation of the turbine calibration plot was adopted with time intervals of 10 seconds being used on this occasion to yield Flow V’s Time performance series for WD as shown in Fig. 4.8.

13
Fig. 4.7 Power production plot
0
0.005
0.01
0.015
0.02
0.025
0.03
0.035
0.04
0 100 200 300 400 500
t [s]
q [m
^3/s
]
Fig. 4.8 Flow V’s Time series
Furthermore, the discharge due to overtopping was evaluated from established relationships based on the doubly-curved overtopping ramp (Hald & Frigaard, 2001) and compared with experimental results from the second Generation WD model. Laboratory and calculated overtopping discharge rates where found as:
Calculated - 0.063 m3/sec
Measured - 0.034 m3/sec
See also Fig. 4.10.
The power production as depicted by the SCADA system does not agree with the hydraulic power (i.e. mass flow rate x acceleration due to gravity x head).
Figures for average power production have been found to be 150 W from the SCADA system (based on data from the WCU), while the available hydraulic power is found to be only 10 W. The reason for this discrepancy has been found to be some problems in the communication between the PLC and the WCU, which currently is being solved.
Preliminary analyses have also been performed on overtopping events, as the one given in Fig. 4.9, where the dummy turbines and the calibrations hereof (by Knapp & Riemann, 2003) have been utilized. The results hereof are given in Fig. 4.10.

14
Fig. 4.9 Example of basic data from the SCADA system used for calculation of the overtopping rates.
0
0.0005
0.001
0.0015
0.002
0.0025
0.003
0 0.02 0.04 0.06 0.08 0.1 0.12 0.14 0.16
R*=Rc/Hs*sqrt(sop/(2π))
Q*=
q*sq
rt(s
op/(2π
))/(s
qrt(
g H
s3 L2 )
Prototype data 03.12.05 (dummy turbines) Protype data (siphon turbine)Prototype data 04.02.04 (dummy turbines) Prototype data 04.02.05 (dummy turbines)Hald & Frigaard (2001)
Fig. 4.10 Preliminary overtopping data from WD-NB prototype.
As it is seen from Fig. 4.10 some scatter is present in the preliminary overtopping data. Though, the main impression is that the measured overtopping rates are in the expected range, based on the findings from the laboratory. However, more data will soon be available, and more solid conclusions can then be drawn.
Installation of cylinder gate turbines On 12.09.03 the six cylinder gate turbines were installed. Below are some of the pictures from the process.

15
Fig. 4.11 Unloading of turbine centre and installation of floor plates section (runner & guide vanes)
Fig. 4.12 Draft tube & centre section assembly and turbine runner
Fig. 4.13 Installation of draft tube and installed turbines.
Installation of generators is currently ongoing. Testing of the WCU has been done and running in of the system is also ongoing.

16
5. Literature Hald, T. and Frigaard, P., 2001: Forces and overtopping on 2. generation Wave Dragon for Nissum Bredning. Phase 3 project, Danish Energy Agency. Project no. ENS-51191/00-0067. Hydraulics & Coastal Engineering Laboratory, Aalborg University.
Hald, T. and Friis-Madsen, E., 2001: Strategy for regulating the crest freeboard of a floating wave energy converter. Int. Conf. on Marine Renewable Energies, MAREC 2001, Newcastle.
Kofoed, J. P. and O’Donovan, E., 2003: Status report – First offshore experiences,Wave Dragon, Nissum Bredning. The Hydraulics and Engineering Group, Aalborg University, Nov. 2003.
Knapp, W and Riemann, S., 2003: Measurements on Wave Dragon, Nissum Bredning on 24th of May 2003: Dummy turbine calibration. Laboratorium für Hydraulische Maschinen, Technische Universität München, Germany.
Nimskov, M., 2003: Wave Dragon SCADA interface, User manual. Balslev, December 2003.