03 scientific method and process skills
TRANSCRIPT
8/3/2019 03 Scientific Method and Process Skills
http://slidepdf.com/reader/full/03-scientific-method-and-process-skills 1/16Aburto - GHHS
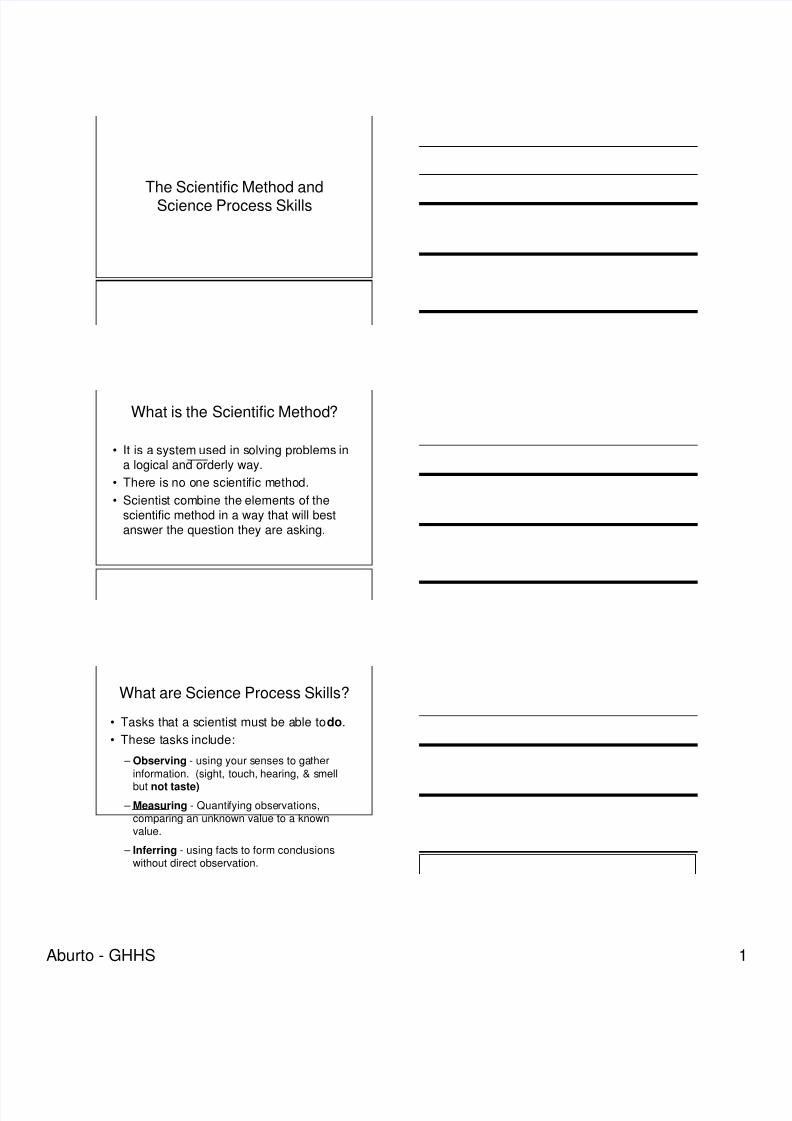
The Scientific Method andScience Process Skills
What is the Scientific Method?
• It is a system used in solving problems ina logical and orderly way.
• There is no one scientific method.
• Scientist combine the elements of thescientific method in a way that will bestanswer the question they are asking.
What are Science Process Skills?
• Tasks that a scientist must be able to do.
• These tasks include:
– Observing - using your senses to gatherinformation. (sight, touch, hearing, & smellbut not taste)
– Measuring - Quantifying observations,comparing an unknown value to a knownvalue.
– Inferring - using facts to form conclusionswithout direct observation.
8/3/2019 03 Scientific Method and Process Skills
http://slidepdf.com/reader/full/03-scientific-method-and-process-skills 2/16Aburto - GHHS
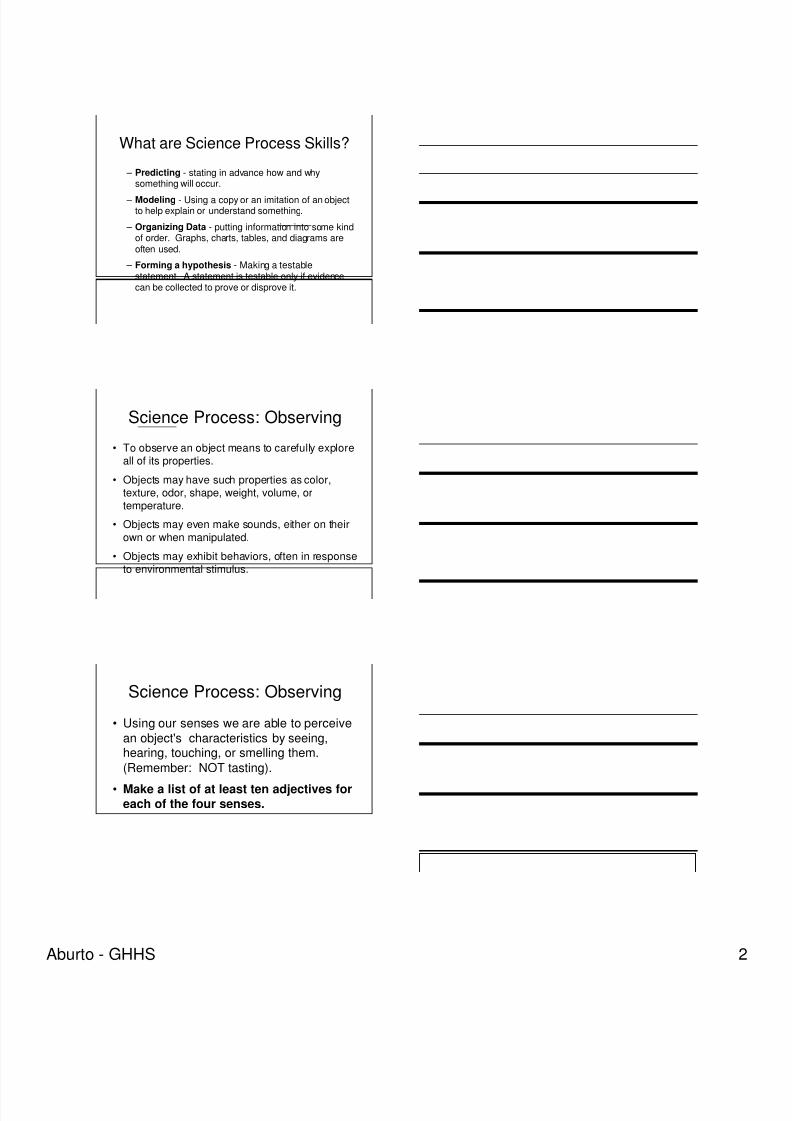
What are Science Process Skills?
– Predicting - stating in advance how and whysomething will occur.
– Modeling - Using a copy or an imitation of an objectto help explain or understand something.
– Organizing Data - putting information into some kindof order. Graphs, charts, tables, and diagrams areoften used.
– Forming a hypothesis - Making a testablestatement. A statement is testable only if evidencecan be collected to prove or disprove it.
Science Process: Observing
• To observe an object means to carefully exploreall of its properties.
• Objects may have such properties as color,texture, odor, shape, weight, volume, ortemperature.
• Objects may even make sounds, either on theirown or when manipulated.
• Objects may exhibit behaviors, often in response
to environmental stimulus.
Science Process: Observing
• Using our senses we are able to perceivean object's characteristics by seeing,hearing, touching, or smelling them.
(Remember: NOT tasting).
• Make a list of at least ten adjectives foreach of the four senses.
8/3/2019 03 Scientific Method and Process Skills
http://slidepdf.com/reader/full/03-scientific-method-and-process-skills 3/16Aburto - GHHS
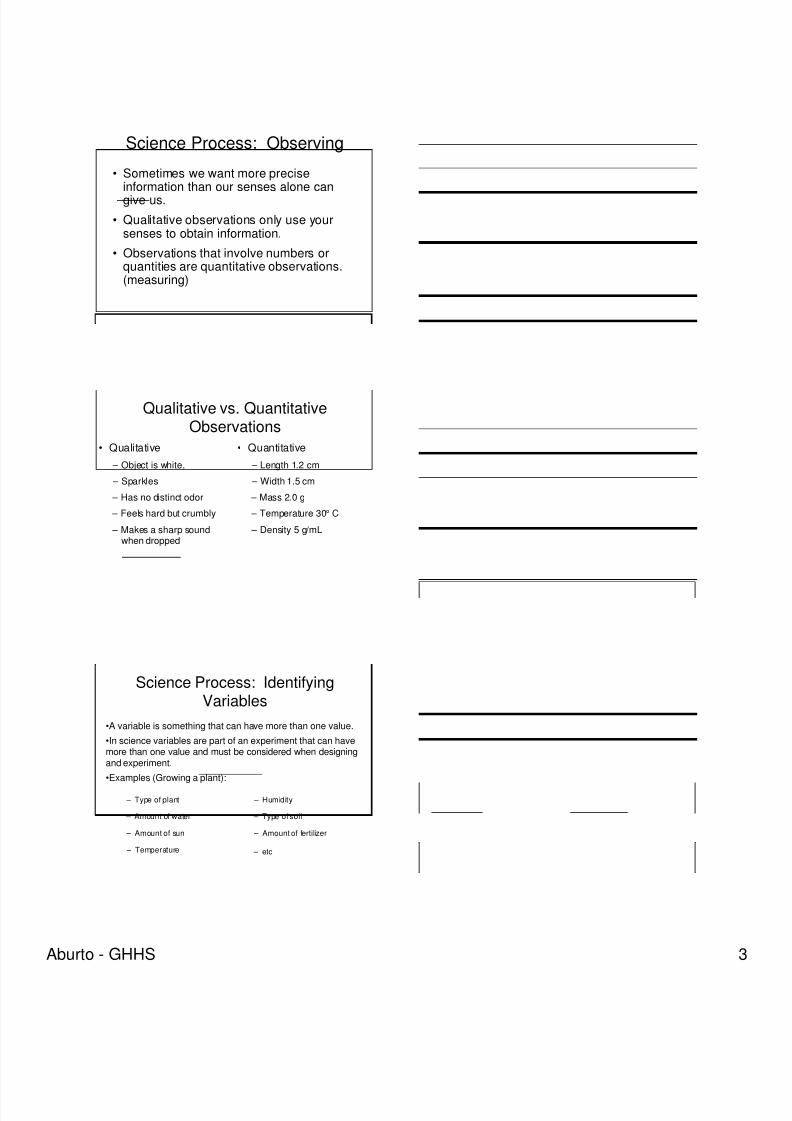
Science Process: Observing
• Sometimes we want more precise
information than our senses alone cangive us.
• Qualitative observations only use yoursenses to obtain information.
• Observations that involve numbers orquantities are quantitative observations.(measuring)
Qualitative vs. QuantitativeObservations
• Qualitative
– Object is white,
– Sparkles
– Has no distinct odor
– Feels hard but crumbly
– Makes a sharp soundwhen dropped
• Quantitative
– Length 1.2 cm
– Width 1.5 cm
– Mass 2.0 g
– Temperature 30° C
– Density 5 g/mL
Science Process: IdentifyingVariables
– Type of plant
– Amount of water
– Amount of sun
– Temperature
– Humidity
– Type of soil
– Amount of fertilizer
– etc
•A variable is something that can have more than one value.
•In science variables are part of an experiment that can havemore than one value and must be considered when designing
and experiment.•Examples (Growing a plant):
8/3/2019 03 Scientific Method and Process Skills
http://slidepdf.com/reader/full/03-scientific-method-and-process-skills 4/16Aburto - GHHS
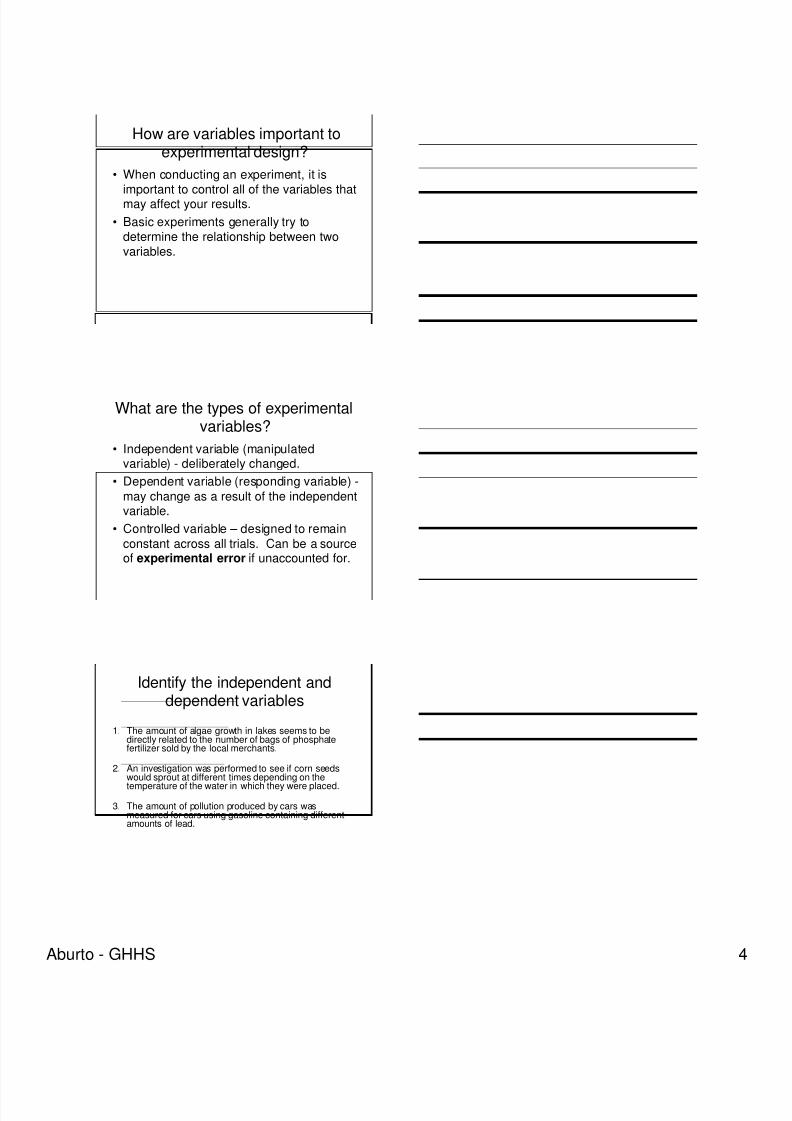
How are variables important toexperimental design?
• When conducting an experiment, it is
important to control all of the variables thatmay affect your results.
• Basic experiments generally try todetermine the relationship between twovariables.
What are the types of experimentalvariables?
• Independent variable (manipulatedvariable) - deliberately changed.
• Dependent variable (responding variable) -may change as a result of the independentvariable.
• Controlled variable – designed to remainconstant across all trials. Can be a sourceof experimental error if unaccounted for.
Identify the independent anddependent variables
1. The amount of algae growth in lakes seems to bedirectly related to the number of bags of phosphatefertilizer sold by the local merchants.
2. An investigation was performed to see if corn seedswould sprout at different times depending on thetemperature of the water in which they were placed.
3. The amount of pollution produced by cars wasmeasured for cars using gasoline containing differentamounts of lead.
8/3/2019 03 Scientific Method and Process Skills
http://slidepdf.com/reader/full/03-scientific-method-and-process-skills 5/16Aburto - GHHS
Identify the independent anddependent variables
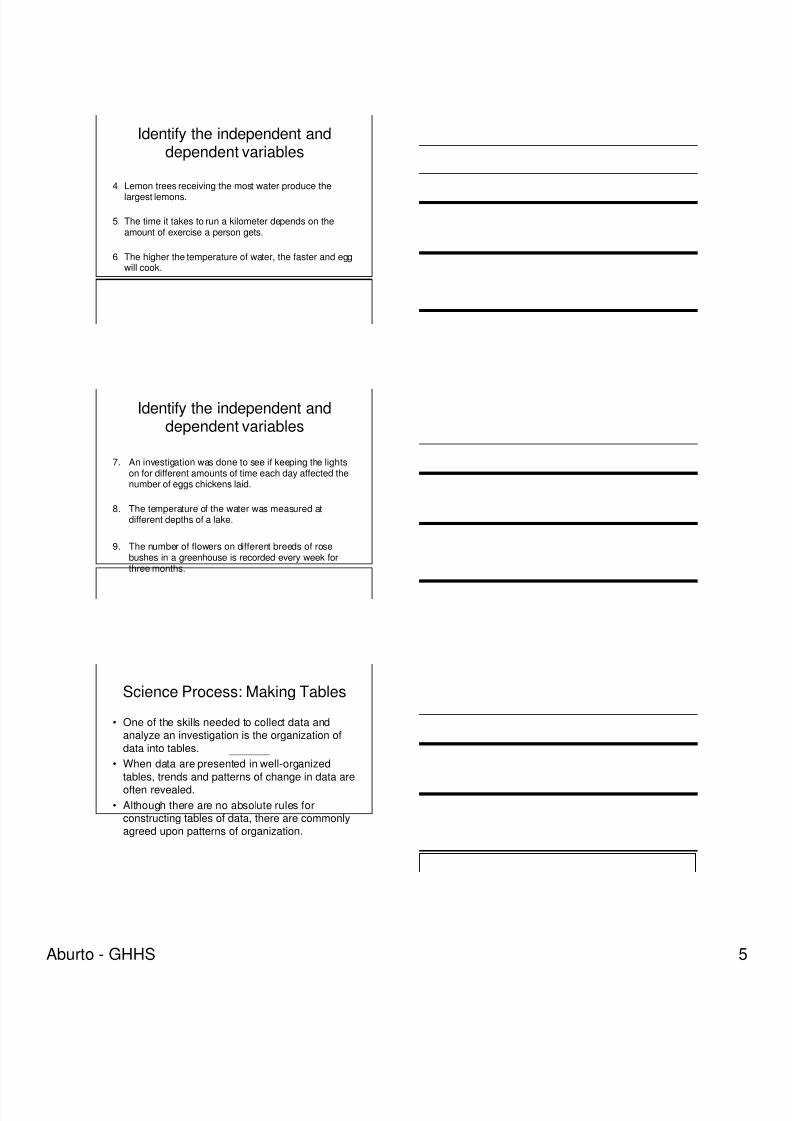
4. Lemon trees receiving the most water produce thelargest lemons.
5. The time it takes to run a kilometer depends on theamount of exercise a person gets.
6. The higher the temperature of water, the faster and eggwill cook.
Identify the independent anddependent variables
7. An investigation was done to see if keeping the lightson for different amounts of time each day affected thenumber of eggs chickens laid.
8. The temperature of the water was measured atdifferent depths of a lake.
9. The number of flowers on different breeds of rosebushes in a greenhouse is recorded every week for
three months.
Science Process: Making Tables
• One of the skills needed to collect data andanalyze an investigation is the organization ofdata into tables.
• When data are presented in well-organizedtables, trends and patterns of change in data areoften revealed.
• Although there are no absolute rules forconstructing tables of data, there are commonlyagreed upon patterns of organization.
8/3/2019 03 Scientific Method and Process Skills
http://slidepdf.com/reader/full/03-scientific-method-and-process-skills 6/16Aburto - GHHS
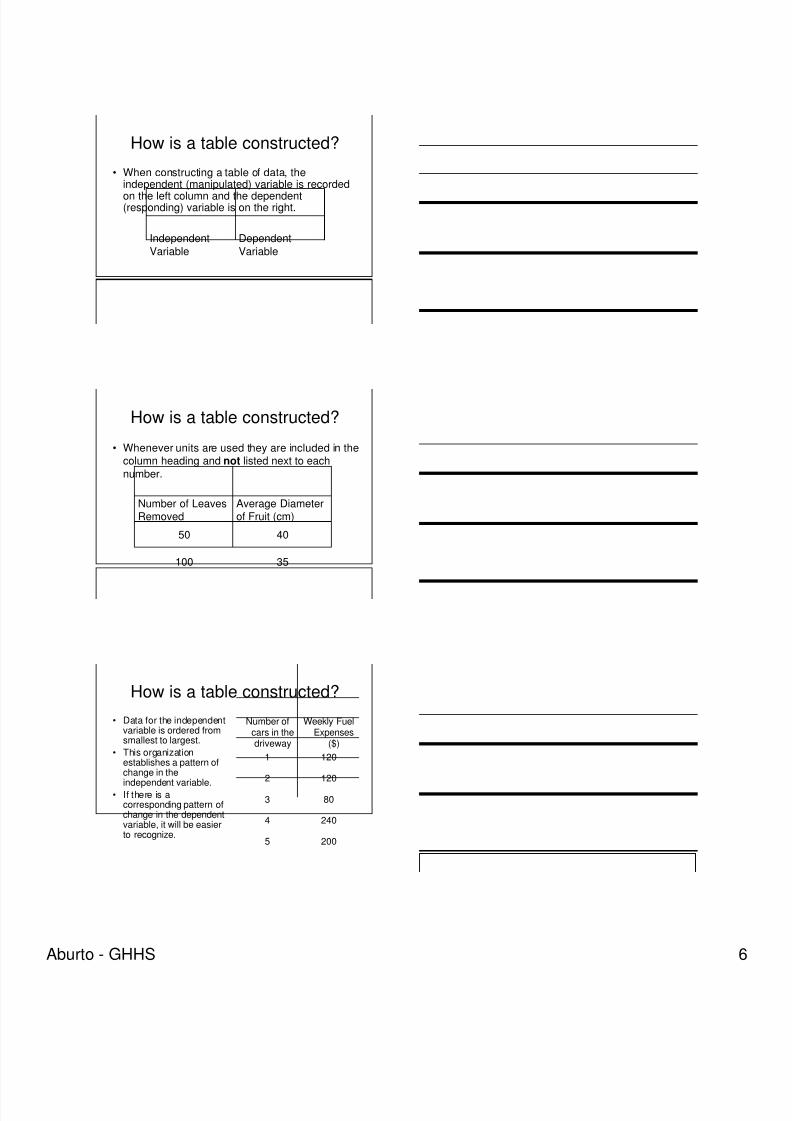
How is a table constructed?
• When constructing a table of data, theindependent (manipulated) variable is recordedon the left column and the dependent(responding) variable is on the right.
DependentVariable
IndependentVariable
How is a table constructed?
• Whenever units are used they are included in thecolumn heading and not listed next to eachnumber.
4050
35100
Average Diameterof Fruit (cm)
Number of LeavesRemoved
How is a table constructed?
• Data for the independentvariable is ordered fromsmallest to largest.
• This organization
establishes a pattern ofchange in theindependent variable.
• If there is acorresponding pattern ofchange in the dependentvariable, it will be easierto recognize.
2005
2404
803
1202
1201
Weekly FuelExpenses
($)
Number ofcars in thedriveway
8/3/2019 03 Scientific Method and Process Skills
http://slidepdf.com/reader/full/03-scientific-method-and-process-skills 7/16Aburto - GHHS
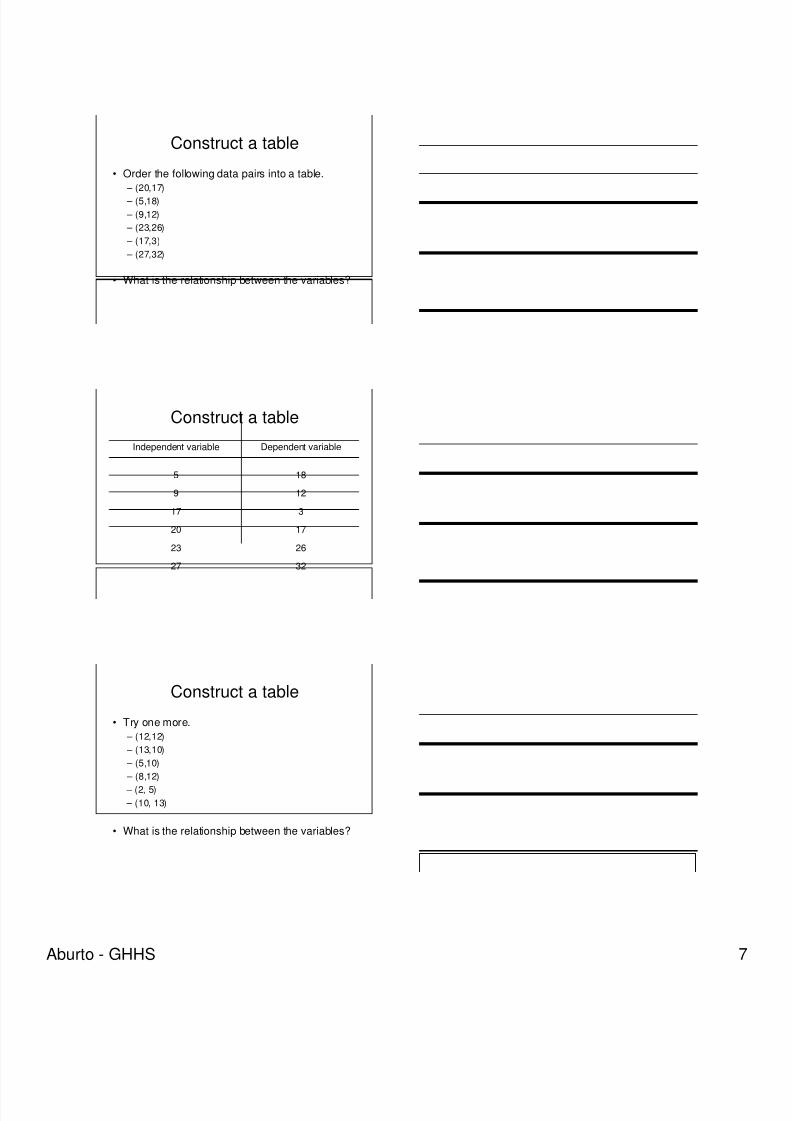
Construct a table
• Order the following data pairs into a table.
– (20,17) – (5,18)
– (9,12)
– (23,26)
– (17,3)
– (27,32)
• What is the relationship between the variables?
Construct a table
3227
2623
1720
317
129
185
Dependent variableIndependent variable
Construct a table
• Try one more.
– (12,12)
– (13,10)
– (5,10) – (8,12)
– (2, 5)
– (10, 13)
• What is the relationship between the variables?
8/3/2019 03 Scientific Method and Process Skills
http://slidepdf.com/reader/full/03-scientific-method-and-process-skills 8/16Aburto - GHHS
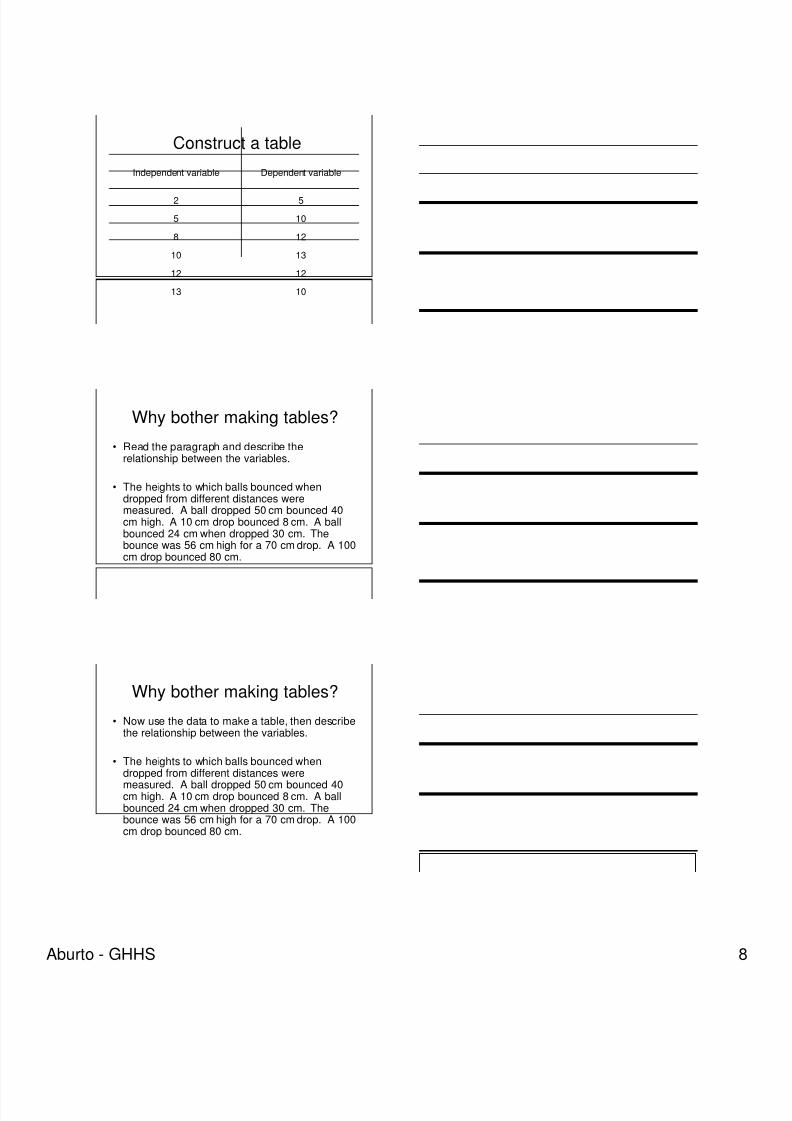
Construct a table
1013
1212
1310
128
105
52
Dependent variableIndependent variable
Why bother making tables?
• Read the paragraph and describe therelationship between the variables.
• The heights to which balls bounced whendropped from different distances weremeasured. A ball dropped 50 cm bounced 40cm high. A 10 cm drop bounced 8 cm. A ballbounced 24 cm when dropped 30 cm. Thebounce was 56 cm high for a 70 cm drop. A 100cm drop bounced 80 cm.
Why bother making tables?
• Now use the data to make a table, then describethe relationship between the variables.
• The heights to which balls bounced whendropped from different distances weremeasured. A ball dropped 50 cm bounced 40cm high. A 10 cm drop bounced 8 cm. A ballbounced 24 cm when dropped 30 cm. Thebounce was 56 cm high for a 70 cm drop. A 100cm drop bounced 80 cm.
8/3/2019 03 Scientific Method and Process Skills
http://slidepdf.com/reader/full/03-scientific-method-and-process-skills 9/16Aburto - GHHS
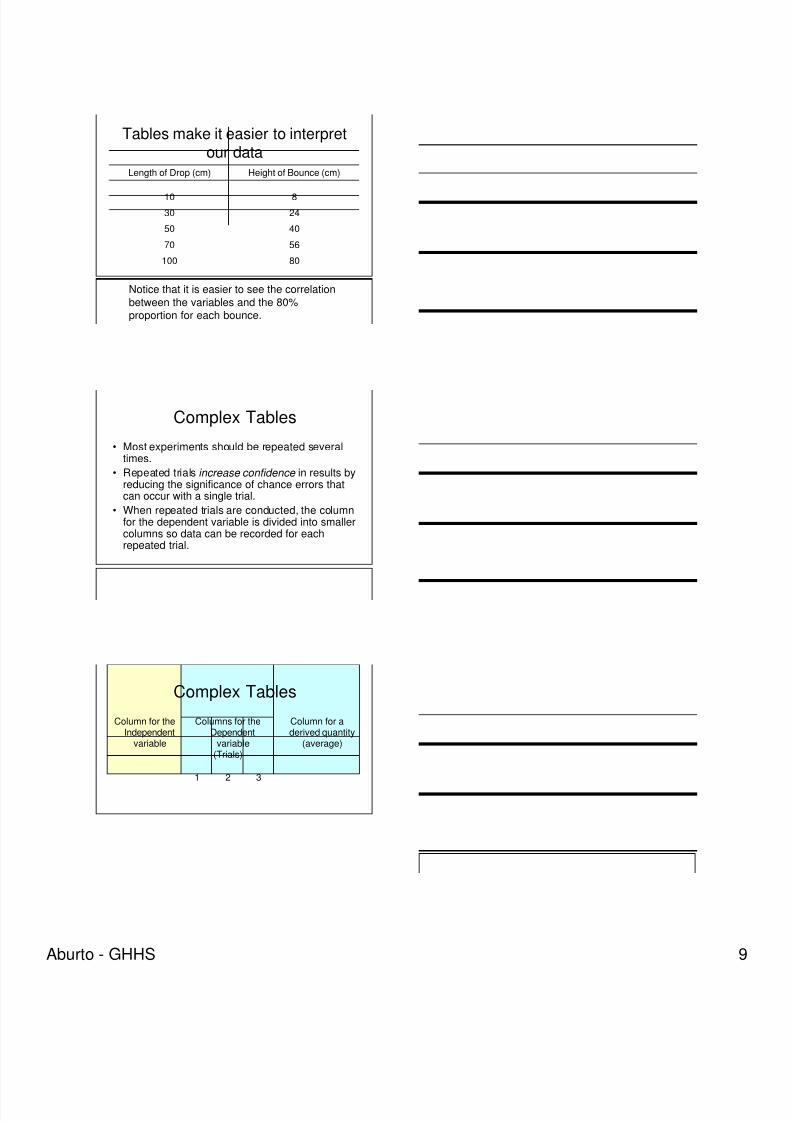
Tables make it easier to interpretour data
80100
5670
4050
2430
810
Height of Bounce (cm)Length of Drop (cm)
Notice that it is easier to see the correlationbetween the variables and the 80%proportion for each bounce.
Complex Tables
• Most experiments should be repeated severaltimes.
• Repeated trials increase confidence in results byreducing the significance of chance errors thatcan occur with a single trial.
• When repeated trials are conducted, the columnfor the dependent variable is divided into smallercolumns so data can be recorded for eachrepeated trial.
Complex Tables
321
Column for aderived quantity
(average)
Columns for theDependent
variable(Trials)
Column for theIndependent
variable
8/3/2019 03 Scientific Method and Process Skills
http://slidepdf.com/reader/full/03-scientific-method-and-process-skills 10/16Aburto - GHHS
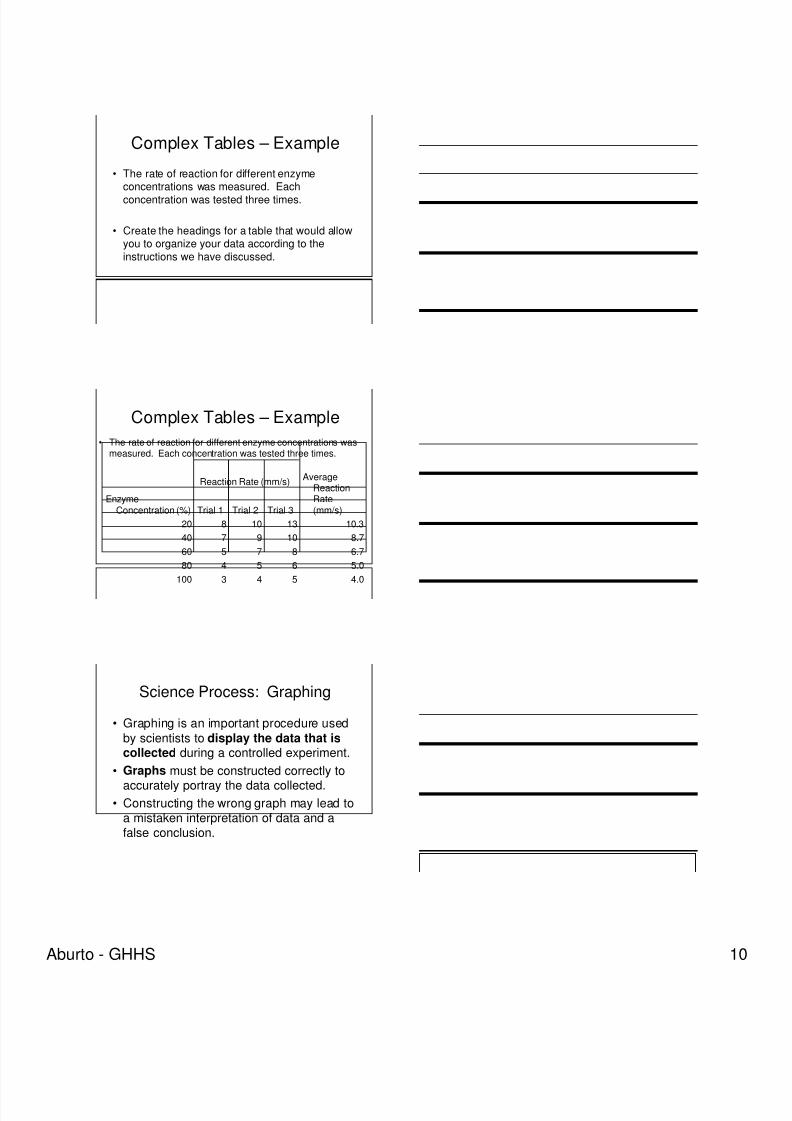
Complex Tables – Example
• The rate of reaction for different enzyme
concentrations was measured. Eachconcentration was tested three times.
• Create the headings for a table that would allowyou to organize your data according to theinstructions we have discussed.
Complex Tables – Example
• The rate of reaction for different enzyme concentrations wasmeasured. Each concentration was tested three times.
Reaction Rate (mm/s)
4.0543100
5.065480
6.787560
8.7109740
10.31310820
AverageReactionRate(mm/s)Trial 3Trial 2Trial 1
EnzymeConcentration (%)
Science Process: Graphing
• Graphing is an important procedure usedby scientists to display the data that iscollected during a controlled experiment.
• Graphs must be constructed correctly toaccurately portray the data collected.
• Constructing the wrong graph may lead toa mistaken interpretation of data and afalse conclusion.
8/3/2019 03 Scientific Method and Process Skills
http://slidepdf.com/reader/full/03-scientific-method-and-process-skills 11/16Aburto - GHHS
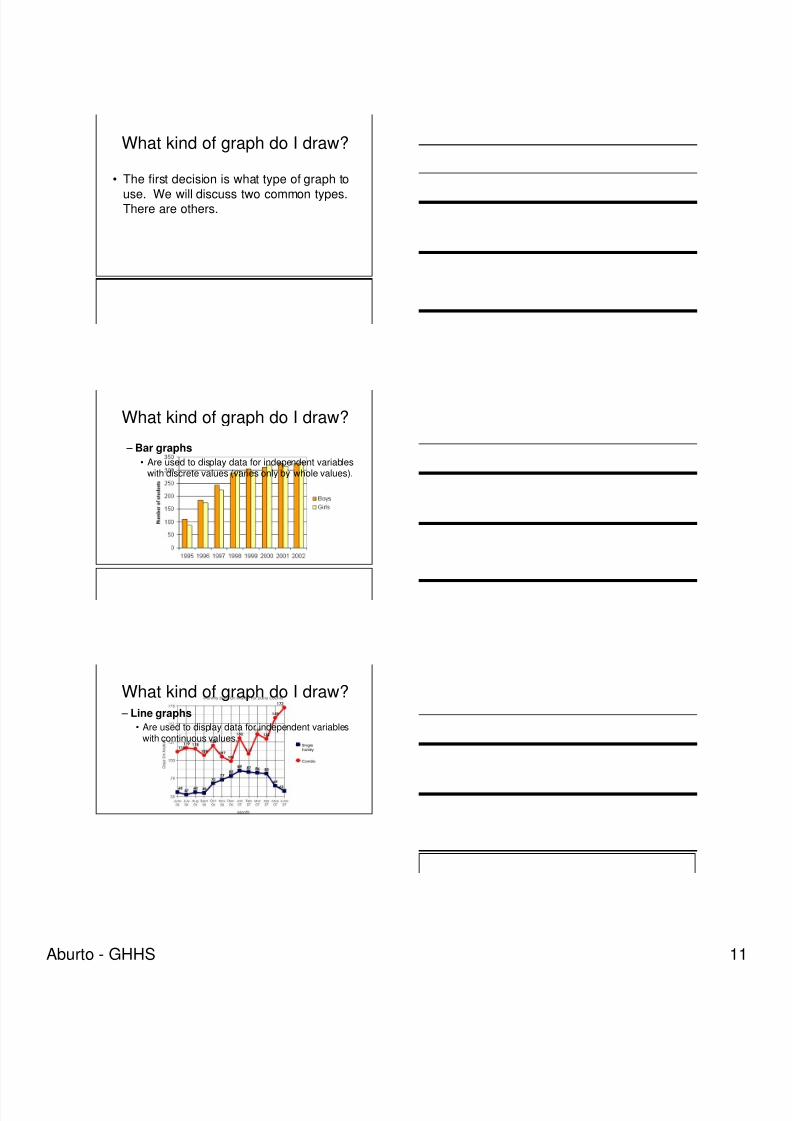
What kind of graph do I draw?
• The first decision is what type of graph to
use. We will discuss two common types.There are others.
What kind of graph do I draw?
– Bar graphs
• Are used to display data for independent variableswith discrete values (varies only by whole values).
What kind of graph do I draw? – Line graphs
• Are used to display data for independent variableswith continuous values.
8/3/2019 03 Scientific Method and Process Skills
http://slidepdf.com/reader/full/03-scientific-method-and-process-skills 12/16Aburto - GHHS
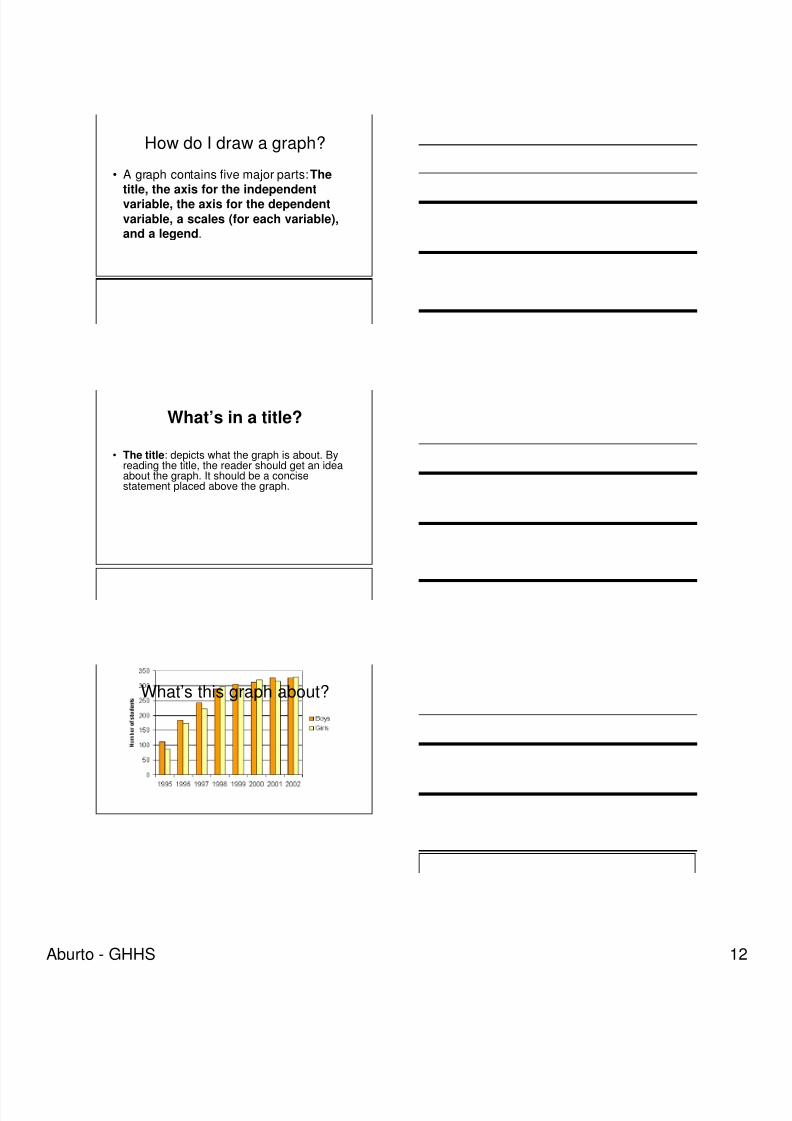
How do I draw a graph?
• A graph contains five major parts: The
title, the axis for the independentvariable, the axis for the dependent
variable, a scales (for each variable),and a legend.
What’s in a title?
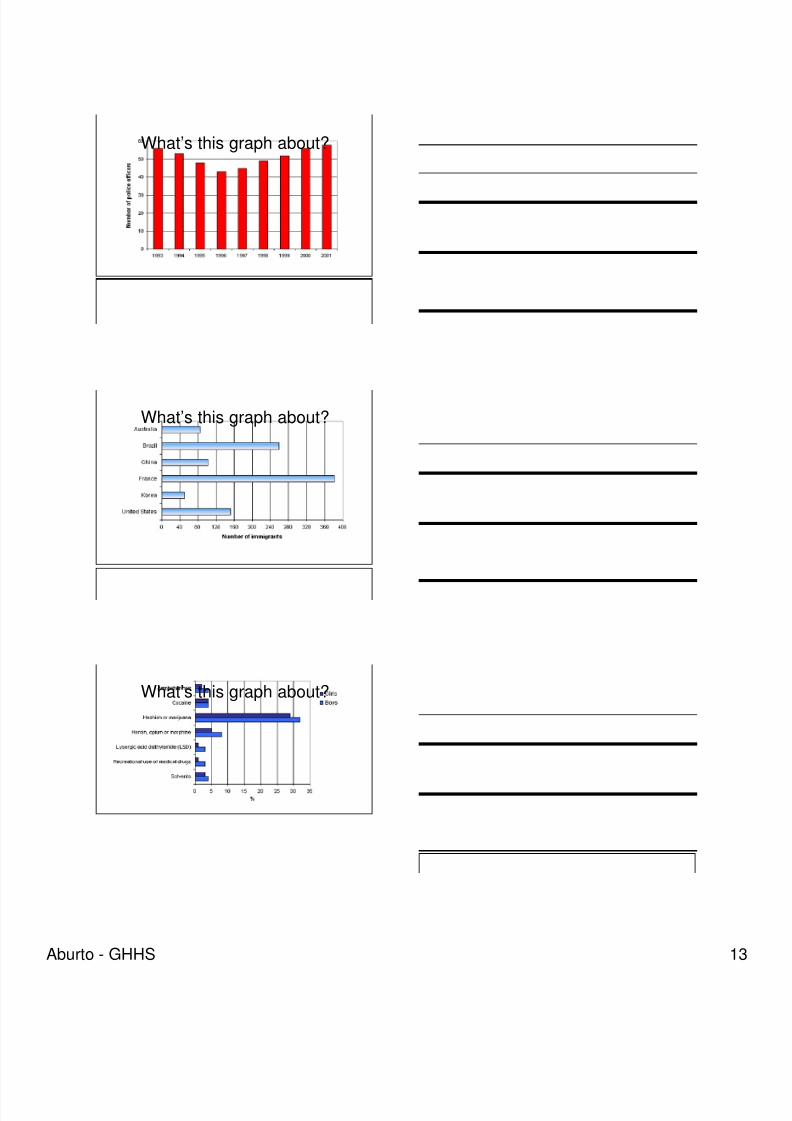
• The title: depicts what the graph is about. Byreading the title, the reader should get an ideaabout the graph. It should be a concisestatement placed above the graph.
What’s this graph about?
8/3/2019 03 Scientific Method and Process Skills
http://slidepdf.com/reader/full/03-scientific-method-and-process-skills 13/16Aburto - GHHS
What’s this graph about?
What’s this graph about?
What’s this graph about?
8/3/2019 03 Scientific Method and Process Skills
http://slidepdf.com/reader/full/03-scientific-method-and-process-skills 14/16Aburto - GHHS
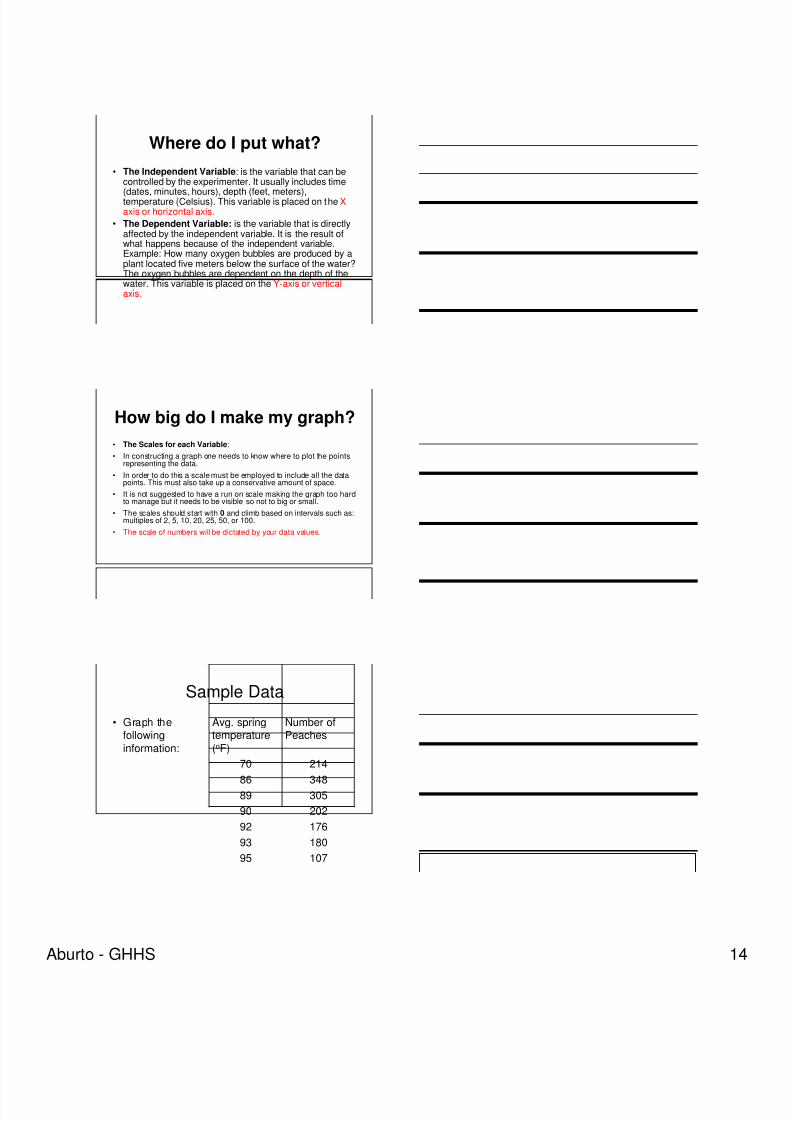
Where do I put what?
• The Independent Variable: is the variable that can becontrolled by the experimenter. It usually includes time
(dates, minutes, hours), depth (feet, meters),temperature (Celsius). This variable is placed on the Xaxis or horizontal axis.
• The Dependent Variable: is the variable that is directlyaffected by the independent variable. It is the result ofwhat happens because of the independent variable.Example: How many oxygen bubbles are produced by aplant located five meters below the surface of the water?The oxygen bubbles are dependent on the depth of thewater. This variable is placed on the Y-axis or verticalaxis.
How big do I make my graph?
• The Scales for each Variable:
• In constructing a graph one needs to know where to plot the pointsrepresenting the data.
• In order to do this a scale must be employed to include all the datapoints. This must also take up a conservative amount of space.
• It is not suggested to have a run on scale making the graph too hardto manage but it needs to be visible so not to big or small.
• The scales should start with 0 and climb based on intervals such as:multiples of 2, 5, 10, 20, 25, 50, or 100.
• The scale of numbers will be dictated by your data values.
Sample Data
• Graph thefollowinginformation:
10795
18093
17692
20290
30589
3488621470
Number ofPeaches
Avg. springtemperature(oF)
8/3/2019 03 Scientific Method and Process Skills
http://slidepdf.com/reader/full/03-scientific-method-and-process-skills 15/16Aburto - GHHS
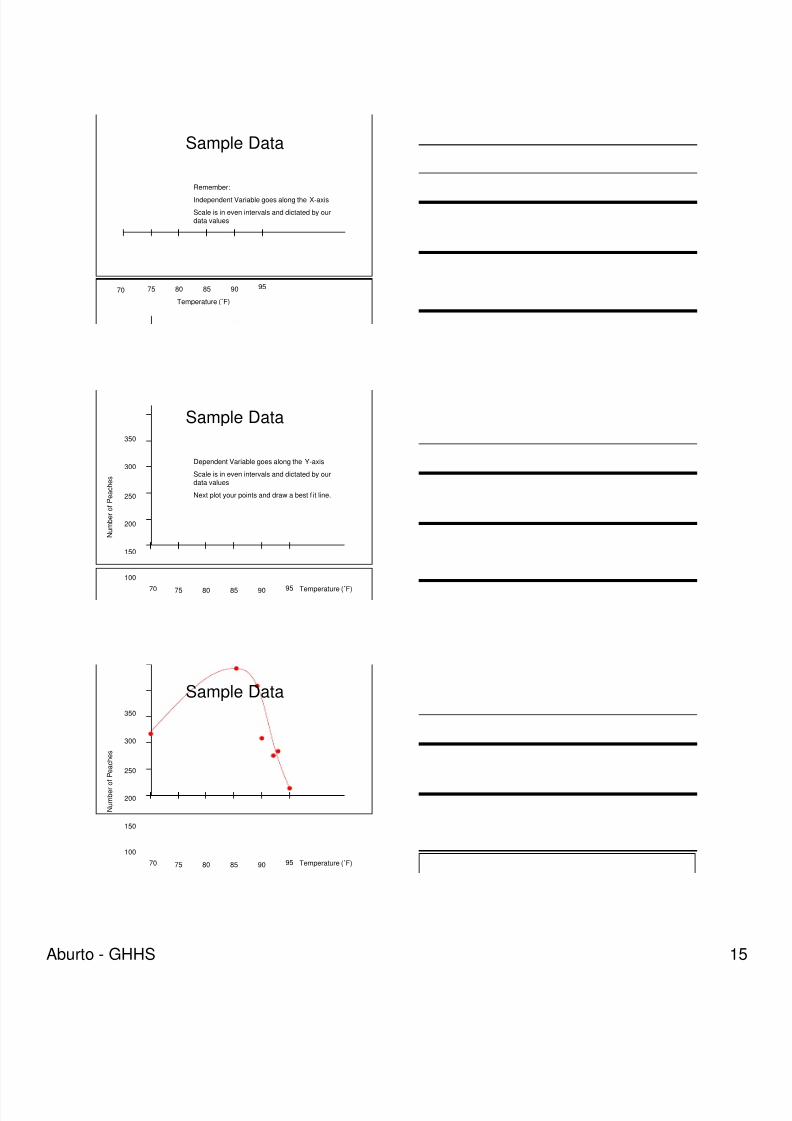
Sample Data
70 90858075 95
Temperature (˚F)
Remember:Independent Variable goes along the X-axis
Scale is in even intervals and dictated by ourdata values
Sample Data
70 90858075 95 Temperature (˚F)
150
200
250
300
350
N u m b e r o f P e a c h e s
100
Dependent Variable goes along the Y-axis
Scale is in even intervals and dictated by ourdata values
Next plot your points and draw a best f it line.
Sample Data
70 90858075 95 Temperature (˚F)
150
200
250
300
350
N u m b e r o f P e a c
h e s
100

8/3/2019 03 Scientific Method and Process Skills
http://slidepdf.com/reader/full/03-scientific-method-and-process-skills 16/16
What does your graph show?
• The Legend: is a short descriptive narrative
concerning the graph's data. It should be shortand concise and placed under the graph.
• A multi-year study of the relationship betweenaverage spring temperature and the number ofpeaches produced in a small orchard suggeststhat a temperature of 83-85 ˚F results in thehighest peach output.
Try this
• Organize the following data into a table usingthe guidelines discussed:
– A study was conducted to see if the number ofpeaches on a tree was directly proportional to thenumber of leaves on the fruit tree. One tree studiedhad 87 peaches and 257 leaves. Another tree had653 leaves and 210 peaches. A third tree had 503leaves and 165 peaches. A fourth tree had 175leaves and 59 peaches. The fifth tree gave 73peaches and 219 leaves.
• After making your table graph your data.