01.01.2015 - 31.03.2015 financial & operational · pdf filemain financial indicators ......
TRANSCRIPT

1/
01.01.2015 - 31.03.2015
Financial & Operational
Highlights

2015 January – March Financial Results
Detailed Information by Operating Segments
Contracting Group
Agri – Industry Group
Real Estate Development Group
2
Content

3
2015 January – March Financial Results
Detailed Information by Operating Segments
Contracting Group
Agri – Industry Group
Real Estate Development Group
Content

Basic Balance Sheet Items (Million TRY) 31 Dec 14 31 Mar 15 Change (%)**
Total Assets 4.955 5.346 8▲
Shareholders' Equity 1.996 2.067 4▲
Basic Income Statement Items (Million TRY)
01 Jan -
31 Mar 14
01 Jan-
31 Mar 15 Change (%)
Revenues 1.149 1.091 5▼
Gross Profit 216 115 46▼
EBITDA* 169 74 56▼
Operational Profit 140 27 81▼
Income Before Tax 172 88 49▼
Net Profit 142 85 40▼
4
Main Financial Indicators
* Earnings before interest, tax, depreciation and amortization
** In this presentation, figures expressing magnitude are rounded to integers. % change and margin figures, on the other hand, are
computed by using the exact (not-rounded) magnitude figures. For this reason, % change and margin figures that are computed by
dividing the magnitudes in the presentation may differ to some extent from those presented in the graphs and tables.

Sales Revenue
5
Consolidated (Million TRY) By Segment (Million TRY)
By Segment (%)
Contracting Agri Industry Real Estate Other
609
514
7 19
485
586
7 13
2014/3 2015/3
2014/3 2015/3
1.149 1.091
44% 54%
1% 1%
2015/3
53%
45%
1% 2%
2014/3

EBITDA
6
Consolidated EBITDA (Million TRY) EBITDA by Segment (Million TRY)
Contracting Agri Industry Real Estate Other
52
118
0
-1
18
60
-1 -4
2014/3 2015/3
2014/3 2015/3
169
74
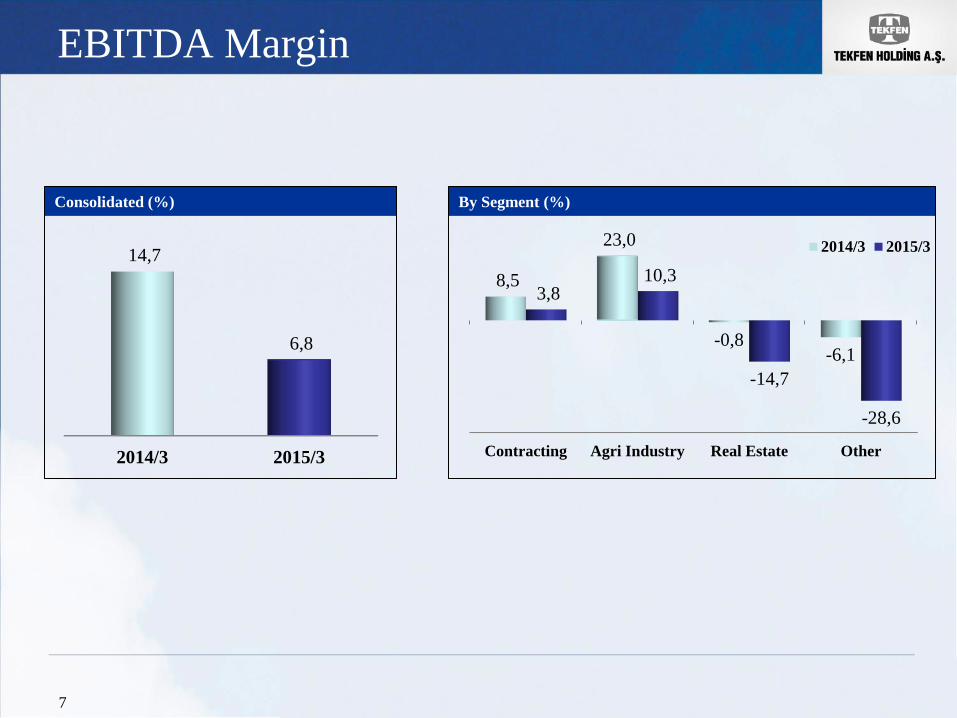
EBITDA Margin
7
Consolidated (%) By Segment (%)
Contracting Agri Industry Real Estate Other
8,5
23,0
-0,8 -6,1
3,8 10,3
-14,7
-28,6
2014/3 2015/3
2014/3 2015/3
14,7
6,8
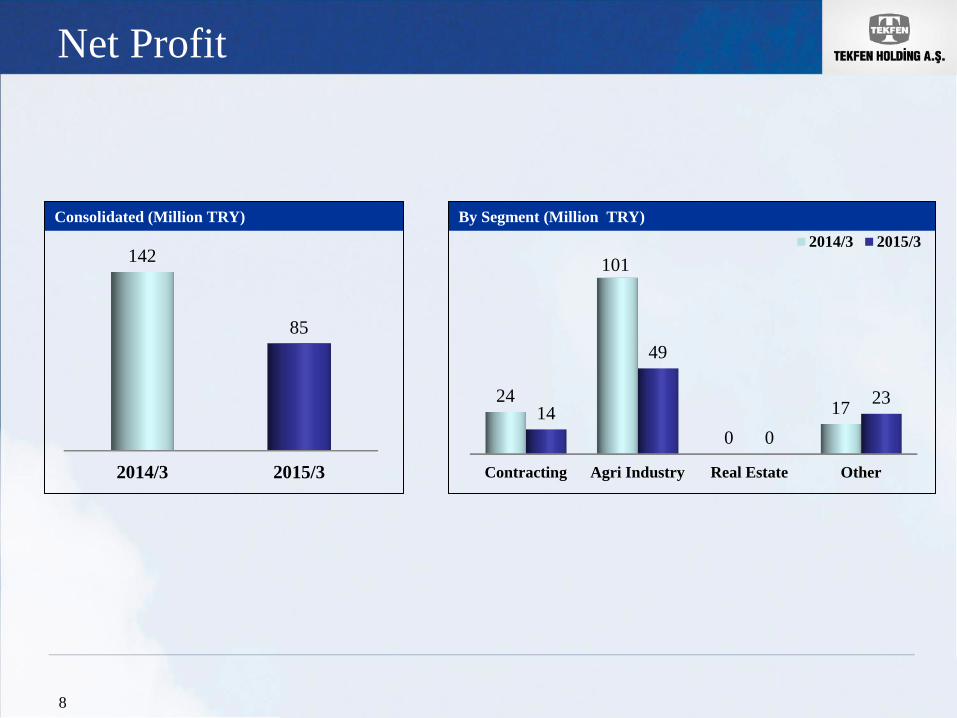
Net Profit
8
Consolidated (Million TRY) By Segment (Million TRY)
Contracting Agri Industry Real Estate Other
24
101
0
17 14
49
0
23
2014/3 2015/3
2014/3 2015/3
142
85
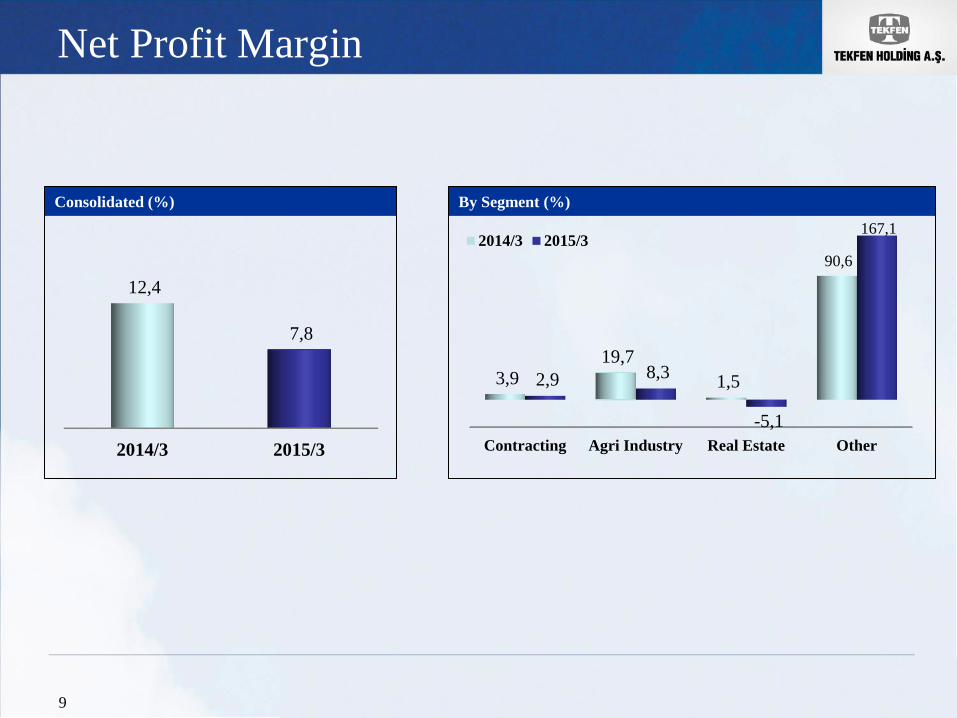
Net Profit Margin
9
Consolidated (%) By Segment (%)
Contracting Agri Industry Real Estate Other
3,9
19,7
1,5
90,6
2,9 8,3
-5,1
167,1 2014/3 2015/3
2014/3 2015/3
12,4
7,8

Net Cash Position*
10
Consolidated (Million TRY) By Segments (Million TRY)
* Net of bank loans, leasing payables, cash and cash equivalents.
Contracting Agri Industry Real Estate Other
-612
69
-91
636
-719
231
-66
664 2014/12 2015/3
2014/12 2015/3
1
109
11
2015 January – March Financial Results
Detailed Information by Operating Segments
Contracting Group
Agri – Industry Group
Real Estate Development Group
Content

Contracting Group Backlog as of
31 March 2015
12
* Not included in the consolidated revenues.
- Expected end date” refers to the mechanical completion date.
Project Location
Expected End
Dates
Revenue
Based
Completion
Rate
Remaining
Amount (US$)
Çiftehan-Pozantı Motorway Turkey 21.03.2015 327.341.066 $ 231.266.463 $ 98,1% 4.399.441
Prov. of Pipeline and Facilities Repair Services for BTC Turkey Turkey 10.09.2016 136.200.000 $ 136.200.000 $ 24,0% 103.574.328
Tüpraş - Residuum Upgrading Project of Izmit Refinery Turkey 30.04.2015 551.350.000 $ 551.350.000 $ 97,0% 16.572.850
Toros Tarım Samsun Plant Investment Project* Turkey 26.08.2015 176.743.399 $ 176.743.399 $ 73,5% 46.877.612
Supply and Fabrication of Pancakes of Top Sides Modules Turkey 30.09.2015 47.298.612 $ 47.298.612 $ 58,6% 19.598.738
Supply and Fabrication of Steel Structure Type Pancakes Turkey 20.04.2015 18.063.236 $ 18.063.236 $ 79,9% 3.626.110
Supply of Flare Tower Turkey 30.05.2015 2.919.000 $ 2.919.000 $ 0,0% 2.919.000
TANAP Project Lot3 Turkey 25.12.2017 563.959.000 $ 563.959.000 $ 0,0% 563.959.000
TURKEY TOTAL 761.527.079
New Management Office Project of SOCAR Azerbaijan 30.06.2015 385.443.450 $ 385.443.450 $ 96,9% 11.760.157
Baku Olympic Stadium Additional Completion Works Azerbaijan 30.05.2015 209.183.309 $ 209.183.309 $ 54,9% 94.399.280
Shah Deniz Stage 2 Fabrication of Offsite Facilities Azerbaijan 03.06.2017 262.365.979 $ 262.365.979 $ 17,9% 215.388.876
Shah Deniz Stage 2 Onshore Terminal Facility - Sangachal Terminal Azerbaijan 22.09.2017 349.697.605 $ 349.697.605 $ 15,6% 295.000.148
Baku Olympic Stadium Compound Area Works Azerbaijan 31.03.2015 5.892.369 $ 5.892.369 $ 99,2% 49.954
AZFEN Projects** Azerbaijan 1.713.648.541 $ 685.459.416 $ 27,7% 495.681.643
AZERBAIJAN TOTAL 1.112.280.058
Propylene Oxide Process Unit S. Arabia 30.09.2015 161.210.768 $ 161.210.768 $ 76,5% 37.927.054
SAUDI ARABIA TOTAL 37.927.054
OCP Slurry Pipeline Project Khouribga - Jorf Lasfar Morocco 31.07.2014 455.365.805 $ 455.365.805 $ 94,8% 23.795.066
MOROCCO TOTAL 23.795.066
Qatar Primary Routes North Roads Contracts 2&3 Qatar 30.09.2013 783.338.701 $ 783.338.701 $ 99,1% 6.723.166
Additional Work for North Road Project Qatar 30.06.2014 93.000.000 $ 93.000.000 $ 92,6% 6.908.324
Design and Construct Service Road Enhancement to North Road Corridor Qatar 25.06.2016 591.909.930 $ 591.909.930 $ 57,6% 251.211.449
QATAR TOTAL 264.842.939
TOTAL 2.200.372.196
Current
Contract Price
Tekfen
Portion

Contracting Group Growth
13
The backlog, which was at USD 2,4 billion as of 2014-end, decreased to USD 2.2 billion as of
end of March 2015, with the effect of the completed works in Q1.
As of end of March 2015, the backlog outside Turkey adds up to 65% of total backlog.
Backlog (US$million)
0
500
1.000
1.500
2.000
2.500
3.000
569 484 484 368 237 159 111 72 75 34 36
555 561 474 754 762
175 201 242 167 264
1.535 1.350
1.668 1.257 1.225
1.794
1.449 1.589
2.524 1.619 1.439
Abroad Turkey
744 685 726 535
501
1.694
1.461
1.740
1.333 1.259
1.830 2.005
2.150
2.998
2.373 2.200

Contracting Group Ongoing Projects
Backlog Breakdown by Regions Backlog by Project Types
14
Region Million USD
Caspian Region 1.112
Turkey 762
Middle East 303
North Africa 24
Total 2.200
Project Type Million USD
Industrial Facilities 1.107
Pipeline 691
Motorway 269
Buildings 106
Fabrication Works 26
Total 2.200
Middle
East
14%
North
Africa
1%
Caspian
51% Turkey
35%
Industrial
Facilities
50%
Pipeline
31%
Buildings
5%
Motorway
12% Fabrication
Works 1%

Contracting Group
15
Revenues &
EBITDA Margin
The EBITDA margin which was at -1.4% level by the end of 2014, is at 3.8% as of end of
March 2015. 2015 full-year EBITDA margin expectation is 6.9%
Revenues (Million US$) and EBITDA Margin (%)
545 534
1.073 1.031 1.319
1.341 1.111
1.864
2.395 2.327
2.768
2.179
5,1%
12,7% 12,0%
7,3%
8,5% 11,2%
13,2%
9,3%
5,9%
-4,3%
-1,4%
6,9%
-5%
0%
5%
10%
15%
-1.000
-500
0
500
1.000
1.500
2.000
2.500
3.000
2004 2005 2006 2007 2008 2009 2010 2011 2012 2013 2014 2015E
Ciro Marj

16
2015 January – March Financial Results
Detailed Information by Operating Segments
Contracting Group
Agri – Industry Group
Real Estate Development Group
Content

FERTILIZERS
Global Developments
In 2015/Q1, nitrogenous fertilizers’ prices were soft due to oversupply in the market. Year-on-year decrease
in average price of urea and ammonium nitrate was 13% and 11%, respectively.
Average price of ammonia decreased by 25% quarter-on-quarter.
DAP and compound fertilizer prices remained flat in Q1.
Developments in Turkey
Fertilizer consumption in Turkey increased by 1% compared to 2014/Q1.
17
17
Agri-Industry Group Developments
2015/Q1 Domestic Sales
and Market share
And
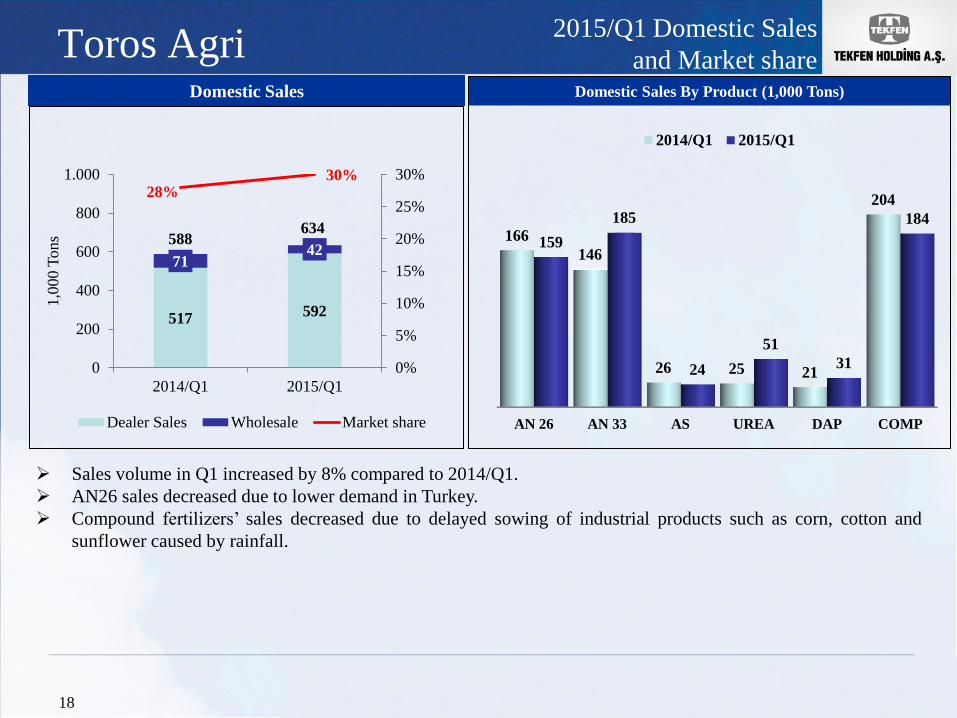
Toros Agri Domestic Sales
18
Domestic Sales By Product (1,000 Tons)
AN 26 AN 33 AS UREA DAP COMP
166
146
26 25 21
204
159
185
24
51
31
184
2014/Q1 2015/Q1
Sales volume in Q1 increased by 8% compared to 2014/Q1.
AN26 sales decreased due to lower demand in Turkey.
Compound fertilizers’ sales decreased due to delayed sowing of industrial products such as corn, cotton and
sunflower caused by rainfall.
517 592
71 42
28% 30%
0%
5%
10%
15%
20%
25%
30%
0
200
400
600
800
1.000
2014/Q1 2015/Q1
1,0
00 T
ons
Dealer Sales Wholesale Market share
634 588

Toros Agri
19
Domestic Sales Prices (USD/ton)
2015/Q1
Domestic Sales Prices
2014/Q1 2015/Q1 Change
AVERAGE PRICE (USD/TON) 359 339 -5%
AN 26 AN 33 AS UREA DAP COMP
314 355
224
441
508
390
275
319
207
376
524
392
2014/Q1 Ave. 2015/Q1 Ave.
2015/Q1
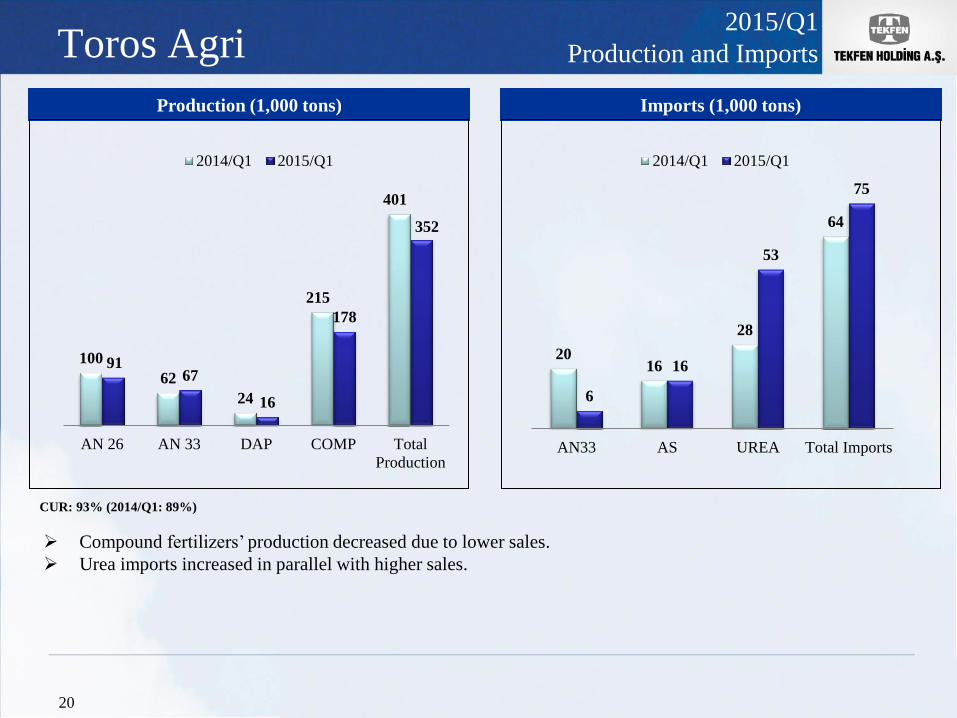
Production and Imports Toros Agri
20
Production (1,000 tons) Imports (1,000 tons)
CUR: 93% (2014/Q1: 89%)
Compound fertilizers’ production decreased due to lower sales.
Urea imports increased in parallel with higher sales.
100
62
24
215
401
91 67
16
178
352
AN 26 AN 33 DAP COMP Total
Production
2014/Q1 2015/Q1
20 16
28
64
6
16
53
75
AN33 AS UREA Total Imports
2014/Q1 2015/Q1

Agri-Industry Group Terminal Services
21
21
Handling (1,000 Tons)
Handling quantity in dry/liquid bulk-general cargo segment increased by 26% compared to 2014/Q1.
Main reason for the increase is higher cargo volume of cement clinker and bagged cement from Toros
Adana Yumurtalık Free Zone (TAYSEB).
Occupancy rate in petroleum products’ tanks was 56%. (2014/Q1: 68%)
Leased Capacity (1,000 m 3)
Petroleum Products
456 380
2014/Q1 2015/Q1
* Does not include petroleum products’ handling volume.
Dry/Liquid Bulk - General Cargo*
1.039
1.306
2014/Q1 2015/Q1
Handled Quantity and
Leased Capacity

2014/Q1 2015/Q1
92
37
9
12
Mil
lion
TR
Y
Agri Terminal
Agri-Industry Group
22
22
Agri segment’s revenue increased due higher fertilizer sales volume and higher average TRY/ton fertilizer price.
The balance between fertilizer sales prices and input prices was unfavorable for producers compared to 2014/Q1.
Profitability in agri segment deteriorated due to lower profitability in fertilizer business.
Terminal segment’s revenue and profitability improved due to higher handling volume in dry/liquid bulk-general
cargo product group and depreciation of TRY against USD.
Revenue EBITDA Net Income
2015/Q1 Revenue,
EBITDA, Net Income
2014/Q1 2015/Q1
106
45
12
15 Mil
lion
TR
Y
Agri Terminal
60
118 101
49
2014/Q1 2015/Q1
493 559
21
27
Mil
lion
TR
Y
Agri Terminal
514 586
* Average price: 2014/Q1: 789 TRY/ton – 2015/Q1: 837 TRY/ton

23
2015 January – March Financial Results
Detailed Information by Operating Segments
Contracting Group
Agri – Industry Group
Real Estate Development Group
Content

24
Real Estate Development Group
Tekfen Real Estate Dev. Inv. and Trade Co., Inc
Business Line: Investment, Development, Project Management, Asset Management
Tekfen Tourism and Management Co., Inc
Business Line: Facility Management
Florya Real Estate Inv. Const. Tourism Co., Inc
Business Line: Investment, Development
Tek
fen
Rea
l E
sta
te D
evel
op
men
t G
rou
p
Organization

25
Projects Real Estate Development Group
* Values indicate Tekfen share in total.
Project
Project
Function Location
Start Date of
Poject
End Date of
Project
Estimated Project
Size
(Million USD)
Izmir Mixed Use Mixed Use Izmir Jan.13 Dec.17 254*
Esenyurt Project Residential Istanbul May.13 Dec.16 231
Total 485
BREAKDOWN BY FUNCTION (m²)
Project Residential
Sellable/
Leasable Area
Office
Sellable/
Leasable Area
Retail
Sellable/
Leasable Area
Izmir Project* 25.000 10.000 30.000
Esenyurt Project 180.155 - 2.595

Real Estate Development Group
26
Ongoing Projects
Izmir Mixed Use
Transaction Overview:
50%-50% partnership with Rönesans Group
The largest mixed use (residential, office and shopping
mall) project in Izmir
Total Project Size : USD 508 million
Tekfen Share : 50 %
Project Summary:
Total Sellable/Leasable area (GLA) : (Tekfen share)
Shopping Mall 30,000 m²; Home Office 10,000 m² and
Residential 25,000 m²
Estimated const. period: Q3/2015 – Q4/2017
Landmark project for the city of Izmir
Investment Rationale:
Location within the new planned CBD of Izmir
High accesibility and visibility through the main arteries
Design development and engineering works are
ongoing.

Real Estate Development
27
Ongoing Projects
Esenyurt Housing Project
Overview:
Being developed on 56,800 m² land which is purchased in
May 2013
Construction permit granted on December 2013 for the
project including 1,424 residential and 25 retail units
Project Size: 231 million USD
Tekfen Share: 100%
Project Summary :
Total Sellable Space:
Housing: 180,155 m², Retail: 2,595 m²
Construction Period Start: Q1/2015 Complete: Q4/2016
The project will maintain the vision and standards that have
made Tekfen one of the pioneers in the sector, with the creation
of living space that will bring along a particularly significant
difference.
Investment Rationale:
Esenyurt property is in a sought-after area because of its
developing transportation infrastructure, the city’s growth
dynamics, and its location on the intersection between the E5
highway and TEM motorway
Project has been launched on October 30th, 2014. 458 residential units having a total area of 46.605 m² have
been sold as of March 31st 2015. Total sales is TRY116,5 million.
Disclaimer
28
Tekfen Holding A.S. (the “Company”) has prepared this presentation (the “Presentation”)
in order to provide investors with general information about the Company. The contents of
this Presentation is based on public information and on data provided by the Company
management. Neither the Company nor any of its directors, managers or employees nor
any other person shall have any liability whatsoever for any loss arising from use of this
presentation. This Presentation does not constitute an offer or invitation to purchase the
securities of the Company. Investors and prospective investors interested in the securities
of the Company are required to conduct their own independent investigations and
appraisal of the business, about financial condition of the Company and the nature of its
securities. Except for the historical information contained herein, the statements made in
this Presentation with respect to the Company’s plans, strategies, beliefs and other
prospective matters are forward-looking statements that involve risk and uncertainty that
are not under the Company’s control which may cause actual results to differ materially
from those anticipated. Except where otherwise indicated, this Presentation speaks as of
the date hereof. We undertake no duty to update or revise any forward looking statements,
whether as a result of new information, future events or otherwise.

Contact Information
29
For General Questions and Requests for Reports:
Çağlar Gülveren, CFA Investor Relations and Corporate Governance Coordinator
e-mail: [email protected]
Tel: +90 212 359 3420
Contracting Group:
Fatih Bahçeci, Tekfen Construction Vice President - Projects Planning and Control
e-mail: [email protected]
Tel: +90 212 359 3583
Agri-Industry Group:
Canan Şenkut, Chief - Investor Relations
e-mail: [email protected]
Tel: +90 212 357 0193
Real-Estate Development Group:
Ayşe Turalı, Assistant General Manager
e-mail: [email protected]
Tel: +90 212 359 3703