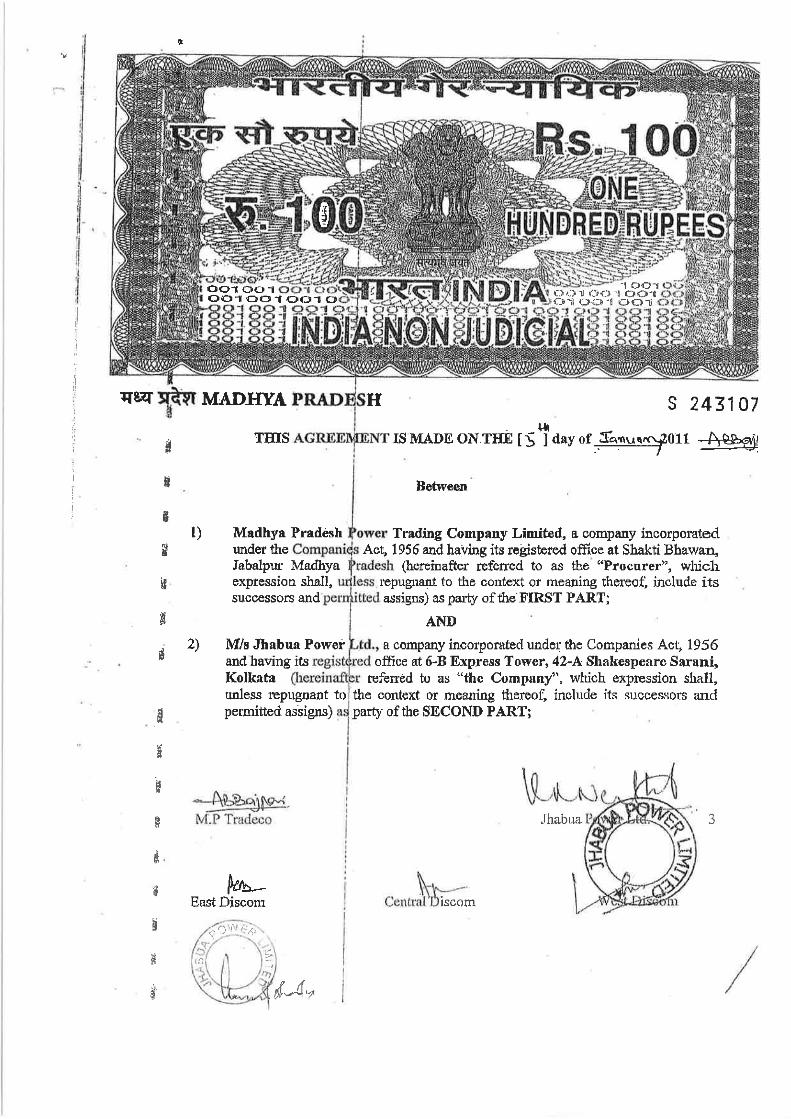
01 2 ' 1 , . , , 2 - , 3 (...
TRANSCRIPT
�������� � � ���� ����� ����� ����� ������ �� ��� ��! �"� ���# $�"��%� �� � �"� &'��(�� (��( ) *��*� ��+��(,� -�. )�/ 0�1�2'�� 1,��,., ��,2-�3(�,����(��( ) ��,2-�3 2,�� ��(���,� )�/ 1,��,., ��,2-�3 (�,� ��,2-�3(,�,�* ,�(,�� 4��/�2 '-�� '2�� ) 04�1�� '-�� 2����5 ���. 2�3,�* (��( 0�1�2'�� 1,��,., �23 (�,�6789: :;<=8> 7? 6@9AB C DE FGH 6@9AB :9IJ<= K7@B >9L M;;< NOOP A7QR:;8;S 9L A9< M; L;;< J<LTML;UT;<8 LTM L;A8J7<LH��� �VWXYVZ XW[\ ]^_`\ aVb��c 0VdVXb_] �[ef.Vghhb_]V Vi\ ^jj
�������� � � ���� ����� ����� ����� ������ �� ��� ��! �"� ���# $�"��%� �� � �"� ���� 1W[VWiW Vi\ ^jj��� 1W[VWiW �VWXYVZ (WeW[�c�5 ��,2-�3 ���. )�/ 1,��,., ��,2-�3 (�,� '2���9@J7TL 9RR7@�9:L 9@; 9L ?7::7KL�
�������� � � ���� ����� ����� ����� ������ �� ��� ��! �"� ���# $�"��%� �� � �"� ��A8J�J8I �RR:J;S �98; �RR@7�9: �98; �;Q9@BL�<� �@J<AJR:;�RR@7�9: ��HO�H�ONO NOHOEH�ONO �<� �@J<AJR:; �RR@7�9: @;A;J�;S �JS; ;88;@ 7 �R8=� �� �� �:=�� ��� �J<9JBJ��N���O����RR@7�9: NDHOEH�ON� �DHOEH�ON� TM�;A8 87 A>9<=; 7? =9T=; A7<�;@LJ7< � 87 ��� �9RR@7�9: �EHOEH�ON� O�HO�H�ON� �RR@7�;S MI �� �� 9=RT@ �J�JLJ7<6>; AT@@;<8 L898TL 7? JQR:;Q;<898J7< JL 9L ?7::7KL�'V]`Wg_XV]� (g^b\ �^abX\`\e � g^abX\`\e�QM9<BQ;<8 �7QR:;8;S �ATQ� ����E� ����E� NOO�9::9L8 9IJ<= �7QR:;8;S �ATQ� ����O OHO OHO :;;R;@ 9IJ<= �7QR:;8;S � 7LH� N�O�� OHO OHO6789: �9J: J<; � �<A:TSJ<= � � �9J:K9ILJSJ<=� J< FQ N�HN� OHO O HO�J<9JBJ 87 R:9<8 KJ8> AT@�; J< FQ � HO OHO OHO7 7? �@JS=;L � 7LH� � � NOOc�� 1]We�\� V]\ _[e\] g^[�`]_g`W^[
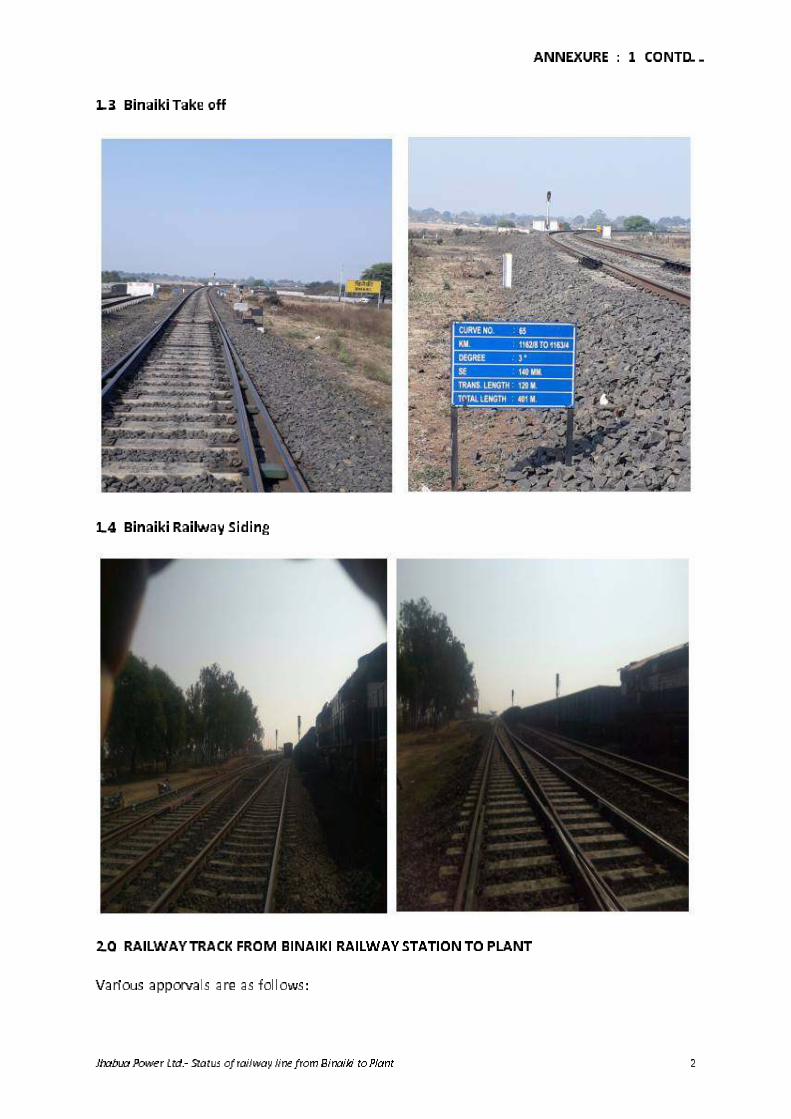
�������� � � ���� ����� ����� ����� ������ �� ��� ��! �"� ���# $�"��%� �� � �"� �c�c �]\V hV� d\\[ X\�\XX\e j^] `]Vgi XVZW[�
�������� � � ���� ����� ����� ����� ������ �� ��� ��! �"� ���# $�"��%� �� � �"� �c�� �VWXYVZ `]Vgi XVZW[� Y^]i W� _[e\]YVZc�� �VWXYVZ �WeW[� YW`hW[ bXV[` hV� d\\[ W[W`WV`\e
�� � �� �� �� � � � � � � � �� � �� ��� ��� �� �� �� �� � �� � � � �! �" � �� � # $ �" � �% � � � � �" � &
'( )* +, -. /0 * 12 3 4. 56 -. * 78 9 0 - : 9; :* 8 < 78 * + = 0 1 9 0 <0 /* , - 9 1 /8 9 0 - : 9; 2 0 5 0 1>
REPORT
ON
TRAFFIC STUDY INCLUDING IMPACT ASSESSMENT DUE TO TRANSPORTATION OF
COAL BY ROAD (1.86 KM)
FROM BINAIKI RAILWAY SIDING
TO THERMAL POWER PLANT
(1 X 600 MW) AT
VILLAGE BARELA AND GORAKHPUR TEHSIL GHANSOR, DISTRICT SEONI,
MADHYA PRADESH
OF
M/s JHABUA POWER LTD.
DECEMBER, 2017 (Issue 01, Rev. 0)
Prepared by:
M IN M E C C ON S UL T A NC Y PV T . LT D . A- 1 2 1 , P a r y av a r a n C o mp l e x, IG N O U R o a d , N e w D e l h i – 1 10 0 3 0
Ph : 29 53 47 77, 29 53 22 36, 29 53 58 9 1 ; Fa x: +9 1- 11- 29 53 25 68 E ma i l : mi n _ me c @ v s n l . c o m; W e b s i t e : ht tp: / /www.minmec.co. in
An ISO 9001:2008 approved company
EEssttbb.. 11998833
ANNEXURE : 2
Min Mec Consultancy Pvt. Ltd.
Assessment of Impacts Due to Transportation of Coal for Jhabua Power Plant i
CONTENTS
Sl. No. Description Page No.
1.0 Introduction 1
1.1 Description of proposed route 2
2.0 Assessment of proposed road for its categorisation & carrying capacity as per IRC 64(1990)-guidelines on capacity of roads in rural area
2
2.1 Road width measurement 2
2.2 Traffic volume carrying capacity of the road 4
2.3 Traffic survey and current vehicle volume 9
2.4 Additional traffic on proposed route 9
2.5 Growth in existing traffic 10
3.0 Collection of environmental data 12
3.1 Ambient air quality 12
3.2 Noise environment 13
4.0 Impact due to traffic 13
4.1 Ambient air quality 13
4.2 Ambient noise 16
4.3 Human health 17
4.4 Ecology 20
5.0 Observations 21
6.0 Conclusion and recommendations 23
Min Mec Consultancy Pvt. Ltd.
Assessment of Impacts Due to Transportation of Coal for Jhabua Power Plant ii
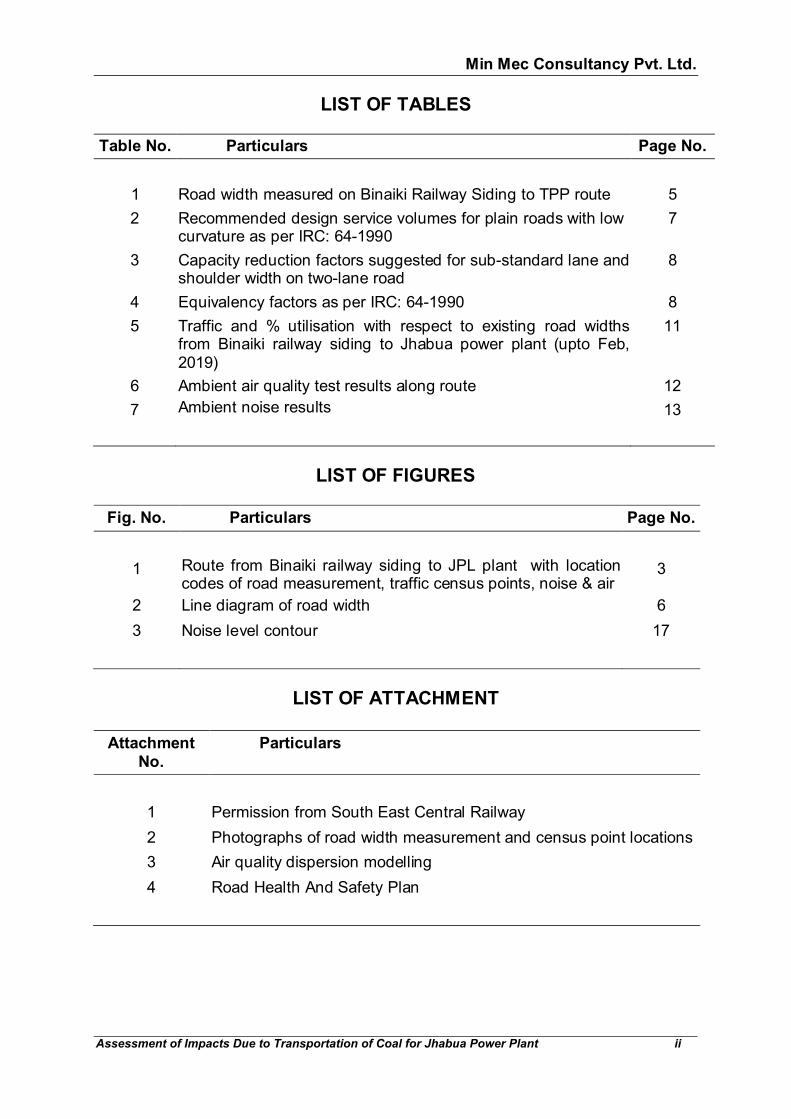
LIST OF TABLES
Table No. Particulars Page No.
1 Road width measured on Binaiki Railway Siding to TPP route 5
2 Recommended design service volumes for plain roads with low curvature as per IRC: 64-1990
7
3 Capacity reduction factors suggested for sub-standard lane and shoulder width on two-lane road
8
4 Equivalency factors as per IRC: 64-1990 8
5 Traffic and % utilisation with respect to existing road widths from Binaiki railway siding to Jhabua power plant (upto Feb, 2019)
11
6 Ambient air quality test results along route 12
7 Ambient noise results 13
LIST OF FIGURES
Fig. No. Particulars Page No.
1 Route from Binaiki railway siding to JPL plant with location codes of road measurement, traffic census points, noise & air
3
2 Line diagram of road width 6
3 Noise level contour 17
LIST OF ATTACHMENT
Attachment No.
Particulars
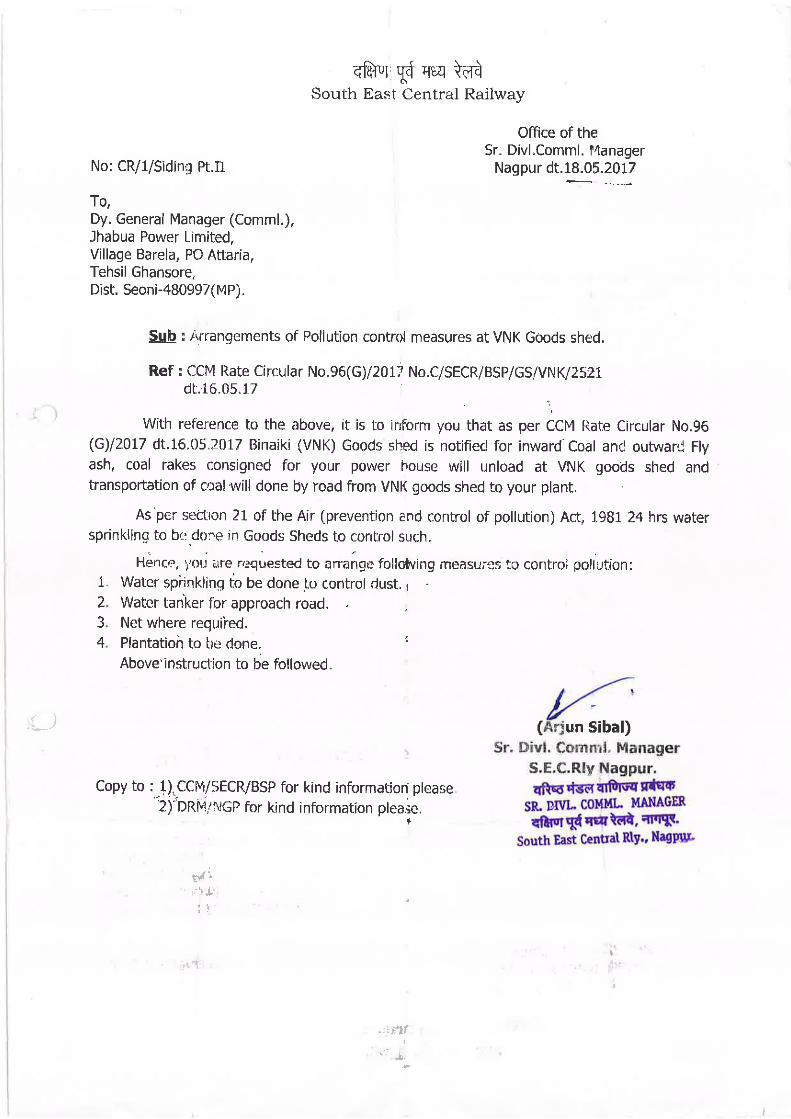
1 Permission from South East Central Railway
2 Photographs of road width measurement and census point locations
3 Air quality dispersion modelling
4 Road Health And Safety Plan
Min Mec Consultancy Pvt. Ltd.
Assessment of Impacts Due to Transportation of Coal for Jhabua Power Plant iii
ABBREVIATIONS
DSV - Design Service Volume
JPL - Jhabua Power Limited
SECR - South East Central Railway
PPA - Power Purchase Agreement
MC - Maximum Capacity
HMV - Heavy Motor Vehicles
LMV - Light Motor Vehicles
PWD - Public Works Department
IRC - Indian Road Congress
TPD - Tonnes per Day
MW - Mega Watt
PCU - Passenger Car Units
MoEF&CC - Ministry of Environment, Forest and Climate Change
US EPA - United States Environment Protection Agency
MMRDL - Min Mec R&D Laboratory
Min Mec Consultancy Pvt. Ltd.
Assessment of Impacts Due to Transportation of Coal for Jhabua Power Plant 1
1.0 INTRODUCTION
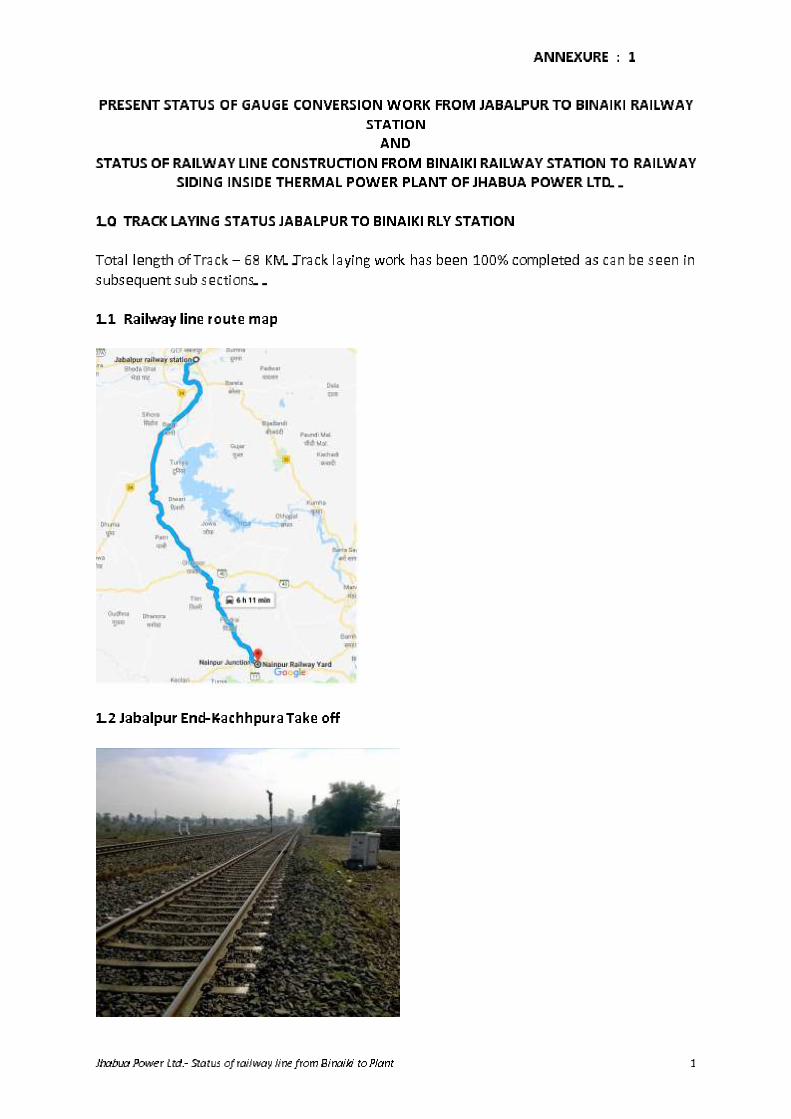
M/s Jhabua Power Limited (JPL) has installed coal based thermal power plant of 1x 600 MW capacity at Village- Barela & Gorakhpur, Tehsil Ghansore, District Seoni, Madhya Pradesh. The plant had been granted Environment Clearance vide letter No J-13012/105/2008-IA.II (T), dated 17.02.2010. As per the EC letter, Coal requirement is 3.2 MTPA. The requirement of the coal shall be met through SECL mines (2.75 MTPA) and rest 0.45 MTPA from open market. Point no. 7 of specific condition of EC letter, states that “in case of any deviation or alteration in the project proposed including coal transportation system from those submitted to this Ministry for clearance, a fresh reference should be made to the Ministry to assess the adequacy of the condition(s) imposed and to add additional environmental protection measures required, if any”. M/s JPL had proposed the transportation of coal from coal pit-head to plant site by way of railway. Since the railway line had not become operational concurrent to the power plant operation till 2015, in order to meet the coal requirement, amendment in EC was obtained vide letter No J-13012/105/2008-IA.II (T), dated 15.02.2016 for temporary transportation of coal by road for a limited period of two years i.e till 15.02.2018, from Gosalpur (GSPR) and Garha sidings (GGGS) to power plant.
Railway track from Jabalpur to Binaiki railway station has been completed now. But railway track from Binaiki till plant premises is under construction (3 km with curves). The work has been delayed due to delay in approval of Engineering Scale Plan (ESP) by South East Central Railway (SECR), land acquisition, difficulties in completing the civil work of four bridges and adverse fund availability. The same is now expected to be completed by February 2019. Since the railway line has been converted to broad gauge from Ghansore and Garha to Binaiki, coal unloaded at Binaiki siding is & will be transported by covered hyvas/trucks to the plant. This new development reduces the truck transportation distance from 149 km (for which amendment was granted) to 1.86 km. This 1.86 km is the last stretch of the same route for which amendment had been granted. Jhabua Power Ltd. is having long term PPAs (power purchase agreement) with Madhya Pradesh (210 MW) and Kerala (215 MW). Therefore, sustained coal supply is required to be maintained to ensure reliable power supply to these two states. Keeping in view of the above facts, M/s JPL had applied on 27.10.2017 for grant of extension of Environmental clearance for coal transportation by road from Binaiki siding till plant premises for a further period of one year i.e till 28th February 2019. MOEF&CC has raised queries on 16.11.2017, in line with which this report has been prepared.
The following studies were carried out:
Min Mec Consultancy Pvt. Ltd.
Assessment of Impacts Due to Transportation of Coal for Jhabua Power Plant 2
(i) Traffic and road surveys for assessment of carrying capacity on the Binaiki-Plant route
(ii) Data collection of air quality and noise levels along the Binaiki-Plant route
(iii) Air quality modelling for impact assessment of incremental ground level concentration of air pollutants.
(iv) Identification of villages within 100 m of the proposed routes (v) Survey of flora.
All the above have been described in subsequent sections.
The road width measurement and traffic surveys were carried out by staff of
Min Mec Consultancy Pvt. Ltd. while collection of air quality, noise levels and listing of vegetation along the route has been carried out by staff of M/s Jhabua Power Limited between 17th November - 9th December, 2017. The air quality prediction modelling and preparation of report has been done out by staff of M/s Min Mec Consultancy Pvt. Ltd., New Delhi.
1.1 Description of Proposed Route The coal transportation to Jhabua Power Plant will be from coal pit-head of
SECL to Binaiki railway siding through railway and from there, it will be transported by road through Hyvas/trucks to the plant premises. Permission from South East Central Railway for the same has been taken and attached as Attachment 1. The length of this road is 1.86 km. 3.2 MTPA of coal i.e 8767 T/Day of coal will be transported from pit head to Binaiki Railway siding and from there to the plant by road.
The coal transportation from Binaiki railway siding will be by 25 Tonne capacity Hyvas/Trucks. There would be to & fro movement of 702 coal carrying Hyvas/Trucks per day from Binaiki railway siding to plant premises. It should be noted that the term “coal carrying Hyvas/Trucks” as depicted above is used for both loaded and unloaded Hyvas/trucks. The coal received from MCL and SECL Mines is of good quality having average GCV of about 3500 kcal/kg and sulphur content of 0.44%.
2.0 ASSESSMENT OF PROPOSED ROAD FOR ITS CATEGORISATION &
CARRYING CAPACITY AS PER IRC 64(1990)-GUIDELINES ON CAPACITY OF ROADS IN RURAL AREA
2.1 Road width measurement
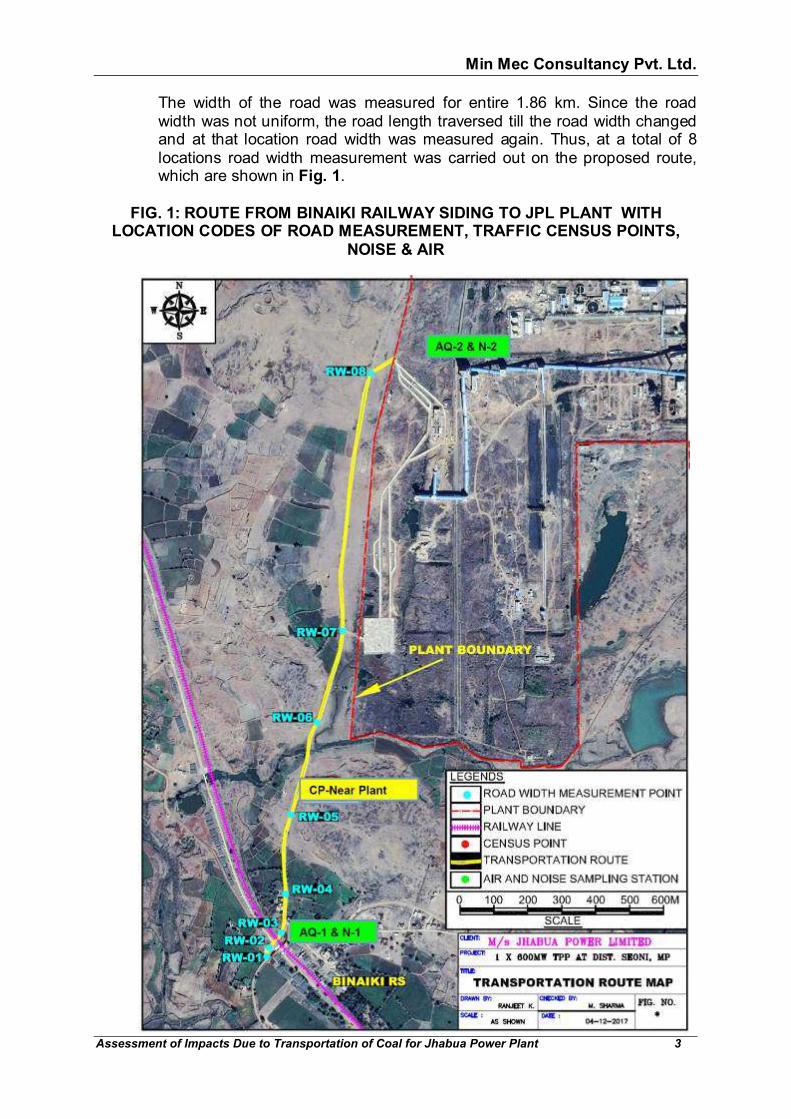
The proposed route from Binaiki railway siding to JPL’s Power plant is 1.86 km, which can be seen in Fig. 1.
Min Mec Consultancy Pvt. Ltd.
Assessment of Impacts Due to Transportation of Coal for Jhabua Power Plant 3
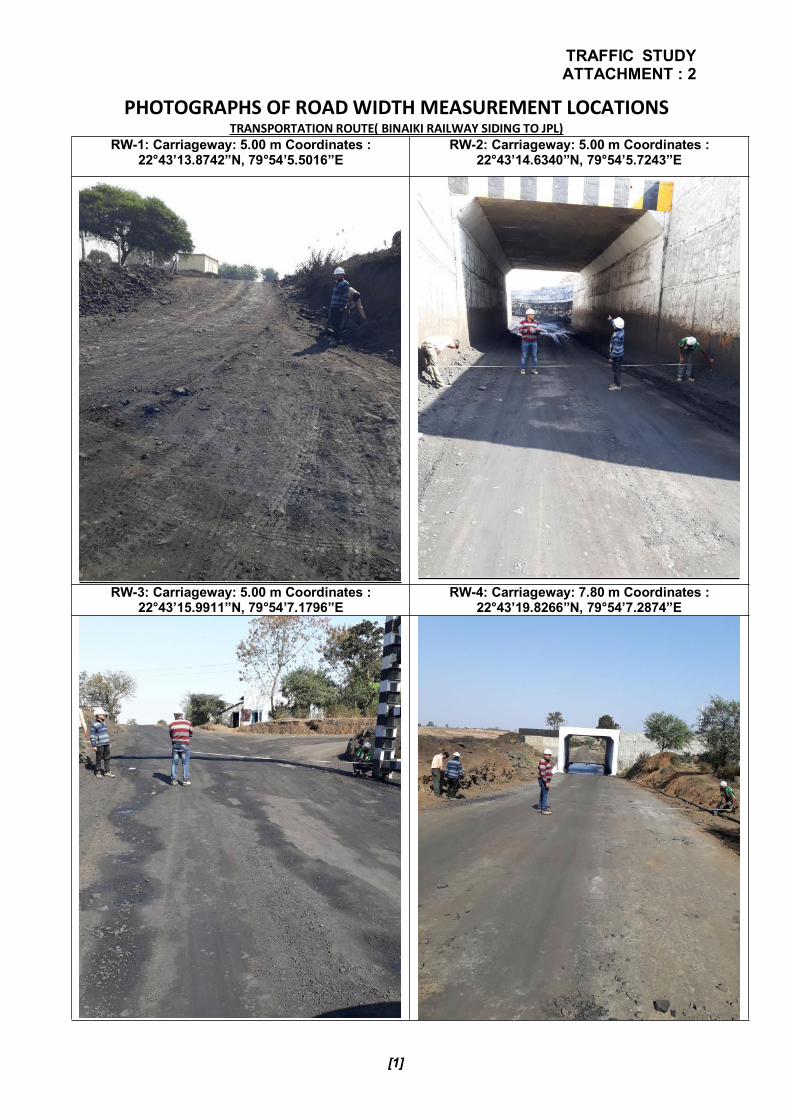
The width of the road was measured for entire 1.86 km. Since the road width was not uniform, the road length traversed till the road width changed and at that location road width was measured again. Thus, at a total of 8 locations road width measurement was carried out on the proposed route, which are shown in Fig. 1.
FIG. 1: ROUTE FROM BINAIKI RAILWAY SIDING TO JPL PLANT WITH
LOCATION CODES OF ROAD MEASUREMENT, TRAFFIC CENSUS POINTS, NOISE & AIR
Min Mec Consultancy Pvt. Ltd.
Assessment of Impacts Due to Transportation of Coal for Jhabua Power Plant 4
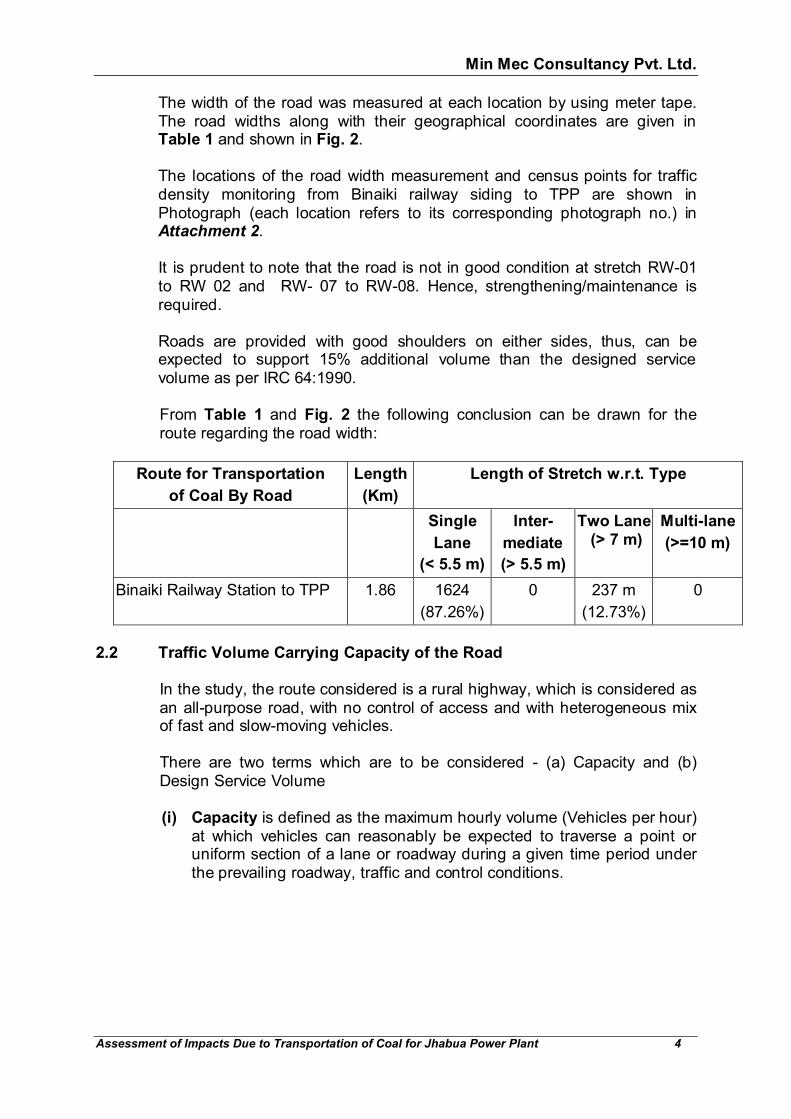
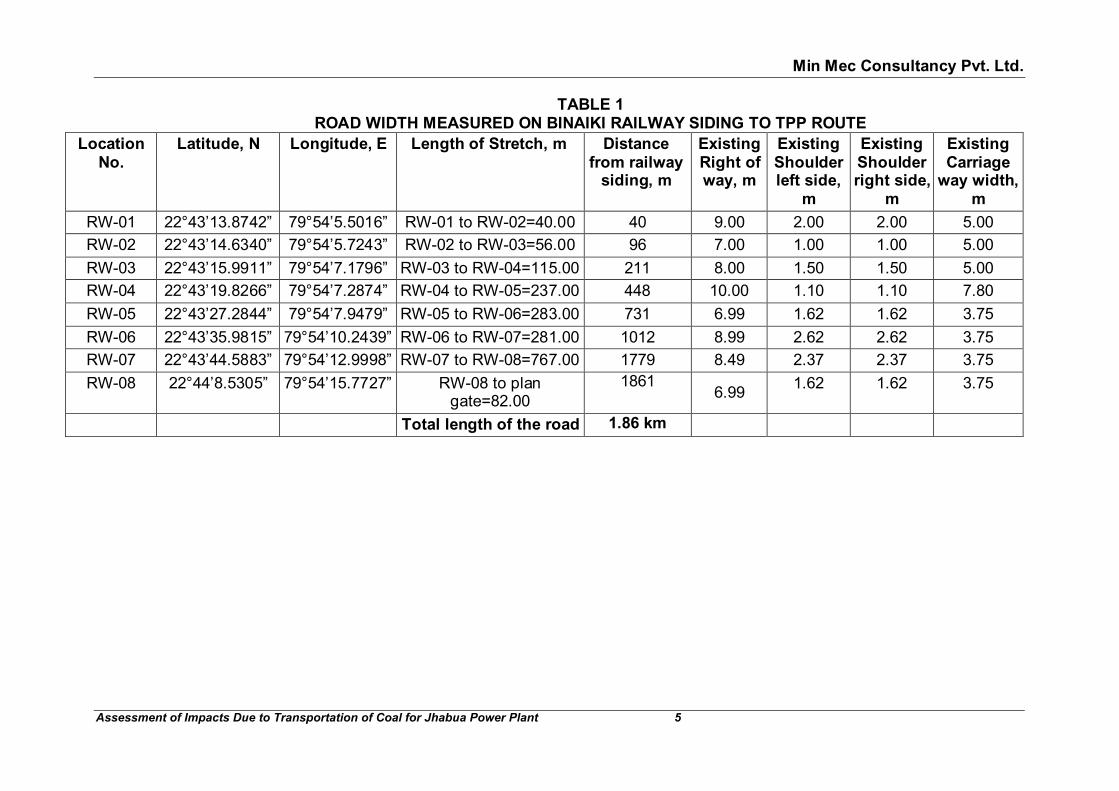
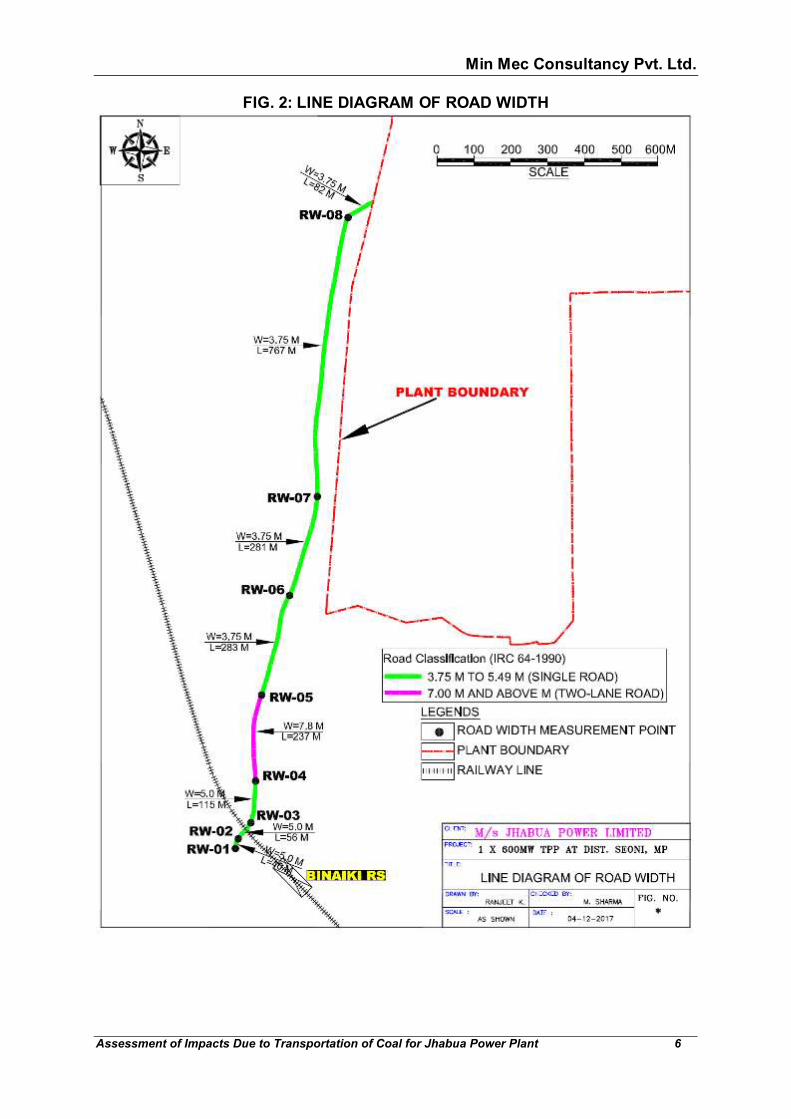
The width of the road was measured at each location by using meter tape. The road widths along with their geographical coordinates are given in Table 1 and shown in Fig. 2.
The locations of the road width measurement and census points for traffic
density monitoring from Binaiki railway siding to TPP are shown in Photograph (each location refers to its corresponding photograph no.) in Attachment 2.
It is prudent to note that the road is not in good condition at stretch RW-01 to RW 02 and RW- 07 to RW-08. Hence, strengthening/maintenance is required.
Roads are provided with good shoulders on either sides, thus, can be
expected to support 15% additional volume than the designed service volume as per IRC 64:1990.
From Table 1 and Fig. 2 the following conclusion can be drawn for the route regarding the road width:
Route for Transportation
of Coal By Road
Length
(Km)
Length of Stretch w.r.t. Type
Single
Lane
(< 5.5 m)
Inter-
mediate
(> 5.5 m)
Two Lane (> 7 m)
Multi-lane
(>=10 m)
Binaiki Railway Station to TPP 1.86 1624
(87.26%)
0 237 m
(12.73%)
0
2.2 Traffic Volume Carrying Capacity of the Road
In the study, the route considered is a rural highway, which is considered as an all-purpose road, with no control of access and with heterogeneous mix of fast and slow-moving vehicles. There are two terms which are to be considered - (a) Capacity and (b) Design Service Volume
(i) Capacity is defined as the maximum hourly volume (Vehicles per hour)
at which vehicles can reasonably be expected to traverse a point or uniform section of a lane or roadway during a given time period under the prevailing roadway, traffic and control conditions.
Min Mec Consultancy Pvt. Ltd.
Assessment of Impacts Due to Transportation of Coal for Jhabua Power Plant 5
TABLE 1 ROAD WIDTH MEASURED ON BINAIKI RAILWAY SIDING TO TPP ROUTE
Location No.
Latitude, N Longitude, E Length of Stretch, m Distance from railway
siding, m
Existing Right of way, m
Existing Shoulder left side,
m
Existing Shoulder right side,
m
Existing Carriage
way width, m
RW-01 22°43’13.8742” 79°54’5.5016” RW-01 to RW-02=40.00 40 9.00 2.00 2.00 5.00
RW-02 22°43’14.6340” 79°54’5.7243” RW-02 to RW-03=56.00 96 7.00 1.00 1.00 5.00
RW-03 22°43’15.9911” 79°54’7.1796” RW-03 to RW-04=115.00 211 8.00 1.50 1.50 5.00
RW-04 22°43’19.8266” 79°54’7.2874” RW-04 to RW-05=237.00 448 10.00 1.10 1.10 7.80
RW-05 22°43’27.2844” 79°54’7.9479” RW-05 to RW-06=283.00 731 6.99 1.62 1.62 3.75
RW-06 22°43’35.9815” 79°54’10.2439” RW-06 to RW-07=281.00 1012 8.99 2.62 2.62 3.75
RW-07 22°43’44.5883” 79°54’12.9998” RW-07 to RW-08=767.00 1779 8.49 2.37 2.37 3.75
RW-08 22°44’8.5305” 79°54’15.7727” RW-08 to plan gate=82.00
1861 6.99
1.62 1.62 3.75
Total length of the road 1.86 km
Min Mec Consultancy Pvt. Ltd.
Assessment of Impacts Due to Transportation of Coal for Jhabua Power Plant 6
FIG. 2: LINE DIAGRAM OF ROAD WIDTH
Min Mec Consultancy Pvt. Ltd.
Assessment of Impacts Due to Transportation of Coal for Jhabua Power Plant 7
(ii) Design Service Volume is defined as the maximum hourly volume (Vehicles per hour) at which vehicles can reasonably be expected to traverse a point or uniform section of a lane or roadway during a given time period under the prevailing roadway, traffic and control conditions while maintaining a designated level of service.
Under normal circumstance, use of Level of Service “B” (available from A to
F) is considered adequate for the design of rural highways. At this level, volume of traffic will be around 0.5 times the maximum capacity and this is taken as the “design service volume” for the purpose of adopting design values.
The recommended design service volume for plain roads with low curvature
(0-50 degrees/km), as is the case in the study area, is given in Table 2.
TABLE 2 RECOMMENDED DESIGN SERVICE VOLUMES FOR PLAIN ROADS
WITH LOW CURVATURE AS PER IRC: 64-1990
Type of Road
Description Recommended Design Service
Volume in PCU/day
Single Lane Roads
A single lane bi-directional road should have at least 3.75 metre wide paved carriageway with good quality shoulders such as moorum shoulders of minimum 1.0 metre width on either side.
2000
Intermediate Lane Roads
Intermediate lane roads should have a pavement width of around 5.5 metre with good usable shoulders on either side.
6000
Two Lane Roads
Two lane roads shall have a 7 metre wide carriageway and good earthen shoulders.
15000
Two Lane Roads +
Two lane roads + paved & surface shoulders of atleast 1.5 m width on either side.
17250
Source : Table 3, 4, 5 and section 10.3 of guidelines for capacity of roads in rural area (IRC: 64-1990)
In case of two lane roads, where the shoulder width or carriageway width on
a two lane road are restricted, there will be a certain reduction in capacity. Table 3 gives the recommended reduction factors in this account over the capacity values given in Table 2.
Min Mec Consultancy Pvt. Ltd.
Assessment of Impacts Due to Transportation of Coal for Jhabua Power Plant 8
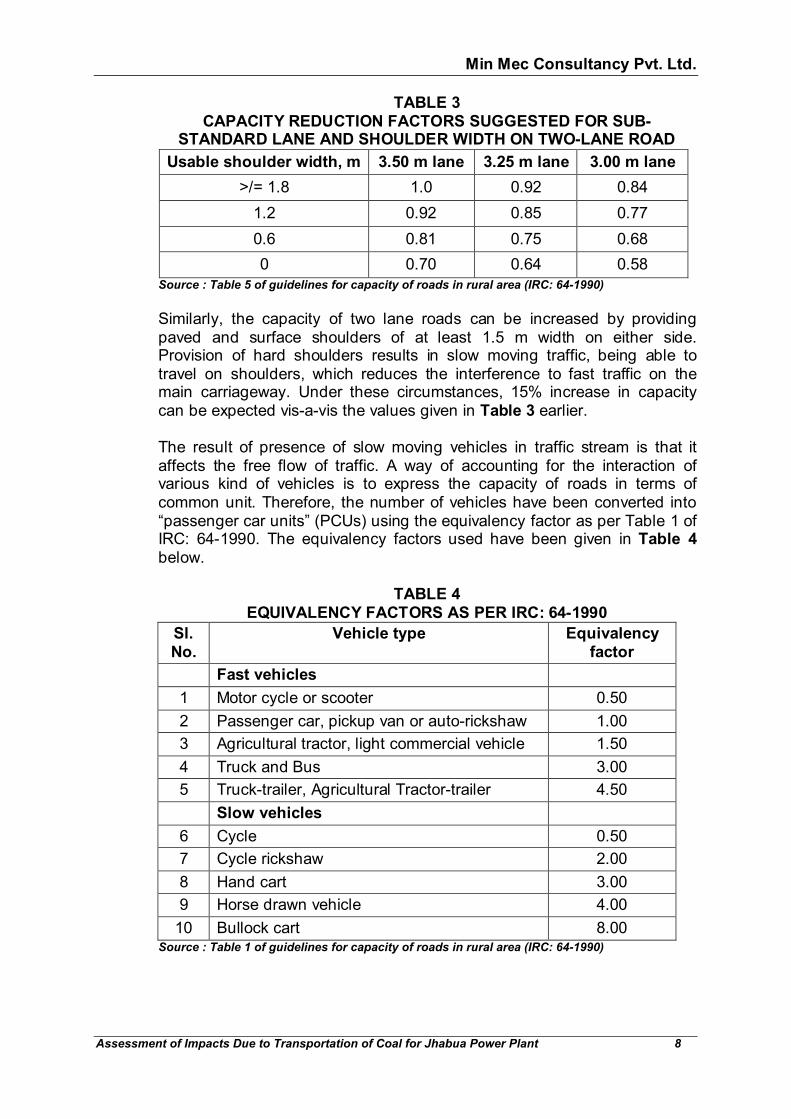
TABLE 3 CAPACITY REDUCTION FACTORS SUGGESTED FOR SUB-
STANDARD LANE AND SHOULDER WIDTH ON TWO-LANE ROAD
Usable shoulder width, m 3.50 m lane 3.25 m lane 3.00 m lane
>/= 1.8 1.0 0.92 0.84
1.2 0.92 0.85 0.77
0.6 0.81 0.75 0.68
0 0.70 0.64 0.58
Source : Table 5 of guidelines for capacity of roads in rural area (IRC: 64-1990)
Similarly, the capacity of two lane roads can be increased by providing
paved and surface shoulders of at least 1.5 m width on either side. Provision of hard shoulders results in slow moving traffic, being able to travel on shoulders, which reduces the interference to fast traffic on the main carriageway. Under these circumstances, 15% increase in capacity can be expected vis-a-vis the values given in Table 3 earlier.
The result of presence of slow moving vehicles in traffic stream is that it
affects the free flow of traffic. A way of accounting for the interaction of various kind of vehicles is to express the capacity of roads in terms of common unit. Therefore, the number of vehicles have been converted into “passenger car units” (PCUs) using the equivalency factor as per Table 1 of IRC: 64-1990. The equivalency factors used have been given in Table 4 below.
TABLE 4
EQUIVALENCY FACTORS AS PER IRC: 64-1990
Sl. No.
Vehicle type Equivalency factor
Fast vehicles
1 Motor cycle or scooter 0.50
2 Passenger car, pickup van or auto-rickshaw 1.00
3 Agricultural tractor, light commercial vehicle 1.50
4 Truck and Bus 3.00
5 Truck-trailer, Agricultural Tractor-trailer 4.50
Slow vehicles
6 Cycle 0.50
7 Cycle rickshaw 2.00
8 Hand cart 3.00
9 Horse drawn vehicle 4.00
10 Bullock cart 8.00 Source : Table 1 of guidelines for capacity of roads in rural area (IRC: 64-1990)
Min Mec Consultancy Pvt. Ltd.
Assessment of Impacts Due to Transportation of Coal for Jhabua Power Plant 9
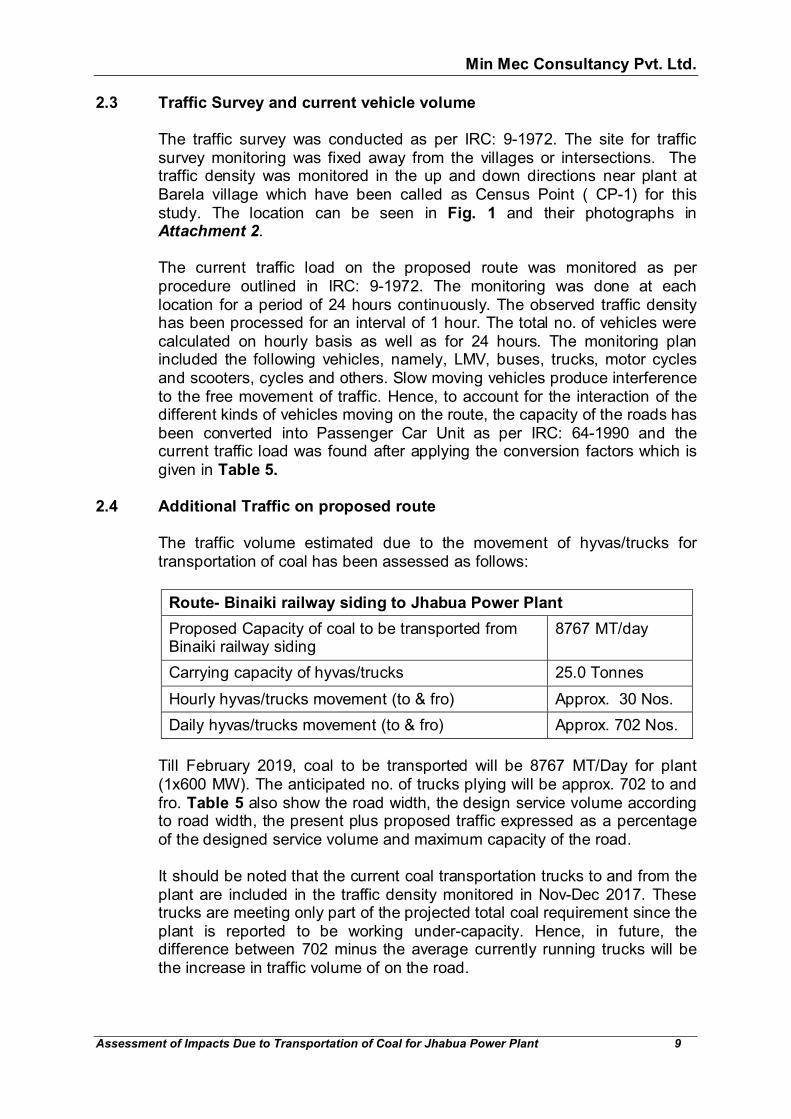
2.3 Traffic Survey and current vehicle volume The traffic survey was conducted as per IRC: 9-1972. The site for traffic
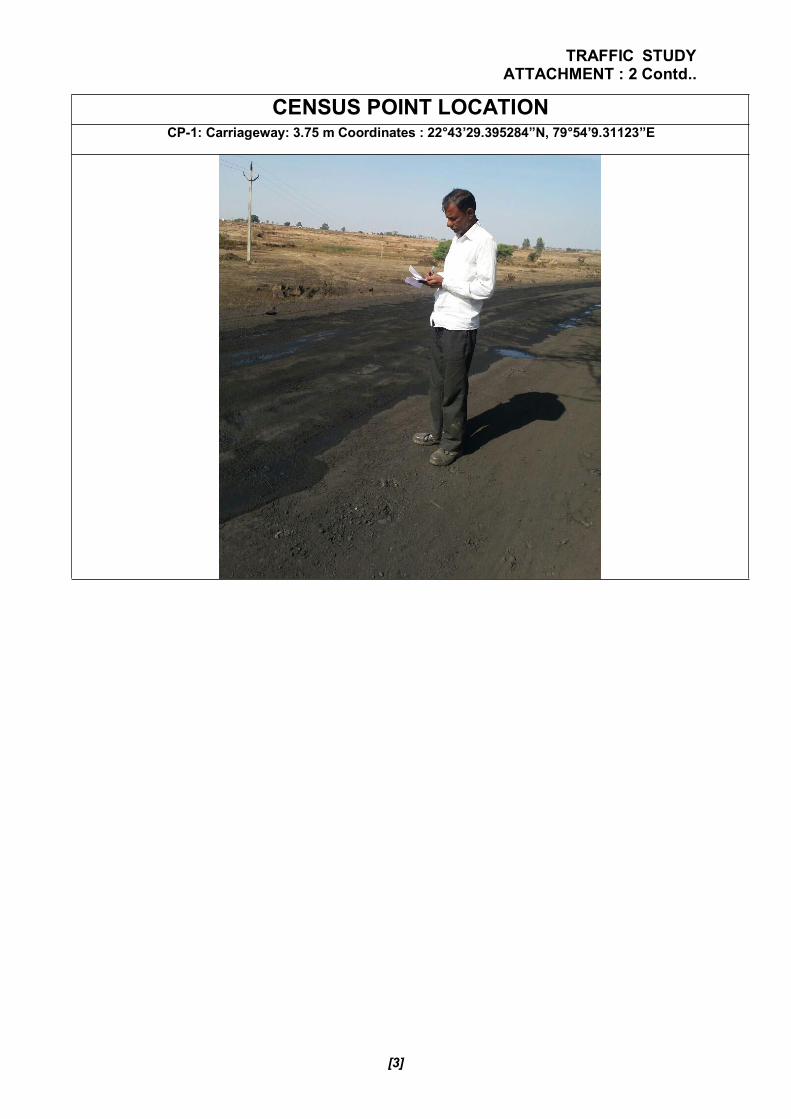
survey monitoring was fixed away from the villages or intersections. The traffic density was monitored in the up and down directions near plant at Barela village which have been called as Census Point ( CP-1) for this study. The location can be seen in Fig. 1 and their photographs in Attachment 2.
The current traffic load on the proposed route was monitored as per
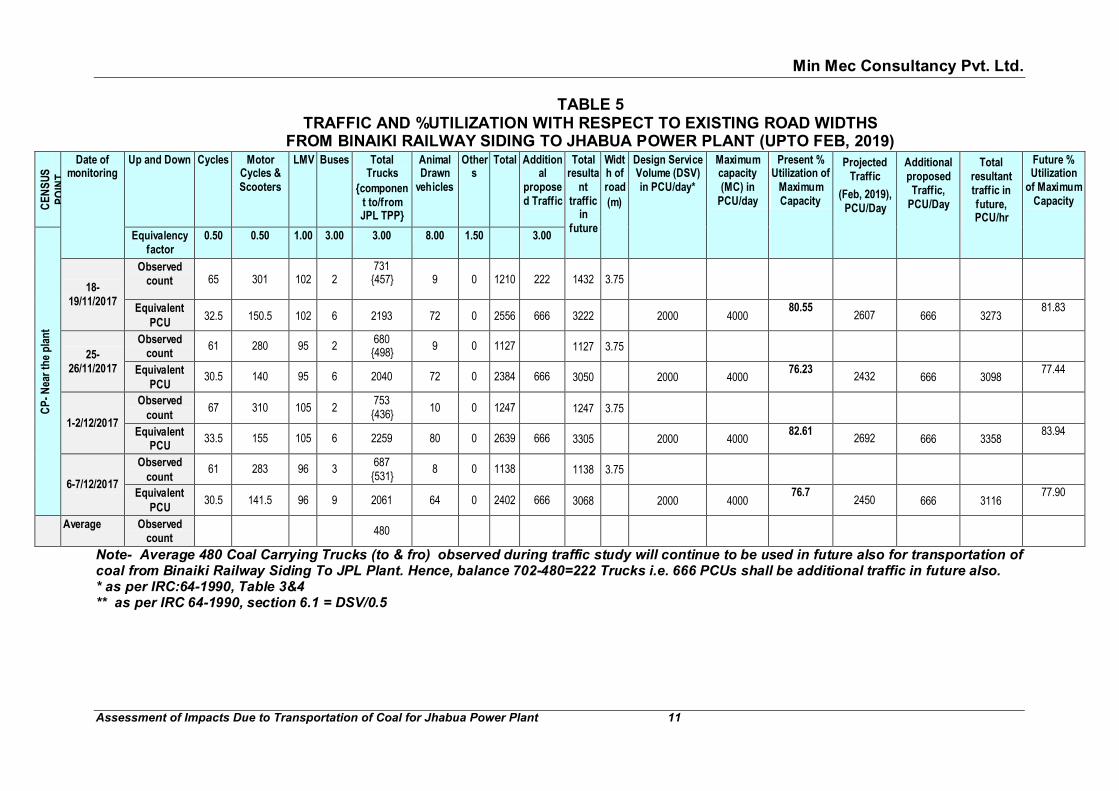
procedure outlined in IRC: 9-1972. The monitoring was done at each location for a period of 24 hours continuously. The observed traffic density has been processed for an interval of 1 hour. The total no. of vehicles were calculated on hourly basis as well as for 24 hours. The monitoring plan included the following vehicles, namely, LMV, buses, trucks, motor cycles and scooters, cycles and others. Slow moving vehicles produce interference to the free movement of traffic. Hence, to account for the interaction of the different kinds of vehicles moving on the route, the capacity of the roads has been converted into Passenger Car Unit as per IRC: 64-1990 and the current traffic load was found after applying the conversion factors which is given in Table 5.
2.4 Additional Traffic on proposed route The traffic volume estimated due to the movement of hyvas/trucks for
transportation of coal has been assessed as follows:
Route- Binaiki railway siding to Jhabua Power Plant
Proposed Capacity of coal to be transported from Binaiki railway siding
8767 MT/day
Carrying capacity of hyvas/trucks 25.0 Tonnes
Hourly hyvas/trucks movement (to & fro) Approx. 30 Nos.
Daily hyvas/trucks movement (to & fro) Approx. 702 Nos.
Till February 2019, coal to be transported will be 8767 MT/Day for plant (1x600 MW). The anticipated no. of trucks plying will be approx. 702 to and fro. Table 5 also show the road width, the design service volume according to road width, the present plus proposed traffic expressed as a percentage of the designed service volume and maximum capacity of the road. It should be noted that the current coal transportation trucks to and from the plant are included in the traffic density monitored in Nov-Dec 2017. These trucks are meeting only part of the projected total coal requirement since the plant is reported to be working under-capacity. Hence, in future, the difference between 702 minus the average currently running trucks will be the increase in traffic volume of on the road.
Min Mec Consultancy Pvt. Ltd.
Assessment of Impacts Due to Transportation of Coal for Jhabua Power Plant 10
It can be seen from the Table 5 that the current, projected ( on Feb, 2019) plus proposed additional traffic volume on the Binaiki railway siding to Jhabua Power Plant route will have a maximum capacity of 77.44% to 83.94%. Thus, the present road width is capable of supporting the present as well as the additional traffic at Level of Service (LOS) C.
2.5 Growth in existing traffic It is proposed to use the road for coal transportation for a maximum period
i.e. till February, 2019. During this 1 year , the existing road traffic is likely to experience a natural growth also, which is affected by the following factors:
Economic 1. Gross National Product (GNP) or Gross Domestic Product (GDP)
2. Agricultural Output
3. Industrial Output
Demographic 4. Population
5. Rural/ Urban mix of population
The natural growth can be assessed through various ways which is related
to either one or more of the above parameters. Past trends of data related to traffic flow from census, vehicle registration or fuel sales can also be used, if available. In this case, being a rural road, past trend data was not available for sufficient number of years from authentic sources for extrapolations. Hence, an average growth rate of 2.00% has been assumed on the basis of 20.00% population growth rate in Madhya Pradesh in the previous decade, as per Census 2001 & 2011.
The growth in traffic has been projected for 1 year based on the formula
prescribed by IRC:108-1996 (Guidelines for Traffic Prediction on Rural Highways) which has been used in subsequent Tables 5 and added to the proposed traffic load to determine the adequacy of the road in future also.
The formula used for projection is Pn = Po(1+r)n Where Pn = Traffic in the nth year i.e. in 1 year
Po = Traffic flow in the base year
n = number of years (years)
r = annual rate of growth of traffic, expressed in decimals. (0.02)
Min Mec Consultancy Pvt. Ltd.
Assessment of Impacts Due to Transportation of Coal for Jhabua Power Plant 11
TABLE 5 TRAFFIC AND %UTILIZATION WITH RESPECT TO EXISTING ROAD WIDTHS
FROM BINAIKI RAILWAY SIDING TO JHABUA POWER PLANT (UPTO FEB, 2019)
CENSUS
POINT
Date of monitoring
Up and Down Cycles Motor Cycles & Scooters
LMV Buses Total Trucks
{component to/from JPL TPP}
Animal Drawn vehicles
Others
Total Additional
proposed Traffic
Total resultant
traffic in
future
Width of road
(m)
Design Service Volume (DSV) in PCU/day*
Maximum capacity (MC) in PCU/day
Present % Utilization of Maximum Capacity
Projected Traffic
(Feb, 2019), PCU/Day
Additional proposed Traffic, PCU/Day
Total resultant traffic in future, PCU/hr
Future % Utilization of Maximum Capacity
CP- Near the plant
Equivalency factor
0.50 0.50 1.00 3.00 3.00 8.00 1.50 3.00
18-19/11/2017
Observed count 65 301 102 2
731 {457}
9 0 1210 222 1432 3.75
Equivalent
PCU 32.5 150.5 102 6 2193 72 0 2556 666 3222 2000 4000
80.55 2607 666 3273
81.83
25-26/11/2017
Observed count
61 280 95 2 680 {498}
9 0 1127 1127 3.75
Equivalent
PCU 30.5 140 95 6 2040 72 0 2384 666 3050 2000 4000
76.23 2432 666 3098
77.44
1-2/12/2017
Observed
count 67 310 105 2
753 {436}
10 0 1247 1247 3.75
Equivalent PCU
33.5 155 105 6 2259 80 0 2639 666 3305 2000 4000 82.61
2692 666 3358 83.94
6-7/12/2017
Observed
count 61 283 96 3
687 {531}
8 0 1138 1138 3.75
Equivalent
PCU 30.5 141.5 96 9 2061 64 0 2402 666 3068 2000 4000
76.7 2450 666 3116
77.90
Average Observed count
480
Note- Average 480 Coal Carrying Trucks (to & fro) observed during traffic study will continue to be used in future also for transportation of coal from Binaiki Railway Siding To JPL Plant. Hence, balance 702-480=222 Trucks i.e. 666 PCUs shall be additional traffic in future also. * as per IRC:64-1990, Table 3&4 ** as per IRC 64-1990, section 6.1 = DSV/0.5
Min Mec Consultancy Pvt. Ltd.
Assessment of Impacts Due to Transportation of Coal for Jhabua Power Plant 12
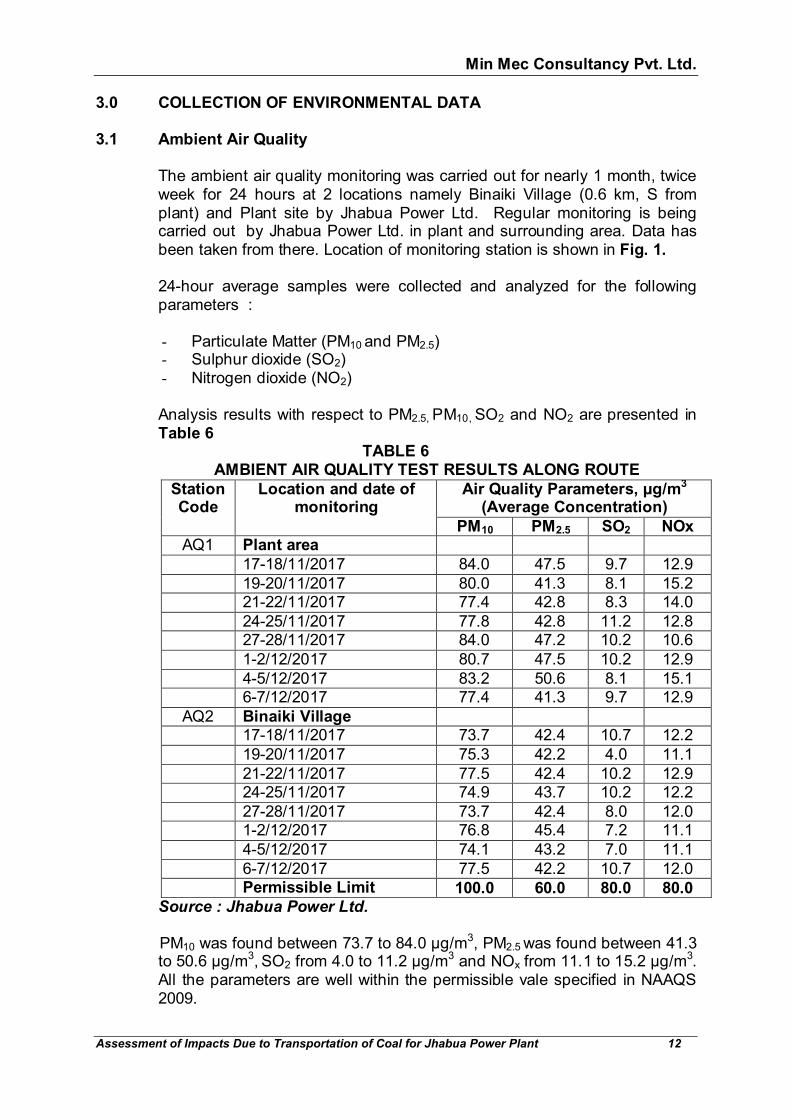
3.0 COLLECTION OF ENVIRONMENTAL DATA 3.1 Ambient Air Quality The ambient air quality monitoring was carried out for nearly 1 month, twice
week for 24 hours at 2 locations namely Binaiki Village (0.6 km, S from plant) and Plant site by Jhabua Power Ltd. Regular monitoring is being carried out by Jhabua Power Ltd. in plant and surrounding area. Data has been taken from there. Location of monitoring station is shown in Fig. 1.
24-hour average samples were collected and analyzed for the following
parameters :
- Particulate Matter (PM10 and PM2.5) - Sulphur dioxide (SO2) - Nitrogen dioxide (NO2)
Analysis results with respect to PM2.5, PM10, SO2 and NO2 are presented in
Table 6 TABLE 6
AMBIENT AIR QUALITY TEST RESULTS ALONG ROUTE
Station Code
Location and date of monitoring
Air Quality Parameters, µg/m3
(Average Concentration)
PM10 PM2.5 SO2 NOx AQ1 Plant area
17-18/11/2017 84.0 47.5 9.7 12.9
19-20/11/2017 80.0 41.3 8.1 15.2 21-22/11/2017 77.4 42.8 8.3 14.0
24-25/11/2017 77.8 42.8 11.2 12.8 27-28/11/2017 84.0 47.2 10.2 10.6
1-2/12/2017 80.7 47.5 10.2 12.9
4-5/12/2017 83.2 50.6 8.1 15.1 6-7/12/2017 77.4 41.3 9.7 12.9
AQ2 Binaiki Village 17-18/11/2017 73.7 42.4 10.7 12.2
19-20/11/2017 75.3 42.2 4.0 11.1
21-22/11/2017 77.5 42.4 10.2 12.9 24-25/11/2017 74.9 43.7 10.2 12.2
27-28/11/2017 73.7 42.4 8.0 12.0 1-2/12/2017 76.8 45.4 7.2 11.1
4-5/12/2017 74.1 43.2 7.0 11.1
6-7/12/2017 77.5 42.2 10.7 12.0 Permissible Limit 100.0 60.0 80.0 80.0
Source : Jhabua Power Ltd.
PM10 was found between 73.7 to 84.0 µg/m3, PM2.5 was found between 41.3 to 50.6 µg/m3, SO2 from 4.0 to 11.2 µg/m3 and NOx from 11.1 to 15.2 µg/m3. All the parameters are well within the permissible vale specified in NAAQS 2009.
Min Mec Consultancy Pvt. Ltd.
Assessment of Impacts Due to Transportation of Coal for Jhabua Power Plant 13
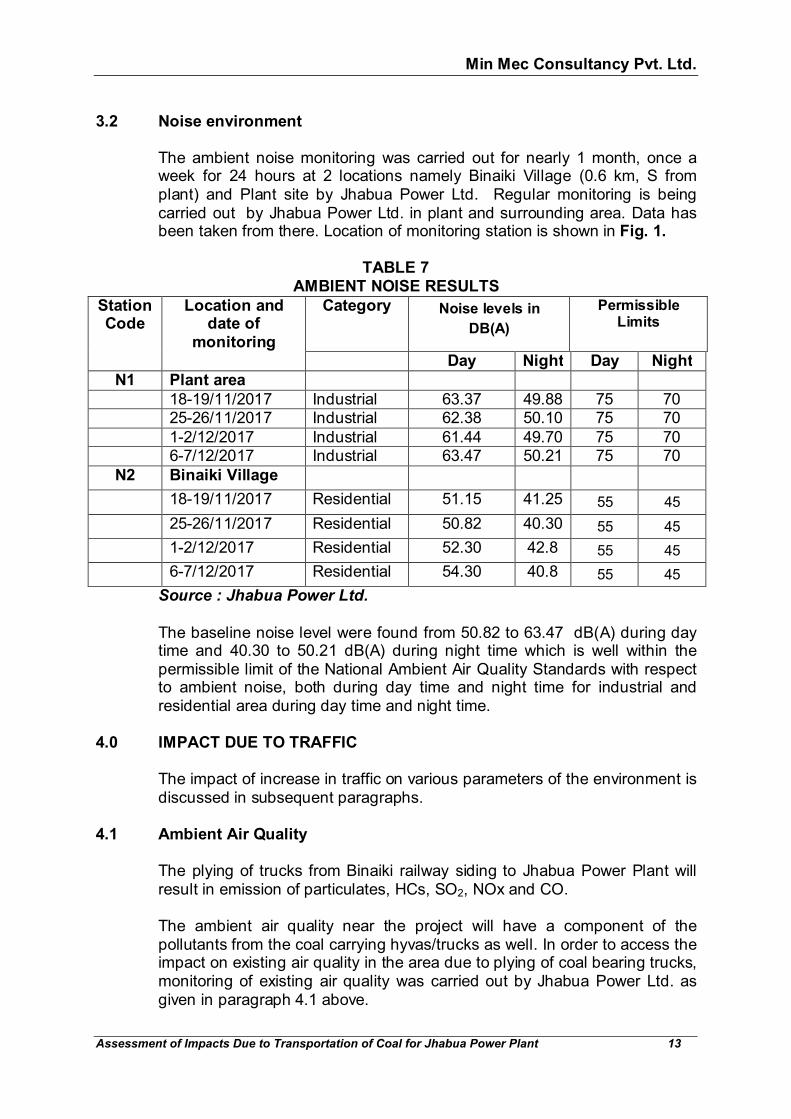
3.2 Noise environment
The ambient noise monitoring was carried out for nearly 1 month, once a week for 24 hours at 2 locations namely Binaiki Village (0.6 km, S from plant) and Plant site by Jhabua Power Ltd. Regular monitoring is being carried out by Jhabua Power Ltd. in plant and surrounding area. Data has been taken from there. Location of monitoring station is shown in Fig. 1.
TABLE 7
AMBIENT NOISE RESULTS
Station Code
Location and date of
monitoring
Category Noise levels in
DB(A)
Permissible Limits
Day Night Day Night
N1 Plant area
18-19/11/2017 Industrial 63.37 49.88 75 70 25-26/11/2017 Industrial 62.38 50.10 75 70
1-2/12/2017 Industrial 61.44 49.70 75 70 6-7/12/2017 Industrial 63.47 50.21 75 70
N2 Binaiki Village
18-19/11/2017 Residential 51.15 41.25 55 45
25-26/11/2017 Residential 50.82 40.30 55 45
1-2/12/2017 Residential 52.30 42.8 55 45
6-7/12/2017 Residential 54.30 40.8 55 45
Source : Jhabua Power Ltd. The baseline noise level were found from 50.82 to 63.47 dB(A) during day time and 40.30 to 50.21 dB(A) during night time which is well within the permissible limit of the National Ambient Air Quality Standards with respect to ambient noise, both during day time and night time for industrial and residential area during day time and night time.
4.0 IMPACT DUE TO TRAFFIC The impact of increase in traffic on various parameters of the environment is
discussed in subsequent paragraphs. 4.1 Ambient Air Quality The plying of trucks from Binaiki railway siding to Jhabua Power Plant will
result in emission of particulates, HCs, SO2, NOx and CO. The ambient air quality near the project will have a component of the
pollutants from the coal carrying hyvas/trucks as well. In order to access the impact on existing air quality in the area due to plying of coal bearing trucks, monitoring of existing air quality was carried out by Jhabua Power Ltd. as given in paragraph 4.1 above.
Min Mec Consultancy Pvt. Ltd.
Assessment of Impacts Due to Transportation of Coal for Jhabua Power Plant 14
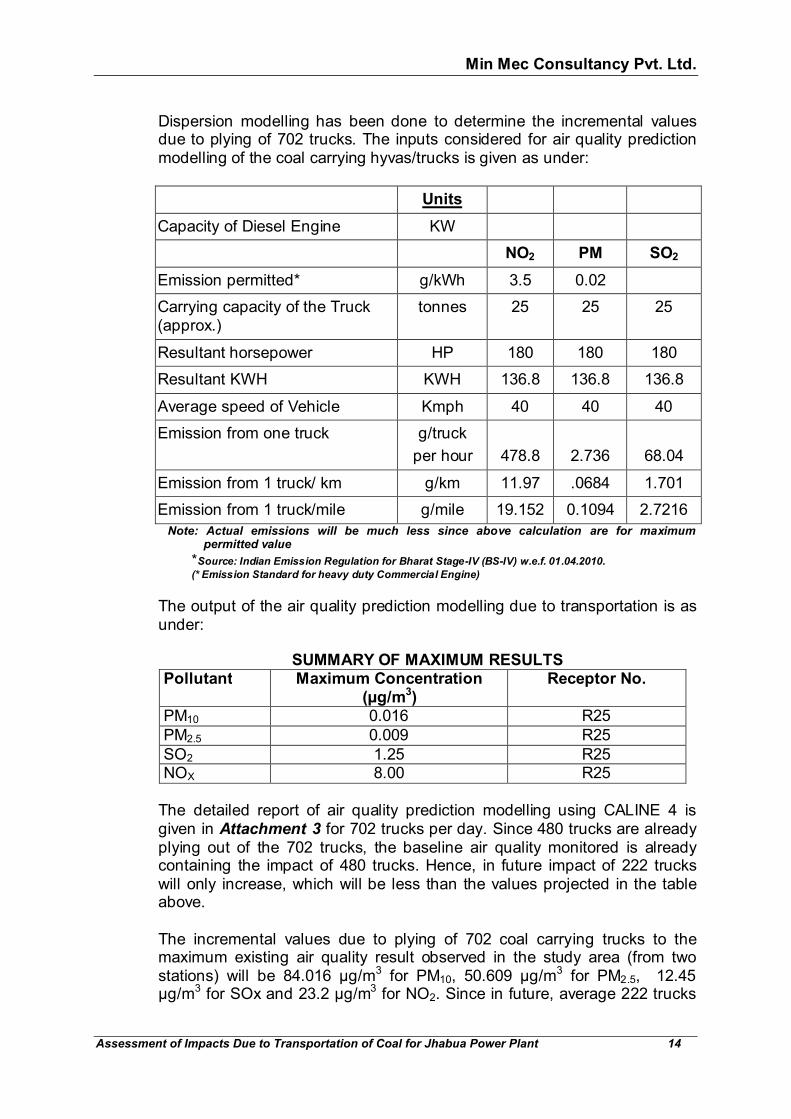
Dispersion modelling has been done to determine the incremental values
due to plying of 702 trucks. The inputs considered for air quality prediction modelling of the coal carrying hyvas/trucks is given as under:
Units
Capacity of Diesel Engine KW
NO2 PM SO2
Emission permitted* g/kWh 3.5 0.02
Carrying capacity of the Truck (approx.)
tonnes 25 25 25
Resultant horsepower HP 180 180 180
Resultant KWH KWH 136.8 136.8 136.8
Average speed of Vehicle Kmph 40 40 40
Emission from one truck g/truck
per hour 478.8 2.736 68.04
Emission from 1 truck/ km g/km 11.97 .0684 1.701
Emission from 1 truck/mile g/mile 19.152 0.1094 2.7216
Note: Actual emissions will be much less since above calculation are for maximum permitted value
*Source: Indian Emission Regulation for Bharat Stage-IV (BS-IV) w.e.f. 01.04.2010.
(* Emission Standard for heavy duty Commercial Engine)
The output of the air quality prediction modelling due to transportation is as under:
SUMMARY OF MAXIMUM RESULTS Pollutant Maximum Concentration
(µg/m3) Receptor No.
PM10 0.016 R25
PM2.5 0.009 R25
SO2 1.25 R25 NOX 8.00 R25
The detailed report of air quality prediction modelling using CALINE 4 is
given in Attachment 3 for 702 trucks per day. Since 480 trucks are already plying out of the 702 trucks, the baseline air quality monitored is already containing the impact of 480 trucks. Hence, in future impact of 222 trucks will only increase, which will be less than the values projected in the table above.
The incremental values due to plying of 702 coal carrying trucks to the
maximum existing air quality result observed in the study area (from two stations) will be 84.016 µg/m3 for PM10, 50.609 µg/m3 for PM2.5, 12.45 µg/m3 for SOx and 23.2 µg/m3 for NO2. Since in future, average 222 trucks
Min Mec Consultancy Pvt. Ltd.
Assessment of Impacts Due to Transportation of Coal for Jhabua Power Plant 15
will increase, therefore the resultant air quality would remain well within the prescribed limit.
The particulate matter increment values in the above table pertain to the
emission from the exhausts of the vehicles only. However, there will be an additional component of particulate matter in the form of dust becoming airborne from roads due to wheel movement. The dust on roads comes from various sources such as settlement of fugitive dust, spillage from vehicles, peeling of mud stuck on wheels, weathering of road itself, dust storms, etc.
The movement of wheels disturb the area under the wheels and creates
disturbances in the air which are localized, temporary and reversible. The dust becomes airborne and resettles according to particle size. As per various research papers, silt content of this dust is of consequence in addition to the speed/ weight of the vehicle to determine magnitude of airborne dust.
As per AP-42, 5th Edition of US EPA, Section 13.2.1.3, the quantity of particulate emissions from re-suspension of loose material on the road surface due to vehicle travel on a dry paved road may be estimated using the following empirical expression:
E = [k (sL)0.91 x (W)1.02] x (1-P/4N)
where: E = particulate emission factor (having units matching the units of k), k = particle size multiplier for particle size range and units of interest, which
will be 0.62 g/VKT for PM10 and 0.15 g/VKT for PM2.5 as per Table 13.2.1-1 of AP-42, US EPA.
sL = road surface silt loading (grams per square meter) (g/m2). The average
silt content has been taken as 1.5 g/m2 as per AP42 Table 13.2.1-2. W = average weight (tons) of the vehicles travelling the road, which is 22.5
(average of loaded and empty trucks of 25 Tonne capacity) for the additional traffic P = Total wet days with at least 0.254 mm (0.01 in) of precipitation during the averaging period which is 58.6 days at IMD Jabalpur (avg. from 1961-1990), and N = Number of days in the averaging period which is 365 days Thus, PM10 E = 0.62 (1.5)0.91 x (22.5)1.02 x (1- 58.6/(4*365))
Min Mec Consultancy Pvt. Ltd.
Assessment of Impacts Due to Transportation of Coal for Jhabua Power Plant 16
= 21.471426x 0.954794
= 20.6090 g/VKT
PM2.5 E = 0.15 (1.5)0.91 x (22.5)1.02
= 5.1947 g/VKT 4.2 Ambient Noise The number of hyvas/trucks anticipated are 702 (to & fro) per day on the
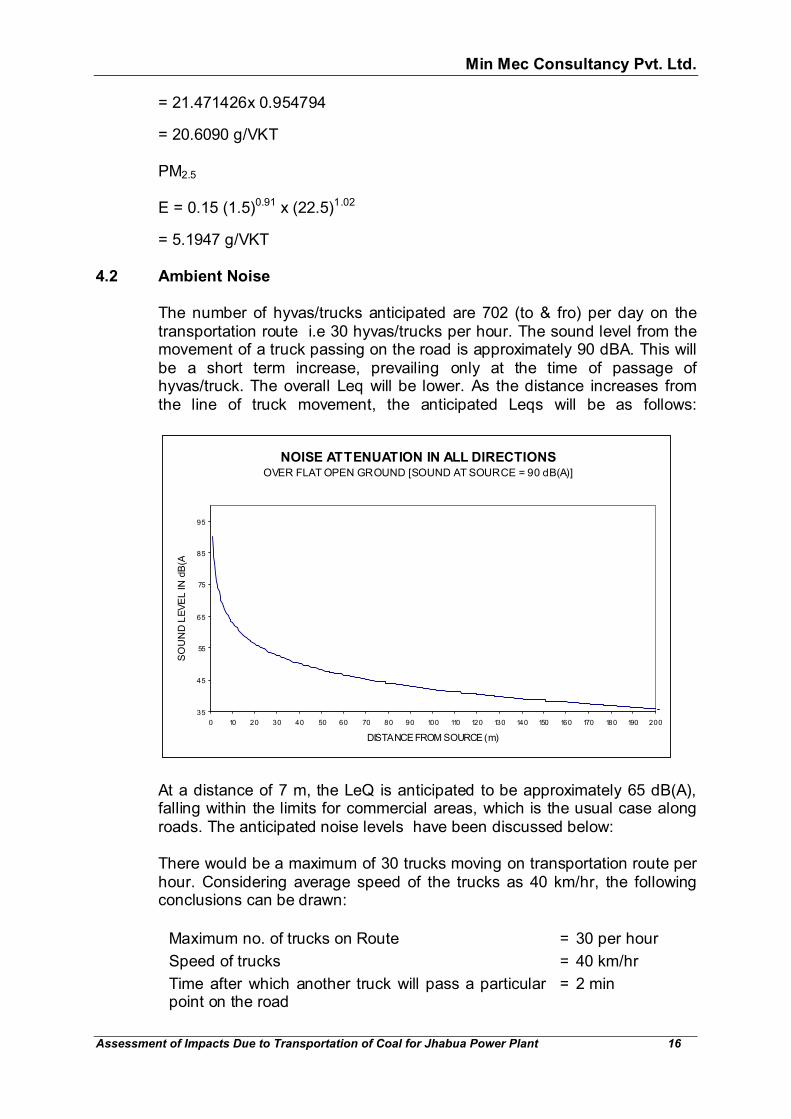
transportation route i.e 30 hyvas/trucks per hour. The sound level from the movement of a truck passing on the road is approximately 90 dBA. This will be a short term increase, prevailing only at the time of passage of hyvas/truck. The overall Leq will be lower. As the distance increases from the line of truck movement, the anticipated Leqs will be as follows:
NOISE ATTENUATION IN ALL DIRECTIONSOVER FLAT OPEN GROUND [SOUND AT SOURCE = 90 dB(A)]
35
45
55
65
75
85
95
0 10 20 30 40 50 60 70 80 90 100 110 120 130 140 150 160 170 180 190 200
DISTANCE FROM SOURCE (m)
SO
UN
D L
EV
EL IN
dB
(A)
At a distance of 7 m, the LeQ is anticipated to be approximately 65 dB(A),
falling within the limits for commercial areas, which is the usual case along roads. The anticipated noise levels have been discussed below:
There would be a maximum of 30 trucks moving on transportation route per hour. Considering average speed of the trucks as 40 km/hr, the following conclusions can be drawn:
Maximum no. of trucks on Route = 30 per hour
Speed of trucks = 40 km/hr
Time after which another truck will pass a particular point on the road
= 2 min
Min Mec Consultancy Pvt. Ltd.
Assessment of Impacts Due to Transportation of Coal for Jhabua Power Plant 17
Distance covered by a truck in 1 min = 667 metre/min
Distance between 2 consecutive trucks = 667 x 2
= Approx.1334 m
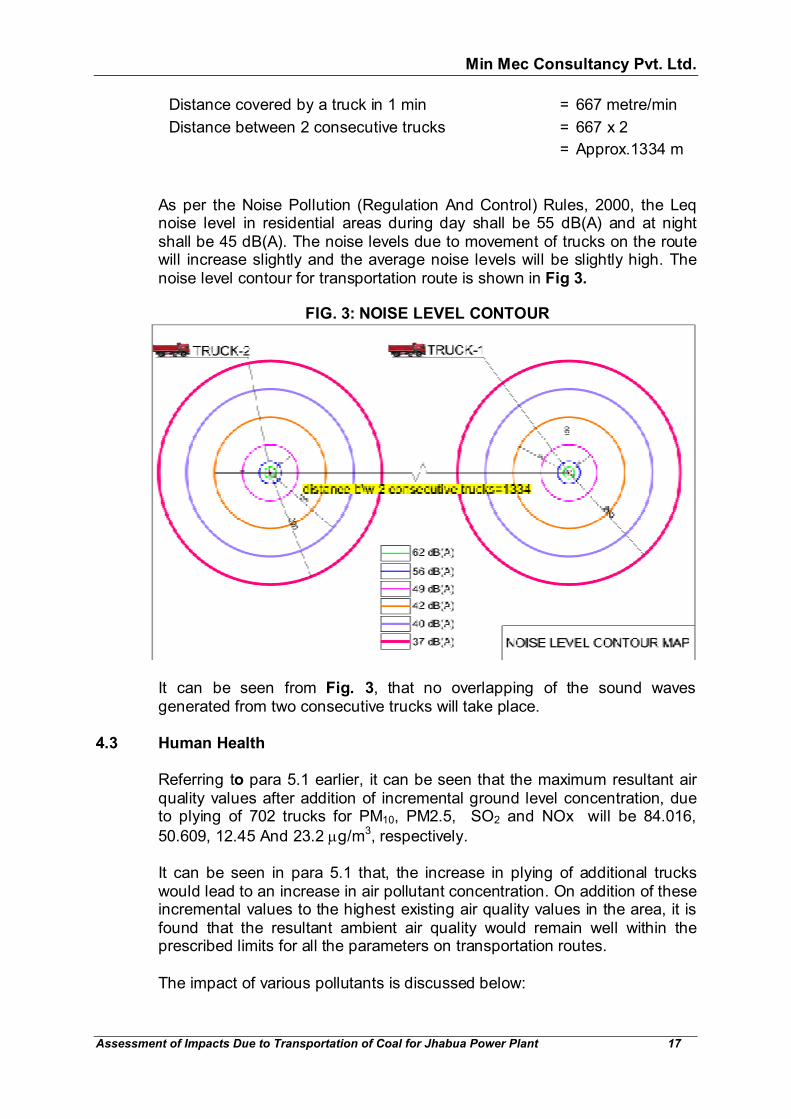
As per the Noise Pollution (Regulation And Control) Rules, 2000, the Leq noise level in residential areas during day shall be 55 dB(A) and at night shall be 45 dB(A). The noise levels due to movement of trucks on the route will increase slightly and the average noise levels will be slightly high. The noise level contour for transportation route is shown in Fig 3.
FIG. 3: NOISE LEVEL CONTOUR
It can be seen from Fig. 3, that no overlapping of the sound waves generated from two consecutive trucks will take place.
4.3 Human Health Referring to para 5.1 earlier, it can be seen that the maximum resultant air
quality values after addition of incremental ground level concentration, due to plying of 702 trucks for PM10, PM2.5, SO2 and NOx will be 84.016,
50.609, 12.45 And 23.2 µg/m3, respectively.
It can be seen in para 5.1 that, the increase in plying of additional trucks would lead to an increase in air pollutant concentration. On addition of these incremental values to the highest existing air quality values in the area, it is found that the resultant ambient air quality would remain well within the prescribed limits for all the parameters on transportation routes. The impact of various pollutants is discussed below:
Min Mec Consultancy Pvt. Ltd.
Assessment of Impacts Due to Transportation of Coal for Jhabua Power Plant 18
4.3.1 Particulates Impact on Health: PM10 and PM2.5 include inhalable particles that are small
enough to penetrate the thoracic region of the respiratory system. The health effects of inhalable PM are well documented in ‘Health effects of particulate matter, Policy implications for countries in eastern Europe, Caucasus and Central Asia by World Health Organisation, Regional Office for Europe, 2013’. They are due to exposure over both the short term (hours, days) and long term (months, years) and include:
• Respiratory and cardiovascular morbidity, such as aggravation of asthma, respiratory symptoms and an increase in hospital admissions;
• Mortality from cardiovascular and respiratory diseases and from lung cancer.
Threshold concentrations for humans : As described in detail in Chapter
7.3, Particulate Matter, Air Quality Guidelines, Second Edition, World Health Organisation Regional Office for Europe, Copenhagen, Denmark, 2000, at low levels of (short-term) exposure (defined as 0–100 μg/m3 for PM10), the exposure response curve fits a straight line reasonably well, there are indications from studies conducted in the former German Democratic Republic and in China that at higher levels of exposure (several hundreds of μg/m3 PM10), the curve is shallower for at least effects on mortality than at low levels of exposure.
The relative risk increase between 1.0074-1.0356 for daily mortality, respiratory hospital admissions, reporting of broncho-dilator use, cough and lower respiratory symptoms, and changes in peak expiratory flow has been associated with a 10 μg/m3 increase in PM10 or PM2.5 with respect to the concentrations actually measured.
In this case, the maximum incremental particulate emissions will be 0.016
μg/m3 for PM10 and 0.009 μg/m3 for PM2.5. The incremental values are within the significant figures of 10 μg/m3.
4.3.2 Sulphur dioxides Impact on Health: Sulphur dioxide irritates the skin and mucous
membranes of the eyes, nose, throat, and lungs. High concentrations of SO2 can cause inflammation and irritation of the respiratory system, particularly during heavy physical activity.
The resulting symptoms may include pain when taking a deep breath,
coughing, throat irritation, and breathing difficulties. High concentrations of SO2 can affect lung function, worsen asthma attacks, and aggravate existing heart disease in sensitive groups. This gas can also react with other chemicals in the air and convert to a small particle that can lodge in the lungs and cause similar health effects.
Min Mec Consultancy Pvt. Ltd.
Assessment of Impacts Due to Transportation of Coal for Jhabua Power Plant 19
Threshold concentrations for humans : As described in detail in Chapter 7.4, Sulphur dioxide, Air Quality Guidelines, Second Edition, World Health Organisation Regional Office for Europe, Copenhagen, Denmark, 2000, the health risk evaluation for short term exposures (less than 24 hours) has been done. Only small changes, not regarded as of clinical significance, were seen at 572 μg/m3 (0.2 ppm); reductions representing about 10% of baseline, Forced Expiratory Volume (FEV1) occurred at about 1144 μg/m3 (0.4 ppm); and reductions of about 15% occurred at about 1716 μg/m3 (0.6 ppm).
The response was not greatly influenced by the severity of asthma. These
findings are consistent with those reported from other exposure studies. In one early series, however, a small change in airway resistance was reported in two of the asthmatic patients at 286 μg/m3 (0.1 ppm). For long term exposure, the lowest-observed-adverse-effect level of sulfur dioxide was judged to be 100 μg/m3 (0.035 ppm) annual average, together with particulate matter.
In this case, the resultant ambient air quality after addition of incremental
emissions will be 12.45 μg/m3 on transportation route, which is much lower than the thresholds which impact human health.
4.3.3 Nitrogen oxides Impact on Health: Human health concerns include effects on breathing and
the respiratory system, damage to lung tissue, and premature death. Small particles penetrate deeply into sensitive parts of the lungs and can cause or worsen respiratory disease, such as emphysema and bronchitis, and aggravate existing heart disease.
Threshold concentrations for humans : As described in detail in Chapter
7.1, Nitrogen dioxide, Air Quality Guidelines, Second Edition, World Health Organisation Regional Office for Europe, Copenhagen, Denmark, 2000, a significant amount of research has been directed at evaluating the effect of nitrogen dioxide on pulmonary function and airway responsiveness to pharmacological, physical (e.g. cold air) or natural (i.e. allergens) broncho-constrictors. Generally, concentrations higher than 1880 μg/m3 (1.0 ppm) are required to increase responsiveness to broncho-constrictors and to induce changes in pulmonary function in healthy adults.
Analysis of lung lavage from healthy humans indicated that high levels
(5640-7520 μg/m3; 3–4 ppm) reduce the activity of alpha-1-protease inhibitor, a protein that acts to protect the lung from the proteolytic enzyme elastase by inhibiting connective tissue damage. However, 2820 μg/m3 (1.5 ppm) had no such effect.
Such concentrations as mentioned above, almost never occur in ambient
air, thus, the resultant ambient air quality values of nitrogen oxide (23.2 μg/m3 on transportation route) is not expected to have any impact on the healthy human beings. On the basis of these human clinical data, WHO has
Min Mec Consultancy Pvt. Ltd.
Assessment of Impacts Due to Transportation of Coal for Jhabua Power Plant 20
given a 1-hour guideline of 200 μg/m3. At double this recommended guideline (400 μg/m3), there is evidence to suggest possible small effects in the pulmonary function of asthmatics. Should the asthmatic be exposed either simultaneously or sequentially to nitrogen dioxide and an aeroallergen, the risk of an exaggerated response to the allergen is increased. At 50% of the suggested guideline (100μg/m3, 50 ppb), there have been no studies of acute response in 1 hour.
4.4 Ecology It has been generally accepted that dust originating from unpaved roads can
aggravate respiratory ailments, create driving hazards and cause considerable discomfort to those living alongside these roads.
Dust may affect photosynthesis, respiration, transpiration and allow the
penetration of phyto-toxic gaseous pollutants. Dust from highways and roads greatly affect the roadside vegetation communities by inducing changes in pH, Relative Water Content and species diversity. Vegetation act as natural filters by depositing dust particles on their leaf surface, susceptible and highly exposed part of a plant and, thus, makes an important contribution in the improvement of air quality. Leaves act as pollution receptors and decrease dust load of the air.
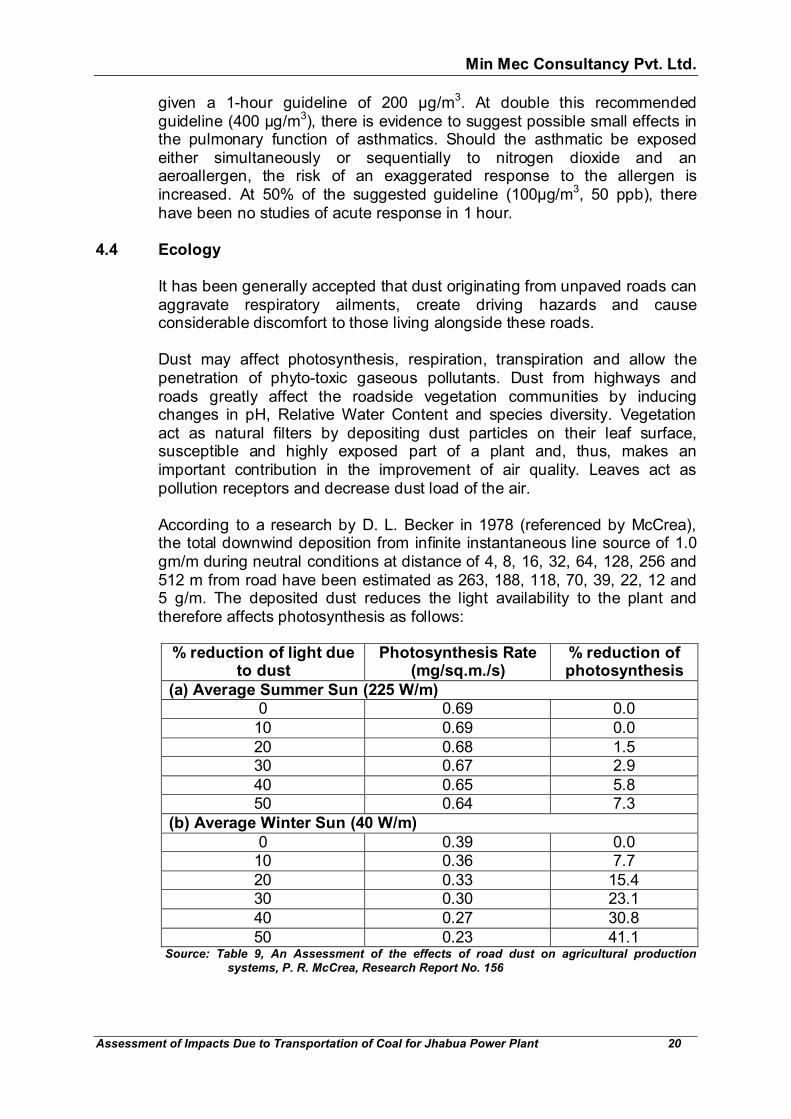
According to a research by D. L. Becker in 1978 (referenced by McCrea),
the total downwind deposition from infinite instantaneous line source of 1.0 gm/m during neutral conditions at distance of 4, 8, 16, 32, 64, 128, 256 and 512 m from road have been estimated as 263, 188, 118, 70, 39, 22, 12 and 5 g/m. The deposited dust reduces the light availability to the plant and therefore affects photosynthesis as follows:
% reduction of light due to dust
Photosynthesis Rate (mg/sq.m./s)
% reduction of photosynthesis
(a) Average Summer Sun (225 W/m) 0 0.69 0.0
10 0.69 0.0
20 0.68 1.5 30 0.67 2.9
40 0.65 5.8 50 0.64 7.3
(b) Average Winter Sun (40 W/m)
0 0.39 0.0 10 0.36 7.7
20 0.33 15.4 30 0.30 23.1
40 0.27 30.8
50 0.23 41.1 Source: Table 9, An Assessment of the effects of road dust on agricultural production
systems, P. R. McCrea, Research Report No. 156
Min Mec Consultancy Pvt. Ltd.
Assessment of Impacts Due to Transportation of Coal for Jhabua Power Plant 21
The McCrea study in table 13 also assessed the observed normal reduction of yield in various roadside orchards for a traffic volume of 500 per day, affecting an area of 12.5 ha/km and arrived it to be 1.6%, for a traffic volume of 250 per day, as 0.8% and for a traffic volume of 75 per day 0.3%. Thus, under worse case scenario of high dust on roads, adverse weather conditions and absence of mitigation measures, the plying of additional 702 hyvas/trucks on transportation route per day can lead to a maximum cumulative reduction of yield in roadside plantation will be 2.24%, if mitigation measures like water sprinkling, road maintenance, cleaning and road side plantations are not carried out.
5.0 OBSERVATIONS
During site visit, the following observations were made along route:
� The transportation route from Binaiki railway siding to Jhabua Power Plant is 1.86 km long, with average width of 4.72 m. Minimum road width was 3.75 m and maximum was 7.8 m.
� There is no habitation along the route within 100 m of road except a petrol pump, between stretch RW-3 and RW-04. Binaiki railway siding is present in Binaki village.
� Various kinds of vehicles are using the roads such as cars, jeeps, motorcycles, scooters, buses, trucks, etc.
� The flora planted along the road and boundary of the plant are Karanj (Pongamia pinnata), Gulmohar (Delonix regia), Khamir, Mango (Mangifera indica) and Babul (Acacia arabica). Photographs of the same can be seen in Fig. 4
� Presently, the transportation of coal from railway siding to power plant is being done by trucks covered with tarpaulin. This practice shall be continued in future also. Photographs are given in Fig. 5.
� During survey, it was found that the road condition between stretches RW-01 to RW-02 and RW-07 to RW-08 require maintenance.
� Majority of the road length (87.26%) is single lane (<5.5 m wide), which should be widened for safer transportation using trucks.
� Although M/s Jhabua Power Ltd has permission to transport coal through road till Feb 2018 for its entire coal demand, the actual truck movement is much lower due to the thermal power plant being operated below full capacity.
� A “Road Health And Safety Plan” has been already developed and followed by Jhabua Power Ltd. and is attached as Attachment 4.
Min Mec Consultancy Pvt. Ltd.
Assessment of Impacts Due to Transportation of Coal for Jhabua Power Plant 22
FIG. 4 PLANTATION ALONG PLANT BOUNDARY
FIG. 5 COVERED COAL TRUCKS
Min Mec Consultancy Pvt. Ltd.
Assessment of Impacts Due to Transportation of Coal for Jhabua Power Plant 23
6.0 CONCLUSION AND RECOMMENDATIONS This study has been conducted to assess the likely impact of coal
transportation from Binaiki railway siding to Thermal Power Plant at Barela and Gorakhpur, Tehsil Ghansore, District Seoni, Madhya Pradesh of M/s Jhabua Power Ltd.
The required coal to be transported at full capacity will be 8767 tonnes per
day from Binaiki railway siding by road, which would be brought through hyvas/trucks of 25 tonnes capacity. There would be total movement of about 702 coal carrying hyvas/trucks (to & fro) on transportation route which is 1.86 km long.
All surveys, calculations and assessments have been carried out in line with
Standards available from Indian Road Congress (IRC), Ministry of Environment, Forest and Climate Change (MoEF&CC) and United States Environment Protection Agency (US EPA). Road width along entire length has been measured besides observation of traffic volume.
Based on the various aspects studied, the following conclusions are arrived
at:
� From the aspect of Traffic Volume and capacity of the road - From Table 5, it is clear that even after consideration of traffic growth rate for 1 year, the existing, projected plus the additional traffic volume due to the movement of coal carrying trucks will remain within the maximum capacity of the road. Thus, the present road width is capable of supporting the present as well as the additional traffic at Level of Service (LOS) C. However, widening of the single lane road will improve not only the Level of Service but also the safety on road.
� From the aspect of Impact on Ambient Air quality - Perusal of Para
5.1 shows that there shall be increment in air pollutants due to exhaust emissions and dust from road, from the additional vehicles. However, the magnitude of resultant pollutant concentrations will be low and to the tune of maximum 84.016 µg/m3 for PM10, 50.609 µg/m3 for PM2.5, 12.45 µg/m3 for SOx and 23.2 µg/m3 for NO2. Since in future, average 222 trucks will increase, therefore the resultant air quality would remain well within the prescribed limit.
� From the aspect of Impact on Ambient Noise - The sound level from
the movement of a truck passing on the road is approximately 90 dBA. This will be a short term increase, prevailing only at the time of passage of truck. There will be a short time increase in the noise level during plying of the vehicles. The overall Leq noise level will be slightly higher. As the vehicle passes away, the noise levels will be deceasing. It can also be seen from Fig. 4 that the noise levels due to movement of trucks on the route will increase slightly and the average noise levels will be slightly high. It can be seen from Fig 4 that no overlapping of the sound waves generated from two consecutive trucks will take place if the
Min Mec Consultancy Pvt. Ltd.
Assessment of Impacts Due to Transportation of Coal for Jhabua Power Plant 24
minimum distance between two trucks is > 400 m and according to the present case of transportation, the minimum distance between two consecutive trucks will be 1334 m.
� From the aspect of Impact on Human Health- The incremental values
have been compared against the Air Quality Guidelines, Second Edition, World Health Organisation Regional Office for Europe, Copenhagen, Denmark, 2000 and found to be lower than the significant figures of 10 μg/m3
for PM10 and PM2.35. The resultant NO2 and SO2 will be much lower than the thresholds which impact human health
� From the aspect of Impact on Ecology- Under normal scenario and
absence of mitigation measures, the plying of additional 702 (to & fro) trucks per day on transportation route can lead to a reduction in yield of road side plantation to 2.24%.
However, based on the study and observations, the following are
recommended: A. Plantation
� Carry out plantation along the traffic route for dust and noise control on either side of road, in consultation with villagers, where ever possible.
� Continue to maintain plantation already done within plant and replace damaged saplings
B. Air pollution mitigation for protection of ecology & human health
� The vehicles used for transportation should be covered with tarpaulin and should be spill-proof
� The trucks to have periodic PUC certification as per manufacturers norms and it shall be ensured that unadulterated diesel is procured and used from authorised dealers only
� Only those vehicles having fitness certificate to be allowed to ply
� The practice of water spraying/sprinkling along transportatio route road shall be carried out to minimize road dust generation. As per APM-42, 70% of the fugitive dust emission can be controlled by sprinkling/ mechanical cleaning of roads and therefore, it is practically possible to minimise impact to level below 10 μg/m3.
� Make provision for tyre washing at unloading point within the power plant.
Min Mec Consultancy Pvt. Ltd.
Assessment of Impacts Due to Transportation of Coal for Jhabua Power Plant 25
C. Noise mitigation
� No unnecessary honking.
� All trucks to undergo preventive maintenance as per manufacturers schedule and their silencers shall be maintained and operational at all times.
� Plantation along roadside as suggested for air pollution mitigation will also act as buffer against noise propagation
D. Safety
� Installation of speed bumps before intersections to ensure slow
driving
� Awareness to Truck drivers & other road users through hoardings on roads regarding road safety
� Contact number of crane operator/ breakdown contact number within TPP shall be made available to all vehicle drivers
� All trucks to carry first aid kits and drivers to be trained in provision of first aid in case of emergency
� Creating awareness for road safety to road users and drivers and ensuring availability of ambulance facility for the accident victims, if any.
F. Road status
� Initiate communication with PWD immediately to improve
maintenance of road. Explore possibility of widening. In future, i case of observation of any damage to the road, inform PWD, so that repairs can be requested and carried out at the earliest.
E. Facilities for Drivers
Facilities for rest/ stay/ hygiene/ sanitation/ HIV Control for drivers have already been provided at the plant as follows:
� Parking facilities for truck within the power plant
� Rest room for drivers
� Attached bath and toilets
� Drinking water with cooler
� Posters spreading awareness about safety, driving rules and HIV awareness
TRAFFIC STUDYATTACHMENT : 2
[1]
PHOTOGRAPHS OF ROADWIDTH MEASUREMENT LOCATIONSTRANSPORTATION ROUTE( BINAIKI RAILWAY SIDING TO JPL)
RW-1: Carriageway: 5.00 m Coordinates :22°43’13.8742”N, 79°54’5.5016”E
RW-2: Carriageway: 5.00 m Coordinates :22°43’14.6340”N, 79°54’5.7243”E
RW-3: Carriageway: 5.00 m Coordinates :22°43’15.9911”N, 79°54’7.1796”E
RW-4: Carriageway: 7.80 m Coordinates :22°43’19.8266”N, 79°54’7.2874”E
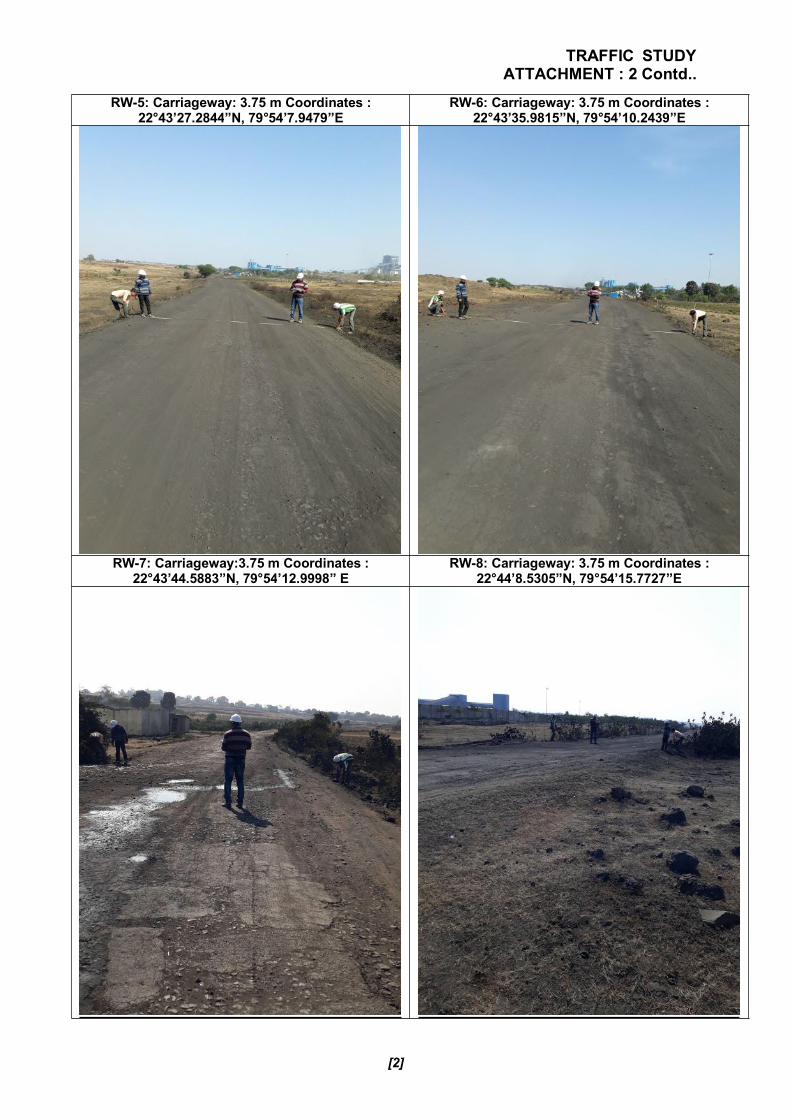
TRAFFIC STUDYATTACHMENT : 2 Contd..
[2]
RW-5: Carriageway: 3.75 m Coordinates :22°43’27.2844”N, 79°54’7.9479”E
RW-6: Carriageway: 3.75 m Coordinates :22°43’35.9815”N, 79°54’10.2439”E
RW-7: Carriageway:3.75 m Coordinates :22°43’44.5883”N, 79°54’12.9998” E
RW-8: Carriageway: 3.75 m Coordinates :22°44’8.5305”N, 79°54’15.7727”E
TRAFFIC STUDYATTACHMENT : 2 Contd..
[3]
CENSUS POINT LOCATIONCP-1: Carriageway: 3.75 m Coordinates : 22°43’29.395284”N, 79°54’9.31123”E
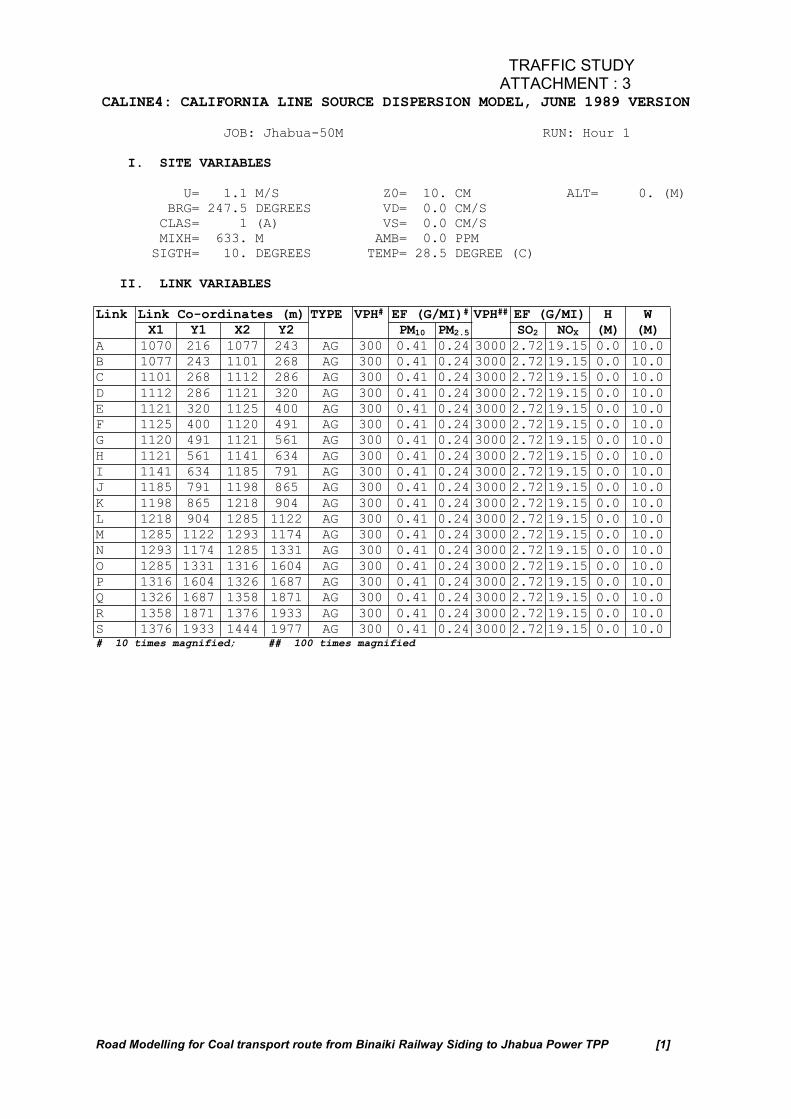
TRAFFIC STUDYATTACHMENT : 3 CONTD.
Road Modelling for Coal transport route from Binaiki Railway Siding to Jhabua Power TPP [1]
CALINE4: CALIFORNIA LINE SOURCE DISPERSION MODEL, JUNE 1989 VERSION
JOB: Jhabua-50M RUN: Hour 1
I. SITE VARIABLES
U= 1.1 M/S Z0= 10. CM ALT= 0. (M)
BRG= 247.5 DEGREES VD= 0.0 CM/S
CLAS= 1 (A) VS= 0.0 CM/S
MIXH= 633. M AMB= 0.0 PPM
SIGTH= 10. DEGREES TEMP= 28.5 DEGREE (C)
II. LINK VARIABLES
Link Link Co-ordinates (m) TYPE VPH# EF (G/MI)# VPH## EF (G/MI) H W
X1 Y1 X2 Y2 PM10 PM2.5 SO2 NOX (M) (M)
A 1070 216 1077 243 AG 300 0.41 0.24 3000 2.72 19.15 0.0 10.0
B 1077 243 1101 268 AG 300 0.41 0.24 3000 2.72 19.15 0.0 10.0
C 1101 268 1112 286 AG 300 0.41 0.24 3000 2.72 19.15 0.0 10.0
D 1112 286 1121 320 AG 300 0.41 0.24 3000 2.72 19.15 0.0 10.0
E 1121 320 1125 400 AG 300 0.41 0.24 3000 2.72 19.15 0.0 10.0
F 1125 400 1120 491 AG 300 0.41 0.24 3000 2.72 19.15 0.0 10.0
G 1120 491 1121 561 AG 300 0.41 0.24 3000 2.72 19.15 0.0 10.0
H 1121 561 1141 634 AG 300 0.41 0.24 3000 2.72 19.15 0.0 10.0
I 1141 634 1185 791 AG 300 0.41 0.24 3000 2.72 19.15 0.0 10.0
J 1185 791 1198 865 AG 300 0.41 0.24 3000 2.72 19.15 0.0 10.0
K 1198 865 1218 904 AG 300 0.41 0.24 3000 2.72 19.15 0.0 10.0
L 1218 904 1285 1122 AG 300 0.41 0.24 3000 2.72 19.15 0.0 10.0
M 1285 1122 1293 1174 AG 300 0.41 0.24 3000 2.72 19.15 0.0 10.0
N 1293 1174 1285 1331 AG 300 0.41 0.24 3000 2.72 19.15 0.0 10.0
O 1285 1331 1316 1604 AG 300 0.41 0.24 3000 2.72 19.15 0.0 10.0
P 1316 1604 1326 1687 AG 300 0.41 0.24 3000 2.72 19.15 0.0 10.0
Q 1326 1687 1358 1871 AG 300 0.41 0.24 3000 2.72 19.15 0.0 10.0
R 1358 1871 1376 1933 AG 300 0.41 0.24 3000 2.72 19.15 0.0 10.0
S 1376 1933 1444 1977 AG 300 0.41 0.24 3000 2.72 19.15 0.0 10.0# 10 times magnified; ## 100 times magnified
TRAFFIC STUDYATTACHMENT : 3 CONTD.
Road Modelling for Coal transport route from Binaiki Railway Siding to Jhabua Power TPP [2]
RECEPTER MAP
TRAFFIC STUDYATTACHMENT : 3 CONTD.
Road Modelling for Coal transport route from Binaiki Railway Siding to Jhabua Power TPP [3]
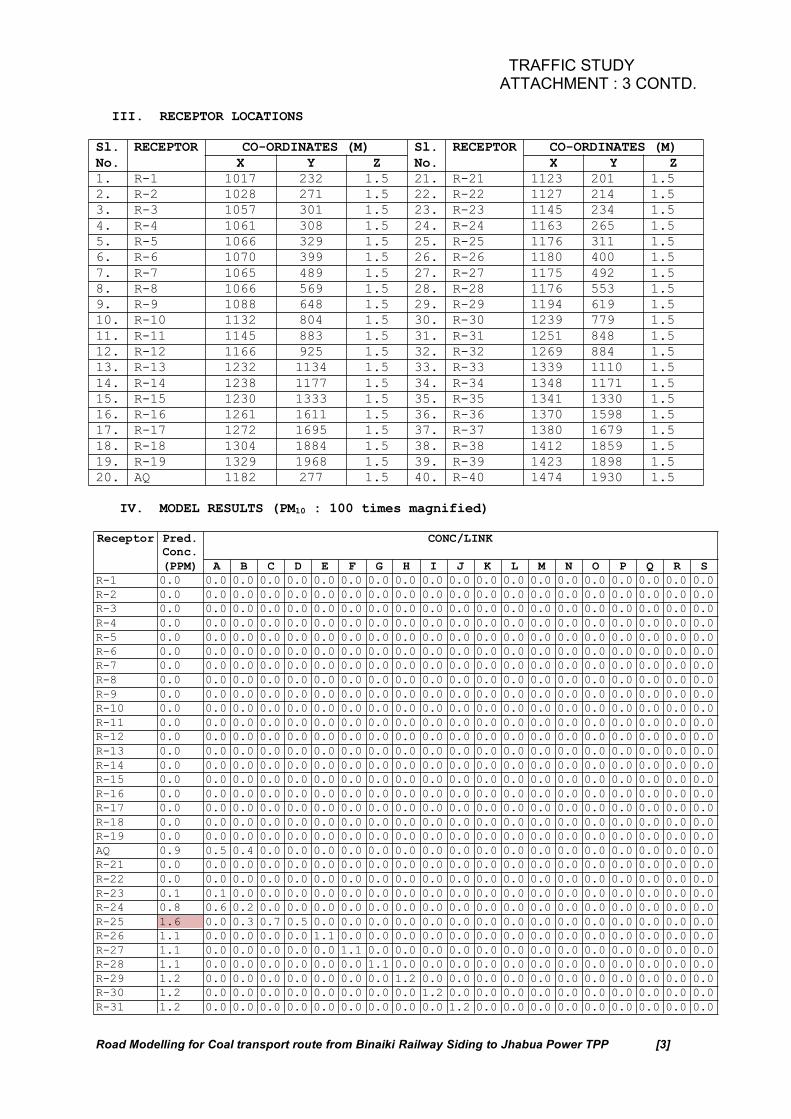
III. RECEPTOR LOCATIONS
Sl. RECEPTOR CO-ORDINATES (M) Sl. RECEPTOR CO-ORDINATES (M)
No. X Y Z No. X Y Z
1. R-1 1017 232 1.5 21. R-21 1123 201 1.5
2. R-2 1028 271 1.5 22. R-22 1127 214 1.5
3. R-3 1057 301 1.5 23. R-23 1145 234 1.5
4. R-4 1061 308 1.5 24. R-24 1163 265 1.5
5. R-5 1066 329 1.5 25. R-25 1176 311 1.5
6. R-6 1070 399 1.5 26. R-26 1180 400 1.5
7. R-7 1065 489 1.5 27. R-27 1175 492 1.5
8. R-8 1066 569 1.5 28. R-28 1176 553 1.5
9. R-9 1088 648 1.5 29. R-29 1194 619 1.5
10. R-10 1132 804 1.5 30. R-30 1239 779 1.5
11. R-11 1145 883 1.5 31. R-31 1251 848 1.5
12. R-12 1166 925 1.5 32. R-32 1269 884 1.5
13. R-13 1232 1134 1.5 33. R-33 1339 1110 1.5
14. R-14 1238 1177 1.5 34. R-34 1348 1171 1.5
15. R-15 1230 1333 1.5 35. R-35 1341 1330 1.5
16. R-16 1261 1611 1.5 36. R-36 1370 1598 1.5
17. R-17 1272 1695 1.5 37. R-37 1380 1679 1.5
18. R-18 1304 1884 1.5 38. R-38 1412 1859 1.5
19. R-19 1329 1968 1.5 39. R-39 1423 1898 1.5
20. AQ 1182 277 1.5 40. R-40 1474 1930 1.5
IV. MODEL RESULTS (PM10 : 100 times magnified)
Receptor Pred.Conc.
CONC/LINK
(PPM) A B C D E F G H I J K L M N O P Q R S
R-1 0.0 0.0 0.0 0.0 0.0 0.0 0.0 0.0 0.0 0.0 0.0 0.0 0.0 0.0 0.0 0.0 0.0 0.0 0.0 0.0
R-2 0.0 0.0 0.0 0.0 0.0 0.0 0.0 0.0 0.0 0.0 0.0 0.0 0.0 0.0 0.0 0.0 0.0 0.0 0.0 0.0
R-3 0.0 0.0 0.0 0.0 0.0 0.0 0.0 0.0 0.0 0.0 0.0 0.0 0.0 0.0 0.0 0.0 0.0 0.0 0.0 0.0
R-4 0.0 0.0 0.0 0.0 0.0 0.0 0.0 0.0 0.0 0.0 0.0 0.0 0.0 0.0 0.0 0.0 0.0 0.0 0.0 0.0
R-5 0.0 0.0 0.0 0.0 0.0 0.0 0.0 0.0 0.0 0.0 0.0 0.0 0.0 0.0 0.0 0.0 0.0 0.0 0.0 0.0
R-6 0.0 0.0 0.0 0.0 0.0 0.0 0.0 0.0 0.0 0.0 0.0 0.0 0.0 0.0 0.0 0.0 0.0 0.0 0.0 0.0
R-7 0.0 0.0 0.0 0.0 0.0 0.0 0.0 0.0 0.0 0.0 0.0 0.0 0.0 0.0 0.0 0.0 0.0 0.0 0.0 0.0
R-8 0.0 0.0 0.0 0.0 0.0 0.0 0.0 0.0 0.0 0.0 0.0 0.0 0.0 0.0 0.0 0.0 0.0 0.0 0.0 0.0
R-9 0.0 0.0 0.0 0.0 0.0 0.0 0.0 0.0 0.0 0.0 0.0 0.0 0.0 0.0 0.0 0.0 0.0 0.0 0.0 0.0
R-10 0.0 0.0 0.0 0.0 0.0 0.0 0.0 0.0 0.0 0.0 0.0 0.0 0.0 0.0 0.0 0.0 0.0 0.0 0.0 0.0
R-11 0.0 0.0 0.0 0.0 0.0 0.0 0.0 0.0 0.0 0.0 0.0 0.0 0.0 0.0 0.0 0.0 0.0 0.0 0.0 0.0
R-12 0.0 0.0 0.0 0.0 0.0 0.0 0.0 0.0 0.0 0.0 0.0 0.0 0.0 0.0 0.0 0.0 0.0 0.0 0.0 0.0
R-13 0.0 0.0 0.0 0.0 0.0 0.0 0.0 0.0 0.0 0.0 0.0 0.0 0.0 0.0 0.0 0.0 0.0 0.0 0.0 0.0
R-14 0.0 0.0 0.0 0.0 0.0 0.0 0.0 0.0 0.0 0.0 0.0 0.0 0.0 0.0 0.0 0.0 0.0 0.0 0.0 0.0
R-15 0.0 0.0 0.0 0.0 0.0 0.0 0.0 0.0 0.0 0.0 0.0 0.0 0.0 0.0 0.0 0.0 0.0 0.0 0.0 0.0
R-16 0.0 0.0 0.0 0.0 0.0 0.0 0.0 0.0 0.0 0.0 0.0 0.0 0.0 0.0 0.0 0.0 0.0 0.0 0.0 0.0
R-17 0.0 0.0 0.0 0.0 0.0 0.0 0.0 0.0 0.0 0.0 0.0 0.0 0.0 0.0 0.0 0.0 0.0 0.0 0.0 0.0
R-18 0.0 0.0 0.0 0.0 0.0 0.0 0.0 0.0 0.0 0.0 0.0 0.0 0.0 0.0 0.0 0.0 0.0 0.0 0.0 0.0
R-19 0.0 0.0 0.0 0.0 0.0 0.0 0.0 0.0 0.0 0.0 0.0 0.0 0.0 0.0 0.0 0.0 0.0 0.0 0.0 0.0
AQ 0.9 0.5 0.4 0.0 0.0 0.0 0.0 0.0 0.0 0.0 0.0 0.0 0.0 0.0 0.0 0.0 0.0 0.0 0.0 0.0
R-21 0.0 0.0 0.0 0.0 0.0 0.0 0.0 0.0 0.0 0.0 0.0 0.0 0.0 0.0 0.0 0.0 0.0 0.0 0.0 0.0
R-22 0.0 0.0 0.0 0.0 0.0 0.0 0.0 0.0 0.0 0.0 0.0 0.0 0.0 0.0 0.0 0.0 0.0 0.0 0.0 0.0
R-23 0.1 0.1 0.0 0.0 0.0 0.0 0.0 0.0 0.0 0.0 0.0 0.0 0.0 0.0 0.0 0.0 0.0 0.0 0.0 0.0
R-24 0.8 0.6 0.2 0.0 0.0 0.0 0.0 0.0 0.0 0.0 0.0 0.0 0.0 0.0 0.0 0.0 0.0 0.0 0.0 0.0
R-25 1.6 0.0 0.3 0.7 0.5 0.0 0.0 0.0 0.0 0.0 0.0 0.0 0.0 0.0 0.0 0.0 0.0 0.0 0.0 0.0
R-26 1.1 0.0 0.0 0.0 0.0 1.1 0.0 0.0 0.0 0.0 0.0 0.0 0.0 0.0 0.0 0.0 0.0 0.0 0.0 0.0
R-27 1.1 0.0 0.0 0.0 0.0 0.0 1.1 0.0 0.0 0.0 0.0 0.0 0.0 0.0 0.0 0.0 0.0 0.0 0.0 0.0
R-28 1.1 0.0 0.0 0.0 0.0 0.0 0.0 1.1 0.0 0.0 0.0 0.0 0.0 0.0 0.0 0.0 0.0 0.0 0.0 0.0
R-29 1.2 0.0 0.0 0.0 0.0 0.0 0.0 0.0 1.2 0.0 0.0 0.0 0.0 0.0 0.0 0.0 0.0 0.0 0.0 0.0
R-30 1.2 0.0 0.0 0.0 0.0 0.0 0.0 0.0 0.0 1.2 0.0 0.0 0.0 0.0 0.0 0.0 0.0 0.0 0.0 0.0
R-31 1.2 0.0 0.0 0.0 0.0 0.0 0.0 0.0 0.0 0.0 1.2 0.0 0.0 0.0 0.0 0.0 0.0 0.0 0.0 0.0
TRAFFIC STUDYATTACHMENT : 3 CONTD.
Road Modelling for Coal transport route from Binaiki Railway Siding to Jhabua Power TPP [4]
Receptor Pred.Conc.
CONC/LINK
(PPM) A B C D E F G H I J K L M N O P Q R S
R-32 1.1 0.0 0.0 0.0 0.0 0.0 0.0 0.0 0.0 0.0 0.9 0.2 0.0 0.0 0.0 0.0 0.0 0.0 0.0 0.0
R-33 1.3 0.0 0.0 0.0 0.0 0.0 0.0 0.0 0.0 0.0 0.0 0.0 1.3 0.0 0.0 0.0 0.0 0.0 0.0 0.0
R-34 1.2 0.0 0.0 0.0 0.0 0.0 0.0 0.0 0.0 0.0 0.0 0.0 0.0 1.2 0.0 0.0 0.0 0.0 0.0 0.0
R-35 1.1 0.0 0.0 0.0 0.0 0.0 0.0 0.0 0.0 0.0 0.0 0.0 0.0 0.0 1.1 0.0 0.0 0.0 0.0 0.0
R-36 1.2 0.0 0.0 0.0 0.0 0.0 0.0 0.0 0.0 0.0 0.0 0.0 0.0 0.0 0.0 1.2 0.0 0.0 0.0 0.0
R-37 1.2 0.0 0.0 0.0 0.0 0.0 0.0 0.0 0.0 0.0 0.0 0.0 0.0 0.0 0.0 0.0 1.2 0.0 0.0 0.0
R-38 1.2 0.0 0.0 0.0 0.0 0.0 0.0 0.0 0.0 0.0 0.0 0.0 0.0 0.0 0.0 0.0 0.0 1.2 0.0 0.0
R-39 1.2 0.0 0.0 0.0 0.0 0.0 0.0 0.0 0.0 0.0 0.0 0.0 0.0 0.0 0.0 0.0 0.0 0.6 0.6 0.0
R-40 0.8 0.0 0.0 0.0 0.0 0.0 0.0 0.0 0.0 0.0 0.0 0.0 0.0 0.0 0.0 0.0 0.0 0.2 0.6 0.0
MODEL RESULTS (PM2.5 : 100 times magnified)
Receptor Pred.
Conc.
CONC/LINK
(PPM) A B C D E F G H I J K L M N O P Q R S
R-1 0.0 0.0 0.0 0.0 0.0 0.0 0.0 0.0 0.0 0.0 0.0 0.0 0.0 0.0 0.0 0.0 0.0 0.0 0.0 0.0
R-2 0.0 0.0 0.0 0.0 0.0 0.0 0.0 0.0 0.0 0.0 0.0 0.0 0.0 0.0 0.0 0.0 0.0 0.0 0.0 0.0
R-3 0.0 0.0 0.0 0.0 0.0 0.0 0.0 0.0 0.0 0.0 0.0 0.0 0.0 0.0 0.0 0.0 0.0 0.0 0.0 0.0
R-4 0.0 0.0 0.0 0.0 0.0 0.0 0.0 0.0 0.0 0.0 0.0 0.0 0.0 0.0 0.0 0.0 0.0 0.0 0.0 0.0
R-5 0.0 0.0 0.0 0.0 0.0 0.0 0.0 0.0 0.0 0.0 0.0 0.0 0.0 0.0 0.0 0.0 0.0 0.0 0.0 0.0
R-6 0.0 0.0 0.0 0.0 0.0 0.0 0.0 0.0 0.0 0.0 0.0 0.0 0.0 0.0 0.0 0.0 0.0 0.0 0.0 0.0
R-7 0.0 0.0 0.0 0.0 0.0 0.0 0.0 0.0 0.0 0.0 0.0 0.0 0.0 0.0 0.0 0.0 0.0 0.0 0.0 0.0
R-8 0.0 0.0 0.0 0.0 0.0 0.0 0.0 0.0 0.0 0.0 0.0 0.0 0.0 0.0 0.0 0.0 0.0 0.0 0.0 0.0
R-9 0.0 0.0 0.0 0.0 0.0 0.0 0.0 0.0 0.0 0.0 0.0 0.0 0.0 0.0 0.0 0.0 0.0 0.0 0.0 0.0
R-10 0.0 0.0 0.0 0.0 0.0 0.0 0.0 0.0 0.0 0.0 0.0 0.0 0.0 0.0 0.0 0.0 0.0 0.0 0.0 0.0
R-11 0.0 0.0 0.0 0.0 0.0 0.0 0.0 0.0 0.0 0.0 0.0 0.0 0.0 0.0 0.0 0.0 0.0 0.0 0.0 0.0
R-12 0.0 0.0 0.0 0.0 0.0 0.0 0.0 0.0 0.0 0.0 0.0 0.0 0.0 0.0 0.0 0.0 0.0 0.0 0.0 0.0
R-13 0.0 0.0 0.0 0.0 0.0 0.0 0.0 0.0 0.0 0.0 0.0 0.0 0.0 0.0 0.0 0.0 0.0 0.0 0.0 0.0
R-14 0.0 0.0 0.0 0.0 0.0 0.0 0.0 0.0 0.0 0.0 0.0 0.0 0.0 0.0 0.0 0.0 0.0 0.0 0.0 0.0
R-15 0.0 0.0 0.0 0.0 0.0 0.0 0.0 0.0 0.0 0.0 0.0 0.0 0.0 0.0 0.0 0.0 0.0 0.0 0.0 0.0
R-16 0.0 0.0 0.0 0.0 0.0 0.0 0.0 0.0 0.0 0.0 0.0 0.0 0.0 0.0 0.0 0.0 0.0 0.0 0.0 0.0
R-17 0.0 0.0 0.0 0.0 0.0 0.0 0.0 0.0 0.0 0.0 0.0 0.0 0.0 0.0 0.0 0.0 0.0 0.0 0.0 0.0
R-18 0.0 0.0 0.0 0.0 0.0 0.0 0.0 0.0 0.0 0.0 0.0 0.0 0.0 0.0 0.0 0.0 0.0 0.0 0.0 0.0
R-19 0.0 0.0 0.0 0.0 0.0 0.0 0.0 0.0 0.0 0.0 0.0 0.0 0.0 0.0 0.0 0.0 0.0 0.0 0.0 0.0
AQ 0.5 0.3 0.2 0.0 0.0 0.0 0.0 0.0 0.0 0.0 0.0 0.0 0.0 0.0 0.0 0.0 0.0 0.0 0.0 0.0
R-21 0.0 0.0 0.0 0.0 0.0 0.0 0.0 0.0 0.0 0.0 0.0 0.0 0.0 0.0 0.0 0.0 0.0 0.0 0.0 0.0
R-22 0.0 0.0 0.0 0.0 0.0 0.0 0.0 0.0 0.0 0.0 0.0 0.0 0.0 0.0 0.0 0.0 0.0 0.0 0.0 0.0
R-23 0.1 0.1 0.0 0.0 0.0 0.0 0.0 0.0 0.0 0.0 0.0 0.0 0.0 0.0 0.0 0.0 0.0 0.0 0.0 0.0
R-24 0.5 0.4 0.1 0.0 0.0 0.0 0.0 0.0 0.0 0.0 0.0 0.0 0.0 0.0 0.0 0.0 0.0 0.0 0.0 0.0
R-25 0.9 0.0 0.2 0.4 0.3 0.0 0.0 0.0 0.0 0.0 0.0 0.0 0.0 0.0 0.0 0.0 0.0 0.0 0.0 0.0
R-26 0.7 0.0 0.0 0.0 0.0 0.7 0.0 0.0 0.0 0.0 0.0 0.0 0.0 0.0 0.0 0.0 0.0 0.0 0.0 0.0
R-27 0.6 0.0 0.0 0.0 0.0 0.0 0.6 0.0 0.0 0.0 0.0 0.0 0.0 0.0 0.0 0.0 0.0 0.0 0.0 0.0
R-28 0.7 0.0 0.0 0.0 0.0 0.0 0.0 0.7 0.0 0.0 0.0 0.0 0.0 0.0 0.0 0.0 0.0 0.0 0.0 0.0
R-29 0.7 0.0 0.0 0.0 0.0 0.0 0.0 0.0 0.7 0.0 0.0 0.0 0.0 0.0 0.0 0.0 0.0 0.0 0.0 0.0
R-30 0.7 0.0 0.0 0.0 0.0 0.0 0.0 0.0 0.0 0.7 0.0 0.0 0.0 0.0 0.0 0.0 0.0 0.0 0.0 0.0
R-31 0.7 0.0 0.0 0.0 0.0 0.0 0.0 0.0 0.0 0.0 0.7 0.0 0.0 0.0 0.0 0.0 0.0 0.0 0.0 0.0
R-32 0.6 0.0 0.0 0.0 0.0 0.0 0.0 0.0 0.0 0.0 0.5 0.1 0.0 0.0 0.0 0.0 0.0 0.0 0.0 0.0
R-33 0.7 0.0 0.0 0.0 0.0 0.0 0.0 0.0 0.0 0.0 0.0 0.0 0.7 0.0 0.0 0.0 0.0 0.0 0.0 0.0
R-34 0.7 0.0 0.0 0.0 0.0 0.0 0.0 0.0 0.0 0.0 0.0 0.0 0.0 0.7 0.0 0.0 0.0 0.0 0.0 0.0
R-35 0.6 0.0 0.0 0.0 0.0 0.0 0.0 0.0 0.0 0.0 0.0 0.0 0.0 0.0 0.6 0.0 0.0 0.0 0.0 0.0
R-36 0.7 0.0 0.0 0.0 0.0 0.0 0.0 0.0 0.0 0.0 0.0 0.0 0.0 0.0 0.0 0.7 0.0 0.0 0.0 0.0
R-37 0.7 0.0 0.0 0.0 0.0 0.0 0.0 0.0 0.0 0.0 0.0 0.0 0.0 0.0 0.0 0.0 0.7 0.0 0.0 0.0
R-38 0.7 0.0 0.0 0.0 0.0 0.0 0.0 0.0 0.0 0.0 0.0 0.0 0.0 0.0 0.0 0.0 0.0 0.7 0.0 0.0
R-39 0.7 0.0 0.0 0.0 0.0 0.0 0.0 0.0 0.0 0.0 0.0 0.0 0.0 0.0 0.0 0.0 0.0 0.3 0.4 0.0
R-40 0.5 0.0 0.0 0.0 0.0 0.0 0.0 0.0 0.0 0.0 0.0 0.0 0.0 0.0 0.0 0.0 0.0 0.1 0.4 0.0
MODEL RESULTS (SO2 : 100 times magnified)
Receptor Pred.
Conc.
CONC/LINK
(PPM) A B C D E F G H I J K L M N O P Q R S
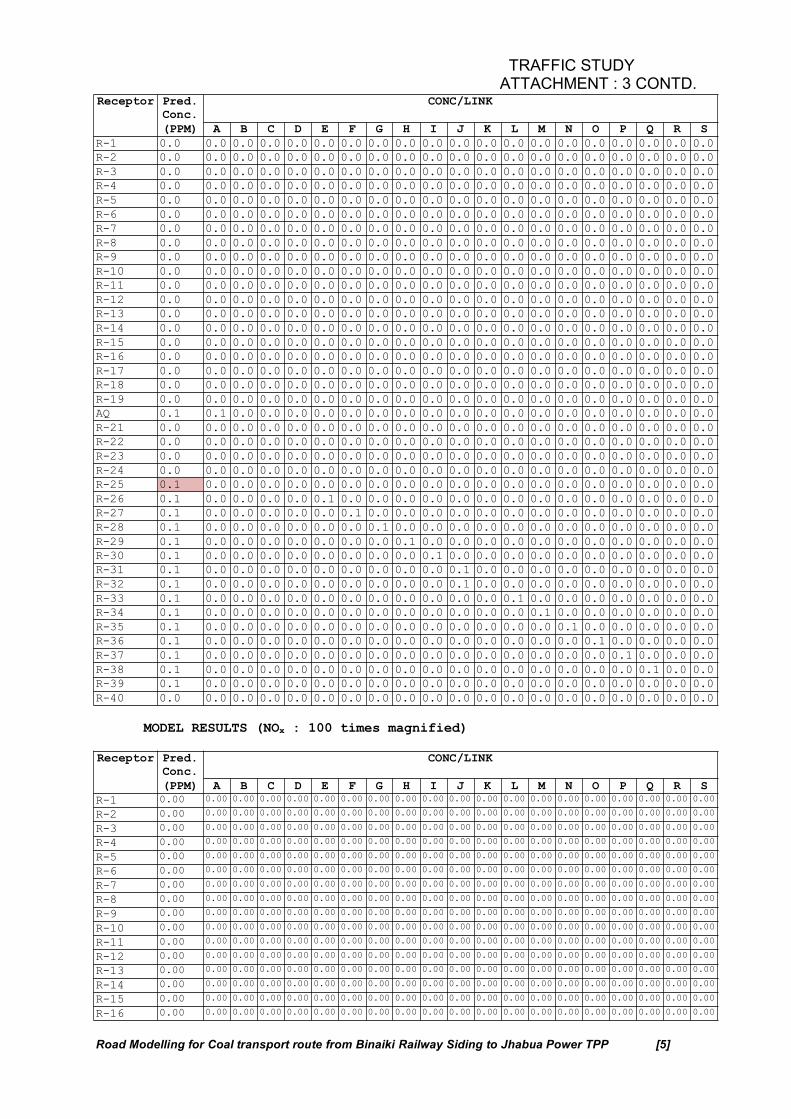
TRAFFIC STUDYATTACHMENT : 3 CONTD.
Road Modelling for Coal transport route from Binaiki Railway Siding to Jhabua Power TPP [5]
Receptor Pred.Conc.
CONC/LINK
(PPM) A B C D E F G H I J K L M N O P Q R S
R-1 0.0 0.0 0.0 0.0 0.0 0.0 0.0 0.0 0.0 0.0 0.0 0.0 0.0 0.0 0.0 0.0 0.0 0.0 0.0 0.0
R-2 0.0 0.0 0.0 0.0 0.0 0.0 0.0 0.0 0.0 0.0 0.0 0.0 0.0 0.0 0.0 0.0 0.0 0.0 0.0 0.0
R-3 0.0 0.0 0.0 0.0 0.0 0.0 0.0 0.0 0.0 0.0 0.0 0.0 0.0 0.0 0.0 0.0 0.0 0.0 0.0 0.0
R-4 0.0 0.0 0.0 0.0 0.0 0.0 0.0 0.0 0.0 0.0 0.0 0.0 0.0 0.0 0.0 0.0 0.0 0.0 0.0 0.0
R-5 0.0 0.0 0.0 0.0 0.0 0.0 0.0 0.0 0.0 0.0 0.0 0.0 0.0 0.0 0.0 0.0 0.0 0.0 0.0 0.0
R-6 0.0 0.0 0.0 0.0 0.0 0.0 0.0 0.0 0.0 0.0 0.0 0.0 0.0 0.0 0.0 0.0 0.0 0.0 0.0 0.0
R-7 0.0 0.0 0.0 0.0 0.0 0.0 0.0 0.0 0.0 0.0 0.0 0.0 0.0 0.0 0.0 0.0 0.0 0.0 0.0 0.0
R-8 0.0 0.0 0.0 0.0 0.0 0.0 0.0 0.0 0.0 0.0 0.0 0.0 0.0 0.0 0.0 0.0 0.0 0.0 0.0 0.0
R-9 0.0 0.0 0.0 0.0 0.0 0.0 0.0 0.0 0.0 0.0 0.0 0.0 0.0 0.0 0.0 0.0 0.0 0.0 0.0 0.0
R-10 0.0 0.0 0.0 0.0 0.0 0.0 0.0 0.0 0.0 0.0 0.0 0.0 0.0 0.0 0.0 0.0 0.0 0.0 0.0 0.0
R-11 0.0 0.0 0.0 0.0 0.0 0.0 0.0 0.0 0.0 0.0 0.0 0.0 0.0 0.0 0.0 0.0 0.0 0.0 0.0 0.0
R-12 0.0 0.0 0.0 0.0 0.0 0.0 0.0 0.0 0.0 0.0 0.0 0.0 0.0 0.0 0.0 0.0 0.0 0.0 0.0 0.0
R-13 0.0 0.0 0.0 0.0 0.0 0.0 0.0 0.0 0.0 0.0 0.0 0.0 0.0 0.0 0.0 0.0 0.0 0.0 0.0 0.0
R-14 0.0 0.0 0.0 0.0 0.0 0.0 0.0 0.0 0.0 0.0 0.0 0.0 0.0 0.0 0.0 0.0 0.0 0.0 0.0 0.0
R-15 0.0 0.0 0.0 0.0 0.0 0.0 0.0 0.0 0.0 0.0 0.0 0.0 0.0 0.0 0.0 0.0 0.0 0.0 0.0 0.0
R-16 0.0 0.0 0.0 0.0 0.0 0.0 0.0 0.0 0.0 0.0 0.0 0.0 0.0 0.0 0.0 0.0 0.0 0.0 0.0 0.0
R-17 0.0 0.0 0.0 0.0 0.0 0.0 0.0 0.0 0.0 0.0 0.0 0.0 0.0 0.0 0.0 0.0 0.0 0.0 0.0 0.0
R-18 0.0 0.0 0.0 0.0 0.0 0.0 0.0 0.0 0.0 0.0 0.0 0.0 0.0 0.0 0.0 0.0 0.0 0.0 0.0 0.0
R-19 0.0 0.0 0.0 0.0 0.0 0.0 0.0 0.0 0.0 0.0 0.0 0.0 0.0 0.0 0.0 0.0 0.0 0.0 0.0 0.0
AQ 0.1 0.1 0.0 0.0 0.0 0.0 0.0 0.0 0.0 0.0 0.0 0.0 0.0 0.0 0.0 0.0 0.0 0.0 0.0 0.0
R-21 0.0 0.0 0.0 0.0 0.0 0.0 0.0 0.0 0.0 0.0 0.0 0.0 0.0 0.0 0.0 0.0 0.0 0.0 0.0 0.0
R-22 0.0 0.0 0.0 0.0 0.0 0.0 0.0 0.0 0.0 0.0 0.0 0.0 0.0 0.0 0.0 0.0 0.0 0.0 0.0 0.0
R-23 0.0 0.0 0.0 0.0 0.0 0.0 0.0 0.0 0.0 0.0 0.0 0.0 0.0 0.0 0.0 0.0 0.0 0.0 0.0 0.0
R-24 0.0 0.0 0.0 0.0 0.0 0.0 0.0 0.0 0.0 0.0 0.0 0.0 0.0 0.0 0.0 0.0 0.0 0.0 0.0 0.0
R-25 0.1 0.0 0.0 0.0 0.0 0.0 0.0 0.0 0.0 0.0 0.0 0.0 0.0 0.0 0.0 0.0 0.0 0.0 0.0 0.0
R-26 0.1 0.0 0.0 0.0 0.0 0.1 0.0 0.0 0.0 0.0 0.0 0.0 0.0 0.0 0.0 0.0 0.0 0.0 0.0 0.0
R-27 0.1 0.0 0.0 0.0 0.0 0.0 0.1 0.0 0.0 0.0 0.0 0.0 0.0 0.0 0.0 0.0 0.0 0.0 0.0 0.0
R-28 0.1 0.0 0.0 0.0 0.0 0.0 0.0 0.1 0.0 0.0 0.0 0.0 0.0 0.0 0.0 0.0 0.0 0.0 0.0 0.0
R-29 0.1 0.0 0.0 0.0 0.0 0.0 0.0 0.0 0.1 0.0 0.0 0.0 0.0 0.0 0.0 0.0 0.0 0.0 0.0 0.0
R-30 0.1 0.0 0.0 0.0 0.0 0.0 0.0 0.0 0.0 0.1 0.0 0.0 0.0 0.0 0.0 0.0 0.0 0.0 0.0 0.0
R-31 0.1 0.0 0.0 0.0 0.0 0.0 0.0 0.0 0.0 0.0 0.1 0.0 0.0 0.0 0.0 0.0 0.0 0.0 0.0 0.0
R-32 0.1 0.0 0.0 0.0 0.0 0.0 0.0 0.0 0.0 0.0 0.1 0.0 0.0 0.0 0.0 0.0 0.0 0.0 0.0 0.0
R-33 0.1 0.0 0.0 0.0 0.0 0.0 0.0 0.0 0.0 0.0 0.0 0.0 0.1 0.0 0.0 0.0 0.0 0.0 0.0 0.0
R-34 0.1 0.0 0.0 0.0 0.0 0.0 0.0 0.0 0.0 0.0 0.0 0.0 0.0 0.1 0.0 0.0 0.0 0.0 0.0 0.0
R-35 0.1 0.0 0.0 0.0 0.0 0.0 0.0 0.0 0.0 0.0 0.0 0.0 0.0 0.0 0.1 0.0 0.0 0.0 0.0 0.0
R-36 0.1 0.0 0.0 0.0 0.0 0.0 0.0 0.0 0.0 0.0 0.0 0.0 0.0 0.0 0.0 0.1 0.0 0.0 0.0 0.0
R-37 0.1 0.0 0.0 0.0 0.0 0.0 0.0 0.0 0.0 0.0 0.0 0.0 0.0 0.0 0.0 0.0 0.1 0.0 0.0 0.0
R-38 0.1 0.0 0.0 0.0 0.0 0.0 0.0 0.0 0.0 0.0 0.0 0.0 0.0 0.0 0.0 0.0 0.0 0.1 0.0 0.0
R-39 0.1 0.0 0.0 0.0 0.0 0.0 0.0 0.0 0.0 0.0 0.0 0.0 0.0 0.0 0.0 0.0 0.0 0.0 0.0 0.0
R-40 0.0 0.0 0.0 0.0 0.0 0.0 0.0 0.0 0.0 0.0 0.0 0.0 0.0 0.0 0.0 0.0 0.0 0.0 0.0 0.0
MODEL RESULTS (NOx : 100 times magnified)
Receptor Pred.Conc.
CONC/LINK
(PPM) A B C D E F G H I J K L M N O P Q R S
R-1 0.00 0.00 0.00 0.00 0.00 0.00 0.00 0.00 0.00 0.00 0.00 0.00 0.00 0.00 0.00 0.00 0.00 0.00 0.00 0.00
R-2 0.00 0.00 0.00 0.00 0.00 0.00 0.00 0.00 0.00 0.00 0.00 0.00 0.00 0.00 0.00 0.00 0.00 0.00 0.00 0.00
R-3 0.00 0.00 0.00 0.00 0.00 0.00 0.00 0.00 0.00 0.00 0.00 0.00 0.00 0.00 0.00 0.00 0.00 0.00 0.00 0.00
R-4 0.00 0.00 0.00 0.00 0.00 0.00 0.00 0.00 0.00 0.00 0.00 0.00 0.00 0.00 0.00 0.00 0.00 0.00 0.00 0.00
R-5 0.00 0.00 0.00 0.00 0.00 0.00 0.00 0.00 0.00 0.00 0.00 0.00 0.00 0.00 0.00 0.00 0.00 0.00 0.00 0.00
R-6 0.00 0.00 0.00 0.00 0.00 0.00 0.00 0.00 0.00 0.00 0.00 0.00 0.00 0.00 0.00 0.00 0.00 0.00 0.00 0.00
R-7 0.00 0.00 0.00 0.00 0.00 0.00 0.00 0.00 0.00 0.00 0.00 0.00 0.00 0.00 0.00 0.00 0.00 0.00 0.00 0.00
R-8 0.00 0.00 0.00 0.00 0.00 0.00 0.00 0.00 0.00 0.00 0.00 0.00 0.00 0.00 0.00 0.00 0.00 0.00 0.00 0.00
R-9 0.00 0.00 0.00 0.00 0.00 0.00 0.00 0.00 0.00 0.00 0.00 0.00 0.00 0.00 0.00 0.00 0.00 0.00 0.00 0.00
R-10 0.00 0.00 0.00 0.00 0.00 0.00 0.00 0.00 0.00 0.00 0.00 0.00 0.00 0.00 0.00 0.00 0.00 0.00 0.00 0.00
R-11 0.00 0.00 0.00 0.00 0.00 0.00 0.00 0.00 0.00 0.00 0.00 0.00 0.00 0.00 0.00 0.00 0.00 0.00 0.00 0.00
R-12 0.00 0.00 0.00 0.00 0.00 0.00 0.00 0.00 0.00 0.00 0.00 0.00 0.00 0.00 0.00 0.00 0.00 0.00 0.00 0.00
R-13 0.00 0.00 0.00 0.00 0.00 0.00 0.00 0.00 0.00 0.00 0.00 0.00 0.00 0.00 0.00 0.00 0.00 0.00 0.00 0.00
R-14 0.00 0.00 0.00 0.00 0.00 0.00 0.00 0.00 0.00 0.00 0.00 0.00 0.00 0.00 0.00 0.00 0.00 0.00 0.00 0.00
R-15 0.00 0.00 0.00 0.00 0.00 0.00 0.00 0.00 0.00 0.00 0.00 0.00 0.00 0.00 0.00 0.00 0.00 0.00 0.00 0.00
R-16 0.00 0.00 0.00 0.00 0.00 0.00 0.00 0.00 0.00 0.00 0.00 0.00 0.00 0.00 0.00 0.00 0.00 0.00 0.00 0.00
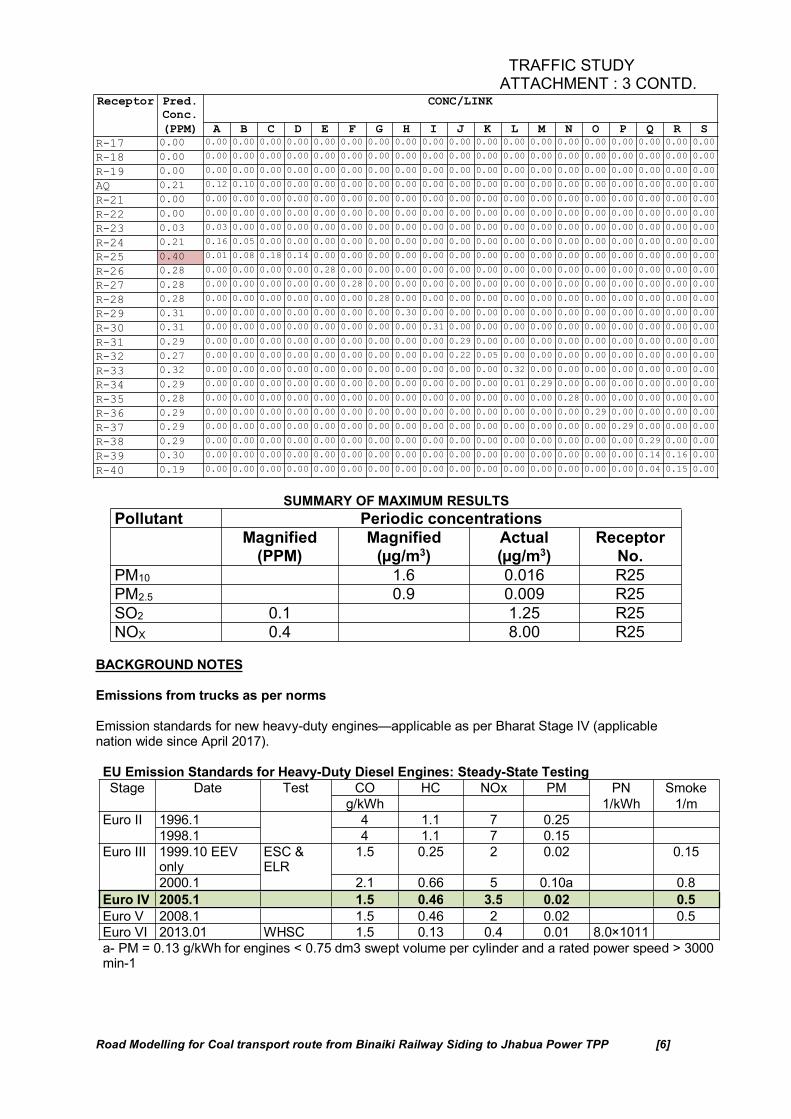
TRAFFIC STUDYATTACHMENT : 3 CONTD.
Road Modelling for Coal transport route from Binaiki Railway Siding to Jhabua Power TPP [6]
Receptor Pred.Conc.
CONC/LINK
(PPM) A B C D E F G H I J K L M N O P Q R S
R-17 0.00 0.00 0.00 0.00 0.00 0.00 0.00 0.00 0.00 0.00 0.00 0.00 0.00 0.00 0.00 0.00 0.00 0.00 0.00 0.00
R-18 0.00 0.00 0.00 0.00 0.00 0.00 0.00 0.00 0.00 0.00 0.00 0.00 0.00 0.00 0.00 0.00 0.00 0.00 0.00 0.00
R-19 0.00 0.00 0.00 0.00 0.00 0.00 0.00 0.00 0.00 0.00 0.00 0.00 0.00 0.00 0.00 0.00 0.00 0.00 0.00 0.00
AQ 0.21 0.12 0.10 0.00 0.00 0.00 0.00 0.00 0.00 0.00 0.00 0.00 0.00 0.00 0.00 0.00 0.00 0.00 0.00 0.00
R-21 0.00 0.00 0.00 0.00 0.00 0.00 0.00 0.00 0.00 0.00 0.00 0.00 0.00 0.00 0.00 0.00 0.00 0.00 0.00 0.00
R-22 0.00 0.00 0.00 0.00 0.00 0.00 0.00 0.00 0.00 0.00 0.00 0.00 0.00 0.00 0.00 0.00 0.00 0.00 0.00 0.00
R-23 0.03 0.03 0.00 0.00 0.00 0.00 0.00 0.00 0.00 0.00 0.00 0.00 0.00 0.00 0.00 0.00 0.00 0.00 0.00 0.00
R-24 0.21 0.16 0.05 0.00 0.00 0.00 0.00 0.00 0.00 0.00 0.00 0.00 0.00 0.00 0.00 0.00 0.00 0.00 0.00 0.00
R-25 0.40 0.01 0.08 0.18 0.14 0.00 0.00 0.00 0.00 0.00 0.00 0.00 0.00 0.00 0.00 0.00 0.00 0.00 0.00 0.00
R-26 0.28 0.00 0.00 0.00 0.00 0.28 0.00 0.00 0.00 0.00 0.00 0.00 0.00 0.00 0.00 0.00 0.00 0.00 0.00 0.00
R-27 0.28 0.00 0.00 0.00 0.00 0.00 0.28 0.00 0.00 0.00 0.00 0.00 0.00 0.00 0.00 0.00 0.00 0.00 0.00 0.00
R-28 0.28 0.00 0.00 0.00 0.00 0.00 0.00 0.28 0.00 0.00 0.00 0.00 0.00 0.00 0.00 0.00 0.00 0.00 0.00 0.00
R-29 0.31 0.00 0.00 0.00 0.00 0.00 0.00 0.00 0.30 0.00 0.00 0.00 0.00 0.00 0.00 0.00 0.00 0.00 0.00 0.00
R-30 0.31 0.00 0.00 0.00 0.00 0.00 0.00 0.00 0.00 0.31 0.00 0.00 0.00 0.00 0.00 0.00 0.00 0.00 0.00 0.00
R-31 0.29 0.00 0.00 0.00 0.00 0.00 0.00 0.00 0.00 0.00 0.29 0.00 0.00 0.00 0.00 0.00 0.00 0.00 0.00 0.00
R-32 0.27 0.00 0.00 0.00 0.00 0.00 0.00 0.00 0.00 0.00 0.22 0.05 0.00 0.00 0.00 0.00 0.00 0.00 0.00 0.00
R-33 0.32 0.00 0.00 0.00 0.00 0.00 0.00 0.00 0.00 0.00 0.00 0.00 0.32 0.00 0.00 0.00 0.00 0.00 0.00 0.00
R-34 0.29 0.00 0.00 0.00 0.00 0.00 0.00 0.00 0.00 0.00 0.00 0.00 0.01 0.29 0.00 0.00 0.00 0.00 0.00 0.00
R-35 0.28 0.00 0.00 0.00 0.00 0.00 0.00 0.00 0.00 0.00 0.00 0.00 0.00 0.00 0.28 0.00 0.00 0.00 0.00 0.00
R-36 0.29 0.00 0.00 0.00 0.00 0.00 0.00 0.00 0.00 0.00 0.00 0.00 0.00 0.00 0.00 0.29 0.00 0.00 0.00 0.00
R-37 0.29 0.00 0.00 0.00 0.00 0.00 0.00 0.00 0.00 0.00 0.00 0.00 0.00 0.00 0.00 0.00 0.29 0.00 0.00 0.00
R-38 0.29 0.00 0.00 0.00 0.00 0.00 0.00 0.00 0.00 0.00 0.00 0.00 0.00 0.00 0.00 0.00 0.00 0.29 0.00 0.00
R-39 0.30 0.00 0.00 0.00 0.00 0.00 0.00 0.00 0.00 0.00 0.00 0.00 0.00 0.00 0.00 0.00 0.00 0.14 0.16 0.00
R-40 0.19 0.00 0.00 0.00 0.00 0.00 0.00 0.00 0.00 0.00 0.00 0.00 0.00 0.00 0.00 0.00 0.00 0.04 0.15 0.00
SUMMARY OF MAXIMUM RESULTS
Pollutant Periodic concentrations
Magnified(PPM)
Magnified(µg/m3)
Actual(µg/m3)
ReceptorNo.
PM10 1.6 0.016 R25
PM2.5 0.9 0.009 R25
SO2 0.1 1.25 R25
NOX 0.4 8.00 R25
BACKGROUND NOTES
Emissions from trucks as per norms
Emission standards for new heavy-duty engines—applicable as per Bharat Stage IV (applicablenation wide since April 2017).
EU Emission Standards for Heavy-Duty Diesel Engines: Steady-State Testing
Stage Date Test CO HC NOx PM PN Smoke
g/kWh 1/kWh 1/m
Euro II 1996.1 4 1.1 7 0.25
1998.1 4 1.1 7 0.15
Euro III 1999.10 EEVonly
ESC &ELR
1.5 0.25 2 0.02 0.15
2000.1 2.1 0.66 5 0.10a 0.8
Euro IV 2005.1 1.5 0.46 3.5 0.02 0.5
Euro V 2008.1 1.5 0.46 2 0.02 0.5
Euro VI 2013.01 WHSC 1.5 0.13 0.4 0.01 8.0×10¹¹
a- PM = 0.13 g/kWh for engines < 0.75 dm3 swept volume per cylinder and a rated power speed > 3000min-1
TRAFFIC STUDYATTACHMENT : 3 CONTD.
Road Modelling for Coal transport route from Binaiki Railway Siding to Jhabua Power TPP [7]
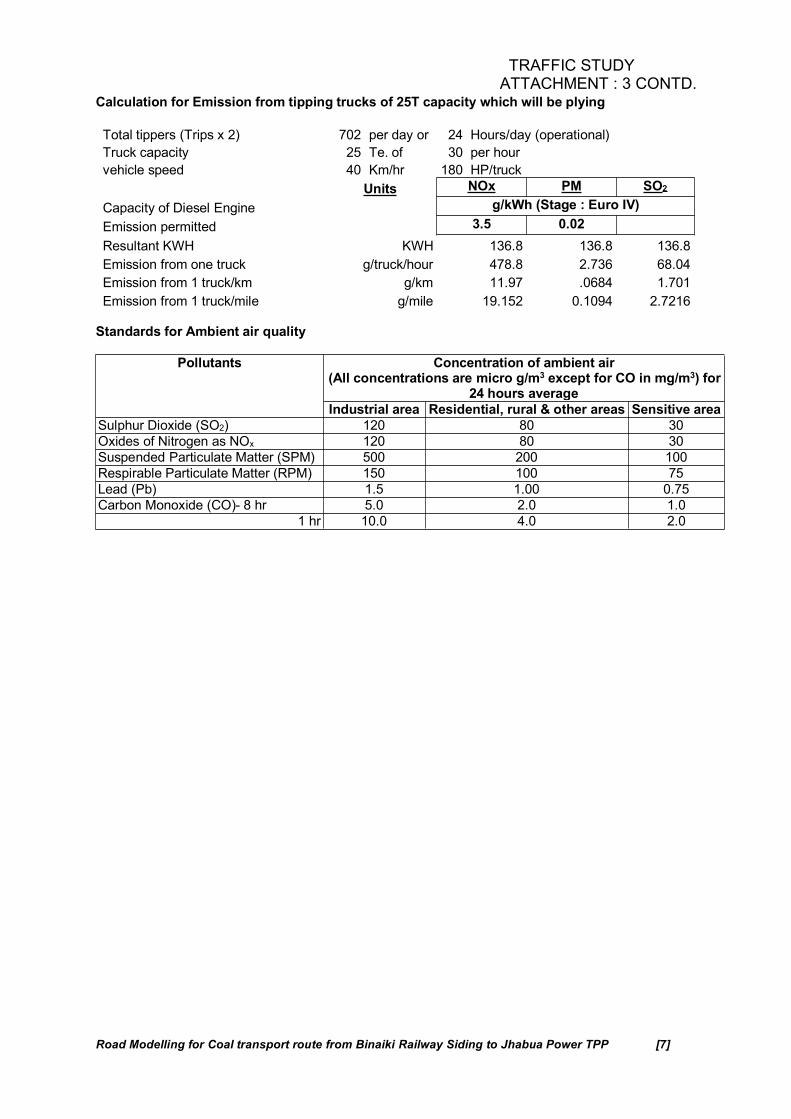
Calculation for Emission from tipping trucks of 25T capacity which will be plying
Total tippers (Trips x 2) 702 per day or 24 Hours/day (operational)
Truck capacity 25 Te. of 30 per hour
vehicle speed 40 Km/hr 180 HP/truck
Units NOx PM SO2
Capacity of Diesel Engine g/kWh (Stage : Euro IV)
Emission permitted 3.5 0.02
Resultant KWH KWH 136.8 136.8 136.8
Emission from one truck g/truck/hour 478.8 2.736 68.04
Emission from 1 truck/km g/km 11.97 .0684 1.701
Emission from 1 truck/mile g/mile 19.152 0.1094 2.7216
Standards for Ambient air quality
Pollutants Concentration of ambient air(All concentrations are micro g/m3 except for CO in mg/m3) for
24 hours average
Industrial area Residential, rural & other areas Sensitive area
Sulphur Dioxide (SO2) 120 80 30
Oxides of Nitrogen as NOx 120 80 30
Suspended Particulate Matter (SPM) 500 200 100
Respirable Particulate Matter (RPM) 150 100 75
Lead (Pb) 1.5 1.00 0.75
Carbon Monoxide (CO)- 8 hr 5.0 2.0 1.0
1 hr 10.0 4.0 2.0
TRAFFIC STUDY
ATTACHMENT : 4 CONTD.
- 1 -
ROAD TRANSPORT MANAGEMENT SYSTEM:
A road transport system is developed for the safe & effective transportation which includes
the following;
1.0 DRIVER RECRUITMENT:
A policy and procedure for Road Transporters is developed to address the requirements in
recruiting new drivers and to recruit the best driver available. Recruitment policy and
procedures is included age, physical applicability, medical check, educations, previous
employment background, knowledge test,
2.0 DRIVER SALARY PACKAGE:
Driver’s behavior and performances is largely dependent on its remuneration and
motivation. As such, the salary package shall not structure in a way encouraging drivers
violations, to work or drive beyond the specific hours.
Individual drivers is monitored and measured in the specific measurements based on its
safety behavior and performance.
3.0 DRIVER TRAINING:
A system is developed to ensure that the training needs of Drivers are identified and
satisfied in an appropriate and adequate manner so that transportation is carried out
competently and safely. The driver is trained based on the characteristics of the work
activities. The training is delivered by competent trainer and properly assessed.
4.0 DRIVER MONITORING:
The company is prepare a formal system and procedures to monitor and promote safe
driving behavior and performance. Unsafe behavior and traffic violations is counseled and
disciplinary actions taken on repeated offenders. Undertake by Road rangers/ contract
supervisor, Monitoring are carried out through Road surveillance audit, Driver’ log, drug
and alcohol random testing.
5.0 SEAT BELT POLICY:
� Seat belts in vehicle are mandatory installation and use by all vehicles occupants in
vehicles performing transportation services. Regular engagement with users to
promote use of seat belt.
� Regular road surveillance is performed to ensure seat belt is used by drivers.
� Daily Pre-trip check of the vehicle includes seat belt to ensure seat belts are in function
properly all the time.
TRAFFIC STUDY
ATTACHMENT : 4 CONTD.
- 2 -
6.0 MOBILE PHONE POLICY:
The used of mobile phone whilst driving is identified as a contributing factor in road
accidents. Drivers shall not initiate nor answer a mobile phone call whilst the vehicle he is
driving is in operations.
The scope includes all drivers. Driver must not initiate or answer a call (including text
messaging or hand free) whilst the vehicle is in operations, including a call stopped at a
traffic light. The best recommended practice will be “Engine on- phone off”
7.0 DRUG AND ALCOHOL POLICY:
Drivers is not operate a vehicle while under the influence of alcohol, drugs, narcotics or
medication that could impair the operator’s ability to safely operate the vehicle.
Following is the principles of tests in the form of spot checks to assure the policy are
properly implemented.Random basis, with at least 10% of the screened on a monthly basis;
� in specific circumstances, such as after an accident or incident, the driver must
be tested;
� Testing the particular person reporting to work with a drinking
symptom.
� Random testing of visiting drivers at least 5% shall be screened on a monthly
basis.
� The screening rate shall be increased after major festival/team
buildings events.
8.0 TYRE POLICY:
The tire policy i developed, which includes tire inspection procedure, change and
management.
� Tire Inspections and replacement frequency.
� Tire types and use on specific axle.
� Twining of tires (checks regarding equal wear on each tire).
� Regulations of tire pressures.
� Rules regarding repair and re-treading.
9.0 AUDIT & REVIEW:
Planned and systematic audits of land transport operations together with management
reviews of performance is established and maintained as an integral part of the land
transport operations.
TRAFFIC STUDY
ATTACHMENT : 4 CONTD.
- 3 -
10.0 CONTROLLING THE RISKS:
Following preferred order of control measures to eliminate or reduce the risks of injury or
harm is adopted during road transportation:
� SAFE SIGNS:
• Speed limit.
• Sharp bends.
• Junctions.
• Blind corners.
• Steep gradients.
• Road work.
� SAFE REVERSING:
• Ensuring rear vision mirrors & fixed safety mirrors are kept clean.
• Keeping reversing alarms in good order.
• Placing fixed mirrors at blind corners.
� SPEED RAMPS
• Speed ramps will be installed at entry & outgoing way of the each village.
• Warning signs will be provided at entry of the each village.