00 contents glossary - sa.gov.au and glossary i water sensitive urban design – greater adelaide...
TRANSCRIPT

Contents and Glossary
i Water Sensitive Urban Design – Greater Adelaide Region Technical Manual – December 2010
Water Sensitive Urban Design Technical Manual
Contents
Chapter 1 Introduction 1.1 What is Water Sensitive Urban Design?.................................................................... 1-1
1.2 Water Sensitive Urban Design Objectives and Principles ....................................... 1-3
1.3 Purpose, Target Audience and Scope of the Technical Manual.............................. 1-5
1.4 Structure of the Technical Manual ............................................................................. 1-8
1.5 Snapshot of 12 WSUD Measures.............................................................................. 1-10
1.6 References................................................................................................................... 1-33
Tables Table 1.1 WSUD Measures: Role, Focus, Site Conditions and Benefits...................... 1-31
Figures Figure 1.1 Grange Golf Course, Stormwater Harvesting and Reuse ........................... 1-16
Figure 1.2 Bioretention Swale, Mawson Lakes, SA........................................................ 1-19
Figure 1.3 Bioretention Basin, Palmer Road, Aldinga Beach ........................................ 1-21
Figure 1.4 Swale at Pine Lakes, City of Salisbury .......................................................... 1-22
Figure 1.5 Brookes Bridge Sedimentation Basin............................................................. 1-24
Figure 1.6 Laratinga Wetlands, Mt Barker...................................................................... 1-26
Contents and Glossary
ii Water Sensitive Urban Design – Greater Adelaide Region Technical Manual – December 2010
Chapter 2 WSUD Measures for Different Types and Scale of Development 2.1 Introduction..................................................................................................................2-1
2.2 Treatment Train............................................................................................................2-5
2.3 Single Residential Development ................................................................................2-7
2.4 Residential Subdivision............................................................................................. 2-10
2.5 Residential Multi-unit Development ....................................................................... 2-13
2.6 Streetscape Development .......................................................................................... 2-16
2.7 Vehicle Parking Area Development......................................................................... 2-21
2.8 Commercial and Industrial Sites .............................................................................. 2-25
2.9 Public Open Space ..................................................................................................... 2-28
2.10 Opportunities for Retrofitting .................................................................................. 2-31
2.11 References ................................................................................................................... 2-33
Tables Table 2.1 Applicability of WSUD Measures to Different Development Types in
the Greater Adelaide Region ............................................................................2-3
Table 2.2 Potential Constraints Associated with WSUD Application ..........................2-4
Table 2.3 Stormwater Pollutant Management Issues and Appropriate Treatment Processes.............................................................................................................2-6
Figures Figure 2.1 Example of an Overall WSUD Strategy for a Typical Suburban Dwelling..2-9
Figure 2.2 Schematic of a WSUD Multi-unit Layout Utilising Groundwater Recharge and Stormwater Reuse ................................................................... 2-15
Figure 2.3 Retrofit of Street with a Swale, City of Onkaparinga................................... 2-17
Figure 2.4 Conventional vs Water Sensitive Road Layout ............................................ 2-18
Figure 2.5 Verge Design and Maintenance ..................................................................... 2-19
Figure 2.6 Diagram of Water Sensitive Residential Streetscape Showing Bioretention Swale Street Drainage ............................................................... 2-20
Figure 2.7 Road Verge and Carpark Area ....................................................................... 2-22
Figure 2.8 Carpark Design Incorporating WSUD Measures ......................................... 2-23
Figure 2.9 Vehicle Parking Area Layout Example Incorporating WSUD Measures... 2-24
Figure 2.10 Industrial or Commercial Site Layout Example Incorporating WSUD Measures........................................................................................................... 2-27
Figure 2.11 Conventional Urban Layout vs WSUD Urban Layout (Showing Public Open Space Provisions)................................................................................... 2-29

Contents and Glossary
iii Water Sensitive Urban Design – Greater Adelaide Region Technical Manual – December 2010
Chapter 3 Designing a WSUD Strategy for Your Development 3.1 Overview ...................................................................................................................... 3-1
3.2 12 Step Decision Process ............................................................................................. 3-2
3.3 References................................................................................................................... 3-13
Tables Table 3.1 Site Suitability Review ...................................................................................... 3-5
Table 3.2 Indicative Information Requirements ............................................................. 3-6
Figures Figure 3.1 WSUD Decision Process Flowchart ................................................................. 3-3
Appendices Appendix A Design Implementation Process Checklist
Appendix B Site Analysis Information
Appendix C Setting Objectives
Appendix D WSUD Principles
Appendix E WSUD Treatment Train Suitability Assessment

Contents and Glossary
iv Water Sensitive Urban Design – Greater Adelaide Region Technical Manual – December 2010
Chapter 4 Demand Reduction 4.1 Overview ......................................................................................................................4-1
4.2 Water Restrictions and Applicable Legislation.........................................................4-2
4.3 Where Do We Use Water?...........................................................................................4-4
4.4 Demand Reduction Approach....................................................................................4-5
4.5 Water Efficiency Labelling and Standards Scheme ................................................ 4-10
4.6 Techniques.................................................................................................................. 4-12
4.7 Education and Incentives .......................................................................................... 4-24
4.8 Case Studies................................................................................................................ 4-27
4.9 Useful Resources and Further Information............................................................. 4-32
4.10 References ................................................................................................................... 4-37
Tables Table 4.1 Estimated Typical Household Water Demands (litres/day) ........................4-4
Table 4.2 Water Efficiency Rating................................................................................... 4-11
Table 4.3 Demand Reduction Measures Applicable to a Range of Development Types................................................................................................................. 4-12
Table 4.4 Examples of Education and Communication Programs.............................. 4-25
Figures Figure 4.1 Water Rating Label Example .......................................................................... 4-10
Figure 4.2 Types of Tap Flow Aerators ........................................................................... 4-13
Appendices
Appendix A Legislation
Appendix B Water Usage Data
Appendix C Checklists
Contents and Glossary
v Water Sensitive Urban Design – Greater Adelaide Region Technical Manual – December 2010
Chapter 5 Rainwater Tanks 5.1 Overview ...................................................................................................................... 5-1
5.2 Legislative Requirements and Approvals ................................................................. 5-3
5.3 Design Considerations ................................................................................................ 5-8
5.4 Design Process ........................................................................................................... 5-13
5.5 Design Tools............................................................................................................... 5-24
5.6 Installation/Construction Process ........................................................................... 5-27
5.7 Maintenance Requirements ...................................................................................... 5-28
5.8 Approximate Costs and Manufacturer Information .............................................. 5-29
5.9 Useful Resources and Further Information............................................................. 5-32
5.10 References................................................................................................................... 5-35
Tables Table 5.1 Standards Relating to Rainwater Tanks.......................................................... 5-7
Table 5.2 Metal Tanks...................................................................................................... 5-15
Table 5.3 Concrete Tanks ................................................................................................ 5-16
Table 5.4 Plastic Tanks .................................................................................................... 5-17
Table 5.5 Innovative Tanks ............................................................................................. 5-18
Table 5.6 Indicative Flow Rate and Pressure Requirements for a Range of Demands........................................................................................................... 5-22
Table 5.7 Indicative Rainwater Tank System Costs...................................................... 5-30
Table 5.8 Rainwater Tank Equipment Suppliers in the Greater Adelaide Region.... 5-31
Figures Figure 5.1 Pressurised Rainwater Supply with Mains Supply Back Up...................... 5-10
Figure 5.2 Gravity Rainwater Supply with Mains Supply Top Up to Tank................ 5-11
Figure 5.3 Pressurised Rainwater Supply with Mains Supply Back Up From a Buried or Partially Buried Tank..................................................................... 5-11
Figure 5.4 Example of a Metal Tank ................................................................................ 5-15
Figure 5.5 Example of a Concrete Tank........................................................................... 5-16
Figure 5.6 Example of a Plastic Tank............................................................................... 5-17
Figure 5.7 Example of a Bladder Tank ............................................................................ 5-18
Figure 5.8 Rainwater Tank Yield Curves for a Roof Area of 150 square metres with an Average Annual Rainfall of 500–600 millimetres/year.......................... 5-25
Contents and Glossary
vi Water Sensitive Urban Design – Greater Adelaide Region Technical Manual – December 2010
Appendices Appendix A Annual Rainfall and Rainwater Tank Harvesting Curves
Appendix B Rainwater Tank Harvesting Case Study
Appendix C Checklists

Contents and Glossary
vii Water Sensitive Urban Design – Greater Adelaide Region Technical Manual – December 2010
Chapter 6 Rain Gardens, Green Roofs and Infiltration Systems 6.1 Overview ...................................................................................................................... 6-1
6.2 Legislative Requirements and Approvals ................................................................. 6-2
6.3 Rain Gardens................................................................................................................ 6-3
6.4 Green Roofs ................................................................................................................ 6-12
6.5 Infiltration Systems.................................................................................................... 6-22
6.6 Useful Resources and Further Information............................................................. 6-30
6.7 References................................................................................................................... 6-32
Tables Table 6.1 Estimated Unit Rate Construction Cost of Infiltration Trench ................... 6-29
Figures
Figure 6.1: Hydrological event processes ......................................................................... 6-7
Figure 6.2 Typical Rain Garden Drainage Arrangement................................................. 6-9
Figure 6.3 Typical Rain Garden Section .......................................................................... 6-10
Figure 6.4 Typical Green Roof Construction .................................................................. 6-12
Figure 6.5 Extensive Roof Example ................................................................................. 6-13
Figure 6.6 Semi-intensive Green Roof Example ............................................................. 6-14
Figure 6.7 Elevated Landscape Example, Awaji Resort, Japan..................................... 6-14
Figure 6.8 Intensive Green Roof, Hocking Place, Adelaide .......................................... 6-15
Figure 6.9 Cumulative Runoff Graph.............................................................................. 6-17
Figure 6.10 Constructed Wetland, John Deere Works, Germany................................... 6-18
Figure 6.11 Typical Native Plant Species for Adelaide, Hocking Place, Adelaide ....... 6-21
Figure 6.12 Simple Soakaway with Overflow Example .................................................. 6-23
Figure 6.13 Typical Infiltration Strategy ........................................................................... 6-25
Appendices Appendix A Annual Rainfall in the Greater Adelaide Region
Appendix B Hydrological Effectiveness Curves for the Greater Adelaide Region
Appendix C Example of Utilising the Hydrological Effectiveness Curves to Design a Rain Garden
Appendix D Checklists
Contents and Glossary
viii Water Sensitive Urban Design – Greater Adelaide Region Technical Manual – December 2010
Chapter 7 Pervious Pavements 7.1 Overview ......................................................................................................................7-1
7.2 Legislative Requirements and Approvals .................................................................7-5
7.3 Design Considerations ................................................................................................7-7
7.4 Design Process............................................................................................................ 7-11
7.5 Design Tools ............................................................................................................... 7-24
7.6 Approximate Costs .................................................................................................... 7-26
7.7 Case Studies................................................................................................................ 7-27
7.8 Useful Resources and Further Information............................................................. 7-30
7.9 References ................................................................................................................... 7-32
Tables Table 7.1 Pervious Pavements Performance Efficiencies ...............................................7-4
Table 7.2 Potential Applications for Pervious Pavements ........................................... 7-15
Table 7.3 Estimated Construction Cost of Permeable Block Pavement...................... 7-26
Figures Figure 7.1 Example Cross Section Through a Pervious Pavement .................................7-2
Figure 7.2 (a) Infiltration, (b) Detention and (c) Combined Infiltration and Detention Pervious Pavement Systems ......................................................... 7-13
Figure 7.3 Construction of the Linden Gardens Car Park ............................................. 7-22
Figure 7.4 Kirkcaldy Avenue Pervious Pavements ........................................................ 7-27
Figure 7.5 Construction of the Pervious Pavements, Linden Gardens ........................ 7-28
Figure 7.6 Location Plan of the Pervious Pavements, Linden Gardens ....................... 7-29
Appendices Appendix A Design of Pervious Pavements Using the Design Storm Approach
Appendix B Checklists
Appendix C Hydrological Effectiveness Type Curves
Appendix D Hydrological Effectiveness Type Curves Illustrative Example
Contents and Glossary
ix Water Sensitive Urban Design – Greater Adelaide Region Technical Manual – December 2010
Chapter 8 Urban Water Harvesting and Reuse 8.1 Overview ...................................................................................................................... 8-1
8.2 Legislative Requirements and Approvals ................................................................. 8-7
8.3 Design Tools............................................................................................................... 8-12
8.4 Design Process ........................................................................................................... 8-13
8.5 Approximate Costings .............................................................................................. 8-19
8.6 Case Studies ............................................................................................................... 8-20
8.7 Useful Resources and Further Information............................................................. 8-26
8.8 References................................................................................................................... 8-28
Tables Table 8.1 Potential Advantages and Disadvantages of Various Storage Types .......... 8-6
Figures Figure 8.1 Warning Sign of Recycled Water Use at Mawson Lakes Residential
Development...................................................................................................... 8-4
Figure 8.2 Schematic of Recycled Water Use at Mawson Lakes Residential Development...................................................................................................... 8-4
Figure 8.3 Unit Production Costs of Harvested Stormwater ........................................ 8-19
Figure 8.4 Grange Golf Club Stormwater Harvesting and Reuse Scheme - During Construction (June 2006) ................................................................................ 8-20
Figure 8.5 Grange Golf Club Stormwater Harvesting and Reuse Scheme - Trimmer Parade Diversion and Frederick Road Pit (August 2006) ........................... 8-22
Figure 8.6 Grange Golf Club Stormwater Harvesting and Reuse Scheme – First Fill (September 2006) ............................................................................................. 8-22
Figure 8.7 Grange Golf Club Stormwater Harvesting and Reuse Scheme – Completed Wetland (January 2007) .............................................................. 8-23
Contents and Glossary
x Water Sensitive Urban Design – Greater Adelaide Region Technical Manual – December 2010
Chapter 9 Gross Pollutant Traps 9.1 Overview ......................................................................................................................9-1
9.2 Legislative Requirements and Approvals .................................................................9-4
9.3 Design Tools .................................................................................................................9-6
9.4 Design Considerations ................................................................................................9-7
9.5 Design Process............................................................................................................ 9-11
9.6 Approximate Costs and Manufacturer Information .............................................. 9-32
9.7 Case Study .................................................................................................................. 9-35
9.8 Useful Resources and Further Information............................................................. 9-38
9.9 References ................................................................................................................... 9-40
Tables Table 9.1 Estimate of Performance Efficiencies for GPTs ..............................................9-3
Table 9.2 Approximate Litter and Gross Pollutant Loading Rates for Melbourne ... 9-29
Table 9.3 Range of Proprietary Products Available...................................................... 9-34
Table 9.4 City of Holdfast Bay GPT Locations and Average Amount of Pollutants Removed Every Year ....................................................................................... 9-37
Figures
Figure 9.1 Gross Pollutants at the Torrens Weir – December 2007................................9-8
Figure 9.2 Inside a GPT ..................................................................................................... 9-11
Figure 9.3 Image of Various Types of Gross Pollutants................................................. 9-13
Figure 9.4 Composition of (a) Urban Gross Pollutants and (b) Urban Litter .............. 9-14
Figure 9.5 Litter Collection Baskets at Sunshine, Victoria............................................. 9-18
Figure 9.6 Litter Collection Basket in Collingwood, Victoria........................................ 9-19
Figure 9.7 Channel Nets at West Torrens, Adelaide, SA ............................................... 9-19
Figure 9.8 Trash Rack Installed at Broadmeadows, Victoria......................................... 9-20
Figure 9.9 Vane Style Diversion Weir, Sebastopol, Victoria.......................................... 9-20
Figure 9.10 Clean Out of GPT Baskets Across Third Creek, Adelaide........................... 9-22
Figure 9.11 Floating Boom Operating at Netley, West Adelaide.................................... 9-23
Figure 9.12 Sediment Settling Basin in Perth, WA ........................................................... 9-25
Figure 9.13 A Hydrodynamic Separation Device Cross Section..................................... 9-26
Figure 9.14 Typical Trap Efficiencies vs Design Standard of Stormwater Hydraulic Structures for Time of Concentration Equal to 1 Hour................................ 9-28
Figure 9.15 Augusta Street, Glenelg - GPT Installation ................................................... 9-35
Figure 9.16 GPT Maintenance – Pier Street, Glenelg........................................................ 9-36

Contents and Glossary
xi Water Sensitive Urban Design – Greater Adelaide Region Technical Manual – December 2010
Appendices Appendix A Checklists

Contents and Glossary
xii Water Sensitive Urban Design – Greater Adelaide Region Technical Manual – December 2010
Chapter 10 Bioretention Systems for Streetscapes 10.1 Overview .................................................................................................................... 10-1
10.2 Legislative Requirements and Approvals ............................................................... 10-6
10.3 Design Considerations .............................................................................................. 10-9
10.4 Design Process.......................................................................................................... 10-17
10.5 Design Tools ............................................................................................................. 10-27
10.6 Construction Process ............................................................................................... 10-28
10.7 Approximate Costs .................................................................................................. 10-29
10.8 Useful Resources and Further Information........................................................... 10-30
10.9 References ................................................................................................................. 10-31
Tables Table 10.1 Bioretention System Performance Efficiencies ............................................. 10-5
Table 10.2 Estimated Costs for a Biofiltration Trench .................................................. 10-29
Figures Figure 10.1 Cross Section through a Bioretention Swale ................................................. 10-2
Figure 10.2 Bioretention Swale at Mawson Lakes Campus, University of South Australia ........................................................................................................... 10-2
Figure 10.3 Bioretention Basin (incorporating Underground Storage Layer) ............... 10-3
Figure 10.4 Bioretention Swale as a Median Strip............................................................ 10-5
Figure 10.5 Bioretention Swale at Mawson Lakes Campus at the University of South Australia ........................................................................................................... 10-8
Figure 10.6 Bioretention Swale Integrated into the Design of an Urban Park............. 10-11
Figure 10.7 Bioretention Basin at Palmer Street, Aldinga Beach .................................. 10-12
Figure 10.8 Bioretention Bed, Star of Greece Car Park .................................................. 10-18
Figure 10.9 Kerb Inlet Design for a Bioretention Swale................................................. 10-21
Figure 10.10 Kerb Inlet Design for Bioretention Basin..................................................... 10-22
Figure 10.11 Alternative Pit Inlet Design for Depressed Bioretention Basin at Quinliven Road, Aldinga .............................................................................. 10-23
Figure 10.12 Preliminary Stages of Construction of a Bioretention Swale at Mawson Lakes Campus at the University of South Australia.................................. 10-28
Appendices Appendix A Bioretention System Design Process
Appendix B Checklists
Contents and Glossary
xiii Water Sensitive Urban Design – Greater Adelaide Region Technical Manual – December 2010
Chapter 11 Swales and Buffer Strips 11.1 Overview .................................................................................................................... 11-1
11.2 Legislative Requirements and Approvals ............................................................... 11-7
11.3 Design Considerations .............................................................................................. 11-9
11.4 Design Process ......................................................................................................... 11-15
11.5 Design Tools............................................................................................................. 11-19
11.6 Construction Process ............................................................................................... 11-20
11.7 Maintenance Requirements .................................................................................... 11-23
11.8 Education and Awareness ...................................................................................... 11-25
11.9 Approximate Costs .................................................................................................. 11-26
11.10 Useful Resources and Further Information........................................................... 11-28
11.11 References................................................................................................................. 11-30
Tables Table 11.1 Estimated Removal Efficiency for Swales..................................................... 11-6
Table 11.2 Estimated Unit Rate Construction Cost for Swales.................................... 11-26
Table 11.3 Estimated Swale Maintenance Costs ........................................................... 11-27
Figures Figure 11.1 Palmer Street Swale Retrofit, Aldinga Beach................................................ 11-4
Figure 11.2 Grass Swale in Rymill Park .......................................................................... 11-10
Appendices Appendix A Checklists
Appendix B Design Procedure and Example for Determining Swale Capacity

Contents and Glossary
xiv Water Sensitive Urban Design – Greater Adelaide Region Technical Manual – December 2010
Chapter 12 Sedimentation Basins 12.1 Overview .................................................................................................................... 12-1
12.2 Legislative Requirements and Approvals ............................................................... 12-6
12.3 Design Considerations and Process ......................................................................... 12-8
12.4 Design Tools ............................................................................................................. 12-15
12.5 Construction Process ............................................................................................... 12-16
12.6 Maintenance Requirements .................................................................................... 12-18
12.7 Useful Resources and Further Information........................................................... 12-20
12.8 References ................................................................................................................. 12-22
Figures Figure 12.1 Elements of a Sedimentation Basin ................................................................ 12-2
Figure 12.2 Cross Section of a Sedimentation Basin......................................................... 12-3
Figure 12.3 Sedimentation Basin Area vs Design Discharges for Varying Capture Efficiencies of 125 m Sediment Size............................................................. 12-5
Figure 12.4 Brookes Bridge Sedimentation Basin........................................................... 12-11
Appendices Appendix A Checklists
Contents and Glossary
xv Water Sensitive Urban Design – Greater Adelaide Region Technical Manual – December 2010
Chapter 13 Constructed Wetlands 13.1 Overview .................................................................................................................... 13-1
13.2 Legislative Requirements and Approvals ............................................................... 13-5
13.3 Design Considerations .............................................................................................. 13-7
13.4 Landscaping Considerations .................................................................................. 13-14
13.5 Design Process ......................................................................................................... 13-18
13.6 Design Tools............................................................................................................. 13-22
13.7 Construction Process ............................................................................................... 13-24
13.8 Monitoring and Maintenance ................................................................................. 13-27
13.9 Approximate Costing .............................................................................................. 13-32
13.10 Case Studies ............................................................................................................. 13-33
13.11 Useful Resources and Further Information........................................................... 13-38
13.12 References................................................................................................................. 13-40
Tables Table 13.1 Typical Annual Pollutant Load Removal Efficiencies for Constructed
Wetlands........................................................................................................... 13-4
Figures Figure 13.1 Long Section Schematic of a Typical Representation of a Constructed
Wetland ............................................................................................................ 13-2
Figure 13.2 Brookes Bridge Wetland, Upper Cox Creek, Adelaide Hills ...................... 13-4
Figure 13.3 Illustration of Typical Constructed Wetland Layout................................... 13-8
Figure 13.4 Vegetation in the Grange Golf Course Wetland......................................... 13-10
Figure 13.5 Boardwalk at Laratinga Wetland, Mt Barker.............................................. 13-16
Figure 13.6 Greenfields Wetlands, City of Salisbury ..................................................... 13-23
Figure 13.7 Breakout Creek Wetland............................................................................... 13-33
Figure 13.8 Warriparinga Wetland with Inlet and Trash Rack in Background .......... 13-34
Figure 13.9 Urrbrae Wetland............................................................................................ 13-36
Appendices Appendix A Checklists

Contents and Glossary
xvi Water Sensitive Urban Design – Greater Adelaide Region Technical Manual – December 2010
Chapter 14 Wastewater Management 14.1 Overview .................................................................................................................... 14-1
14.2 Legislative Requirements and Approvals ............................................................... 14-8
14.3 Design Considerations ............................................................................................ 14-13
14.4 Design Process.......................................................................................................... 14-18
14.5 Design Tools ............................................................................................................. 14-25
14.6 Maintenance Requirements .................................................................................... 14-26
14.7 Approximate Costing .............................................................................................. 14-28
14.8 Case Studies.............................................................................................................. 14-29
14.9 Useful Resources and Further Information........................................................... 14-31
14.10 References ................................................................................................................. 14-35
Tables Table 14.1 Comparison of Greywater Quality and Wastewater ................................... 14-2
Figures Figure 14.1 Gumeracha Wastewater Treatment Plant ..................................................... 14-3
Figure 14.2 Treated Wastewater from the Hahndorf WWTP Utilised at The Cedars 14-15
Figure 14.3 Laratinga Wetland ......................................................................................... 14-30
Appendices Appendix A Greywater Treatment Systems Recommended Maintenance Activities

Contents and Glossary
xvii Water Sensitive Urban Design – Greater Adelaide Region Technical Manual – December 2010
Chapter 15 Modelling Process and Tools 15.1 Overview .................................................................................................................... 15-1
15.2 Modelling Philosophy ............................................................................................... 15-3
15.3 Data Sources............................................................................................................... 15-6
15.4 Modelling Tools ....................................................................................................... 15-10
15.5 Case Studies ............................................................................................................. 15-21
15.6 Useful Resources and Further Information........................................................... 15-28
15.7 References................................................................................................................. 15-30
Tables Table 15.1 Summary of Model Applications (at July 2009) ......................................... 15-11
Figures Figure 15.1 Opening SWITCH Screen ............................................................................. 15-18
Figure 15.2 MUSIC Model Subcatchments Representation .......................................... 15-21
Figure 15.3 Mawson Lakes WaterCress Node Layout................................................... 15-24
Figure 15.4 Conceptual Layout of the Parafield Drain Scheme.................................... 15-26
Appendices Appendix A Baseline Water Quality Data

Contents and Glossary
xviii Water Sensitive Urban Design – Greater Adelaide Region Technical Manual – December 2010
Chapter 16 Siphonic Roofwater Systems 16.1 Overview .................................................................................................................... 16-9
16.2 Legislative Requirements and Approvals ............................................................. 16-17
16.3 Design Considerations ............................................................................................ 16-18
16.4 Design Process.......................................................................................................... 16-21
16.5 Design Tools ............................................................................................................. 16-32
16.6 Construction Process ............................................................................................... 16-35
16.7 Inspection and Maintenance Requirements .......................................................... 16-36
16.8 Approximate Costs and Manufacturer Information ............................................ 16-37
16.9 Case Study ................................................................................................................ 16-39
16.10 Useful Resources and Further Information........................................................... 16-41
16.11 References ................................................................................................................. 16-42
Figures Figure 16.1 Adelaide Airport – One of South Australia’s Siphonically Drained
Buildings......................................................................................................... 16-10
Figure 16.2 Siphonic Buildings (Clockwise from Top): Federation Square in Melbourne; Stadium Australia; the Melbourne Cricket Ground; and North Stand at AAMI Stadium, Adelaide................................................... 16-12
Figure 16.3: Conventional Roof Drainage System........................................................... 16-13
Figure 16.4 Siphonic Roof Drainage System ................................................................... 16-13
Figure 16.5: Siphonic Drainage System Components ..................................................... 16-14
Figure 16.6: Horizontal Collector Pipe at AAMI Stadium in Adelaide......................... 16-15
Figure 16.7 Rainwater Tank at the Bianco Warehouse at Gepps Cross ....................... 16-16
Figure 16.8: Example Output from AUS-IFD Version 2.0 .............................................. 16-22
Figure 16.9: Syfon Systems Siphonic Outlet (Rated at 15 L/s), Fitted with Plastic Leafguard ....................................................................................................... 16-23
Figure 16.10: Spacing of Outlets for Sample Design ......................................................... 16-23
Figure 16.11: Ideal Flow Volumes in an Example System................................................ 16-24
Figure 16.12: Schematic of Siphonic Pipe Layout at Adelaide Airport ........................... 16-25
Figure 16.13: Design Head................................................................................................... 16-26
Figure 16.14: Balanced System Using Different Tailpipe Sizes........................................ 16-28
Figure 16.15: In-building Rainwater Tank Installed at the Sydney Cricket Ground ..... 16-29
Figure 16.16: In-building Tank Fitted into the Space below a Mezzanine Walkway .... 16-30

Contents and Glossary
xix Water Sensitive Urban Design – Greater Adelaide Region Technical Manual – December 2010
Figure 16.17: Schematic Diagram Showing Components of an ecoRain Underground Rainwater Tank.............................................................................................. 16-30
Figure 16.18: Installation of ecoRain Underground Rainwater Tanks............................ 16-31
Appendices Appendix A Baseline Water Quality Data

Contents and Glossary
xxi Water Sensitive Urban Design – Greater Adelaide Region Technical Manual – December 2010
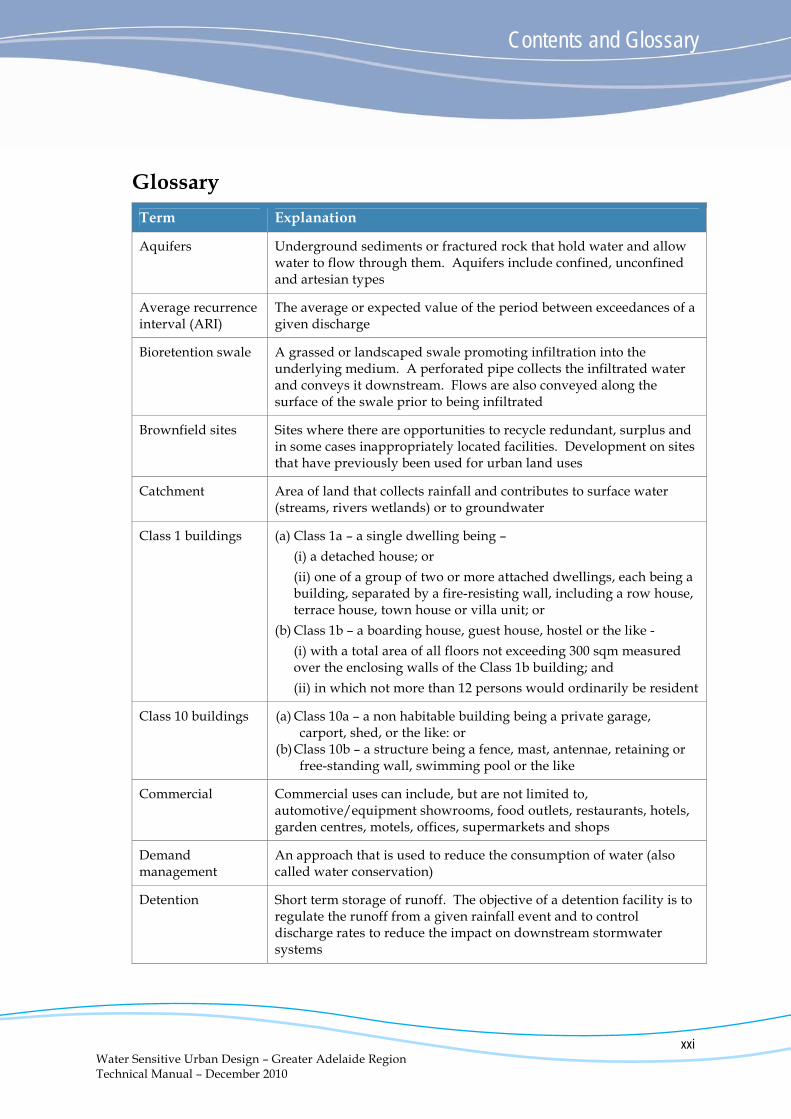
Glossary
Term Explanation
Aquifers Underground sediments or fractured rock that hold water and allow water to flow through them. Aquifers include confined, unconfined and artesian types
Average recurrence interval (ARI)
The average or expected value of the period between exceedances of a given discharge
Bioretention swale A grassed or landscaped swale promoting infiltration into the underlying medium. A perforated pipe collects the infiltrated water and conveys it downstream. Flows are also conveyed along the surface of the swale prior to being infiltrated
Brownfield sites Sites where there are opportunities to recycle redundant, surplus and in some cases inappropriately located facilities. Development on sites that have previously been used for urban land uses
Catchment Area of land that collects rainfall and contributes to surface water (streams, rivers wetlands) or to groundwater
Class 1 buildings (a) Class 1a – a single dwelling being –
(i) a detached house; or
(ii) one of a group of two or more attached dwellings, each being a building, separated by a fire-resisting wall, including a row house, terrace house, town house or villa unit; or
(b) Class 1b – a boarding house, guest house, hostel or the like -
(i) with a total area of all floors not exceeding 300 sqm measured over the enclosing walls of the Class 1b building; and
(ii) in which not more than 12 persons would ordinarily be resident
Class 10 buildings (a) Class 10a – a non habitable building being a private garage, carport, shed, or the like: or
(b) Class 10b – a structure being a fence, mast, antennae, retaining or free-standing wall, swimming pool or the like
Commercial Commercial uses can include, but are not limited to, automotive/equipment showrooms, food outlets, restaurants, hotels, garden centres, motels, offices, supermarkets and shops
Demand management
An approach that is used to reduce the consumption of water (also called water conservation)
Detention Short term storage of runoff. The objective of a detention facility is to regulate the runoff from a given rainfall event and to control discharge rates to reduce the impact on downstream stormwater systems
Contents and Glossary
xxii Water Sensitive Urban Design – Greater Adelaide Region Technical Manual – December 2010
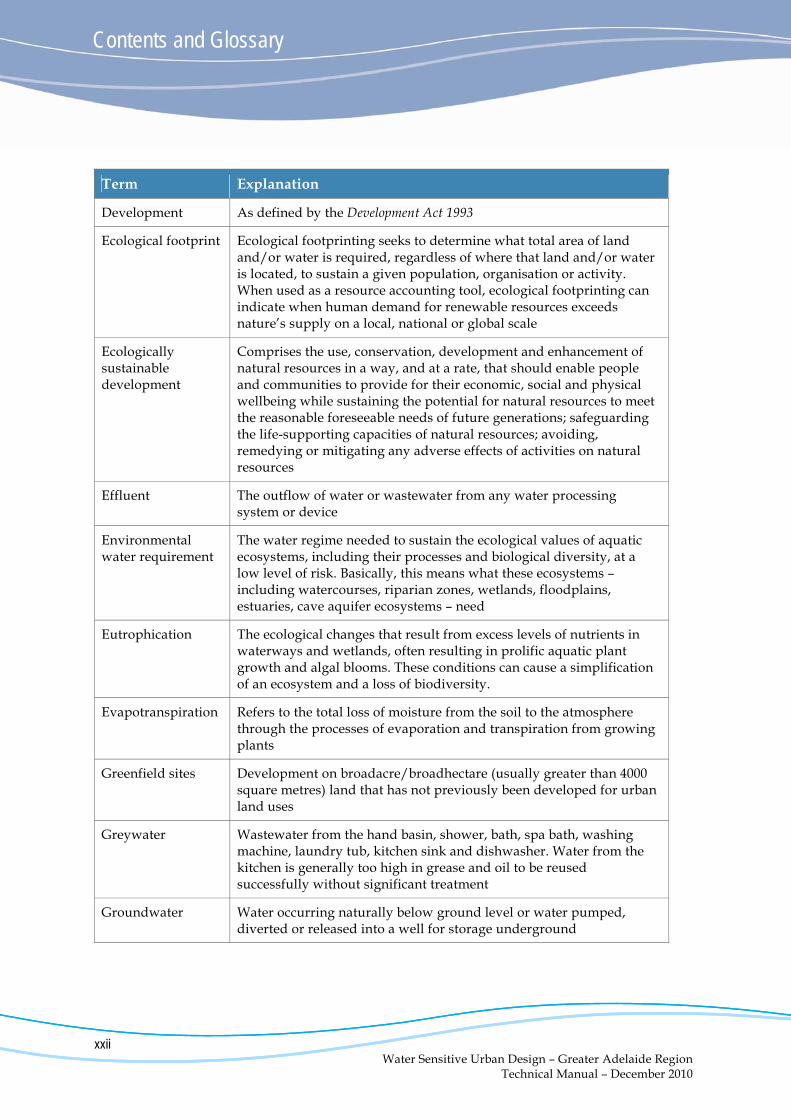
Term Explanation
Development As defined by the Development Act 1993
Ecological footprint Ecological footprinting seeks to determine what total area of land and/or water is required, regardless of where that land and/or water is located, to sustain a given population, organisation or activity. When used as a resource accounting tool, ecological footprinting can indicate when human demand for renewable resources exceeds nature’s supply on a local, national or global scale
Ecologically sustainable development
Comprises the use, conservation, development and enhancement of natural resources in a way, and at a rate, that should enable people and communities to provide for their economic, social and physical wellbeing while sustaining the potential for natural resources to meet the reasonable foreseeable needs of future generations; safeguarding the life-supporting capacities of natural resources; avoiding, remedying or mitigating any adverse effects of activities on natural resources
Effluent The outflow of water or wastewater from any water processing system or device
Environmental water requirement
The water regime needed to sustain the ecological values of aquatic ecosystems, including their processes and biological diversity, at a low level of risk. Basically, this means what these ecosystems – including watercourses, riparian zones, wetlands, floodplains, estuaries, cave aquifer ecosystems – need
Eutrophication The ecological changes that result from excess levels of nutrients in waterways and wetlands, often resulting in prolific aquatic plant growth and algal blooms. These conditions can cause a simplification of an ecosystem and a loss of biodiversity.
Evapotranspiration Refers to the total loss of moisture from the soil to the atmosphere through the processes of evaporation and transpiration from growing plants
Greenfield sites Development on broadacre/broadhectare (usually greater than 4000 square metres) land that has not previously been developed for urban land uses
Greywater Wastewater from the hand basin, shower, bath, spa bath, washing machine, laundry tub, kitchen sink and dishwasher. Water from the kitchen is generally too high in grease and oil to be reused successfully without significant treatment
Groundwater Water occurring naturally below ground level or water pumped, diverted or released into a well for storage underground
Contents and Glossary
xxiii Water Sensitive Urban Design – Greater Adelaide Region Technical Manual – December 2010
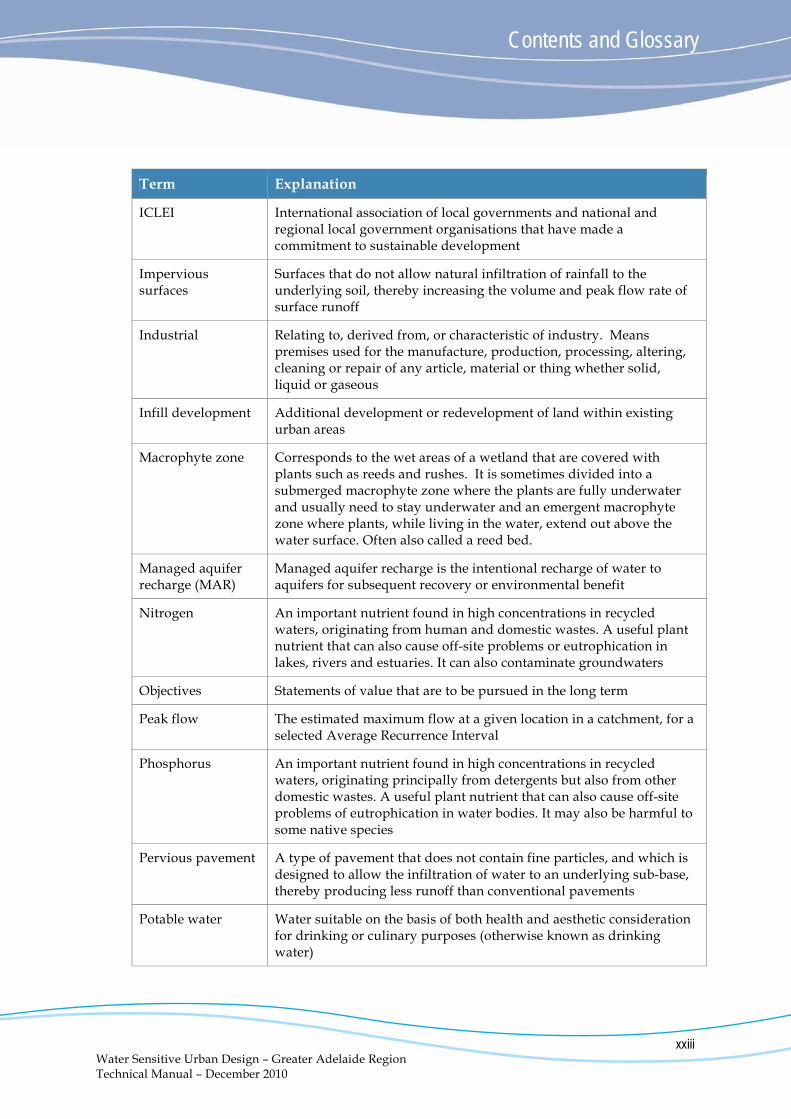
Term Explanation
ICLEI International association of local governments and national and regional local government organisations that have made a commitment to sustainable development
Impervious surfaces
Surfaces that do not allow natural infiltration of rainfall to the underlying soil, thereby increasing the volume and peak flow rate of surface runoff
Industrial Relating to, derived from, or characteristic of industry. Means premises used for the manufacture, production, processing, altering, cleaning or repair of any article, material or thing whether solid, liquid or gaseous
Infill development Additional development or redevelopment of land within existing urban areas
Macrophyte zone Corresponds to the wet areas of a wetland that are covered with plants such as reeds and rushes. It is sometimes divided into a submerged macrophyte zone where the plants are fully underwater and usually need to stay underwater and an emergent macrophyte zone where plants, while living in the water, extend out above the water surface. Often also called a reed bed.
Managed aquifer recharge (MAR)
Managed aquifer recharge is the intentional recharge of water to aquifers for subsequent recovery or environmental benefit
Nitrogen An important nutrient found in high concentrations in recycled waters, originating from human and domestic wastes. A useful plant nutrient that can also cause off-site problems or eutrophication in lakes, rivers and estuaries. It can also contaminate groundwaters
Objectives Statements of value that are to be pursued in the long term
Peak flow The estimated maximum flow at a given location in a catchment, for a selected Average Recurrence Interval
Phosphorus An important nutrient found in high concentrations in recycled waters, originating principally from detergents but also from other domestic wastes. A useful plant nutrient that can also cause off-site problems of eutrophication in water bodies. It may also be harmful to some native species
Pervious pavement A type of pavement that does not contain fine particles, and which is designed to allow the infiltration of water to an underlying sub-base, thereby producing less runoff than conventional pavements
Potable water Water suitable on the basis of both health and aesthetic consideration for drinking or culinary purposes (otherwise known as drinking water)

Contents and Glossary
xxiv Water Sensitive Urban Design – Greater Adelaide Region Technical Manual – December 2010
Term Explanation
Pre-development Pre-development refers to the situation where there is no development on the site which is considered to constitute the following scenarios:
1. If the site is currently developed, then the no development case is where runoff from the site assumes a cleared but grassed state
2. If the site is currently vegetated, then the no development case is where runoff from the site assumes the uncleared vegetated state
Prescription Establishes a system for water resource planning and the sustainable allocation and management of water
Principles Rules of conduct that are applied when implementing management actions or making decisions. They provide guidance on how decisions should be made
Retention Permanent storing of runoff indefinitely. Water is stored until it is lost through percolation, taken in by plants, through evaporation or reuse
Runoff Occurs as a result of rainfall and includes roof runoff (i.e. rainwater) and stormwater
Sediment Small-grained material (such as sand, silt and clay) that is carried by water and is deposited on the surface of the land. Sediment is capable of choking and destroying natural aquatic ecosystems
Stormwater Runoff from an area as a result of rainfall which is discharged to drainage infrastructure
Swale Vegetated open channels that capture and treat stormwater runoff by means of filtering and conveyance during regular rainfall events with an average recurrence interval in the range of 3 to 6 months
Target Detailed statements of outcomes against which the success of a plan or strategy can be measured and evaluated. They comprise a quantitative value of some condition or parameter that should be achieved
Treatment train A series of treatment measures that collectively address all stormwater pollutants. A treatment train employs a range of processes to achieve pollutant reduction targets
Wastewater Water that has been used for domestic or industrial purposes and is then discharged as waste. The water may be contaminated with solids, chemicals or changes in temperature
Contents and Glossary
xxv Water Sensitive Urban Design – Greater Adelaide Region Technical Manual – December 2010
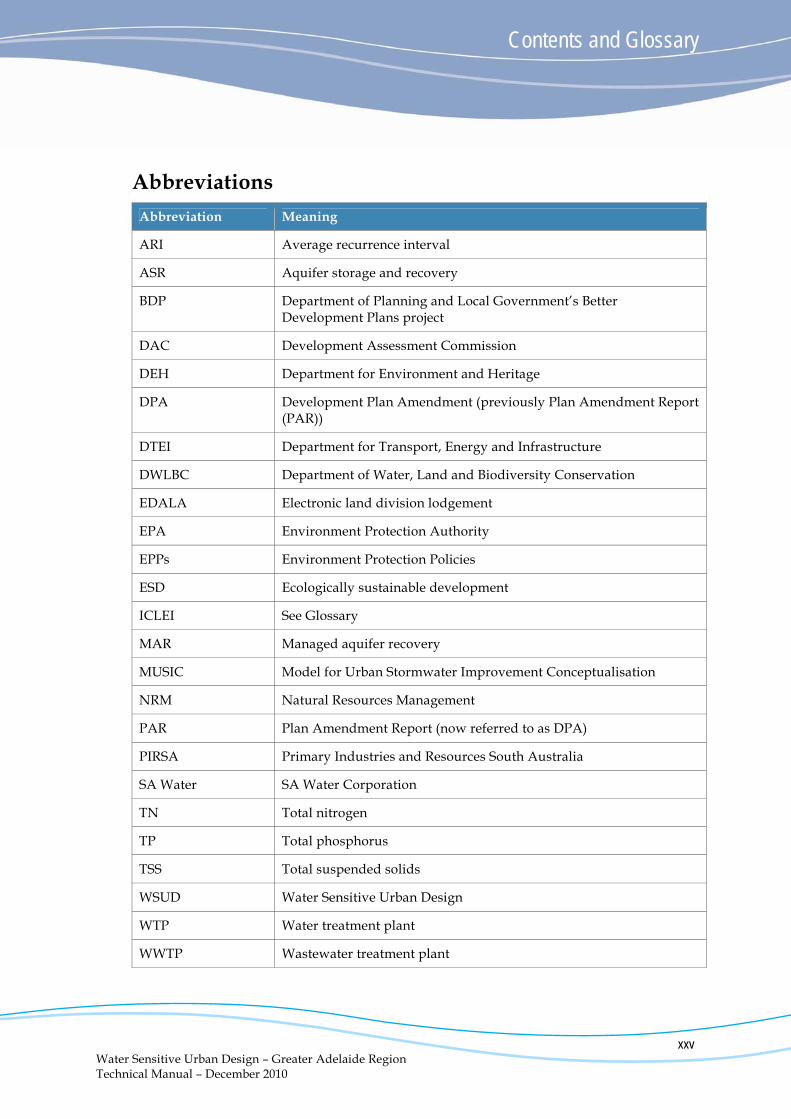
Abbreviations
Abbreviation Meaning
ARI Average recurrence interval
ASR Aquifer storage and recovery
BDP Department of Planning and Local Government’s Better Development Plans project
DAC Development Assessment Commission
DEH Department for Environment and Heritage
DPA Development Plan Amendment (previously Plan Amendment Report (PAR))
DTEI Department for Transport, Energy and Infrastructure
DWLBC Department of Water, Land and Biodiversity Conservation
EDALA Electronic land division lodgement
EPA Environment Protection Authority
EPPs Environment Protection Policies
ESD Ecologically sustainable development
ICLEI See Glossary
MAR Managed aquifer recovery
MUSIC Model for Urban Stormwater Improvement Conceptualisation
NRM Natural Resources Management
PAR Plan Amendment Report (now referred to as DPA)
PIRSA Primary Industries and Resources South Australia
SA Water SA Water Corporation
TN Total nitrogen
TP Total phosphorus
TSS Total suspended solids
WSUD Water Sensitive Urban Design
WTP Water treatment plant
WWTP Wastewater treatment plant