0 3 5 - connecting repositories · courrier électronique : [email protected] ... texts...
TRANSCRIPT

MPRAMunich Personal RePEc Archive
The Connection between Literacy andWork: Implications for Social AssistanceRecipients
Kapsalis, Constantine
Data Probe Economic Consulting
January 1998
Online at http://mpra.ub.uni-muenchen.de/25737/
MPRA Paper No. 25737, posted 08. October 2010 / 20:16
Applied Research BranchStrategic Policy
Human Resources Development Canada
Direction générale de la recherche appliquéePolitique stratégique
Développement des ressources humaines Canada
The views expressed in Working Papers are those of the authors and do not necessarily reflect theopinions of Human Resources Development Canada or of the federal government.
Les opinions exprimées dans les documents de travail sont celles des auteurs et ne reflètent pasnécessairement le point de vue de Développement des ressources humaines Canada ou du gouvernementfédéral.
�
The Working Paper Series includes analytical studies and research conducted under the auspices of theApplied Research Branch of Strategic Policy. Papers published in this series incorporate primary researchwith an empirical or original conceptual orientation, generally forming part of a broader or longer-termprogram of research in progress. Readers of the series are encouraged to contact the authors withcomments and suggestions.
La série des documents de travail comprend des études analytiques et des travaux de recherche réaliséssous l égide de la Direction générale de la recherche appliquée, Politique stratégique. Il s agit notammentde recherches primaires, soit empiriques ou originales et parfois conceptuelles, généralement menéesdans le cadre d’un programme de recherche plus vaste ou de plus longue durée. Les lecteurs de cette sériesont encouragés à faire part de leurs observations et de leurs suggestions aux auteurs.
The Connection Between Literacy and Work:Implications for Social Assistance Recipients
W-98-1Eby
Constantine KapsalisJanuar y 1998

First Internet Edition, 1998Revision/Révision 1998
�
This paper is available in French under the title “Le lien entre l’alphabétisme, le travail et les bénéficiaires d’aidesociale”./La version française de ce document est disponible sous le titre «Le lien entre l’alphabétisme, le travail et lesbénéficiaires d’aide sociale».
�
General enquiries regarding the documentspublished by the Applied ResearchBranch should be addressed to:
Publications CoodinatorApplied Research BranchStrategic PolicyHuman Resources Development Canada140 Promenade du Portage IV, 4th FloorHull , Quebec, CanadaK1A 0J9
Telephone: (819) 994-3304Facsimile: (819) 953-8584E-mail: [email protected]://www.hrdc-drhc.gc.ca/hrdc/corp/stratpol/
Si vous avez des questions concernant lesdocuments publiés par la Direction générale de larecherche appliquée, veuil lez communiquer avec :
Coordonnatrice des publicationsDirection générale de la recherche appliquéePolitique stratégiqueDéveloppement des ressources humaines Canada140, Promenade du Portage IV, 4e étageHull (Québec) CanadaK1A 0J9
Téléphone : (819) 994-3304Télécopieur : (819) 953-8584Courrier électronique : [email protected]://www.hrdc-drhc.gc.ca/hrdc/corp/polstrat/
W-98-1E The Conne ction B etween L iteracy and Wo rk:Impl ications for Social Assistance Recipients
Applied Research Branch/Direction générale de la recherche appliquée 3
Table of Conten ts
1. Int roduct ion .......................................................................................................................4
2. L iterature Review ..............................................................................................................7
3. Methodology.......................................................................................................................9
4. Literacy and Employabilit y ..............................................................................................11
5. Profile of Social Assistance Recipients (SARs) ................................................................12
6. Corr elation Between SAR Status and Literacy ..............................................................15
7. Literacy-equivalence Education Factor ..........................................................................18
8. The Effect of Work on Literacy.......................................................................................20
9. Does the Type of Work Matter ?......................................................................................23
10. Is Work at the Cost of Home Literacy Activities?..........................................................25
11. Conclusion.......................................................................................................................27
References................................................................................................................................28

The Connection Between Literacy and Work:W-98-1E Implications For Social Assistance Recipients
Applied Research Branch/Direction générale de la recherche appliquée4
1. Introduction
The completion of the first International Adult Literacy Survey (IALS), an international
cooperative initiative coordinated by Statistics Canada, has raised awareness about the
importance of literacy in the workplace. The connection between education and employability
has long been established. Better educated individuals tend to have a lower incidence of
unemployment, work more hours, earn more per hour and, as a consequence, rely less on
government support programs.
Early results from the newly released IALS microdata point to a number of interesting findings:
• Literacy appears to be a better predictor of employment outcomes than education. This raises
of course the issue of differences in the quality of education. But it also raises the possibility
of a positive reinforcement of literacy skills obtained at school through opportunities for
lifelong learning and the use of the literacy activities at work and in everyday life.
• A recent Statistics Canada study speaks of a "virtuous" cycle between education, life-long
learning, literacy and employment (Kapsalis, 1997), while another Statistics Canada report
uses the analogy of a "muscle" to describe literacy: "Literacy skills' like muscles, are
maintained and strengthened through regular use. While formal education provides a more or
less required base, the evidence indicates that applying literacy skills in daily activities --
both at home and at work -- is associated with higher levels of performance" (Statistics
Canada, 1996: p. 12).
The issue addressed by this report is the employability of social assistance recipients (SARs).
The term employability is used here in the broad sense of better chances of being employed and
higher earnings. It is measured by such indicators as the employment rate (percentage of
individuals with employment during the year), annual weeks of work, or average full-time/full-
year earnings.
A strong positive correlation between the level of education and employability has been well

The Connection Between Literacy and Work:W-98-1E Implications For Social Assistance Recipients
Applied Research Branch/Direction générale de la recherche appliquée5
established in the economic literature. However, there is evidence now suggesting that literacy
may be an even better predictor of employability. A likely reason is that literacy reflects not only
the level of education but, also, the quality of education and the extent to which the literacy
"muscle" is used at work and at home.
Education of course remains an important explanatory variable. The importance of education is
reinforced by the simple fact that information about the level of education is much more readily
available than information about literacy.
The IALS data provide a unique opportunity to probe the employability of SARs by going
beyond the concept of education and incorporating information on literacy. There are two
potential applications of the IALS data in that respect:
• One potent application is to establish a literacy-education equivalence scale for SARs. The
hypothesis to be tested is that keeping the level of education constant, and controlling for
differences in demographic characteristics, literacy levels will differ between the various sub-
populations (either because the quality of education differs or because the literacy "muscle"
is used to a different extent).
• An equally potent application is to explore the link between work, literacy requirements at
the workplace, and literacy activities at home, with the level of literacy. This is an important
issue. Analysis of the IALS data can provide an answer to the following types of questions:
Does employment improve literacy skills and future employability? Is this true regardless of
the literacy requirements of the job? How do employment and literacy requirements at the
workplace affect literacy activities at home? What is the net effect of re-employment
initiatives on literacy and long-term employability?
In what follows, Section 2 provides a selective review of the literature. Section 3 outlines the
methodology. Section 4 explores the correlation between education, literacy, and earnings.
Section 5 provides a profile of SARs based on the IALS data. Section 6 examines the
relationship between SAR status and literacy. Section 7 uses this relationship to convert the years

The Connection Between Literacy and Work:W-98-1E Implications For Social Assistance Recipients
Applied Research Branch/Direction générale de la recherche appliquée6
of schooling of non-working SARs to literacy-equivalent years of schooling of working non-
SARs. The following three sections examine how work correlates with literacy (Section 8), if the
type of work matters in terms of potential literacy gains (Section 9), and whether work is at the
cost of literacy activities at home or in the community (Section 10). The main conclusions are
summarized in Section 11.
The Connection Between Literacy and Work:W-98-1E Implications For Social Assistance Recipients
Applied Research Branch/Direction générale de la recherche appliquée 7
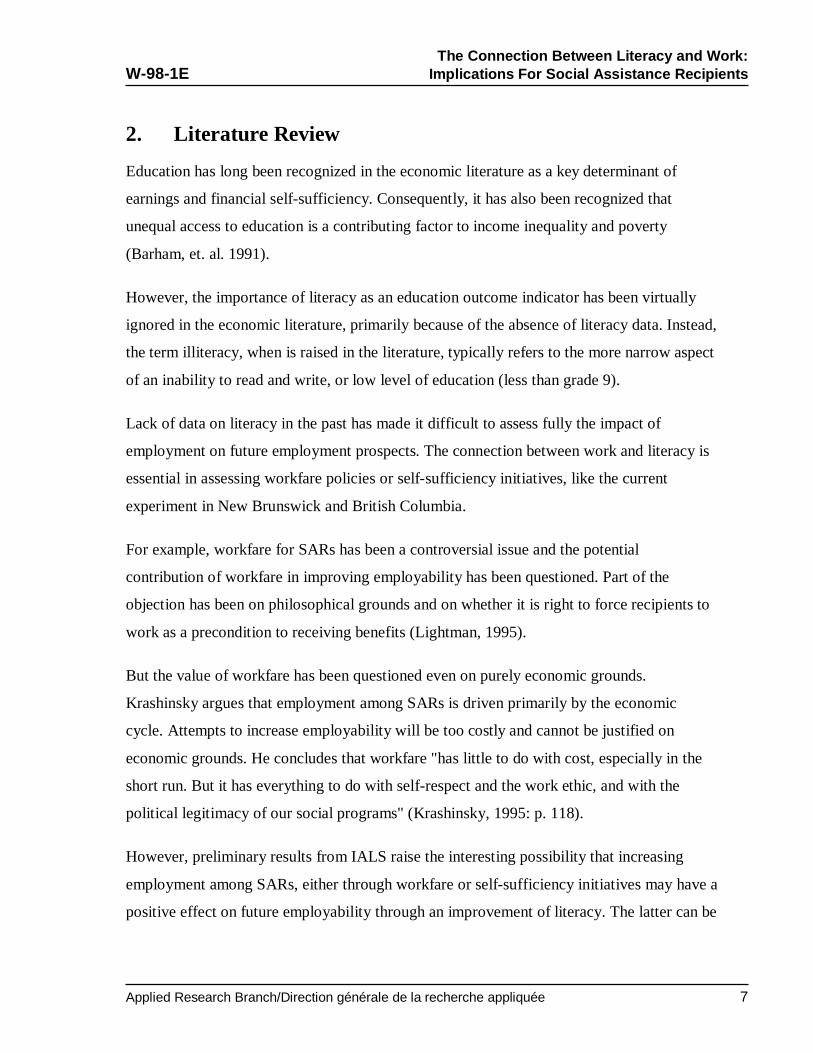
2. Literature Review
Education has long been recognized in the economic literature as a key determinant of
earnings and financial self-sufficiency. Consequently, it has also been recognized that
unequal access to education is a contributing factor to income inequality and poverty
(Barham, et. al. 1991).
However, the importance of literacy as an education outcome indicator has been virtually
ignored in the economic literature, primarily because of the absence of literacy data. Instead,
the term illiteracy, when is raised in the literature, typically refers to the more narrow aspect
of an inability to read and write, or low level of education (less than grade 9).
Lack of data on literacy in the past has made it difficult to assess fully the impact of
employment on future employment prospects. The connection between work and literacy is
essential in assessing workfare policies or self-sufficiency initiatives, like the current
experiment in New Brunswick and British Columbia.
For example, workfare for SARs has been a controversial issue and the potential
contribution of workfare in improving employability has been questioned. Part of the
objection has been on philosophical grounds and on whether it is right to force recipients to
work as a precondition to receiving benefits (Lightman, 1995).
But the value of workfare has been questioned even on purely economic grounds.
Krashinsky argues that employment among SARs is driven primarily by the economic
cycle. Attempts to increase employability will be too costly and cannot be justified on
economic grounds. He concludes that workfare "has little to do with cost, especially in the
short run. But it has everything to do with self-respect and the work ethic, and with the
political legitimacy of our social programs" (Krashinsky, 1995: p. 118).
However, preliminary results from IALS raise the interesting possibility that increasing
employment among SARs, either through workfare or self-sufficiency initiatives may have a
positive effect on future employability through an improvement of literacy. The latter can be

The Connection Between Literacy and Work:W-98-1E Implications For Social Assistance Recipients
Applied Research Branch/Direction générale de la recherche appliquée 8
achieved by breaking the vicious cycle where the unemployed and those in straitened
circumstances receive less training and education, and engage less in other practices that
favour the development of literacy abilities, which in turn further reduces their employment
prospects (Shalla and Schellenberg, forthcoming).

The Connection Between Literacy and Work:W-98-1E Implications For Social Assistance Recipients
Applied Research Branch/Direction générale de la recherche appliquée 9
3. Methodology
The results of this study are based on an analysis of the public use microdata from the 1994
International Adult Literacy Survey (IALS). The Canadian portion of IALS identifies
whether the individual received social assistance or employment insurance payments.1
To get a clearer picture of the relationship among these three factors, the sample is restricted
to ages 26 to 65, since many younger Canadians are still attending school.2
The IALS is the first international cooperative effort at measuring literacy, as well other
related information, such as education and training. The IALS identifies three types of
literacy: document, prose, and quantitative literacy (Table 1). For each type of literacy five
levels are defined: 1, 2, 3, and 4/5 (the two top literacy levels are collapsed into one for
statistical reasons).
Box 1
Definition of Literacy
Three types of literacy were tested by the IALS:
(a) prose literacy refers to the knowledge and skills needed to understand and use information fromtexts including editorials, news stories, poems and fiction;
(b) document literacy refers to the knowledge and skills required to locate and use informationcontained in various formats, including job applications, payroll forms, transportation schedules,maps, tables, and graphics; and
(c) quantitative literacy refers to the knowledge and skills required to apply arithmetic operations, eitheralone or sequentially, to numbers embedded in printed materials, such as balancing a checkbook,figuring out a tip, completing an order form, or determining the amount of interest on a loan from anadvertisement.
In each of the three literacy domains, a scale from 0 to 500 was constructed, upon which tasks of varyingdifficulty were placed. The range of scores corresponding to each level are as follows: level 1 (0-225);level 2 (226-275); level 3 (276-325); level 4 (326-375); and level 5 (376-500).
1 Information on social assistance and employment insurance is not available for the additional Franco-Ontarian sample. As a result, the latter was excluded from the analysis.
2 Estimates including younger Canadians generally produced similar results.

The Connection Between Literacy and Work:W-98-1E Implications For Social Assistance Recipients
Applied Research Branch/Direction générale de la recherche appliquée 10
Although all three types of literacy are important, they tend to be highly correlated (Table
1). In fact, the recently conducted Ontario Literacy Survey of the Hearing Impaired
concentrated exclusively on document literacy, on the grounds that the three types of
literacy are highly correlated. For the sake of simplifying the presentation of the results, we
have concentrated for the most part on document literacy.
Table 1
Correlation Between Different Types of Literacy
DocumentLiteracy score
ProseLiteracy score
QuantitativeLiteracy score
Documentliteracy score
100.0% 88.4% 89.1%
ProseLiteracy score
88.4% 100.0% 88.4%
QuantitativeLiteracy score
89.1% 88.4% 100.0%
The Connection Between Literacy and Work:W-98-1E Implications For Social Assistance Recipients
Applied Research Branch/Direction générale de la recherche appliquée 11
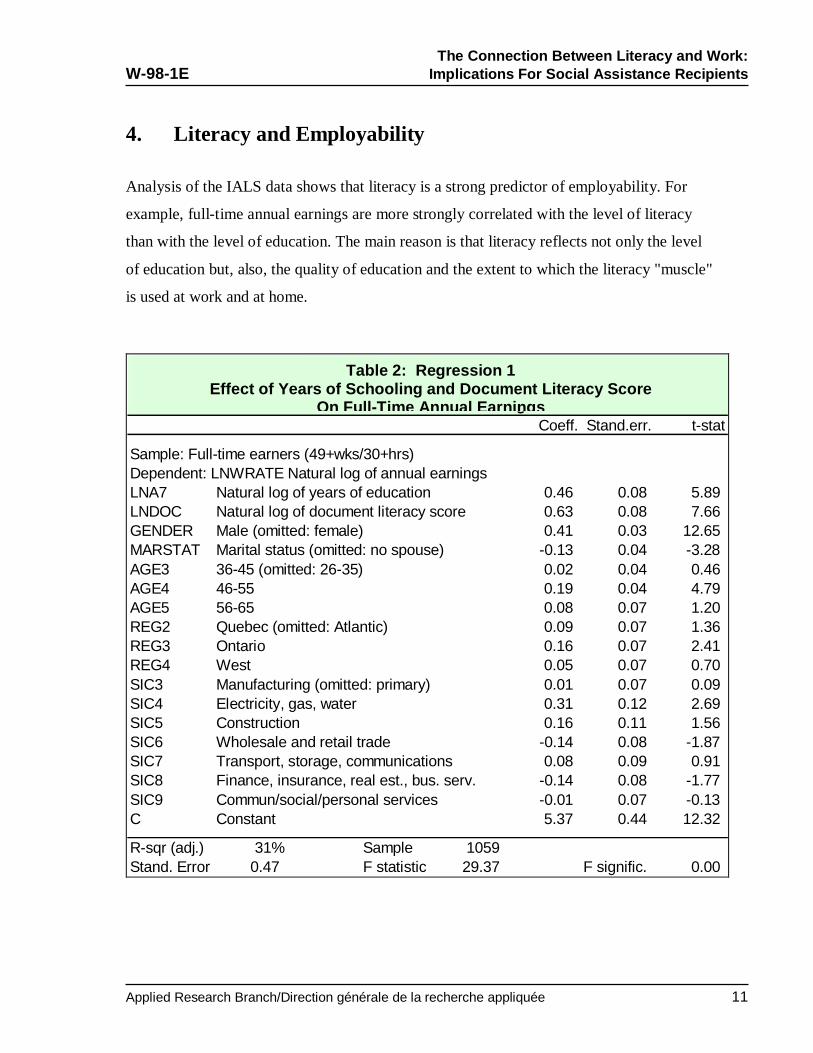
4. Literacy and Employability
Analysis of the IALS data shows that literacy is a strong predictor of employability. For
example, full-time annual earnings are more strongly correlated with the level of literacy
than with the level of education. The main reason is that literacy reflects not only the level
of education but, also, the quality of education and the extent to which the literacy "muscle"
is used at work and at home.
Regression 1Effect of Years of Schooling and Document Literacy Score
On Full-Time Annual EarningsCoeff. Stand.err. t-stat
Sample: Full-time earners (49+wks/30+hrs)Dependent: LNWRATE Natural log of annual earningsLNA7 Natural log of years of education 0.46 0.08 5.89LNDOC Natural log of document literacy score 0.63 0.08 7.66GENDER Male (omitted: female) 0.41 0.03 12.65MARSTAT Marital status (omitted: no spouse) -0.13 0.04 -3.28AGE3 36-45 (omitted: 26-35) 0.02 0.04 0.46AGE4 46-55 0.19 0.04 4.79AGE5 56-65 0.08 0.07 1.20REG2 Quebec (omitted: Atlantic) 0.09 0.07 1.36REG3 Ontario 0.16 0.07 2.41REG4 West 0.05 0.07 0.70SIC3 Manufacturing (omitted: primary) 0.01 0.07 0.09SIC4 Electricity, gas, water 0.31 0.12 2.69SIC5 Construction 0.16 0.11 1.56SIC6 Wholesale and retail trade -0.14 0.08 -1.87SIC7 Transport, storage, communications 0.08 0.09 0.91SIC8 Finance, insurance, real est., bus. serv. -0.14 0.08 -1.77SIC9 Commun/social/personal services -0.01 0.07 -0.13C Constant 5.37 0.44 12.32
R-sqr (adj.) 31% Sample 1059Stand. Error 0.47 F statistic 29.37 F signific. 0.00
Table 2:Table 2: Regression 1Effect of Years of Schooling and Document Literacy Score
On Full -Time Annual Earnings
The Connection Between Literacy and Work:W-98-1E Implications For Social Assistance Recipients
Applied Research Branch/Direction générale de la recherche appliquée 12
5. Profile of Social Assistance Recipients
The profile of Social Assistance Recipients (SARs) is quite distinct from the rest of the
population, in terms of demographics, education, literacy and work activity. For example, a
relative larger percentage of SARs are in the age group 26 to 35, are female, or they do not
have a spouse (Table 3). In terms of employment, the employment rate is much lower
among SARs, especially when it comes to full-time/full-year employment.
Also, SARs are less likely to work in a high literacy job. A job is defined here as a "high
literacy" one if it involves daily reading of at least one of the following: memos, reports or
manuals. By contrast a job is defined as "low literacy" if it never or rarely requires reading
of all three of the above.
Social assistance recipients have a lower level of education and literacy than non-SARs. The
difference is greatest when comparing non-working SARs to working non-SARs (Table 4):
• 9.5 versus 13.1 years of education (a 38% difference); and
• 216 versus 291 document literacy score (a 35% difference).

The Connection Between Literacy and Work:W-98-1E Implications For Social Assistance Recipients
Applied Research Branch/Direction générale de la recherche appliquée 13
Table 3: Profile of SARs, EI Recipients, and Rest of Population
SA / UI Status
SAR UI/ No SA No UI / NoSA
Age (International Grouping)
26-35……………………………………. 36-45……………………………………. 46-55……………………………………. 56-65…………………………………….
48%25%20%7%
34%43%17%7%
31%28%23%18%
Sex
Female…………………………………..
Male……………………………………...
60%40%
50%50%
49%51%
Marital Status
No Spouse………………….…………… Spouse Present…………………………
68%32%
16%84%
19%81%
Worked in 94 in any Job
No………………………………………... Yes……………………………………….
63%37%
17%83%
21%79%
Worked 49+ Wks/ 30+ Hrs. in 1994
No…………………………………………
Yes………………………………………..
90%10%
73%27%
39%61%
Literacy Tasks at Work
No job in 1994…………………………... Used Memos, Reports or Manuals Daily……………………………...…… Used Above at Work Less Frequently…………………………….
63%15%8%15%
17%43%18%21%
21%53%19%8%
How Often Do You Read Books? Daily……………………………………… Weekly…………………………………… Monthly………………………………….. Yearly……………………………………. Never…………………………………….
29%16%9%21%24%
33%15%18%16%18%
36%17%13%15%20%

The Connection Between Literacy and Work:W-98-1E Implications For Social Assistance Recipients
Applied Research Branch/Direction générale de la recherche appliquée 14
Table 3 (Continued)
SAR UI / NoSA
No UI / NoSA
How Often Do You Use A Public Library? Daily……………………………………… Weekly…………………………………… Monthly………………………………….. Yearly……………………………………. Never…………………………………….
3%10%11%15%61%
0%7%
17%25%51%
1%9%
14%24%53%
You Participate in Voluntary / CommunityOrganizations? Daily……………………………………… Weekly…………………………………… Monthly………………………………….. Yearly……………………………………. Never…………………………………….
7%5%7%18%64%
1%9%
10%20%59%
3%12%12%24%51%
Table 4 : Years of Education and Literacy Scores:
SARs vs. Rest of Population, By Work in 1994
SAR / Work Status
SAR:Worked in
1994
SAR: Didnot Workin 1994
Non SAR:Worked in
1994
NonSAR: Didnot Workin 1994
Years of Completed Formal Ed. (Gr).. 11.4 9.5 13.1 10.9
Post-secondary Diploma / Degree….. 21% 9% 41% 26%
Document Literacy Score……………. 261 216 291 245
Low Document Literacy Level 1/2…. 55% 76% 38% 60%
Prose Literacy Score………………… 264 226 289 255
Low Prose Literacy Score 1/2……….. 45% 75% 37% 56%
Quantitative Literacy Score………….. 258 219 294 255
Low Quantitative Literacy Level 1/2.. 55% 78% 37% 55%
Weighted Count (000)………………... 626 1,048 10,304 2,530
The Connection Between Literacy and Work:W-98-1E Implications For Social Assistance Recipients
Applied Research Branch/Direction générale de la recherche appliquée 15
6. Correlation Between SAR Status and Literacy
The lower literacy level of SARs can in part be explained by their lower education, since
education and literacy are highly correlated.3 However, even at the same level of education,
the literacy of SARs is lower than that of non-SARs.
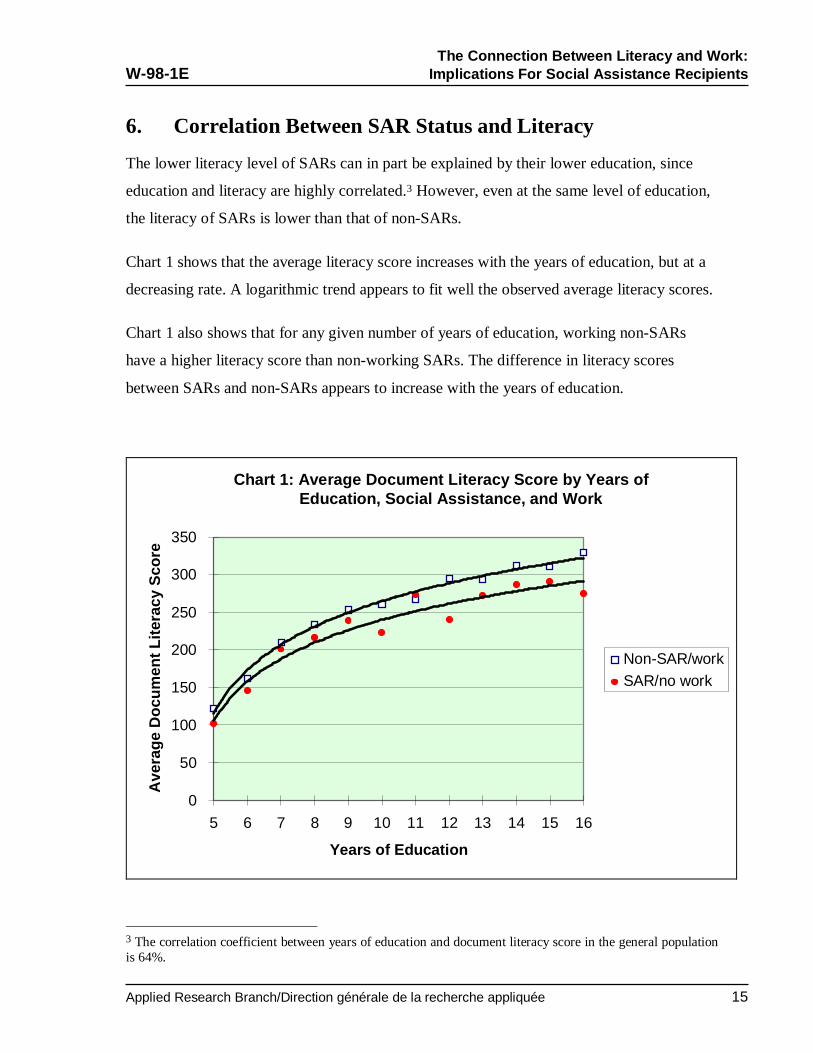
Chart 1 shows that the average literacy score increases with the years of education, but at a
decreasing rate. A logarithmic trend appears to fit well the observed average literacy scores.
Chart 1 also shows that for any given number of years of education, working non-SARs
have a higher literacy score than non-working SARs. The difference in literacy scores
between SARs and non-SARs appears to increase with the years of education.
Chart 1: Average Document Literacy Score byYears of Education, Social Assistance, and Work
0
50
100
150
200
250
300
350
5 6 7 8 9 10 11 12 13 14 15 16
Years of Education
Ave
rage
Doc
umen
t Lite
racy
Sco
re
Non-SAR/workSAR/no work
3 The correlation coefficient between years of education and document literacy score in the general populationis 64%.
Chart 1: Average Document Literacy Score by Years of Education, Social Assistance, and Work

The Connection Between Literacy and Work:W-98-1E Implications For Social Assistance Recipients
Applied Research Branch/Direction générale de la recherche appliquée 16
The correlation between the years of education and SAR status was tested more rigorously
using regression techniques. The dependent variable was the document literacy score. The
first independent variable was years of education (in natural log form).4 The second
independent variable was a dummy for SAR status.5 Other independent variables included
in the regressions were age, gender, presence of spouse, and region.
• Regression 2a (Table 5) compares non-working SARs to working non-SARs. It shows
that at any given level of education (and after controlling for differences in age, gender,
presence of spouse, and region) the document literacy score of non-working SARs is
lower by 31 units, or 14% expressed as a percentage of their average score of 216.
Regression 2aEffect of SAR Status on Document Literacy Score
Non-Working SARs versus Working Non-SARsCoeff. Stand.err. t-stat
Sample: Non-working SARs and working non-SARsDependent: DOC document literacy scoreLNA7 Natural log of years of education 138.10 4.17 33.09SAR Received social assistance -30.80 4.59 -6.70AGE3 36-45 (omitted: 26-35) -10.77 2.80 -3.85AGE4 46-55 -14.54 3.11 -4.68AGE5 56-65 -37.35 4.51 -8.28GENDER Male (omitted: female) -1.49 2.35 -0.64MARSTAT Marital status (omitted: no spouse) -1.82 2.95 -0.62REG2 Quebec (omitted: Atlantic) -3.15 4.67 -0.67REG3 Ontario -3.48 4.53 -0.77REG4 West -0.45 4.61 -0.10C Constant -44.72 11.99 -3.73
R-sqr (adj.) 48% Sample 1929Stand. Error 50.55 F statistic 182.54 F signific. 0.00
4 A second degree polynomial specification was also tested, but it had the undesirable property of showingnegative effects on literacy for very high years of education.
5 A term for the interaction between years of education and SAR status was also tested, since Chart 1 showsthat the negative effect of SAR status on literacy is greater at higher years of education. However, theinteraction term was found to be statistically insignificant and was not included in the final regressions.
Table 5: Regression 2aEffect of SAR Status on Document Literacy Score
Non-Working SARs versus Working Non-SARs
The Connection Between Literacy and Work:W-98-1E Implications For Social Assistance Recipients
Applied Research Branch/Direction générale de la recherche appliquée 17
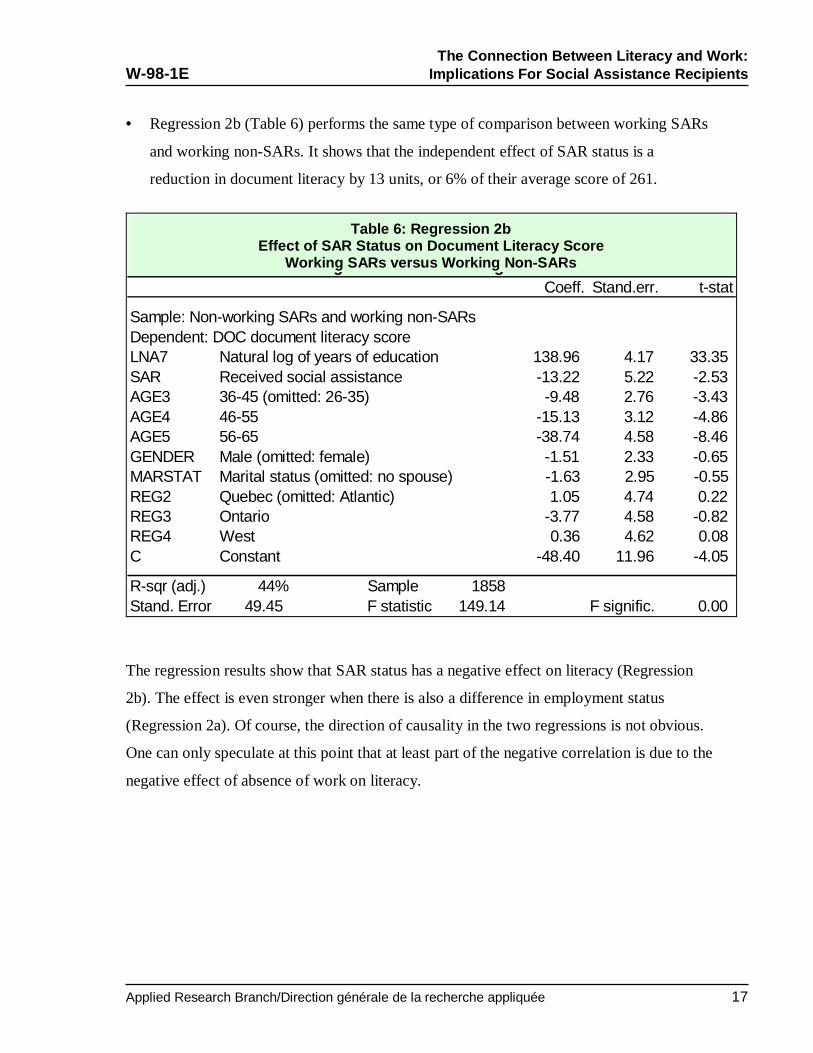
• Regression 2b (Table 6) performs the same type of comparison between working SARs
and working non-SARs. It shows that the independent effect of SAR status is a
reduction in document literacy by 13 units, or 6% of their average score of 261.
Regression 2bEffect of SAR Status on Document Literacy Score
Working SARs versus Working Non-SARsCoeff. Stand.err. t-stat
Sample: Non-working SARs and working non-SARsDependent: DOC document literacy scoreLNA7 Natural log of years of education 138.96 4.17 33.35SAR Received social assistance -13.22 5.22 -2.53AGE3 36-45 (omitted: 26-35) -9.48 2.76 -3.43AGE4 46-55 -15.13 3.12 -4.86AGE5 56-65 -38.74 4.58 -8.46GENDER Male (omitted: female) -1.51 2.33 -0.65MARSTAT Marital status (omitted: no spouse) -1.63 2.95 -0.55REG2 Quebec (omitted: Atlantic) 1.05 4.74 0.22REG3 Ontario -3.77 4.58 -0.82REG4 West 0.36 4.62 0.08C Constant -48.40 11.96 -4.05
R-sqr (adj.) 44% Sample 1858Stand. Error 49.45 F statistic 149.14 F signific. 0.00
The regression results show that SAR status has a negative effect on literacy (Regression
2b). The effect is even stronger when there is also a difference in employment status
(Regression 2a). Of course, the direction of causality in the two regressions is not obvious.
One can only speculate at this point that at least part of the negative correlation is due to the
negative effect of absence of work on literacy.
Table 6: Regression 2bEffect of SAR Status on Document Literacy Score
Working SARs versus Working Non-SARs

The Connection Between Literacy and Work:W-98-1E Implications For Social Assistance Recipients
Applied Research Branch/Direction générale de la recherche appliquée 18
7. Literacy-equivalence Education Factor
The above results show that at any given level of education, the literacy score of SARs is
lower than that of non-SARs. In other words, to achieve the same level of literacy, SARs
require more years of education than non-SARs.
The additional years of education required by SARs to reach the same level of literacy as
working non-SARs provide a literacy-equivalence factor. This factor allows the conversion
of the education level of SARs into the literacy-equivalent level of education of working
non-SARs. Thus:
• Although the average years of education of non-working SARs is 9.5, in literacy terms
this is equivalent to only 7.5 years of education of working non-SARs. In other words,
working non-SARs reach a literacy score of 216 (the average score of non-working
SARs) at 7.5 years of schooling rather than 9.5 years. This implies that the literacy-
equivalence factor of education for non-working SARs is 2 years (distance AB in Chart
2).
• Alternatively, a non-working SAR requires an additional 2.5 years of education to reach
the literacy level of 291 that the average working non-SAR reaches with 13.1 years of
schooling (distance DE in Chart 2).6
6 Because the relation between years of education and literacy is not linear, at higher levels of literacy greatincrements in years of education are required to offset the same absolute difference in literacy scores.

The Connection Between Literacy and Work:W-98-1E Implications For Social Assistance Recipients
Applied Research Branch/Direction générale de la recherche appliquée 19
Chart 2: Predicted Docum ent Literacy by Years of Schooling
0
50
100
150
200
250
300
350
5 6 7 8 9 10 11 12 13 14 15
Years of Schooling
Doc
umen
t Lite
racy
Sco
re
Non -W orking SARs
W o rking No n-SARs
A B
C D
Chart 2: Predicted Document Literacy by Years of Schooling
The Connection Between Literacy and Work:W-98-1E Implications For Social Assistance Recipients
Applied Research Branch/Direction générale de la recherche appliquée 20
8. The Effect of Work on Literacy
The lower literacy at the same level of education of non-working SARs relative to working
non-SARs may be due to different factors:
• One possibility is that SARs have a lower quality of education or their literacy is lower
due to other factors that have not been included in the regression model.
• Another possibility is that the absence of work itself has a negative effect on literacy.
Although at this stage this is a speculation, it is quite possible that there is a virtuous
cycle between work and literacy: higher literacy leads to more employment, while more
employment improves literacy skills.
Regressions 3a and 3b (Tables 7 and 8) confirm the correlation between work and literacy.
According to these regressions, the effect of work on literacy is stronger among SARs.
However, these results are still very preliminary since no allowance is made in the
regression equations for the simultaneous relation between work and literacy.
Separating the correlation between work and literacy into its two components (the effect of
literacy on work and the effect of work on literacy) is a difficult methodological issue. This
issue will be the subject of in-depth investigation in a follow-up study which will explore in
more detail the causal relationship between literacy and work.

The Connection Between Literacy and Work:W-98-1E Implications For Social Assistance Recipients
Applied Research Branch/Direction générale de la recherche appliquée 21
Regression 3aEffect of Work on Literacy
Among Non-SARsCoeff. Stand.err. t-stat
Sample: All non-SARsDependent: DOC document literacy scoreLNA7 Natural log of years of education 132.97 3.95 33.69ERATE Worked in 1994 9.72 3.19 3.04AGE3 36-45 (omitted: 26-35) -7.86 2.80 -2.81AGE4 46-55 -16.35 3.09 -5.30AGE5 56-65 -32.49 3.86 -8.42GENDER Male (omitted: female) -2.01 2.32 -0.87MARSTAT Marital status (omitted: no spouse) -2.43 2.91 -0.84REG2 Quebec (omitted: Atlantic) 8.37 4.39 1.91REG3 Ontario 0.86 4.27 0.20REG4 West 3.30 4.34 0.76C Constant -47.16 11.17 -4.22
R-sqr (adj.) 46% Sample 2174Stand. Error 51.57 F statistic 186.67 F signific. 0.00
Regression 3bEffect of Work on Literacy
Among SARsCoeff. Stand.err. t-stat
Sample: All SARsDependent: DOC document literacy scoreLNA7 Natural log of years of education 167.94 10.75 15.62ERATE Worked in 1994 17.78 7.25 2.45AGE3 36-45 (omitted: 26-35) -10.68 8.17 -1.31AGE4 46-55 19.26 8.60 2.24AGE5 56-65 -2.34 13.54 -0.17GENDER Male (omitted: female) -15.83 7.18 -2.20MARSTAT Marital status (omitted: no spouse) 8.18 7.50 1.09REG2 Quebec (omitted: Atlantic) -21.10 13.07 -1.61REG3 Ontario -11.23 13.12 -0.86REG4 West -10.51 13.83 -0.76C Constant -138.87 27.55 -5.04
R-sqr (adj.) 57% Sample 283Stand. Error 53.15 F statistic 38.22 F signific. 0.00
Table 7: Regression 3aEffect of Work on Literary
Among Non-SARs
Table 8: Regression 3bEffect of Work on Literacy
Among SARs

The Connection Between Literacy and Work:W-98-1E Implications For Social Assistance Recipients
Applied Research Branch/Direction générale de la recherche appliquée 22
The direction of causality is difficult to determine. One could argue that the correlation
shows that works improves literacy skills, both because of literacy activities at work and the
increased socialization. On the other hand, one could also argue that the correlation shows
that those with higher literacy have better chances of being employed. The reality is
probably somewhere between. Literacy and work are connected through a "virtuous" cycle:
literacy improves the chances of employment; employment improves literacy (Chart 3).
Chart 3: The Education-Literacy-Work
Virtuous Cycle
Formaleducation& training
Learning Literacy &motivation technical
skills
Employmentopportunities
The Connection Between Literacy and Work:W-98-1E Implications For Social Assistance Recipients
Applied Research Branch/Direction générale de la recherche appliquée 23
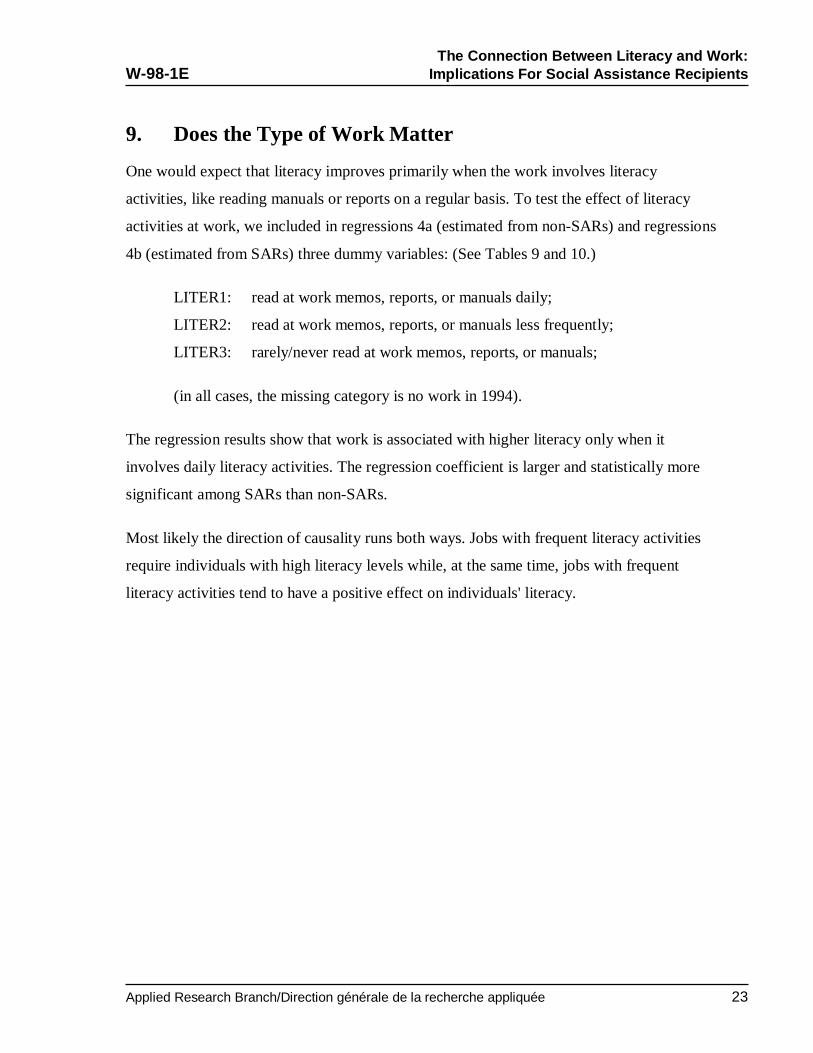
9. Does the Type of Work Matter
One would expect that literacy improves primarily when the work involves literacy
activities, like reading manuals or reports on a regular basis. To test the effect of literacy
activities at work, we included in regressions 4a (estimated from non-SARs) and regressions
4b (estimated from SARs) three dummy variables: (See Tables 9 and 10.)
LITER1: read at work memos, reports, or manuals daily;
LITER2: read at work memos, reports, or manuals less frequently;
LITER3: rarely/never read at work memos, reports, or manuals;
(in all cases, the missing category is no work in 1994).
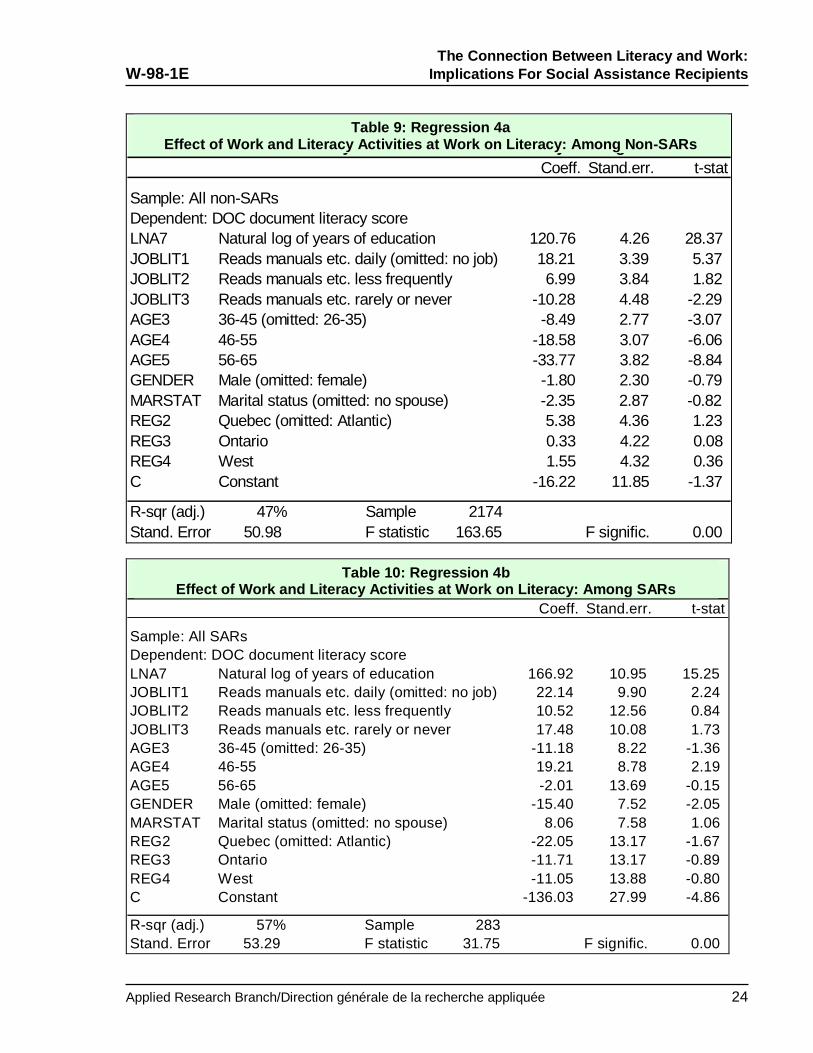
The regression results show that work is associated with higher literacy only when it
involves daily literacy activities. The regression coefficient is larger and statistically more
significant among SARs than non-SARs.
Most likely the direction of causality runs both ways. Jobs with frequent literacy activities
require individuals with high literacy levels while, at the same time, jobs with frequent
literacy activities tend to have a positive effect on individuals' literacy.
The Connection Between Literacy and Work:W-98-1E Implications For Social Assistance Recipients
Applied Research Branch/Direction générale de la recherche appliquée 24
Regression 4aEffect of Work and Literacy Activities at Work on Literacy: Among Non-SARs
Coeff. Stand.err. t-stat
Sample: All non-SARsDependent: DOC document literacy scoreLNA7 Natural log of years of education 120.76 4.26 28.37JOBLIT1 Reads manuals etc. daily (omitted: no job) 18.21 3.39 5.37JOBLIT2 Reads manuals etc. less frequently 6.99 3.84 1.82JOBLIT3 Reads manuals etc. rarely or never -10.28 4.48 -2.29AGE3 36-45 (omitted: 26-35) -8.49 2.77 -3.07AGE4 46-55 -18.58 3.07 -6.06AGE5 56-65 -33.77 3.82 -8.84GENDER Male (omitted: female) -1.80 2.30 -0.79MARSTAT Marital status (omitted: no spouse) -2.35 2.87 -0.82REG2 Quebec (omitted: Atlantic) 5.38 4.36 1.23REG3 Ontario 0.33 4.22 0.08REG4 West 1.55 4.32 0.36C Constant -16.22 11.85 -1.37
R-sqr (adj.) 47% Sample 2174Stand. Error 50.98 F statistic 163.65 F signific. 0.00
Regression 4bEffect of Work and Literacy Activities at Work on Literacy: Among SARs
Coeff. Stand.err. t-stat
Sample: All SARsDependent: DOC document literacy scoreLNA7 Natural log of years of education 166.92 10.95 15.25JOBLIT1 Reads manuals etc. daily (omitted: no job) 22.14 9.90 2.24JOBLIT2 Reads manuals etc. less frequently 10.52 12.56 0.84JOBLIT3 Reads manuals etc. rarely or never 17.48 10.08 1.73AGE3 36-45 (omitted: 26-35) -11.18 8.22 -1.36AGE4 46-55 19.21 8.78 2.19AGE5 56-65 -2.01 13.69 -0.15GENDER Male (omitted: female) -15.40 7.52 -2.05MARSTAT Marital status (omitted: no spouse) 8.06 7.58 1.06REG2 Quebec (omitted: Atlantic) -22.05 13.17 -1.67REG3 Ontario -11.71 13.17 -0.89REG4 West -11.05 13.88 -0.80C Constant -136.03 27.99 -4.86
R-sqr (adj.) 57% Sample 283Stand. Error 53.29 F statistic 31.75 F signific. 0.00
Table 10: Regression 4bEffect of Work and Literacy Activities at Work on Literacy: Among SARs
Table 9: Regression 4aEffect of Work and Literacy Activities at Work on Literacy: Among Non-SARs

The Connection Between Literacy and Work:W-98-1E Implications For Social Assistance Recipients
Applied Research Branch/Direction générale de la recherche appliquée 25
10. Is Work at the Cost of Home Literacy Activities?
Finally, it is important to recognize that literacy activities can also take place outside work.
This raises the possibility that work under some circumstances may lower literacy by
reducing the amount of free time.
To test this hypothesis we focused on three types of activities that are associated with higher
literacy: using a public library, participating in volunteer activities, and reading books. The
first two were expected to be particularly sensitive to the available time and therefore at risk
of suffering from work. In all cases, we made a distinction between frequent use (at least
once a month) and less frequent use.
To test the effect of work on literacy activities at home, we compared working and non-
working individuals (both SARs and non-SARs) before and after we reweighted the sample
to remove the influence of education. The results are summarized in Tables 11a and 11b.
Similar conclusion were reached by using regression analysis and controlling for more
characteristics than education.
The results show that among SARs work does not exact a significant cost to literacy
activities at home. In fact, working SARs are more likely to regularly use a public library,
do voluntary work, or read a book than non-working SARs. Even after adjusting or
differencesin levels of education, there is little difference in literacy activities at home
between working and non-working SARs. Moreover, both types of SARs are more likely to
participate in literacy activities outside work than working non-SARs.

The Connection Between Literacy and Work:W-98-1E Implications For Social Assistance Recipients
Applied Research Branch/Direction générale de la recherche appliquée 26
Table 11a: Effect of Work on Literacy Activities at Home
(before sample reweighting to normalize effect of education )
SAR / Work Status
SAR:Workedin 1994
SAR: Didnot Workin 1994
Non SAR:Workedin 1994
Non SAR:Did notwork in1994
Use a Public Library at LeastMonthly……………………………
26% 23% 24% 23%
Do Voluntary Work at LeastMonthly…………………………… 25% 14% 26% 18%
Read Books at LeastMonthly…………………………… 58% 53% 64% 69%
Table 11b: Effect of Work on Literacy Activities at Home
(after sample reweighting to normalize effect of education)
SAR / Work Status
SAR:Workedin 1994
SAR: Didnot Workin 1994
Non SAR:Workedin 1994
Non SAR:Did notwork in1994
Use a Public Library at LeastMonthly……………………………
35% 32% 22% 31%
Do Voluntary Work at LeastMonthly…………………………… 31% 28% 25% 22%
Read Books at LeastMonthly…………………………… 62% 67% 60% 73%
The Connection Between Literacy and Work:W-98-1E Implications For Social Assistance Recipients
Applied Research Branch/Direction générale de la recherche appliquée 27
11. Conclusion
There is a virtuous cycle between literacy and work: Literacy is important for employability,
but employment is also important in maintaining literacy. Absence from the work place has
a negative effect on literacy. There is tentative evidence that encouraging employment will
have long-term employability benefits through the improvement of skills. In other words,
encouraging work among SARs may improve their employability not only because of the
gain in work experience and improvement of work habits, but also because of a positive
effect on their literacy.
The IALS data provide an opportunity for two types of further analytical research:
• First, a more in-depth investigation of how work may contribute to the literacy levels of
SARs. This can included such aspects as access to employer-sponsored training, use of
literacy and numeracy tasks at work, and social interaction at the workplace.
• Second, an expansion of the traditional investigation of the determinants of reliance on
social assistance by incorporating literacy as an independent variable. In effect, there is a
"simultaneous system" relation between literacy, work, and reliance on social assistance
which is important to investigate.

The Conne ction B etween L iteracy and Wo rk:W-98-1E Implications For Soc ial Assistance Recipients
Applied Research Branch/Direction générale de la recherche appliquée 28
References
Barham, Vicky; Robin Bodway; Maurice Marchand; and Pierre Pestieau (1991) Education and
the Poverty Trap. Queens University, Institute for Economic Research.
Brown, David (1995) "Welfare Caseload Trends in Canada" in Helping the Poor -- A Qualified
Case for 'Workfare'. C.D. Howe Institute, The Social Policy Challenge No. 5, pp. 37-81.
Crompton, Susan (1996) The Marginally Literate Workforce. Perspectives on Labour and
Income, Summer, Vol. 8, No. 2.
Kapsalis, Constantine (1997) Employee Training: An International Perspective. Statistics
Canada (Catalogue no. 89-552-MPE, no. 2).
Krashinsky, Michael (1995) "Putting the Poor to Work: Why 'Workfare' Is an Idea Whose Time
Has Come?" in Helping the Poor -- A Quali fied Case for 'Workfare'. C.D. Howe Institute,
The Social Policy Challenge No. 5, pp. 91-119
Lightman, Ernie S. (1995) "You Can Lead a Horse to Water...: The Case Against Workfare in
Canada." in Helping the Poor -- A Qualified Case for 'Workfare'. C.D. Howe Institute, The
Social Policy Challenge No. 5, pp. 151-179
National Anti-Poverty Organization (1992) Literacy and Poverty: A View from the Inside.
Organization for Economic Co-operation and Development (1996) Lifelong Learning for All.
Statistics Canada (1992) Education in Canada -- A Statistical Review for 1990-91.
Shalla, Vivian and Grant Schellenerg (forthcoming) The Value of Words: Literacy and Economic
Security in Canada. Canadian Council on Social Development, Centre for International
Statistics.
Statistics Canada/OECD (1995) Literacy, Economy and Society.
Statistics Canada (1996) Reading the Future: A Portrait of Literacy in Canada (Catalogue no.
89-551-XPE)