downingsci10.weebly.com€¦ · web viewunit d – energy flow in global systems. d1 – the...
TRANSCRIPT

Unit D – Energy Flow in Global Systems
D1 – The Biosphere
Earth – our biosphere The biosphere refers to the thin layer of Earth that has conditions suitable for life, includes:
subdivided into three components that interact: atmosphere – lithosphere – a.k.a. Earth’s crust – (includes the land under the oceans) hydrosphere – (includes liquid, vapour and ice)
Atmosphere made up of a mixture of gases,
78% N2(g), 21% O2(g), 1% other “other” includes Ar, CO2, Ne, He, CH4 and Kr does not include H2O because it is considered to be
also includes tiny solid particles called atmospheric dust including living things (e.g. )
and non-living (e.g. )

Divided up into four layers based on altitude ( )
Atmosphere layer #1 - troposphere From 0 to 10 km Temperature 15oC to – 60oC
only layer of the atmosphere with a mix of gases and temperature to support a variety of life (including humans)
contains most of the
where most of our weather occurs, including
Atmosphere layer #2 - stratosphere From 10 to 50 km Temperature – 60oC to 0oC
only isolated clumps of living cells found living in this layer contains most of the ozone is a molecule made up of three oxygen atoms (O3(g)) protects living organisms from sun’s UV radiation
Atmosphere layer #3 - mesosphere From 50 to 80 km Temperature 0oC to – 100oC
Atmosphere layer #4 - thermosphere From 80 to 300 km Temperature – 100oC to 1500oC
named for the high temperatures near the edge of the layer ( )
Lithosphere floats on top of the fluid layer called the mantle
extends from the Earth’s surface inward as thin as 5 km, as thick as 100 km in places
warmed both by
Hydrosphere about 97% is the other 3% fresh water, but is mostly
the total amount of water on Earth
warmed mostly by the sun, but also by the
Earth’s core
salt water
fresh liquid wa-ter
ice

Weather vs. climate weather
day-to-day conditions, including
climate average conditions occurring over a period of
30 years or longer e.g. Alberta has a relatively
compared to Brazil, which is
Effect of climate on humans the climate of a region (map #1) - average air temperatures) has
several effects on the humans that live there, including (map #2) (map #3)
Effect of climate on other organisms The better suited to its climate an organism is,
an adaptation is a change in the that makes it more suited to its
environment

Climate change Climate is long term – climate change refers to a
A few common questions arise when discussing climate change:
is climate change really happening, or are environmentalists using scare tactics? if climate change is occurring over such long terms, how do we know for sure? if climate change has occurred several times over Earth’s history, why are we so worried now?
Global warming IS happening – no educated scientist, politician or environmentalist disputes this what IS up for debate is Since 1990, the global average temperature the northern hemisphere is substantially warmer than at any point during the past 1,000 years
the key is that its GLOBAL AVERAGE temperatures – it doesn’t necessarily mean
in Canada, it could actually result in cooling temperatures and
Changing climates a variety of evidence exists to demonstrate that the climate of the Earth has varied throughout its history this change continues today, and is often referred to as global warming some of the evidence we use depends upon humans, so some of the evidence allows us to look back at the Earth’s conditions
Types of evidence two general categories of evidence exist:
anecdotal evidence from the word “anecdote”, meaning a short, personal story of an individual’s
experiences is most often
instrumental evidence includes may require is most often
Which one is more reliable? Why? when trying to measure something, there are two approaches
measure the factor directly (e.g. if you want to find out how far it is to Calgary, measure the distance)

measure some other factor, and use it to make conclusions (e.g. calculate the distance based on your speed of travel and the time it takes)
tracking climate change is the same way: direct evidence – explicitly indicates global warming is occurring, based on
indirect evidence – evidence that seems to support the idea of climate change but does not involve
Direct evidence uses historical data from scientists to farmers, people have been recording weather and temperature information for
hundreds of years patterns emerge and are often used to predict future weather, such as in the Farmers’ Almanac limited in how far back a written record goes;
Indirect evidence
different types of evidence exist that support the idea of climate change, though are not direct measurement of temperature
these include:
Tree ring analysis tree rings reflect the
during the life of a tree
by examining wood from trees of different ages and from different time periods, a continuous record of climate changes can be established that goes back a few thousand years.
The tree's age can be figured out by counting the pairs of light and dark rings. It's easier to see the dark rings so they are usually the ones used for counting.
To help figure out what climate the tree grew in and what the environment was like, the scientist looks at each ring: thickness:
How wide a ring is can tell you if the environment was good or bad for the tree to grow in.
In years when the amount of rain and temperature were good a tree's rings are wider.
In bad years a tree's rings are thinner. shape:

if rings start to become thinner on one side than the other it probably means the tree is leaning over to one side.
High winds or a big storm can cause a tree to lean. strange marks or scars,
can be left by insects or disease. a forest fire can leave burnt marks.
scientists use a computer to measure the width of rings up to 0.01 mm and to find other things they can't see by just looking at the tree.
Ice core sampling By obtaining a sample of a column of ice 10,000 feet down in our ice
sheets, we are looking at ice By analyzing the tiny bubbles of air trapped in this ice, scientists can
collect information about .
Fossil records & pollen samples By examining fossil records or pollen samples from the past, we can
determine
since we know that plants and animals are adapted to particular climates (temperature, humidity, amount of sunlight), we can make conclusions about
D2.1-2.3 – Energy transfer through the biosphere
Mechanism for change You’ve probably heard that greenhouse gases are to blame for climate change – that’s partly true Natural factors, including
have also influenced climate over Earth’s history
However, in the case of current global warming, the speed and degree of change ( ) can only be explained by human activity to understand how heat becomes
trapped in the atmosphere, we have to understand the sun’s energy
Solar energy The sun’s energy is radiant energy –
recall, that means energy that is transmitted in waves There are a wide variety of waves
radiating from the sun

All waves from the sun travel at the same speed, ( ) , but they vary in the amount of energy they carry
Insolation & the Angle of Inclination Not all regions of the Earth receive the same amount of the Sun’s energy
Insolation is the amount solar energy received by a region of the Earth’s surface
Angle of Inclination while we often illustrate the Earth like this it’s actually on a tilt, like this
the angle of inclination refers to
while we have evidence that suggests the Earth wobbles a bit,
Angle of
Incidence the Earth orbits the Sun once per year the Earth’s tilt is the reason for the seasons remember, you have to distinguish between hemispheres when discussing seasons

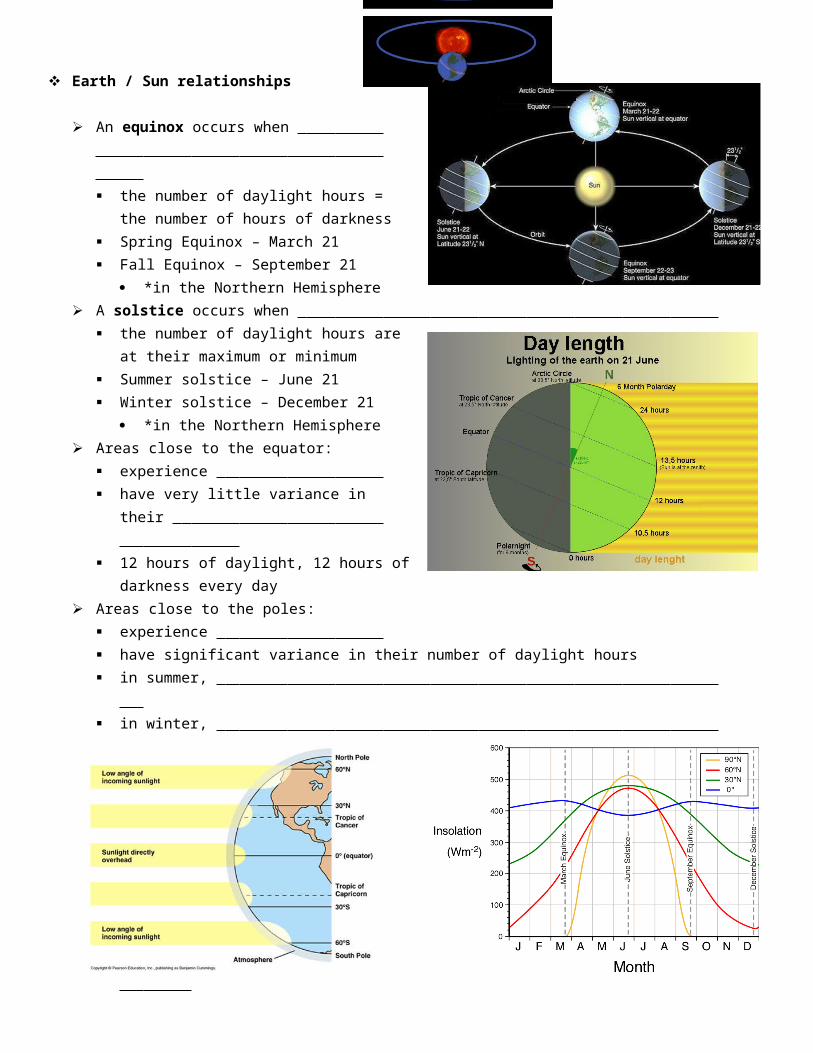
Earth / Sun relationships
An equinox occurs when the number of daylight hours = the number of
hours of darkness Spring Equinox – March 21 Fall Equinox – September 21
*in the Northern Hemisphere A solstice occurs when
the number of daylight hours are at their
maximum or minimum Summer solstice – June 21 Winter solstice – December 21
*in the Northern Hemisphere Areas close to the equator:
experience have very little variance in their
12 hours of daylight, 12 hours of darkness
every day Areas close to the poles:
experience have significant variance in their number of daylight hours in summer,
in winter,
The shape of the Earth also plays a part in insolation Because it’s spherical, a light ray hitting at the equator
than a light ray hitting at a

The Angle of Incidence is the angle between
Albedo the albedo of a surface is
a white shiny surface (e.g. snow) a dark, dull surface (e.g. forest, dirt) the average albedo for Earth’s surface is 30% (or 0.30)
90o anglesun is intense
40o anglesun is diffuse
Implications of Albedo because snow and ice have a much higher albedo, regions that are
frozen reflect more snow than regions without snow or ice the albedo of most regions in Canada is
in the arctic, the albedo is deserts also have high albedo because they lack
Summary of Earth/Sun relationships The climate of a region is largely determined by Insolation is affected by
the Angle of Inclination – due to the tilt of the Earth, areas further from the equator see more
the Angle of Incidence – due to the spherical shape of the Earth, areas further from the equator get
Once the sun hits the Earth’s surface, it may be absorbed or reflected,
Natural Greenhouse Effect Recall, energy cannot be destroyed – so if some/most
of the sun’s rays reflect off the Earth’s surface, where do they go? the energy gets

normally, a portion of this thermal energy is lost to space, and
the trapping of this heat by the atmosphere is called the Natural Greenhouse Effect without this effect, the Earth would be 33oC colder
Greenhouse gases Greenhouse gases are gases that contribute to the greenhouse effect The main naturally-occurring greenhouse gas is water vapour. Other naturally-occurring greenhouse gases
include
Water vapour
Carbon dioxide
Methane
Dinitrogen monoxide
Other gases (incl. ozone & halocarbons)
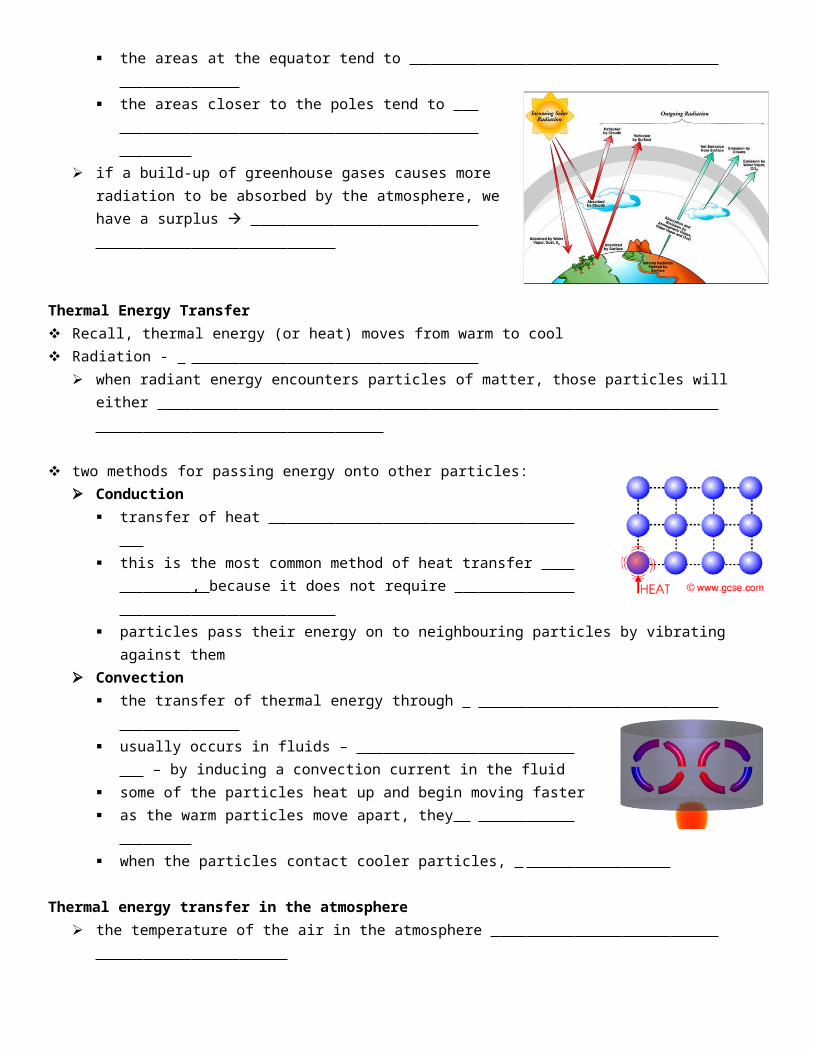
Net Radiation Budget Before human activity made such an impact, the Earth’s radiation budget was balanced
that is, some thermal energy was reflected out into space, and some absorbed by the atmosphere the net result was net radiation budget = incoming radiation – outgoing radiation it is important to note that the budget is balanced on a planetary basis, but some regions are in surplus and
some in deficit the areas at the equator tend to
the areas closer to the poles tend to
if a build-up of greenhouse gases causes more radiation to be
absorbed by the atmosphere, we have a surplus
Thermal Energy Transfer Recall, thermal energy (or heat) moves from warm to cool Radiation -
when radiant energy encounters particles of matter, those particles will either
two methods for passing energy onto other particles: Conduction
transfer of heat

this is the most common method of heat transfer , because it does not require
particles pass their energy on to neighbouring particles by vibrating against them Convection
the transfer of thermal energy through
usually occurs in fluids – – by inducing a convection current in the fluid
some of the particles heat up and begin moving faster as the warm particles move apart, they when the particles contact cooler particles,
Thermal energy transfer in the atmosphere the temperature of the air in the atmosphere
the air at the poles
because the cool air has higher atmospheric pressure, it moves toward the equator where the pressure is
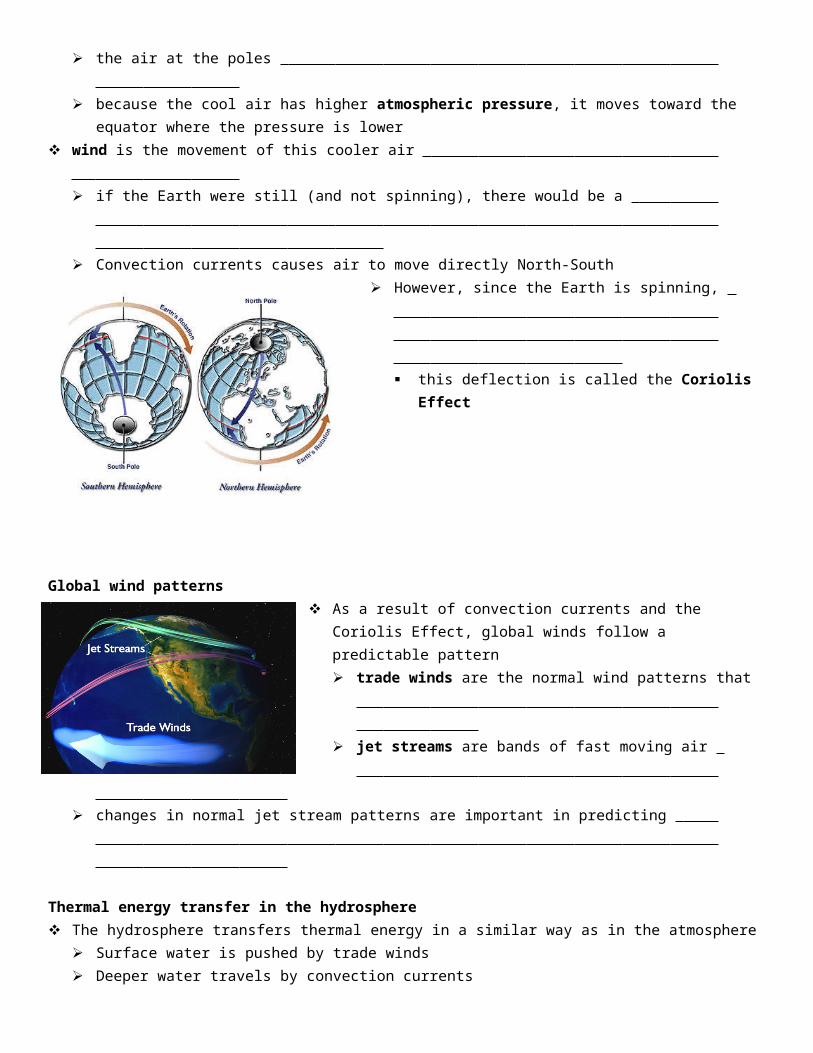
lower wind is the movement of this cooler air
if the Earth were still (and not spinning), there would be a
Convection currents causes air to move directly North-South However, since the Earth is spinning,
this deflection is called the Coriolis Effect
Global wind patterns As a result of convection currents and the Coriolis Effect, global
winds follow a predictable pattern trade winds are the normal wind patterns that
jet streams are bands of fast moving air
changes in normal jet stream patterns are important in predicting

Thermal energy transfer in the hydrosphere The hydrosphere transfers thermal energy in a similar way as in the atmosphere
Surface water is pushed by trade winds Deeper water travels by convection currents Warmer waters near the equator
currents in the Northern Hemisphere circle currents in the Southern Hemisphere circle
Unlike air currents which don’t have to circulate around something, water currents are
Consider this: These three Canadian cities are at nearly the exact same latitude Because they are all the same distance from the equator, they are
, so we might expect that they all have
However, this is what Environment Canada actually reports:
-10-505
101520
VancouverLethbridgeGander
Month
Tem
pera
ture
(oC)
Notice: Vancouver has
Gander has
Lethbridge’s average annual temperature
these three observations can all be explained by the presence or absence of
49oN
Specific heat capacity At several points in this course, you’ve been asked to consider the special properties of water (e.g. good
solvent, polar molecule, solid is less dense than the liquid, cohesive & adhesive, etc.) There is one more property of water that affects global energy transfer: water has
Specific heat capacity refers to the ability of a substance to
The high specific heat capacity of water means that it absorbs much of the sun’s radiant energy but stays at a constant temperature
What does this mean for the three cities? Cities next to oceans experience more moderate (less extreme) temperatures because water can absorb
heat without changing temperature Because Vancouver and Gander are located on oceans,
that means they will see less variation in their climate from month to month
Vancouver is located next to
Gander is located next to
this explains why
Because Lethbridge is land-locked, it does not benefit from the , and therefore experiences
Quantity of Thermal Energy, Q the quantity of thermal energy (Q) is the amount of thermal energy (measured in joules) that is absorbed or
released it is affected by
(measured in grams) (measured as the number of oC it changes) how easily the substance changes temperature (as indicated by )
The formula is Q = mc∆t , where: Q = quantity of thermal energy (J) m = mass of the substance (g) c = specific heat capacity of the substance in (J/g•˚C) ∆t = change in temperature (oC)
Understanding specific heat capacity The specific heat capacity of water is 4.19 J/g•oC
this means it takes 4.19 J of energy to warm
This number is quite high compared to other substances, for instance:
aluminium: copper: lead:
Which means, compared to these metals, it takes a lot more energy to make water change temperature Or, put another way,
Finding the specific heat capacity The ‘c’ of other substances can be determined using a calorimeter
a calorimeter (it can be made of metal like a Thermos or as simple as two Styrofoam cups)
to determine the value of ‘c’ for another substance,
by knowing how much heat you used (Q) and measuring the temperature change (∆t) you can calculate ‘c’
Example: 50.0g of water at 25.0oC is heated to 50.0oC on a hot plate. Given that the
theoretical specific heat capacity of water is 4.19 J/g•oC, determine the value for Q.Q = mc∆t
= (50.0g)(4.19 J/g•oC)(50.0 – 25.0oC)= 5237.5 J= 5.24 x 10³ J or 5.24 kJ
Example: How much thermal energy must be released to decrease the temperature of 1.00 kg of water by 10.0oC?
Q = ?m = 1.00 kg = 1000 gc = 4.19 J/g•oC (in data booklet)∆t = 10.0oC
Q = mc∆t = (1000g)(4.19 J/g•oC)(10.0oC) = 41 900J= 4.19 x 10⁴ J or 41.9 kJ
Practice problems:1) A 200g mass of water at 4.00oC is warmed to 22.0oC. Determine the amount of thermal energy absorbed.
2) Determine the quantity of energy required to warm a 1.00-kg block of ice from – 15oC to 0.0oC. The theoretical specific heat capacity of ice is 2.00 J/g•oC
3) 21.6 J of energy are used to heat a 2.0g piece of iron by 24.0oC. What is the experimental specific heat capacity of iron?
The hydrologic cycle and energy transfer

We’ve seen how liquid water is able to absorb / release thermal energy and its effect on climate, but this only describes part of the hydrologic cycle the hydrologic cycle is
besides the movement of liquid water in convection currents, water in the cycle also
Practice problem: Using this image as a guide, identify a process where water
goes from: solid to liquid liquid to solid liquid to gas gas to liquid gas to solid
Phase changes During a phase change, water changes state
this occurs because the thermal energy is going toward
rather than
Since water molecules undergo many phase changes in the cycle, a lot of energy is this helps to keep
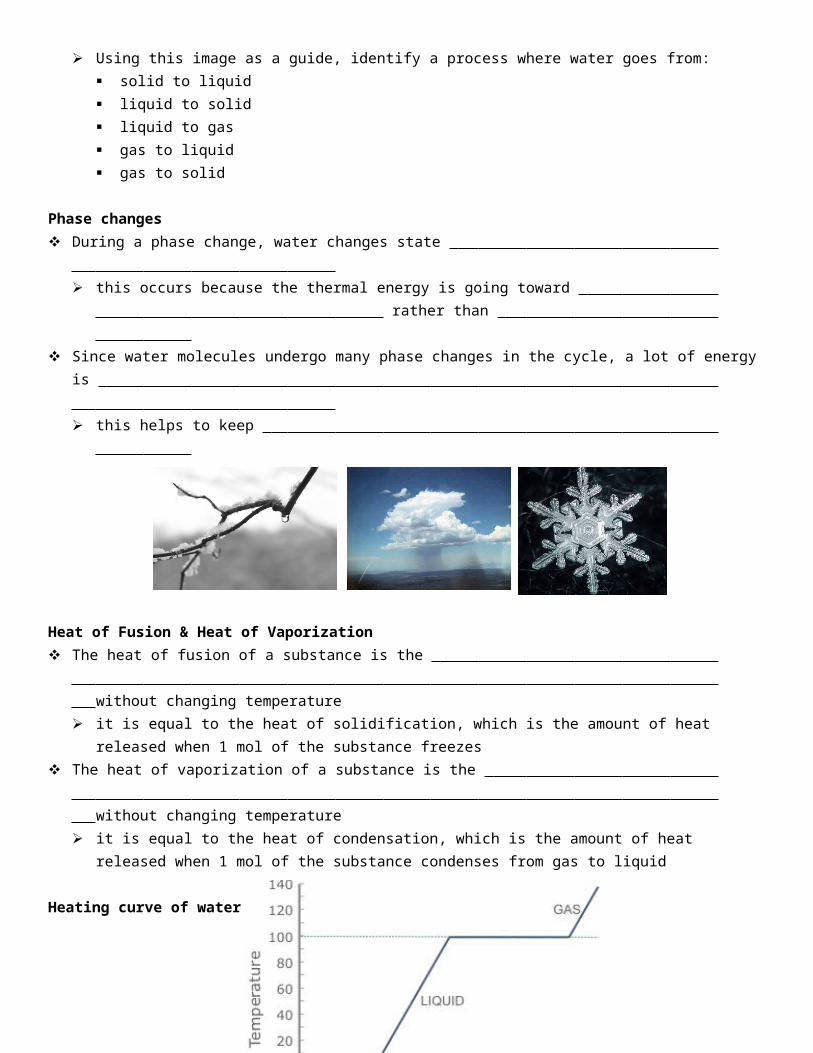
Heat of Fusion & Heat of Vaporization The heat of fusion of a substance is the
without changing temperature it is equal to the heat of solidification, which is the amount of heat released when 1 mol of the substance
freezes The heat of vaporization of a substance is the
without changing temperature it is equal to the heat of condensation, which is the amount of heat released when 1 mol of the substance
condenses from gas to liquid
Heating curve of water

Calculating the Heat of Fusion or Vaporization The amount of energy absorbed or released during a phase change can be calculated from the following two
formulas
H fus=Qn or H vap=
Qn
where Hfus = , or Hvap = Q = n =
Theoretical Heat of Fusion and Vaporation The theoretical Heat of Fusion of ice is 6.01 kJ/mol
that means it takes 6.01 kJ of thermal energy The theoretical Heat of Vaporization of water is 40.65 kJ/mol
that means it takes 40.65 kJ of thermal energy
Example: Calculate the amount of energy absorbed when 10.0 mol of ice at 0.0oC melts. The theoretical heat of fusion
of water is 6.01 kJ/molHfus = Q/nQ = Hfusn
= (6.01 kJ/mol)(10.0mol)= 60 kJ
Recall: calculating the number of moles Recall from the Chemistry unit, you can calculate the number of moles if the mass and molar mass of the
substance is known The formula is n = m/M
m = mass (in g) M = molar mass (in g/mol)
Example: In an experiment, it is found that when 150 g of water evaporates, 339 kJ of energy is absorbed. (Recall,
the molar mass of water is 18.02 g/mol). Determine the experimental heat of vaporization of water.
n = m = 150g = 8.32 molM 18.02 g/mol
Hvap = Q = 339 kJ = 40.7 kJ/mol

n 8.32 mol
Practice problems:1) When 8.70 kJ of thermal energy is added to 2.50 mol of liquid methanol, it vaporizes. Determine the heat of
vaporization of methanol.
2) If the theoretical heat of fusion of ice is 6.01 kJ/mol, how much thermal energy is required to melt a 100 g ice cube?
D2.4 - Biomes
Biomes a biome is a a description of a biome includes the typical range of the plants and animals that are
Biomes function as a system – a set of interconnected parts that may exchange energy and/or matter with the surroundings open systems – exchange
examples – the human body, a home, a fish tank, cells closed systems – exchange
examples – a sealed Tupperware container, the hydrosphere
a biome gets input energy from the sun, and loses energy through heat, or chemical energy to other biomes a biome exchanges matter such as air, water, and plants and animals with other biomes because they exchanges both energy and matter with the surroundings,
Earth’s biomes Different classification systems exist for biomes – some textbooks define as many as 20 different biomes In this course we classify the Earth according to SIX biomes

Canada’s Biomes
The six biomes Each biome has a typical range of temperature
& precipitation They can be plotted on a graph
deserts are rain forests are tundra are
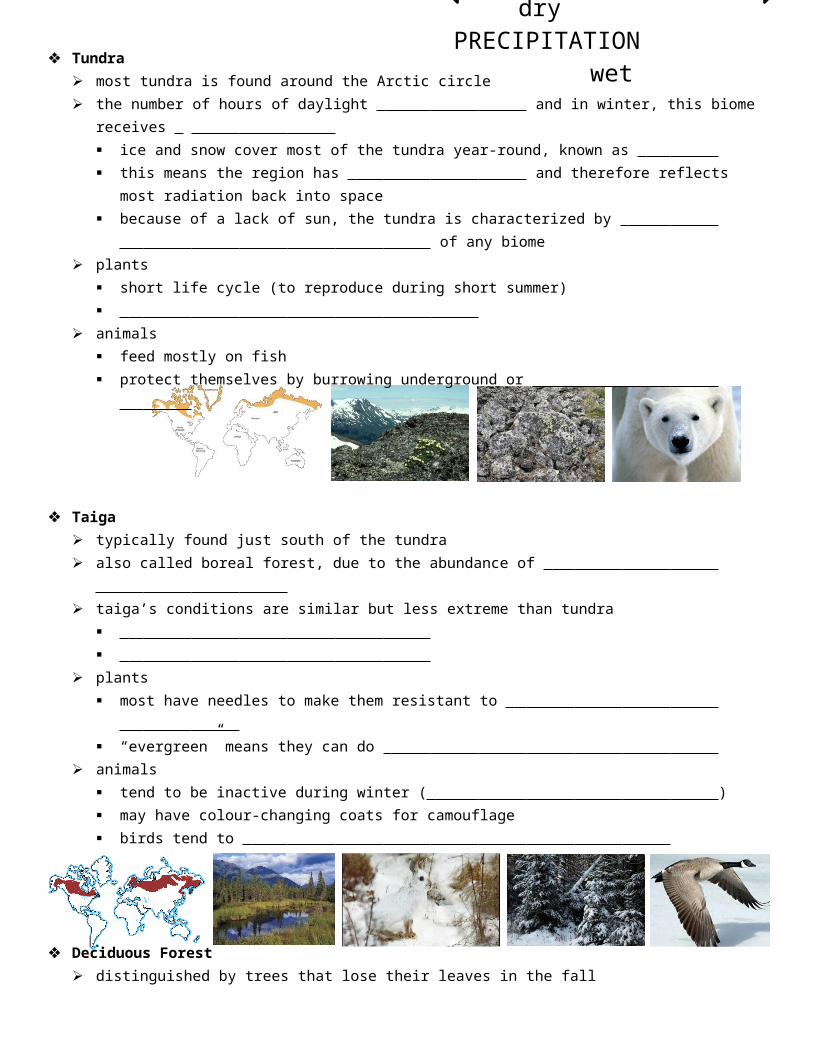
Tundra most tundra is found around the Arctic
circle the number of hours of daylight
and in winter, this biome receives ice and snow cover most of the tundra
year-round, known as this means the region has
and therefore reflects most radiation back into space
because of a lack of sun, the tundra is characterized by of any biome
plants short life cycle (to reproduce during short summer)
cold TEMPERATURE hot
dry PRECIPITATION wet
animals feed mostly on fish protect themselves by burrowing underground or
Taiga typically found just south of the tundra also called boreal forest, due to the abundance of
taiga’s conditions are similar but less extreme than tundra
plants most have needles to make them resistant to
“evergreen” means they can do
animals tend to be inactive during winter ( ) may have colour-changing coats for camouflage birds tend to
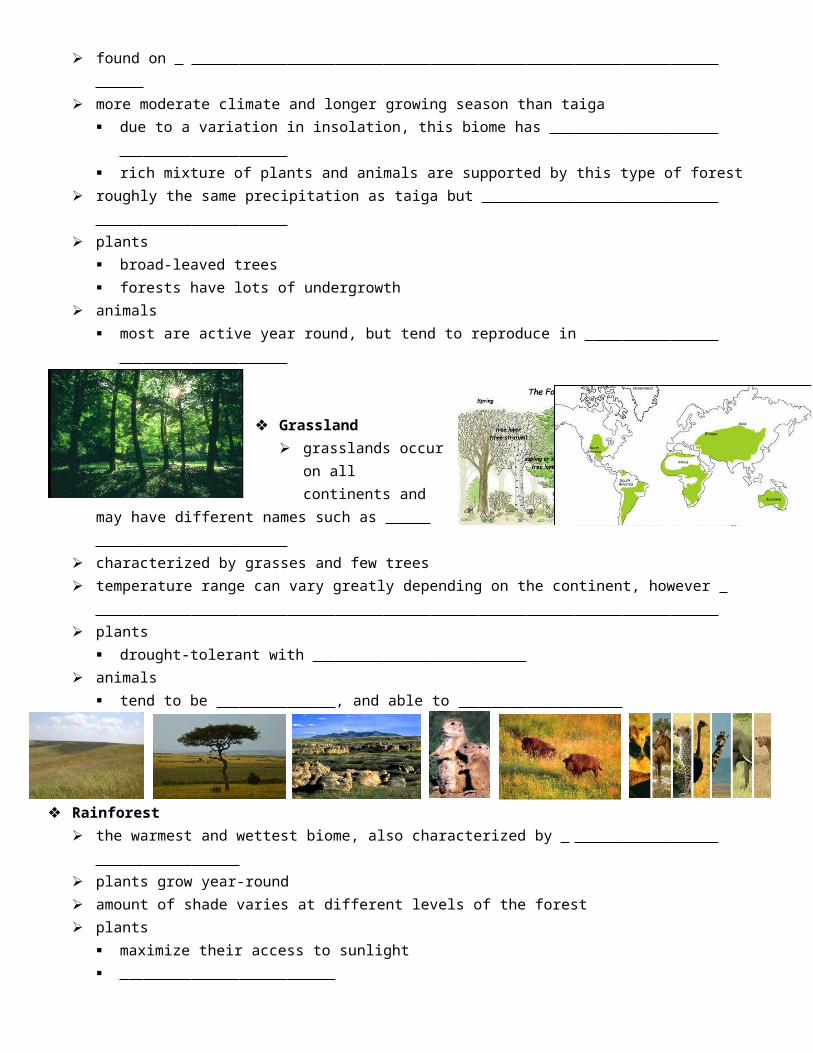
Deciduous Forest distinguished by trees that lose their leaves in the fall found on
more moderate climate and longer growing season than taiga
due to a variation in insolation, this biome has
rich mixture of plants and animals are supported by this type of forest roughly the same precipitation as taiga but
plants
broad-leaved trees forests have lots of undergrowth
animals most are active year round, but tend to reproduce in
Grassland

grasslands occur on all continents and may have different names such as
characterized by grasses and few trees temperature range can vary greatly depending on the continent, however
plants
drought-tolerant with animals
tend to be , and able to
Rainforest the warmest and wettest biome, also characterized by
plants grow year-round amount of shade varies at different levels of the forest plants
maximize their access to sunlight
animals active year-round adapted to a particular part / level of the rain forest
Desert like tundra, the dry conditions mean unlike tundra, deserts receive and are marked by
since there is a lack of water and plant life to hold the day’s heat, deserts tend to be
plants
cacti are adapted to
animals

tend to be
one concern about climate change is
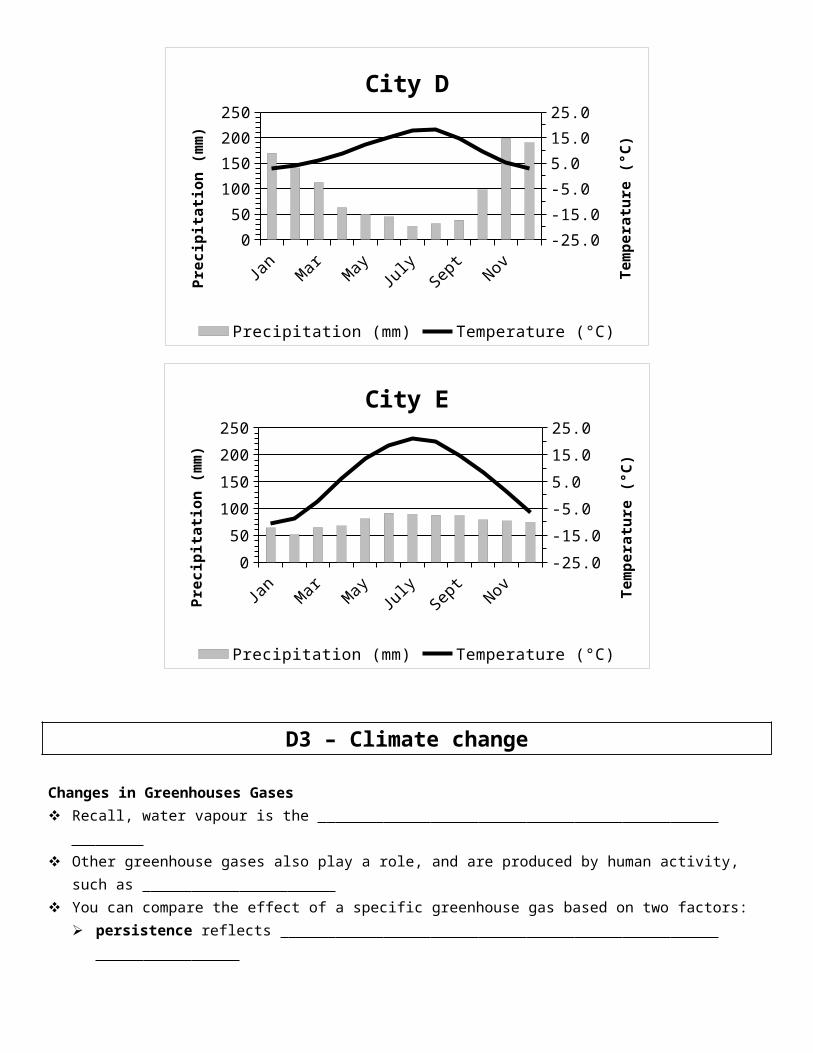
Climatographs Climatographs are summary graphs that describe
for a given region the horizontal axis is divided by month average precipitation is marked along the left vertical axis
and average temperatures are marked along the right vertical
axis and are
Uses of climatographs climatographs are most useful when they are used to
compare they can also help identify the factors that determine the
climate, such as insolation – mostly due to
patterns of global winds patterns of warm and cold ocean’s currents
you can also use climatographs to
Practice problem:1) Grasslands vary in plants and animals and
are located all over the world. What general trends do you notice in these grassland climatographs?
2) Below are five climatographs that represent five Canadian cities.a) Match each climatograph with the
biome it representsb) Which biome is not represented?
Match the biome with its city. The five cities are Ottawa, ON, Grande Prairie, AB, Whitehorse, YT, Nanaimo, BC and Calgary, AB

Jan
Feb Mar AprMay
June Ju
lyAug
Sept
OctNov Dec
0
50
100
150
200
250
-25.0
-15.0
-5.0
5.0
15.0
25.0
City A
Precipitation (mm) Temperature (°C)
Prec
ipita
tion
(mm
)
Tem
pera
ture
(°C)
Jan
Feb Mar AprMay
June Ju
lyAug
Sept
OctNov Dec
0
50
100
150
200
250
-25.0
-15.0
-5.0
5.0
15.0
25.0
City B
Precipitation (mm) Temperature (°C)
Prec
ipita
tion
(mm
)
Tem
pera
ture
(°C)
Jan
Feb Mar AprMay
June Ju
lyAug
Sept
OctNov Dec
050
100150200250
-25.0-15.0-5.05.015.025.0
City C
Precipitation (mm) Temperature (°C)
Prec
ipita
tion
(mm
)
Tem
pera
ture
(°C)
Jan
Feb Mar AprMay
June Ju
lyAug
Sept
OctNov Dec
0
50
100
150
200
250
-25.0
-15.0
-5.0
5.0
15.0
25.0
City D
Precipitation (mm) Temperature (°C)
Prec
ipita
tion
(mm
)
Tem
pera
ture
(°C)
Jan
Feb Mar AprMay
June Ju
lyAug
Sept
OctNov Dec
0
50
100
150
200
250
-25.0
-15.0
-5.0
5.0
15.0
25.0
City E
Precipitation (mm) Temperature (°C)
Prec
ipita
tion
(mm
)
Tem
pera
ture
(°C)
D3 – Climate change
Changes in Greenhouses Gases Recall, water vapour is the Other greenhouse gases also play a role, and are produced by human activity, such as You can compare the effect of a specific greenhouse gas based on two factors:
persistence reflects
the Global Warming Potential (GWP) of a gas represents its ability to
Gas GWP Persistence (years)
carbon dioxide (CO2)
methane (CH4)
nitrous oxide (N2O)
although water vapour plays the largest role in the greenhouse effect, it is
the greenhouse gases that we’re most concerned about, therefore, are especially
Measuring a change in greenhouse gases Evidence of increasing atmospheric CO2, N2O, and CH4 comes from a combination of
Carbon sinks & Carbon sourcesCARBON SINKS Any process that
The most significant carbon sink is
Other carbon sinks include: dissolving of CO2 in the ocean
CARBON SOURCES Any process that
The most significant carbon source is
Other carbon sources include:
weathering of rock decomposition of living organisms
Other sources Agriculture contributes to the greenhouse effect because
manure and fertilizers release livestock contribute

Halocarbons are man-made chemicals used in coolants though their chemical structure makes them ideal for use in
their ability to absorb thermal energy also makes them
one category of halocarbons, called CFCs, have a GWP of 12 000 (recall, this is
fortunately, CFCs have been banned worldwide since the 1980s, when it was discovered that they
Global Warming
The line at 0.0 represents the global average temperature between 1951 and 1980 From the graph, we can conclude that:
the start of this change in temperature coincides with
Political Collaboration on Climate Change The Montreal Protocol was an international agreement signed in 1987 by 182 nations
agreement was made to in products such as refrigerators and air conditioners
CFCs had been found to cause a
this agreement was

United Nations Framework Convention on Climate Change was an agreement to the UNFCCC was not an action plan – it set out a process for
, specifically that future plans (the meeting of
today’s needs without jeopardizing future generations’ ability to meet their needs)
Kyoto Protocol in 1998, 161 countries signed an agreement to
the countries agreed to reduce their emissions to 5% lower than they were in 1990, by 2012 countries could also earn “credits” toward their reduction by

contributing to a carbon sink (e.g. planting trees) Canada and Kyoto
pledging to reduce its emissions below 1990 levels meant that at the time of signing,
however, since we didn’t make any significant changes to our industry practices,
in 2010, Canada became the first nation to publicly
Impacts of Climate Change As a result of climate change, ecologists predict that we will see a
change to these maps illustrate the predicted changes:
the appearance of the reduction of the redistribution of
With the reduction of permafrost and snow cover, we will also see as open water reflects less radiation than ice, global warming is
Impacts on Alberta Some of the predicted consequences of global warming that will
directly affect our province are: an increase in the frequency and severity of ,
which could mean a an increase in an increased risk of a loss of an increase in ,
such as Lyme disease
Practice problem suggest two methods of reducing greenhouse gases in each economic sector below then, refer to page 429 of your textbook to fill in any actions you missed
Sector Actions
Transportation•
•
Energy•
•
Buildings /
infrastructure
•
•
Agriculture & Forestry•
•
Industry•
•
Practice problem With a partner, brainstorm
five steps the AVERAGE Canadian could take to reduce their carbon footprint
five steps that you YOURSELF could take to reduce your carbon footprint