Ÿолный текст... · web viewmobility in the labour market as the strategy of economic...
TRANSCRIPT

Mobility in the labour market as the strategy of economic activity in older age
O. Sinyavskaya, A. Ermolina, E. LyubushinaInstitute for Social Policy, National Research University Higher School of Economics
Introduction
In Russia, as in the majority of countries, the population is aging rapidly. For the last 10
years, the Russian population above employable age (55 and 60 years for women and men
correspondingly) has risen from 29.7 million (20.8% of the population in 2007) to 36.7 million
(25.0% of the population in 2017). According to the medium population forecast, the share of the
elderly will increase to 30% of the population by 2036 (43.8 million)1. This tendency challenges
health care and social security systems, pension provision as well as the labour market.
Meanwhile, the process of population ageing has already emerged in some spheres of
society. Not only is the Russian pension system experiencing growing numbers of pension
recipients as a result in its deficit, but also the labour market is recognizing the growing number
of employed pensioners. Right up to the beginning of 2016, the growing number of employable
pensioners has increased as well as its share in the total number of pensioners (15.3 million or
35.7% of the population)2. In the last two years these figures demonstrate negative dynamics (9.9
million or 22.9% at the beginning of 2017) due to the introduction of legislative restrictions on
pension indexation of employed pensioners (Sinyavskaya, Ermolina, 2017). At the same time,
our empirical calculations on RLMS3 (2016) show a slight decrease of the pensioners’
employment rate with a moderate growth of informal employment in the main place of work. In
other words, the changing of pension legislation has led to the decline of the number of
employed pensioners although this was compensated by transition of pensioners to informal
employment.
The majority of the elderly continue working at the same job as before becoming a
pensioner (Maleva, Sinyavskaya, 2007). Meanwhile, individuals of retirement and pre-retirement
ages often face the challenge of maintaining their job. In some cases, employers tend to hire
younger employees due to their modern knowledge and higher efficiency instead of older ones
(Bratsberg et al., 2003). Unlike most developed countries, in Russia working experience hardly
contributes to a higher wage in maturity (Kapeliushnikov, 2006). Thereby, one of the potential
strategies to maintain employment in older age may be changing job. On one hand, this transition
can be forced, because of impairing health, high work load, the pressure of bosses. On the other
1 http://www.gks.ru2 The same3 Russian Longitudinal Monitoring Survey – Higher School of Economics (RLMS)
1

hand, the elderly’s working experience may be in-demand, not at the current job but in the
related field.
This research aims to evaluate the influence of reaching pensionable age and either
continued employment or changing employer beyond pensionable age. We address the following
research questions: (1) what factors influence on job changing beyond pensionable age; (2)
whether, and to what extent this transition contributes to maintaining employment in old age. To
answer these questions, we construct two independent logistic regression models on the basis of
7 annual waves of the Russian Longitudinal Monitoring Survey – Higher School of Economics
(RLMS-HSE)4,5 (2010 – 2016).
Literature review
The types of labour mobility
Beginning in the middle of the last century, the phenomenon of labour mobility has been
examined in social and economic studies. Theoretical and empirical studies operate on plenty of
terms related to this research area. Tenure or specific tenure is the duration of employment at the
current job. Closely related to this, specific human capital reflects the expenditures on the
employment relationship (searching for a worker, training, etc.) that has no value outside of this
relationship (Farber, 1999). Clearly, the value of specific human capital rises with tenure.
As far as the employment relationship can be interrupted by ‘voluntary quits’ as well as
‘forced lay-offs’ many researchers separate quit rates and lay-off rates (Parsons, 1972; Farber,
1999). It makes sense because motivation and reasons of labour mobility in these two cases are
quite different.
The existing studies are based on two main approaches to define labour mobility. The
first approach represents the employees’ ability to change their job; the second one implies a real
change of job. Quantitative studies apply more often in the second approach because of its
simplicity of accountability (Maltseva, Roshchin, 2007).
Labour mobility can be classified by the similarity of previous and present jobs. Feldman
(2007) distinguishes career change, organization change and job change. He defines career
change as the transition to a new occupation that requires different from existing knowledge and
skills. Organization change means the transition to a new employer without change of
profession. Finally, job change refers to the transition to another position within organization,
but without change of profession.
4 https://www.hse.ru/en/rlms/5 http://www.cpc.unc.edu/projects/rlms-hse
2

We define labour mobility as the real change of job and/or profession during the last three
years. The separate proportions of those who changed their job and profession are rather small
for the analysis so they were merged. RLMS also contains the question about position change
within organization but these transitions can include promotions and demotions without
substantial changes of duty, formal renaming of positions, departments, that do not always mean
employees’ conform with management labour strategies.
Theoretical concepts of labour mobilityAs far as labour mobility characterizes the employment relationships, it depends not only
on employees’ behavior but also on employers’ policy, institutional norms, economic situation,
etc. Therefore, several theories explain the phenomenon of labour mobility.
According to human capital theory, long-term employment relationships contribute to
specific human capital accumulation by job training and experience. This capital is lost at ‘quits’
and ‘lay-offs’ that is unprofitable for employers as well as for employees, so long-term
employment relationships are preferable for both sides (Gimpelson, Kapeliushunikov,
Otshepkov, 2017). Specific human capital accumulates with age therefore labour mobility rates
decrease in older age groups.
Based on job-matching theory, labour mobility represents the process of searching for
optimal matching between an employee and their job place (Jovanovic, 1979; Flinn, 1986). The
main measure of this match is labour productivity influencing on the employee’s wage. With
age, and the number of job places the probability of optimal matching between employee and
their job place increases thus the rate of labour mobility is lower in older age (Gimpelson,
Kapeliushunikov, 2011).
The growing demand on production in prosperous sectors of the economy and, as a result,
the increasing wages in these sectors are the factors of labour mobility in the theory of demand-
side shocks (Jovanovic et al., 1990; Davis et al., 1995). Technological progress, the business
environment determines the requirements to workers so labour demand shifts from stagnant to
growing sectors of the economy.
On practice, labour mobility depends on the complex description of the above factors.
Firms are oriented on the economic situation and needs for staff. In particular, technology shock
and the reducing labour demand may lead to ‘lay-offs’ and labour mobility growth, but firms
interested in specific human capital will prefer to ‘lay off’ less senior workers because these
people embody less knowledge and experience (Farber, 1999).
Speaking about labour mobility in older age, one should not forget about its alternatives,
especially in a case of ‘forced lay-offs’ – early retirement, unemployment benefits, etc. Generous
3

unemployment insurance for the involuntary unemployed as well as the possibility to retire
earlier does not create incentives for labour mobility (Tatsiramos, 2010).
The theoretical explanation of labour mobility also lies in the field of an employee’s
characteristics that is largely confirmed in empirical studies. Blumen, Kogen & McCarthy (1955)
distinguishes two types of workers (high mobility and low mobility). The probability of job
change depends on its type or, in other words, the number of previous job changes. The
employee’s behavior is generated by their socio-demographic group characterizing various needs
and possibilities to realize these needs (Maltseva, 2007). For example, family workers and older
individuals tend to prefer stable home lives and community environments (Lee & Maurer, 1999,
Maltseva, 2007). Thus, as a rule, they change their job less often than their young and unmarried
colleagues, except cases when labour mobility is due to family circumstances (Kirchmeyer,
2006). Finally, the probability of labour mobility increases if the probability of getting a better
job is quite high and the transition costs to a new job is quite low (Maltseva, 2007).
The determinants of labour mobility in older ageThe existing theories of labour mobility mainly explain its decline in older age. Older
workers’ mobility is determined not only by their motivation to change job, but also by their
ability to do so in terms of their health, productivity, etc. (Feldman, 2007). In general, compared
to prime-age workers the elderly have lower probability to be re-employed (Ichino et al., 2007).
Feldman (2007) defines three groups of labour mobility factors: individual-, job- and
occupational-level ones. Searching for a new job in older age may be caused by growing
physical problems, cognitive deficits, although worsening health is one of the main constraints to
find an alternative job.
More educated workers, as a rule, have more stable employment relationships due to their
high specific and general human capital (Farber, 1999). Empirical studies on Russia show that
the employment stability rises with educational level (Nesterova, Sabirianova, 1999; Gimpelson,
Kapeliushunikov, Otshepkov, 2017). Highly educated and qualified workers do not tend to
change their job because they can lose out on salaries at a new job place (Maltseva, 2007). The
elderly’s unique competences, as well as their narrow professional specialization, contribute to
maintain their current job (Potekhina, Chizhov, 2016).
Gender differences in labour mobility are often mediated by other factors: sector of the
economy, profession, salary, etc. Nevertheless, empirical studies on Russia indicate that women
tend to have longer relationships with their employer than men (Maltseva, 2007; Gimpelson,
Kapeliushunikov, Otshepkov, 2017) although women benefit from labour mobility much more
than men (Maltseva, Roshchin, 2007).
4

Besides individual-level factors, Feldman (2007) also differentiates job- and
occupational-level factors. If job-level factors relate more to job characteristics (working
conditions, job satisfaction) then occupational-level factors correspond to the demand for labour
force in a profession due to technological progress.
The majority of studies on labour mobility focus on job-level factors: the sector of the
economy, the size and ownership of enterprise, salaries, job satisfaction, etc. The size of salary is
one of the most significant factors influencing on decision-making about labour mobility. In the
2000s’ the workers of Russian enterprises had a ‘penalty’ for specific human capital that
decreased their earnings by 0.7 – 1.6 % for each additional working year. This ‘penalty’ has been
gradually declining, and long-term employment relationships have had positive return since 2005
(Maltseva, 2009). In general, highly-paid workers are less likely to quit and, as result, have lower
labour mobility (Freeman, 1980; Morternsen, 1986). People are less inclined to change position
where they are dominant. The transition to other professions are mainly associated with higher
salary at a new job place (Maltseva, 2005). At the same time, the elderly’s financial resources
may promote them to change their career despite the financial uncertainty associated with doing
so (Doeringer, 1990; Feldman, 1994). Besides personal financial resources the elderly’s behavior
on the labour market is substantially determined by material well-being of their family. Family
income per capita is also the factor of labour mobility in older age (Maltseva, Roshchin, 2007).
In older age it can be more preferable to leave a highly stressful job and find a more
personally pleasant one (Feldman, Leana & Bolino, 2002). The elderly prefer to increase their
time with families and friends, so full-time work pushes out the present job (Johnson, 2011). In
general, low job satisfaction leads to ‘quits’ and contributes to labour mobility (Boeckerman &
Ilmakunnas, 2007). Workers dissatisfied with their jobs tend to search for an alternative job that
significantly influences on real job change (Cornelissen, 2006).
In Russia substantial differences in labour mobility are observed between state and
private enterprise. Private enterprise largely depends on the economic situation and market
demand, therefore they usually have higher labour turnover than state enterprises. The workers
of private enterprises change their jobs twice as often as their peers in state enterprises
(Maltseva, 2009). In addition, labour mobility is higher among the workers of small and
microenterprises (Gimpelson, Kapeliushunikov, Otshepkov, 2017). In large enterprises workers
may have a narrow specialization so their specific human capital has more value than in small
enterprises (Maltseva, 2009). Lower labour mobility and high tenure are typical for agriculture,
education, health care, army (Gimpelson, Kapeliushunikov, Otshepkov, 2017).
HypothesizesBased on the previous studies, we hypothesize that:
5

(1) A higher educational level contributes to maintain the current job in old age.
(2) Specific tenure is negatively associated with labour mobility.
(3) The workers of state enterprises, large enterprises, budget sectors of economy
(education, health care, etc.) are less likely to change their jobs.
(4) Early retirees may seek new jobs due to impaired health, high work load, and
decline in labour productivity.
(5) Higher salary and job satisfaction decrease the probability of job change.
Data & Methodology
The research is based on 7 annual waves of the Russian Longitudinal Monitoring Survey
(RLMS-HSE) conducted from 2010 to 2016.
Our sample consists of three 5-years panels (2010-2014, 2011-2015, 2012-2016), where
the first year corresponds to the initial point of observation t0, the next three years – intermediate
point t1, the fifth year – final point t2 (Table 1). We select individuals aged 45 years and over in t0
who will be working pensioners in t1.3. Thus, this contains the individuals retired in the statutory
retirement age5 as well as early retirees.
The sample includes 2,069 individuals (598 men and 1,471 women). The selection of
observations led to unequal shares of men and women, but working with panel data is possible
without additional weighting by taking into account the attrition of the respondents from the
panels.
Table 1 – Sampling scheme
Wave Initial point,t0
Intermediate point,t1
Final point, t2
1 2010 2011-2012-2013 20142 2011 2012-2013-2014 20153 2012 2013-2014-2015 2016
We estimate two independent logistic regressions where the dependent variables are as
follows:
1) The fact of changing/getting a job (profession) at least once in a three-year period
t1 (1 – yes / 0 – no).
2) The pensioner’s employment status in the year t2 (1– employed / 0 – unemployed).
The independent variables of the first and the second equations were measured in t0 and
t1.3 correspondingly. These variables are grouped into three categories:
5 55 and 60 years for women and men correspondingly6

1) Characteristics of the job place: sector of the economy, professional group, formal
/ informal employment, length of a working-day, length of specific tenure, type of enterprise
ownership, enterprise size.
2) Job satisfaction and erosion of workers’ rights: satisfaction with working
conditions, wage, opportunities for professional growth, work in general, employer's monetary
debt to the employee, reduction of wage and hours of work, enforced unpaid leave.
3) Economic factors: pensioner’s salary in comparison with the minimum wage in
the corresponding year.
We also control for socio-demographic factors: gender, age, type of settlement, the
elderly’s education and health, disability, entitlement period for early retirement, marital status.
In the second equation, the fact that job (profession) changing/getting was also included.
Regression models were constructed in several ways: for all respondents/by gender; with
testing the sector of economy/professional groups. As far as general job satisfaction correlates
with satisfaction with some aspects of job and erosion of workers’ rights we also separate models
(1) with job characteristics without including job satisfaction in general and (2) only controlling
for job satisfaction in general.
Main trends in labour mobility in Russia
The previous studies on labour mobility in Russia indicate its decline in the 2000s’ in
comparison with the 1990s’. After the collapse of the USSR, 42% of employed people changed
their profession (Sabirianova, 2002). In the 1990s’, almost every second employee quit or got a
job annually (Обзор занятости в России, 2002). The explanation of higher labour mobility rates
in this period in comparison with the previous and the following ones is the structural changes of
the economy in the 1990s’ caused by mass occupational reallocation. The existing jobs were
being destroyed, the new ones being created (Sabirianova, 2002).
More recent studies show that employers changed 18% of working-age employees
annually in 2000 – 2005 (Maltseva, 2007). Taking into account that labour mobility rates
decrease with age, this figure for the whole employed population, including pensioners, might be
lower.
The length of specific tenure demonstrates the opposite dynamics over the period 1994 –
2005. In 1994, the most common employment relationships were 10 – 20 years (more than 20%
of the employed) while in 2005 the highest proportion of employed were in the group less than 1
year (more than 25% of the employed). This tendency can be partly explained by extension of
the private sector in the Russian economy characterized by less sustainable development and
stable labour relationships (Maltseva, 2007).7

The Federal State Statistics Service (Rosstat)6 contains rather limited data on labour
mobility. The indicator of specific tenure is available for the employed population without an age
gap.
For the period 2010 to 2016 the proportion of employed with the longest specific tenure
has slightly increased by reducing the proportion of ones with specific tenure less than 5 years
(Figure 1).
2010 2011 2012 2013 2014 2015 20151.2 1.1 1.0 1.1 0.9 0.9 0.8
10.2 10.1 10.2 9.9 9.0 8.5 8.3
15.7 15.7 15.4 15.8 15.5 15.2 14.6
15.4 15.2 14.2 14.4 14.8 14.8 14.6
22.9 23.4 24.7 24.1 23.9 24.7 25.6
34.6 34.5 34.5 34.8 35.8 35.9 36.2
10 years and more5 - 10 years3 - 5 years1 - 3 years1 month - 1 yearLess 1 month
Figure 1 – Structure of the employed by length of specific tenure, by percentage of people
Source: Rosstat 2010-2016
Rosstat also contains the number of employees who quit / got a job. In 2013, before the
economic crisis of 2013 – 2014, the coefficient of labour turnover (the ratio of the number who
quit, and the newly employed, to the average number of employed) reached the highest level and
then steadily declined (Figure 2).
2010 2011 2012 2013 2014 2015 20160.2450.2500.2550.2600.2650.2700.2750.2800.2850.290
0.2760.280
0.274
0.286
0.279
0.265
0.259
Figure 2 – Dynamics of the coefficient of labour turnover
Source: Rosstat 2010-2016
6 Rosstat: http://www.gks.ru/wps/wcm/connect/rosstat_main/rosstat/en/main/8

We calculated the dynamics of specific tenure of the employed at the age of 45 years and
over and compare it with the whole employed population. Obviously, the distribution of specific
tenure for the older age groups shifts towards more durable employment relationships. Despite
these differences, the dynamics of specific tenure of the employed aged 45 years and over, and
the whole of the employed population in 2010 – 2016 was similar. The calculations based on
RLMS (Figure 3), as well as Rosstat data (Figure 1), indicate the increasing share of employed
with long specific tenure. The proportion of employed with 6 or more years of specific tenure
rose in both analyzed groups. The proportion of the employed with more than 20 years of
specific tenure only rose in the group of ‘all ages’ employed population. Short-term employment
relations with specific tenure less than 1 year were more common for both analyzed groups in
2012 and 2014. This is also consistent with the coefficient of labour turnover, which had peaks
in previous years – 2011 and 2013.
2010 2011 2012 2013 2014 2015 2016
15.8 16.0 17.9 16.3 16.8 14.3 14.6
21.5 21.5 20.6 19.8 20.9 20.8 19.5
20.6 19.6 19.0 20.8 19.0 20.3 19.9
17.5 18.0 17.4 16.9 17.8 18.3 18.5
14.5 15.4 15.4 15.9 15.4 15.6 16.9 10.2 9.5 9.7 10.2 10.1 10.6 10.6
More 20 years11-20 years6-10 years3-5 years1-2 yearsLess 1 year
Empl
oyed
, %
(a)
2010 2011 2012 2013 2014 2015 20169.3 10.1 10.6 9.9 11.1 9.1 9.5
15.3 14.4 14.5 13.5 14.2 14.8 13.5
16.6 15.6 15.5 17.2 14.7 16.0 15.1
18.4 18.7 17.4 17.1 17.8 17.9 17.7
17.9 19.8 20.4 20.5 20.9 20.0 21.8
22.6 21.3 21.5 21.9 21.2 22.3 22.4More 20 years11-20 years6-10 years3-5 years1-2 yearsLess 1 yearEm
ploy
ed o
f 45
year
s an
d ov
er, %
(b)
Figure 3 – Structure of ‘all ages’ employed population (a) and the employed of 45 years
and over (b) by the length of specific tenure
Source: RLMS 2010-2016
Results
Due to our research based on two independent logistic regression models, we separated
the obtained results in two sections: (1) the factors of the elderly’s labour mobility and (2) the
9

elderly’s labour mobility and other factors of employment in older age. Because of
multicollinearity of general job satisfaction and satisfaction with particular aspects of the job, we
include these variables into the models separately. Besides, in order to provide a sufficient
number of observations in each group of categorical variables we separate the models by the
sectors of the economy and professions. Finally, considering an adequate proportion of men and
women in our sample we separated our models by gender as well. The description of the results
follows the above mentioned order.
Factors of the elderly’s labour mobility (the first equation)
According to all constructed models, the probability of changing job reduces with age
that corresponds to theoretical and empirical studies on Russia as well as other countries. In
comparison with towns, the elderly are more likely to change their job in regional centers and/or
urban villages depending on the model specification. The determinants of labour mobility in
cities and small settlements are probably quite different but we do not focus on these differences
in this study.
The human capital parameters – self-evaluation of health, disability status and
educational level – do not have significant impact on the elderly’s labour mobility. On the one
hand, poor health may push the elderly to find a less stressful job, on the other hand, better health
allows them to look for a new job, thus the total effect of health on labour mobility can be
insignificant. The insignificance of the elderly’s educational level on their labour mobility seems
somewhat contrary to the previous studies on labour mobility in Russia. However, if we look at
specific tenure this is significant in all models both as continuous and categorical variable7
(Table 2). Compared to the specific tenure less than 1 year, the maintenance of current
employment relationships from 1-2 years to more than 20 years reduces the probability of the
elderly’s labour mobility on average by 32.4% - 45.8%. It means that the elderly’s educational
level does not determines their propensity to change job but the elderly’s experience at the
current place of work does.
The probability of job change is higher in private enterprise (compared to state one, the
average marginal effect is 9.2% depending on the model specification) and in construction,
transportation /communication (by 15.3 – 18.5% and by 14.2 – 16.6% in comparison with the
social sector). These results are quite similar to those examined in the Literature review. At the
same time, according to our models, the elderly’s labour mobility does not depend on the
enterprise size (Table 2). In some model specifications formal employment decreases the
probability of job change approximately by 10.3%. The formal nature of the employment
7 Continuous variable is measured as the number of years of specific tenure; categorical variable includes the following categories: less than 1 year, 1-2 years, 3-5 years, 6-10 years, 11-20 years, more than 20 years
10

relationship is characterized by wider social guarantees, therefore it becomes more preferable for
the elderly. Moreover, the majority of the elderly willing to change their job may rely mainly on
informal employment (Kolosnitsyna & Gerasimenko, 2014). Thus, the Russian elderly tend to
maintain formal employment relationships.
In all models for the whole sample, salaries related to minimal regional wages (MRW) do
not have significant impact on the probability of the elderly’s job change. On the one hand,
labour mobility is often associated with the possibility to get higher salaries at a new place of
work (Maltseva, 2005). On the other hand, job change involves some financial risks related to
future earnings, therefore the more well-off elderly, may afford such a risk (Doeringer, 1990;
Feldman, 1994). Thus, the mixed influence of the size of salary on labour mobility could lead to
its insignificance in the models. Furthermore, non-material aspects of job may play a more
substantial role in the elderly’s employment. To reinforce this, general job satisfaction as well as
its particular aspects is significant in our models. Complete satisfaction with working conditions
reduces the probability of the elderly’s labour mobility by 12.2% in comparison with the
situation of complete dissatisfaction (Table 2).
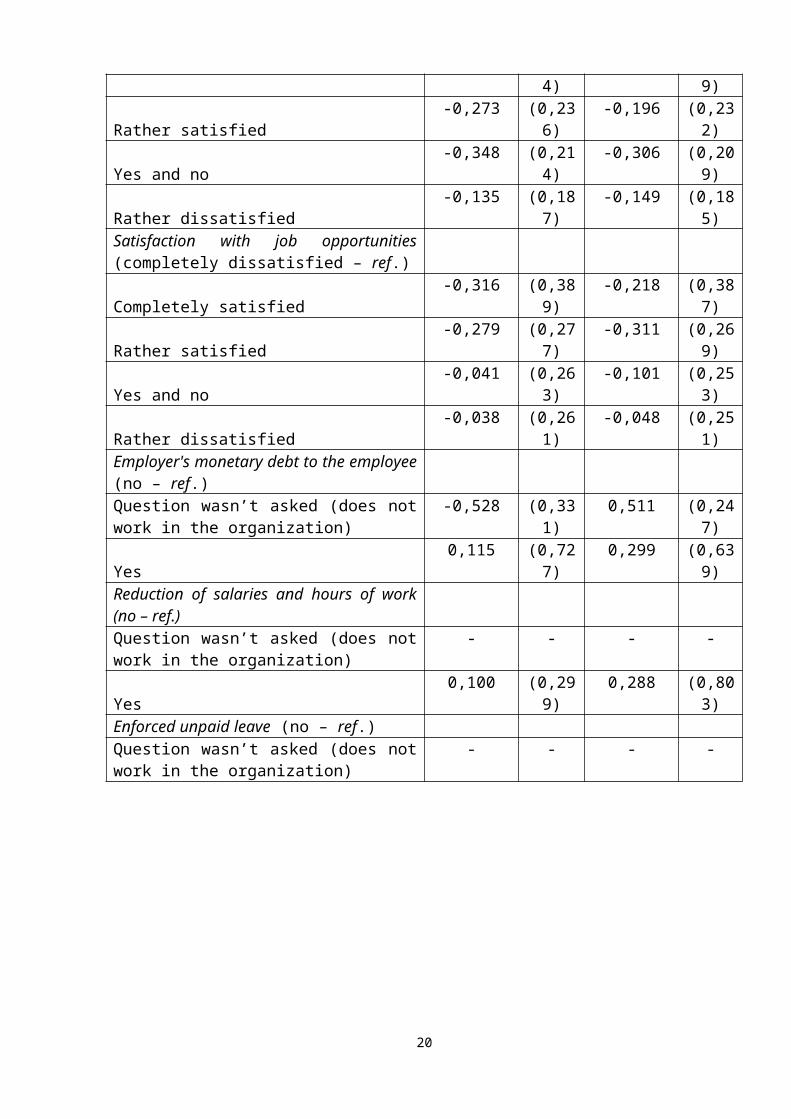
Table 2 – Logistic regression of job change with testing the sectors of the economy, the
whole sample (is not gender specific)
VariableModel 1.1 Model 1.2
Coef. Std. Err.
Coef. Std. Err.
Sector of the economy (social sector – ref.)Industry 0,127 (0,285) 0,169 (0,287)Army, civil service 0,318 (0,326) 0,345 (0,309)Construction 0,955* (0,389) 0,939* (0,368)Transportation, communication 0,896** (0,333) 0,945** (0,333)Agriculture 0,124 (0,565) 0,186 (0,541)Commerce 0,453 (0,311) 0,408 (0,307)Housing and communal services 0,051 (0,371) 0,018 (0,348)Other -0,561 (0,519) -0,329 (0,453)Formal employment (informal – ref.)Formal employment -0,526 (0,367) -0,627* (0,344)Length of a working-day (part-time – ref.)Full-time job (more 35 hours a week) -0,066 (0,245) -0,051 (0,239)Length of specific tenure (< 1 year – ref.)1-2 years -1,539*** (0,239)3-5 years -1,833*** (0,269)
11

Table 2 (continued)
6-10 years -1,827*** (0,261)11-20 years -2,272*** (0,269)> 20 years -2,471*** (0,277)Length of specific tenure (continuous) -0,045*** (0,008)Enterprise size (microenterprise (<15 workers) – ref.)Small enterprise (16-100 workers) 0,086 (0,236) 0,594 (0,236)Medium-size enterprise (101-250 workers) -0,119 (0,321) -0,187 (0,313)Large enterprise (> 250 workers) -0,046 (0,298) -0,039 (0,293)No answer 0,059 (0,229) 0,125 (0,227)Question wasn’t asked (does not work in the organization)
- - - -
Enterprise ownership (state ownership – ref.)Private ownership 0,579** (0,218) 0,569** (0,212)Mixed ownership 0,3327 (0,342) 0,322 (0,329)No answer -0,050 (0,345) -0,061 (0,349)Satisfaction with working conditions (completely dissatisfied – ref.)Completely satisfied -0,732* (0,399) -0,827* (0,391)Rather satisfied -0,466 (0,347) -0,523 (0,329)Yes and no -0,093 (0,349) -0,119 (0,331)Rather dissatisfied 0,096 (0,332) 0,035 (0,317)Satisfaction with salaries (completely dissatisfied – ref.)Completely satisfied 0,618 (0,394) 0,517 (0,399)Rather satisfied -0,273 (0,236) -0,196 (0,232)Yes and no -0,348 (0,214) -0,306 (0,209)Rather dissatisfied -0,135 (0,187) -0,149 (0,185)Satisfaction with job opportunities (completely dissatisfied – ref.)Completely satisfied -0,316 (0,389) -0,218 (0,387)Rather satisfied -0,279 (0,277) -0,311 (0,269)Yes and no -0,041 (0,263) -0,101 (0,253)Rather dissatisfied -0,038 (0,261) -0,048 (0,251)Employer's monetary debt to the employee (no – ref.)Question wasn’t asked (does not work in the organization)
-0,528 (0,331) 0,511 (0,247)
Yes 0,115 (0,727) 0,299 (0,639)Reduction of salaries and hours of work (no – ref.)Question wasn’t asked (does not work in the organization)
- - - -
Yes 0,100 (0,299) 0,288 (0,803)Enforced unpaid leave (no – ref.)Question wasn’t asked (does not work in the organization)
- - - -
12
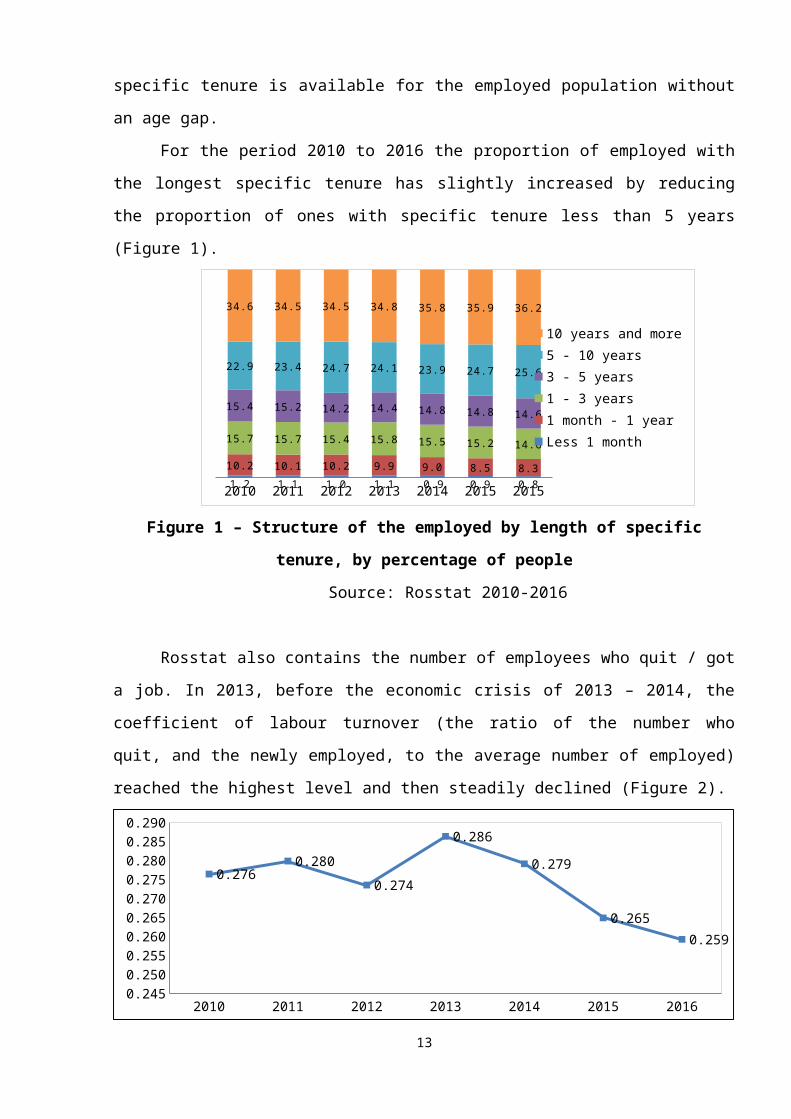
Table 2 (continued)
Yes 0,296 (0,424) 0,314 (0,399)The ratio of pensioner’s salary to minimal wage (5-6 MVR – ref.)Satisfaction with work in general (completely dissatisfied – ref.)Completely satisfied -0,989** (0,370) -1,024** (0,373)Rather satisfied -1,007** (0,342) -1,033** (0,345)Yes and no -0,543 (0,341) -0,554 (0,343)Rather dissatisfied -0,632* (0,353) -0,651 (0,351)<1 MRW 0,356 (0,414) 0,416 (0,404)1-2 MRW 0,209 (0,330) 0,254 (0,319)2-3 MRW 0,017 (0,323) 0,081 (0,313)3-4 MRW 0,281 (0,319) 0,289 (0,309)4-5 MRW 0,151 (0,345) 0,085 (0,335)5-6 MRW 0,353 (0,371) 0,307 (0,371)Significance: *** p ≤ 0.001, ** p ≤ 0.01, * p ≤ 0.1Control variables: gender, age, type of settlement, the elderly’s education and health, disability, entitlement period for early retirement, marital status
This is not presented in the tables but professional groups such as: skilled workers of
agriculture, forestry and fish farming, unskilled workers of all sectors – are less likely to change
their job in comparison with skilled labour workers engaged in manual labour and using
machines and mechanisms (the average marginal effect equals 7.8%).
Unlike the discussed above models, the low level of education significantly reduces the
probability of labour mobility for men. Type of the enterprise ownership plays a role only for
labour mobility of women (Table 3). Complete satisfaction with working conditions reduces the
probability of job changing on the average by 14.4% and 9.7% for men and women
correspondingly in comparison with complete dissatisfaction (model 2.1 in Table 3). The
unexplained result about the positive impact of complete satisfaction with wage on the elderly’s
labour activity remains significant only for men (model 2.1 in Table 3). Finally, general job
satisfaction is significant only for women (model 2.2 in Table 3).
Models with professional groups and general job satisfaction show that the probability of
job change among men is higher for middle-level specialists, officials, employees of office and
customer service, among women – for the group of military, legislators, high-level officials, top
and middle managers.
13

Table 3 – Logistic regression of job change with testing the sectors of the economy, by gender
VariableModel 2.1 Model 2.2
Men Women Men WomenCoef. Std. Err. Coef. Std. Err. Coef. Std. Err. Coef. Std. Err.
Sector of the economy (social sector – ref.)Industry 0,413 (0,510) 0,100 (0,353) 0,484 (0,510) 0,203 (0,360)Army, civil service 0,575 (0,673) 0,302 (0,403) 0,583 (0,643) 0,282 (0,393)Construction 1,369* (0,620) -0,369 (0,676) 1,526* (0,598) -0,058 (0,689)Transportation, communication 1,415* (0,595) 0,539 (0,461) 1,434* (0,590) 0,576 (0,449)Agriculture -1,489 (1,170) 0,931 (0,611) -1,482 (1,170) 0,930 (0,587)Commerce 0,635 (0,759) 0,300 (0,351) 0,692 (0,730) 0,320 (0,350)Housing and communal services 0,286 (0,714) 0,020 (0,466) 0,289 (0,694) 0,107 (0,429)Other -1,510 (1,242) -0,238 (0,523) -1,264 (1,161) -0,254 (0,515)Length of specific tenure (< 1 year – ref.)1-2 years -1,063* (0,454) -1,962*** (0,327) -1,164** (0,431) -1,912*** (0,317)3-5 years -2,590*** (0,525) -1,665*** (0,344) -2,555*** (0,502) -1,575*** (0,338)6-10 years -2,216*** (0,486) -1,815*** (0,345) -2,057*** (0,467) -1,778*** (0,332)11-20 years -26684*** (0,538) -2,291*** (0,354) -2,543*** (0,506) -2,204*** (0,336)> 20 years -2,833*** (0,587) -2,464*** (0,335) -2,708*** (0,548) -2,379*** (0,329)Enterprise ownership (state ownership – ref.)Private ownership 0,567 (0,356) 0,657* (0,285) 0,474 (0,327) 0,634* (0,279)Mixed ownership 0,079 (0,507) 0,365 (0,472) -0,063 (0,536) 0,329 (0,462)No answer 0,021 (0,575) -0,121 (0,471) -0,069 (0,586) -0,129 (0,486)Satisfaction with working conditions (dissatisfied – ref.)Completely satisfied -0,953* (0,531) -0,781* (0,383)Rather satisfied -0,935* (0,443) -0,368 (0,256)
14

Table 3 (continued)
Yes and no -0,584 (0,445) 0,006 (0,242)Satisfaction with salaries (completely dissatisfied – ref.)Completely satisfied 1,484* (0,598) 0,196 (0,503)Rather satisfied -0,240 (0,416) -0,383 (0,295)Yes and no 0,009 (0,409) -0,626* (0,274)Rather dissatisfied 0,187 (0,392) -0,315 (0,223)Satisfaction with work in general (dissatisfied – ref.)Completely satisfied -0,167 (0,489) -0,718* (0,303)Rather satisfied -0,564 (0,392) -0,509* (0,242)Yes and no 0,148 (0,405) -0,070 (0,254)Significance: *** p ≤ 0.001, ** p ≤ 0.01, * p ≤ 0.1Control variables: gender, age, type of settlement, the elderly’s education and health, disability, entitlement period for early retirement, marital status, formal / employment, length of a working-day, enterprise size, satisfaction with job opportunities, employer's monetary debt to the employee, reduction of salary and hours of work, enforced unpaid leave, ratio of pensioner’s salary to minimal wage
15

The elderly’s labour mobility and other factors of employment in older age (the second equation)
As in the case of labour mobility, the probability to maintain the employment decreases
with age. The elderly’s poor and very poor health (self-evaluation) also impedes their
employment that corresponds to the existing studies on the elderly’s employment in Russia and
other countries (OECD, 1998; Sinyavskaya, 2005; Kovrova, 2007; Góra et al., 2010 and many
others). The type of settlement is insignificant in the majority of models specifications.
Educational level seems to be a significant determinant of the elderly’s employment
(OECD, 1998; Levin, 2015) but none of our models has showed its significance. At the same
time, the longer the duration of the current employment relationships is, the higher the
probability to maintain the employment in older age. In other words, specific capital plays a
more important role in maintaining the employment in older age that educational level.
Working in the industry, construction, transportation and communication, agriculture and
commerce reduces the probability of continuing employment: on the average by 7.4%, 13.9%,
11.2%, 11.4% and 6.8% respectively compared to working in the social sector (Table 4). Low
salaries (less than 1 MRW, 1-2 MRW, 2-3 MRW) compared with the highest salaries (more 6
MRW) reduce the probability to maintain employment after retirement on the average by 6.9 –
13.5% depending on the size of salary and the model specification.
Working in the army and civil services has the positive influence on older men’s
employment but does the negative impact on older women’s employment. Positive influence on
the employment of men is provided by belonging to the group of specialists of the higher
qualification level. Employment in large enterprises (more than 250 people) as well as mixed
ownership of the enterprise contributes only to men’s employment in older age. For women, full-
time job is associated with maintaining of their employment.
Men who have changed their job during the previous three years are more likely to
maintain their employment. It means that labour mobility can be considered as an active strategy
of older men in the labour market. According to our models, women’s decision to continue
working depends on their satisfaction with job in general as well as with working conditions
while men’s one does not. The employer’s monetary debt to the employee has a significant
negative impact only on men’s employment. At the same time, the size of salary related to
minimal regional wage is more sensitive to women’s rather than men’s employment. Thus,
women pay more attention on the size of salary; they are ready to continue working if they
satisfy with their job. Men have a motivation to continue working in case of quite high salary (2-
3 minimal regional wages) and if their earnings are stable.
16

Table 4 – Logistic regression of pensioners’ employment with testing the sectors of the economy, by gender
Variable
Model 3.1 Model 3.2
Men Women Men WomenCoef. Std. Err. Coef. Std. Err. Coef. Std. Err. Coef. Std. Err.
Sector of the economy (social sector – ref.)Industry -0,380 (0,485) -0,077 (0,372) -0,489 (0,455) -0,191 (0,366)Army, civil service 1,053* (0,575) -0,831* (0,333) 0,905* (0,547) -0,825* (0,338)Construction -0,540 (0,532) -1,285* (0,566) -0,815 (0,499) -1,300* (0,547)Transportation, communication 0,266 (0,601) -1,297*** (0,346) 0,219 (0,571) -1,303*** (0,334)Agriculture -0,253 (0,711) -1,163* (0,496) -0,361 (0,662) -1,327** (0,476)Commerce -0,147 (0,638) -0,439 (0,331) -0,390 (0,606) -0,465 (0,334)Housing and communal services 0,589 (0,590) -0,340 (0,473) 0,501 (0,608) -0,276 (0,474)Other 2,131* (0,864) -0,605 (0,399) 2,149* (1,126) -0,612 (0,400)Formal employment (informal – ref.)Formal employment -0,033 (0,574) 0,589 (0,395) -0,064 (0,578) 0,550 (0,389)Length of a working-day (part-time – ref.)Full-time job (more 35 hours a week) -0,261 (0,514) 0,452* (0,231) -0,198 (0,475) 0,444* (0,223)Length of specific tenure (< 1 year – ref.)1-2 years -0,002 (0,549) 0,440 (0,384) -0,002 (0,501) 0,419 (0,376)3-5 years 0,366 (0,560) 0,585 (0,425) 0,484 (0,535) 0,516 (0,415)6-10 years 1,042* (0,577) 0,373 (0,414) 1,096* (0,550) 0,276 (0,406)11-20 years 0,793 (0,546) 0,671 (0,411) 0,871* (0,520) 0,552 (0,399)> 20 years 1,554* (0,601) 0,849* (0,418) 1,567** (0,590) 0,742* (0,411)Enterprise size (microenterprise (<15 workers) – ref.)Small enterprise (16-100 workers) 0,659 (0,498) -0,051 (0,264) 0,737* (0,452) -0,066 (0,262)Medium-size enterprise (101-250 workers) 0,327 (0,569) 0,425 (0,413) 0,537 (0,533) 0,333 (0,391)Large enterprise (> 250 workers) 1,161* (0,589) 0,302 (0,413) 1,256* (0,555) 0,392 (0,402)
17
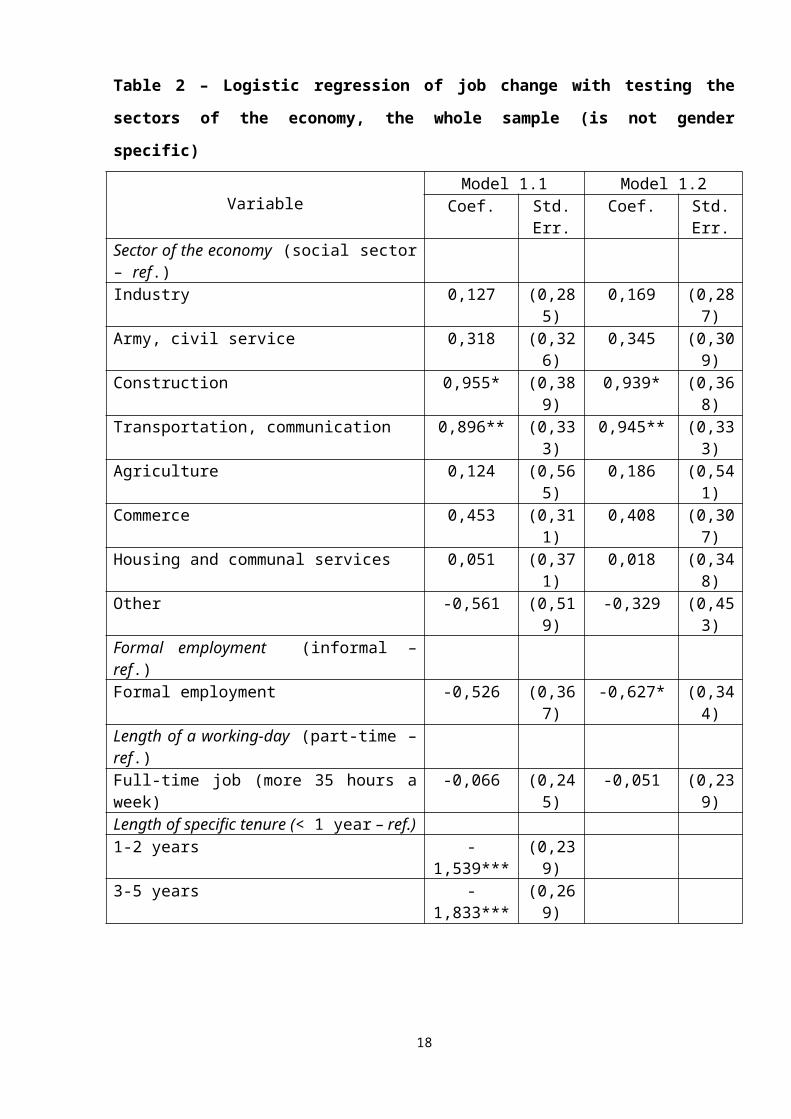
Table 4 (continued)
No answer 0,643 (0,497) -0,138 (0,275) 0,690 (0,440) -0,114 (0,271)Question wasn’t asked (does not work in the organization) - - - - 0,408 (0,985) 0,392 (0,643)Enterprise ownership (state ownership – ref.)Private ownership 0,321 (0,349) 0,123 (0,282) 0,353 (0,323) 0,158 (0,285)Mixed ownership 1,522* (0,662) -0,150 (0,446) 1,467* (0,600) -0,133 (0,445)No answer -0,002 (0,719) -0,600 (0,487) 0,125 (0,690) -0,507 (0,482)Satisfaction with working conditions (dissatisfied – ref.)Completely satisfied 0,377 (0,589) 0,440 (0,405)Rather satisfied 0,170 (0,400) 0,783** (0,296)Yes and no -0,086 (0,436) 0,712* (0,319)Satisfaction with salaries (completely dissatisfied – ref.)Completely satisfied 0,226 (0,653) -0,194 (0,503)Rather satisfied -0,223 (0,421) -0,375 (0,341)Yes and no 0,016 (0,393) -0,478 (0,332)Rather dissatisfied 0,423 (0,410) -0,186 (0,311)Satisfaction with job opportunities (completely dissatisfied – ref.)Completely satisfied -0,619 (0,617) 0,288 (0,483)Rather satisfied 0,189 (0,543) -0,531 (0,359)Yes and no -0,563 (0,496) -0,300 (0,355)Rather dissatisfied 0,456 (0,634) 0,043 (0,394)Employer's monetary debt to the employee (no – ref.)Question wasn’t asked (does not work in the organization) 0,292 (0,986) 0,530 (0,659)
18

Table 4 (continued)
Yes -1,350** (0,460) 0,293 (0,619)Reduction of salaries and hours of work (no – ref.)Question wasn’t asked (does not work in the organization) - - - -Yes -0,078 (0,450) -0,274 (0,360)Enforced unpaid leave (no – ref.)Question wasn’t asked (does not work in the organization) - - - -Yes -0,313 (0,740) -0,895* (0,452)Satisfaction with work in general (dissatisfied – ref.)Completely satisfied 0,151 (0,513) 0,585* (0,332)Rather satisfied 0,295 (0,411) 0,494* (0,289)Yes and no -0,382 (0,444) 0,754* (0,330)The ratio of pensioner’s salary to minimal wage (5 and more MVR – ref.)<2 MVR -0,690 (0,452) -1,098** (0,379) -0,544 (0,429) -0,992** (0,360)2-3 MVR -0,703* (0,408) -0,957* (0,370) -0,696* (0,386) -0,865* (0,356)3-5 MVR -0,389 (0,435) -0,347 (0,398) -0,258 (0,419) -0,370 (0,387)Changing job (profession) (no – ref.)Changing job (profession) 0,863* (0,402) 0,153 (0,317) 0,940* (0,425) 0,052 (0,313)Significance: *** p ≤ 0.001, ** p ≤ 0.01, * p ≤ 0.1Control variables: gender, age, type of settlement, the elderly’s education and health, disability, entitlement period for early retirement, marital status
19
Conclusion
This paper focuses on the phenomenon of labour mobility, primarily in older age. In
recent years Russia is experiencing the growth of pensioners’ employment rate, both for men and
women. At the same time, the population of pre-retirement and retirement ages often face some
obstacles in the labour market: worsening health, decreasing productivity, competition with
younger workers. This research has raised the question whether labour mobility could be the
strategy to maintain employment in older age. We have explored the factors of the elderly’s
labour mobility as well as its impact on the employment in older age.
To answer these questions we have constructed two independent logistic regressions
using panel RLMS data (2010 – 2016). In our research framework we have defined labour
mobility as job and/or profession change as well as the post-retirement re-introduction to the
labour market. The inclusion of the last group of the elderly may increase the proportion of those
with experienced labour mobility, but we consider this as the elderly’s ‘active strategy’ in the
labour market.
The propensity to labour mobility is mainly determined by the elderly’s accumulated
specific human capital rather than general human capital. Health status and educational level
(except the last one for men) have no significant influence on the probability of labour mobility
in older age so our first hypothesis was rejected. At the same time, long-term employment
relations decrease the probability of the elderly’s labour mobility. Thus, the second hypothesis is
confirmed: specific tenure contributes to maintain the current job at older age.
The elderly’s labour mobility quite depends on job characteristics – the sector of the
economy, the enterprise ownership, the nature of employment relationships (formal / informal)
that corresponds to the previous studies on labour mobility in Russia (Maltseva, 2009;
Gimpelson, Kapeliushunikov, Otshepkov, 2017). The elderly do not tend to change stable job
with social guarantees. At the same time, according to one of our model specifications, skilled
workers of agriculture, forestry and fish farming, unskilled workers of all sectors are also less
likely to change their job. We explain this unexpected result by the fact that this group of
workers is forced to keep the current job because they cannot find another one, more stable and
comfortable. Thus, the third hypothesis is generally confirmed: the workers of state enterprises,
large enterprises, budget sectors of the economy do not prefer to change their job.
The size of salary related to minimal regional wages does not significantly influence the
probability of labour mobility in older age. Probably it is necessary to test other specifications of
this variable: the ratio of pensioner’s salary to average regional wage or the size of pension. The
existing studies on labour mobility usually take into account the actual or expected size of salary
at a new job so adding this variable into our models could be the direction for further research. 20

Unlike material aspects of the job, general job satisfaction as well as satisfaction with working
conditions significantly contributes to comfort of the elderly’s employment. Thus, the last
hypothesis is partly confirmed: job satisfaction reduces the probability of job changing while
higher salaries have no significant effect.
As for the third hypothesis, none of our models have shown the significance of early
retirement for the elderly’s labour mobility therefore this hypothesis was rejected.
We can consider the elderly’s labour mobility as the strategy to maintain their
employment only partially. In the model for the whole sample, and for women, labour mobility
is insignificant. As for men, the changing of job during the previous three years increases the
probability of maintaining employment.
This research is still in progress. In the next step, we plan to expand the number of factors
of the elderly’s labour mobility by including some household characteristics: its composition and
household income per capita, because the elderly’s decision on labour mobility depends not only
on individual preferences but also on family circumstances.
In panel data the selection proceeds in stages: in every wave of the panel some
respondents are lost due to mortality, change of living place, etc. Proportions of men and women
in the sample vary in comparative quantity, and the panel does not adequately represent the
general population. In order to exploit the potential of panel data it is important to assess the
biases – attrition – by two methods: Heckman correction for attrition and inverse probability
weights. In this research we did not use the methods of attrition, but it will be the next step.
At this stage of the research, two independent logistic regression models were built.
Another version for working with panel data may be a system of simultaneous equations, which
can solve the problem of endogeneity of changing job and/or profession and employment, if the
interdependence of these variables is proved. In addition we plan to apply survival analysis to
our data with due regard to the attrition people from panels. It will require a choice of algorithm
and approach in the processing of sample survey data.
References
Blumen, I., Kogen, M., McCarthy, P. (1955). The Industrial Mobility of Workers as a
Probability Process. Cornell studies in industrial and labor relations. Vol. 6. Cornell University,
Ithaca, NY.
Boeckerman, P., Ilmakunnas, P. (2007). Job Disamenities, Job satisfaction, Quit
Intentions, and Actual Separations: Putting the Pieces Together. HECER Discussion Paper. No.
166. 30 p.
21

Bratsberg, B., Ragan, J., Warren, J. (2003). Negative Returns to Seniority: New Evidence
in Academic Markets. ILR Review. Vol. 56, issue 2. P. 306-323.
Cornelissen, T. (2006). Job characteristics as determinants of job satisfaction and labour
mobility. Discussion Paper No. 334. University of Hannover.
Davis, S., Haltiwanger, J. (1995). Measuring Gross Worker and Job Flows. NBER
Working Paper. No. 5133.
Doeringer, P. (1990). Economic security, labor market flexibility, and bridges to
retirement. In P.B. Doeringer (Ed.), Bridges to retirement: p. 3 – 22. Ithaca, NY: Cornell
University ILR Press.
Farber, H. (1999). Mobility and Stability: The Dynamics of Job Change in Labor
Markets. Handbook of Labor Economics. Ed. by O. Ashenfelter, D. Card. Vol. 3. P. 2439-2483.
Feldman, D. (1994). The Decision to Retire Early: A Review and Conceptualization.
ACAD MANAGE Review. Vol. 19 No. 2. P. 285-311.
Feldman, D., Leana, C., Bolino, M. (2002). Underemployment and relative deprivation
among re-employed executives. Journal of Occupational and Organizational Psychology. Vol.
75, Issue 4. P. 453-471.
Feldman, D., Ng, T. (2007). Career: Mobility, Embeddedness, and Success. Journal of
management. P. 350-377.
Flinn, C. (1986). Wages and Job Mobility of Young Workers. Journal of Political
Economy. No. 94. S88 – S110.
Freeman, R. (1980). The exit-voice tradeoff in the labor market: unionism, job tenure,
quits and separations. Quarterly Journal of Economics. Vol. 94. P. 643-673.
Gimpelson, V., Kapeliushunikov, R. (2011). Russian employee: education, occupation,
qualification. Moscow: Higher School of Economics Publ. House. (In Russian)
Gimpelson, V., Kapeliushunikov, R., Otshepkov, A. (2017). “Juniors” and “seniors” in
the Russian labor market: an analysis through prism of tenure. Working paper WP3/2017/01.
Moscow: Higher School of Economics Publ. House. 69 p. (In Russian)
Góra M., Rohozynsky O., Sinyavskaya O. V. (2010). Pension reform options for Russia
and Ukraine: A critical analysis of available options and their expected outcomes (with particular
focus on labor market, industrial restructuring and public finance). – ESCIRRU Working Paper
No. 25, February, Berlin.
Ichino, A., Schwerdt, G., Winter-Ebmer, R., Zweimuller, J. (2007). Too Old to Work,
Too Young to Retire? IZA Discussion Paper. No. 3110.
22

Johnson, R. (2011). Phased Retirement and Workplace Flexibility for Older Adults:
Opportunities and Challenges. The Annals of the American Academy of Political and Social
Science. No. 638. P. 68-85.
Jovanovic, B. (1979). Job Matching and the Theory of Turnover // Journal of Political
Economy. Vol. 87. No. 5. pp. 972-990.
Jovanovic, B., Moffit, R. (1990). An Estimate of a Sectoral Model of Labor Mobility.
Journal of Political Economy. Vol. 98. No. 4. P. 827-852.
Kapeliushnikov, R. (2006). Human capital accumulation and the labor market outcomes:
evidence from Russia. Economic Policy. No. 4. P. 166-195.
Kirchmeyer, C. (2006). The different effects of family on objective career success across
genders: A test of alternative explanations. Journal of Vocational Behavior. Vol. 68. P. 323-346.
Kolosnitsyna, M., Gerasimenko, M. (2014). Labour force participation of older citizens
and public policy. Public Administration Issues. No. 4. P. 47-68.
Kovrova, I. (2007). Shaping a Pension System: Distributive and Incentive Effects of the
Russian Pension Reforms. Ph.D. dissertation, University of Turin.
Lee, T., Maurer, S. (1999). The effects of family structure on organizational commitment,
intention to leave, and voluntary turnover. Journal of Managerial Issues. Vol. 11. P. 493-513.
Levin, V. (2015). Time to retire: Analysis of older Russians’ retirement decisions. Draft
Working Paper, World Bank.
Maleva, T., Sinyavskaya, O. (2007). Russian pensioners: labour biographies, economic
activity, pension stories. Parents and children, men and women in a family and society. Vol. 1.
Moscow: IISP.
Maltseva, I. (2005). Gender differences in professional mobility and segregation in labour
market: the experience of Russian economy. Moscow: EERC. 55 p.
Maltseva, I. (2007). Today is Here, Tomorrow is There: Intersectoral labour mobility in
Russia.
Maltseva, I. (2009). Labour mobility and stability: how much is the return from specific
human capital in Russia? The Economic Journal of Higher School of Economics. Vol. 13. No. 2.
P. 243-278.
Maltseva, I., Roshchin, S. (2007). Gender segregation and mobility on Russian labour
market. Moscow: Higher School of Economics Publ. House. 295 p. (In Russian)
Morternsen, D. (1986). Job search and labor market analysis. In: Orley Ashenfelter and
Richard Layard (eds.). Handbook of labor economics. Vol. 2. P. 849-919.
Nesterova, D., Sabirianova, K. (1999). Investments in human capital in the transition
period in Russia. EERC Working Papers Series, 99/04.23

OECD (1998). Work force ageing: Consequences and policy responses/ Ageing Working
Paper 4.1.
Parsons, D. (1972). Specific Human Capital: An Application to Quit Rates and Layoff
Rates. Journal of Political Economy. No. 80. P. 1120 – 1143.
Potekhina, I., Chizhov, D. (2016). Potential of senior citizens as a component of national
social capital (Russian central federal district case study). Monitoring of Public Opinion:
Economic and Social Changes. No. 2. P. 3 – 23.
Sinyavskaya, O. (2005). Pension Reform in Russia: A challenge of Low Pension Age.
PIE Discussion Paper, 267, March 2005, Project on Intergenerational Equity, Hitotsubashi
University (Japan).
Sinyavskaya O., Ermolina A. (2017). Retirement Income, in: Global Encyclopedia of
Public Administration, Public Policy, and Governance. Switzerland: Springer International
Publishing. P. 1-7.
Sabirianova, K. (2002). The Great Human Capital Reallocation: A Study of Occupational
Mobility in Transitional Russia. Journal of Comparative Economics. No. 30(1), P. 191-217.
Tatsiramos, K. (2010). Job displacement and the transitions to re-employment and early
retirement for non-employed older workers. European Economic Review. Vol. 54. P. 517-535.
The employment review in Russia, Vol. 1 (1991 – 2000). (2002). Ed.: Maleva, T.
Moscow: TEIS. (In Russian)
24