>> perspectives 2012 - infraserv höchst · achema perspectives 2012 "a4rb_premium"...
TRANSCRIPT

>> PERSPECTIVES_2012 THE FUTURE OF CHEMICAL AND PHARMACEUTICAL PRODUCTION IN GERMANY CMF JUNE 19, 2012 – FACILITATED BY DR. MICHAEL REUBOLD, CHEMANAGER

>> MANAGING THE ENERGY SHIFT. PREPARATION IS KEY TO FUTURE SITE READINESS
Dr. Alexander Keller Roland Berger Strategy Consultants ACHEMA PERSPECTIVES 2012

2 "A4rb_Premium" – 2012-02_v02 – do not delete this text object! Speech
3 Roland Berger_Alexander Keller_Preparation is key to future site readiness.pptx
3
Preparation is key to future
site readiness Frankfurt, June 19, 2012

2 "A4rb_Premium" – 2012-02_v02 – do not delete this text object! Speech
4 Roland Berger_Alexander Keller_Preparation is key to future site readiness.pptx
CONTENTS
4
Energy prices remain a major challenge for the German chemicals industry
Optimization and cooperation – Two sides of one medal
Food4thought – How to cope with the energy challenge
A.
B.
C.
Page 3
Page 8
Page 22

2 "A4rb_Premium" – 2012-02_v02 – do not delete this text object! Speech
5 Roland Berger_Alexander Keller_Preparation is key to future site readiness.pptx
5
A. Energy prices remain a major challenge for the German chemicals industry

2 "A4rb_Premium" – 2012-02_v02 – do not delete this text object! Speech
6 Roland Berger_Alexander Keller_Preparation is key to future site readiness.pptx
100
60
80
1993 1991 2005 2003 2001 1999 1997 1995
40
8,000
20
0
7,000
6,000
5,000
4,000
3,000
2,000
1,000
0 2009 2007
The chemicals industry in Germany has experienced a significant improvement of its energy consumption over the last 20 years…
6
STARTING POINT
> Chemicals industry in Germany reduced its specific energy consumption by 40% over the last 20 years – Investments into up-to-date power
plants and more energy efficient processes
– Large production sites have implemented the "Verbund" (i.e., material and energetic integration of processes)
– Esp. automation technologies help managing the increasing complexity of interwoven processes
> However, at the same time – esp. over the last 5 years – the industry experienced a massive increase of energy costs
Source: VCI; Roland Berger
1) Specific energy consumption measures the amount of energy used to produce one output unit
Energy costs Energy consumption Specific energy consumption1)
EUR m
Development of energy consumption [Index with 1991 = 100]

2 "A4rb_Premium" – 2012-02_v02 – do not delete this text object! Speech
7 Roland Berger_Alexander Keller_Preparation is key to future site readiness.pptx
40
60
80
100
120
140
160
180
2006 2002 1998 1994 1990 2009
…this development is not only limited to Germany, but also observable for the European and US American chemicals industry
7
STARTING POINT
Development of energy consumption [Index with 1990 = 100]
Source: Eurostat; Cefic Chemdata International; Roland Berger
EUROPEAN perspective Average growth rate p.a. 1990-2009
EU versus USA Average growth rate 1990-2009
EU chemicals production 2.5%
EU energy consumptions -1.7%
40
50
60
70
80
90
100
110
2009 2006 2002 1998 1994 1990
US chemicals industry intensity -2.1%
EU chemicals industry intensity -4.1%
EU energy intensity -4.1%

2 "A4rb_Premium" – 2012-02_v02 – do not delete this text object! Speech
8 Roland Berger_Alexander Keller_Preparation is key to future site readiness.pptx
However, efficiency improvements haven't been sufficient to compensate for rising energy prices - Rising energy cost share
8
STARTING POINT
Development of energy costs
Chemicals industry hasn't been able to compensate for rising energy prices through efficiency measures in the last years
Source: Statistisches Bundesamt; BMWI; Roland Berger
1) Average annual price for industrial customer in Germany
Electrictiy price1) [EUR/MWh]
0
10
20
30
40
50
60
70
80
90
5.0
4.0
3.0
2.0
6.0
2001
49.0
3.0
2000
45.0
2.6
1999
55.0
2.7
1998
62.0
3.2
2005
66.0
3.0
2004
62.0
2.9
2003
58.0
2.9
2002
51.0
2.9
2009
83.0
5.1
2008
88.0
5.0
2007
75.0
3.4
2006
75.0
3.4
1.0
0.0
Share of gross production value Electricity price
Share of gross production value [%]

2 "A4rb_Premium" – 2012-02_v02 – do not delete this text object! Speech
9 Roland Berger_Alexander Keller_Preparation is key to future site readiness.pptx
The price for electricity is expected to rise by 70% within the next 50 years
9
CHALLENGE
ELECTRICITY PRICE DEVELOPMENT 1)
[EUR ct/kWh]
Source: vbw; Prognos; Roland Berger
1) vbw (2010) – based on "Muddling through" scenario
2010 2020 2030 2040 2050
8.7
~70%
11.3 10.9
10.5
6.8
DRIVERS
> The earlier than planned nuclear phase out drives electricity price increases due to shortening supply
> Construction of electricity grids needed for the development of renewable energies will further drive the electricity price
> There will be higher costs for CO2 certificates and fossil fuels in the future – Utility companies will pass on these extra costs to their customers
> An additional cost increase is expected due to the Renewable Energy Law (EEG) allocation
Drivers are very Germany-specific Thus, threat of additional cost exposure for German chemicals industry

2 "A4rb_Premium" – 2012-02_v02 – do not delete this text object! Speech
10 Roland Berger_Alexander Keller_Preparation is key to future site readiness.pptx
10
B. Optimization and cooperation – Two sides of one medal

2 "A4rb_Premium" – 2012-02_v02 – do not delete this text object! Speech
11 Roland Berger_Alexander Keller_Preparation is key to future site readiness.pptx
Energy challenge needs to be tackled along two dimensions to ensure strategic site readiness
11
Source: Roland Berger
Chemical site PRODUCTION
Use of energy for product treatment (e.g., thermal treatment, synthesis)
RISING ENERGY PRICES > Optimized energy generation
> Ecological "Verbund" strategy
Strategic levers to tackle energy challenge
STRATEGIC SITE READINESS
PRODUCTION ENVIRONMENT
Supply of required energy for production (typically electricity, steam or cooling water)
> Technology usage > Technology development
Present achievements strongly driven by own efforts
Additional potentials exploitable through cooperation and shift from service to savings approach

2 "A4rb_Premium" – 2012-02_v02 – do not delete this text object! Speech
12 Roland Berger_Alexander Keller_Preparation is key to future site readiness.pptx
2010 2020 2030 2040 2050
22.0
6.1
30.0
17.3
12.4 11.0
37.0
20.9
Based on a Roland Berger study the chemicals industry can im-prove its production-related energy efficiency level by 37% to 2050
12
PRODUCTION
Efficiency improvement potential [%]
The synthesis process only offers an efficiency improvement potential of approx. 10% within the next 10 years – Equipment used for synthesis (e.g., calcination units, extraction units) offer efficiency improvement potentials through construction optimizations Additional improvements due broader implementation of energy saving technologies aiming at increasing the efficiency of machine drives (e.g., rotation speed controls, automatic shutdowns)
Levers to 2020
Source: Expert panel; Roland Berger
Technology usage
Technology development
Sum of both levers
4.9
9.6
12.7
16.1
2 "A4rb_Premium" – 2012-02_v02 – do not delete this text object! Speech
13 Roland Berger_Alexander Keller_Preparation is key to future site readiness.pptx
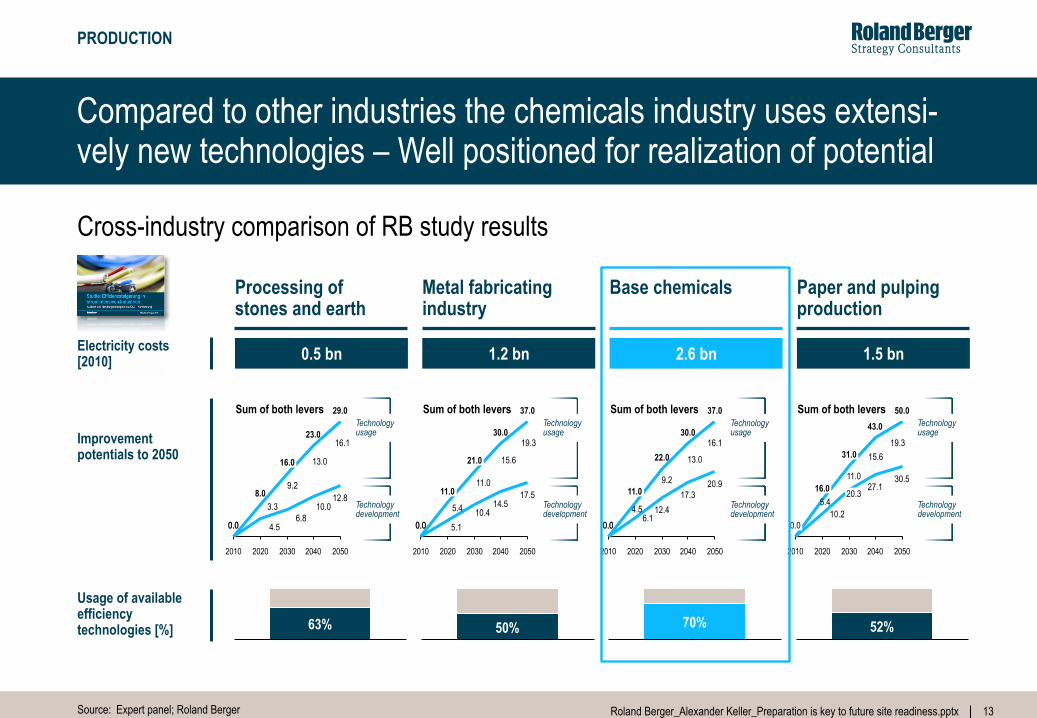
Compared to other industries the chemicals industry uses extensi-vely new technologies – Well positioned for realization of potential
13
Cross-industry comparison of RB study results
Processing of stones and earth
Base chemicals Paper and pulping production
Metal fabricating industry
Source: Expert panel; Roland Berger
Electricity costs [2010]
Improvement potentials to 2050
52% 70% 50% 63%
0.5 bn 1.2 bn 2.6 bn 1.5 bn
2010 2020 2030 2040 2050
17.5
37.0
14.5
30.0
10.4
21.0
5.1 0.0 0.0
11.0
Technology usage
Technology development
Sum of both levers
2010 2020 2030 2040 2050
22.0
6.1
11.0
0.0 0.0 12.4
30.0
20.9
37.0
17.3
Technology usage
Technology development
Sum of both levers
2010 2020 2030 2040 2050
30.5
50.0
27.1
43.0
20.3
31.0
10.2
16.0
0.0 0.0
Technology usage
Technology development
Sum of both levers
2010 2020 2030 2040 2050
10.0 8.0 12.8
16.0
4.5
23.0
29.0
0.0 0.0 6.8
Technology usage
Technology development
Sum of both levers
3.3
9.2
13.0
16.1 19.3
15.6
11.0
5.4
16.1
13.0
9.2
4.5
19.3 15.6
11.0
5.4
Usage of available efficiency technologies [%]
PRODUCTION
2 "A4rb_Premium" – 2012-02_v02 – do not delete this text object! Speech
14 Roland Berger_Alexander Keller_Preparation is key to future site readiness.pptx
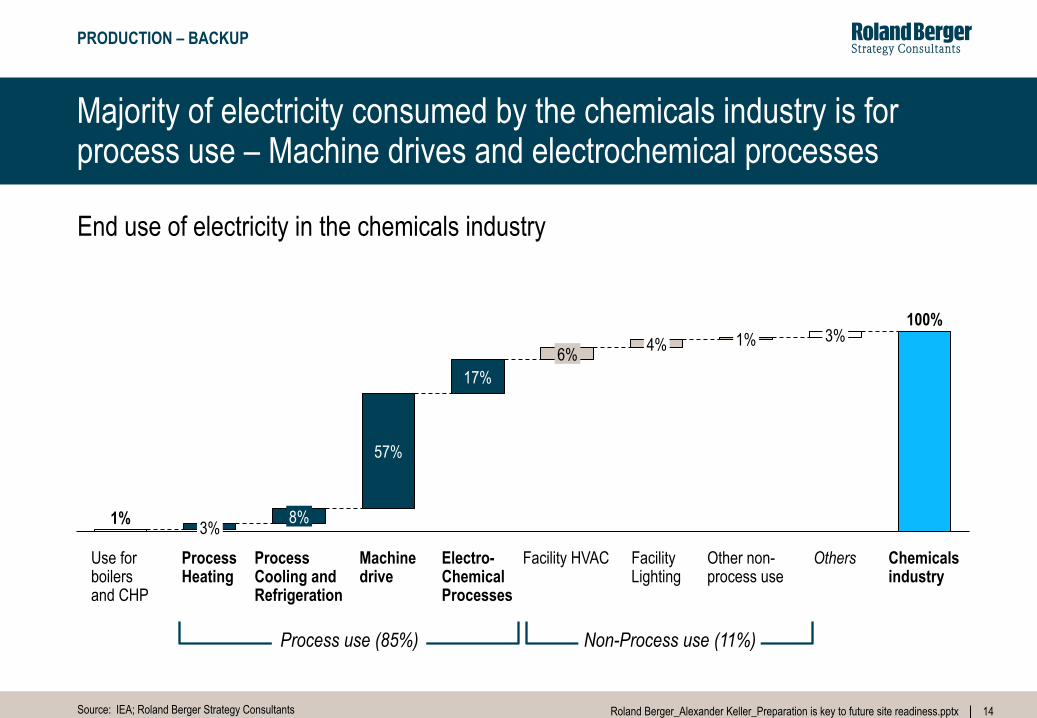
Majority of electricity consumed by the chemicals industry is for process use – Machine drives and electrochemical processes
14
PRODUCTION – BACKUP
End use of electricity in the chemicals industry
Source: IEA; Roland Berger Strategy Consultants
1%
Use for boilers and CHP
3% Process Heating
8%
Chemicals industry
100%
Others
3%
Other non-process use
1%
Facility Lighting
4%
Facility HVAC Electro-Chemical Processes
6% 17%
57%
Machine drive
Process Cooling and Refrigeration
Process use (85%) Non-Process use (11%)

2 "A4rb_Premium" – 2012-02_v02 – do not delete this text object! Speech
15 Roland Berger_Alexander Keller_Preparation is key to future site readiness.pptx
Degree of implementation of energy saving technologies differs significantly – Opportunity to exploit available potential
15
PRODUCTION
Overview about process industry companies using energy saving technologies
Source: Fraunhofer Institut
1) Based on survey from 2009 – reflecting implementation degree in companies above 250 employees
51% Recovery of kinetic and process energy
Control concept for shutdown of machines in times of low
10%
27%
Low-heat joining processes
Usage of high efficiency pumps
43%
Heat and power combination
17%
65% Electric motors with rotation speed control
ENERGY SAVING TECHNOLOGY DEGREE OF IMPLEMENTATION [%] 1)

2 "A4rb_Premium" – 2012-02_v02 – do not delete this text object! Speech
16 Roland Berger_Alexander Keller_Preparation is key to future site readiness.pptx
2010 2011 2012 2013 2014
3.9
3.2
3.7 3.8
2.6 2.6
4.7 5.4
3.5
6.2
Savings2)
Chemicals industry could save EUR ~42 bn to 2050 by implemen-tation of potential efficiency measures – Investment of EUR ~10 bn
16
PRODUCTION
Source: Expert Panel; Prognos; Roland Berger
1) Assumptions: Annual production growth of 1%, nuclear phase out, built up of renewable energies according to development scenario of the German Government 2) In the respective year 3) Investment costs not considered
Electricity costs development [EUR bn] 1) Cost/benefit comparison [EUR bn]
Electricity costs WITH efficiency improvement3)
0.4 1.0 1.6 2.3
Realization requires UNDERSTANDING OF SPECIFIC ACTION NEEDS
~10
~42
Investment Cum. savings
Electricity costs WITHOUT efficiency improvement
2 "A4rb_Premium" – 2012-02_v02 – do not delete this text object! Speech
17 Roland Berger_Alexander Keller_Preparation is key to future site readiness.pptx
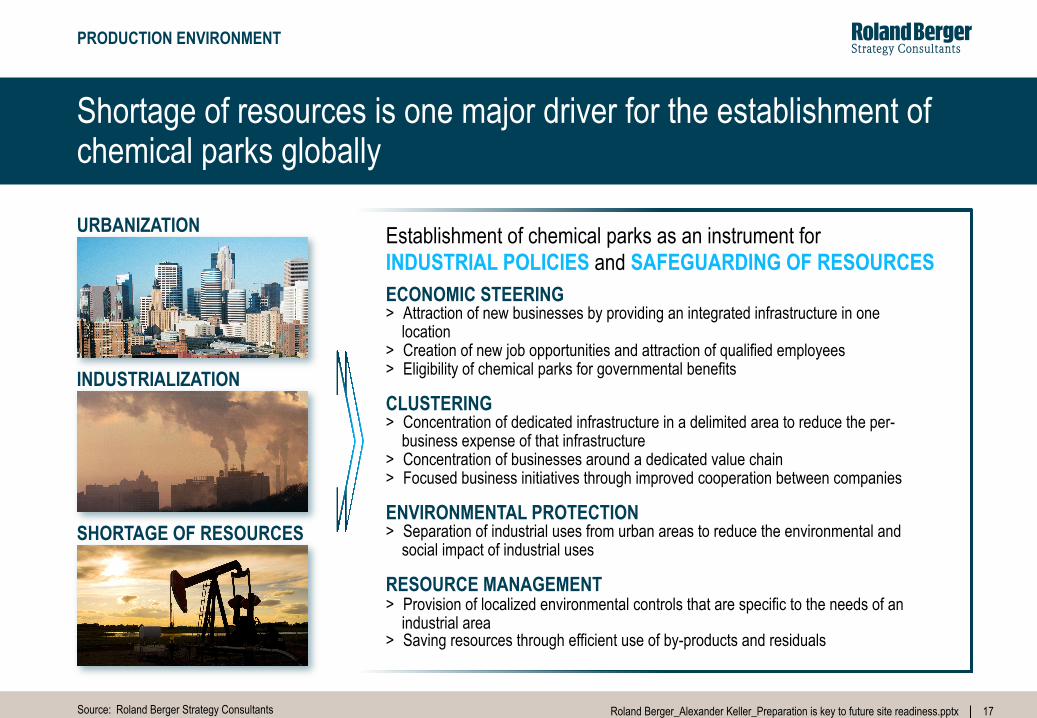
Shortage of resources is one major driver for the establishment of chemical parks globally
17
Source: Roland Berger Strategy Consultants
PRODUCTION ENVIRONMENT
ECONOMIC STEERING > Attraction of new businesses by providing an integrated infrastructure in one
location > Creation of new job opportunities and attraction of qualified employees > Eligibility of chemical parks for governmental benefits
CLUSTERING > Concentration of dedicated infrastructure in a delimited area to reduce the per-
business expense of that infrastructure > Concentration of businesses around a dedicated value chain > Focused business initiatives through improved cooperation between companies
ENVIRONMENTAL PROTECTION > Separation of industrial uses from urban areas to reduce the environmental and
social impact of industrial uses
RESOURCE MANAGEMENT > Provision of localized environmental controls that are specific to the needs of an
industrial area > Saving resources through efficient use of by-products and residuals
Establishment of chemical parks as an instrument for INDUSTRIAL POLICIES and SAFEGUARDING OF RESOURCES
URBANIZATION
INDUSTRIALIZATION
SHORTAGE OF RESOURCES
2 "A4rb_Premium" – 2012-02_v02 – do not delete this text object! Speech
18 Roland Berger_Alexander Keller_Preparation is key to future site readiness.pptx
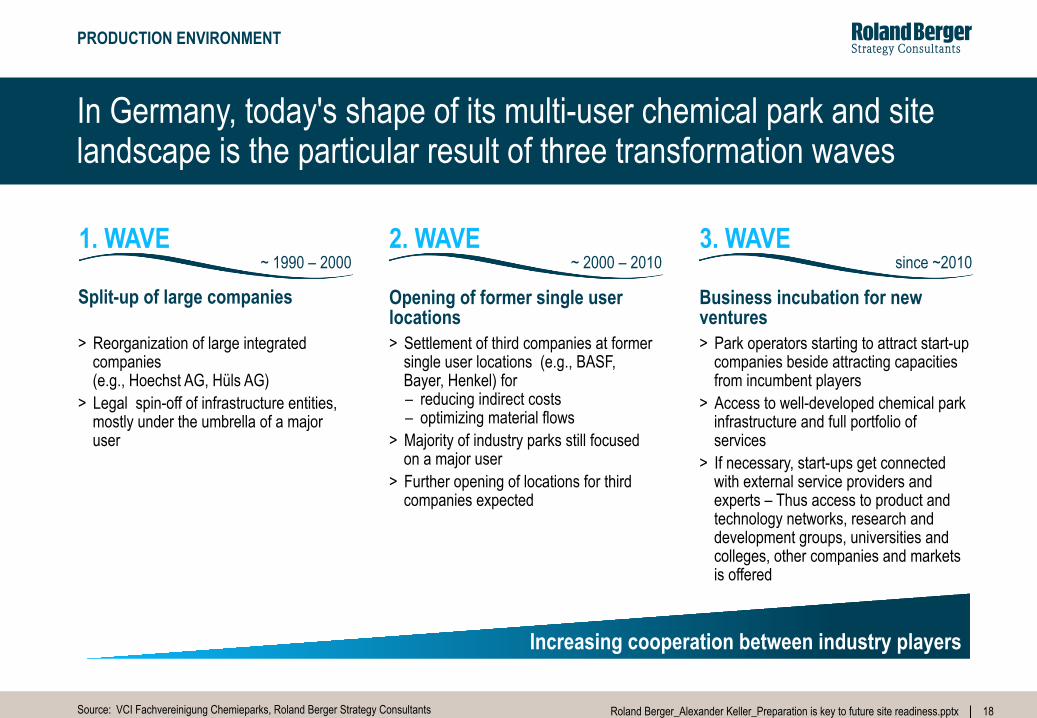
In Germany, today's shape of its multi-user chemical park and site landscape is the particular result of three transformation waves
18
PRODUCTION ENVIRONMENT
1. WAVE
Source: VCI Fachvereinigung Chemieparks, Roland Berger Strategy Consultants
> Reorganization of large integrated companies (e.g., Hoechst AG, Hüls AG)
> Legal spin-off of infrastructure entities, mostly under the umbrella of a major user
Split-up of large companies
2. WAVE ~ 1990 – 2000
Opening of former single user locations > Settlement of third companies at former
single user locations (e.g., BASF, Bayer, Henkel) for – reducing indirect costs – optimizing material flows
> Majority of industry parks still focused on a major user
> Further opening of locations for third companies expected
3. WAVE ~ 2000 – 2010
Business incubation for new ventures
> Park operators starting to attract start-up companies beside attracting capacities from incumbent players
> Access to well-developed chemical park infrastructure and full portfolio of services
> If necessary, start-ups get connected with external service providers and experts – Thus access to product and technology networks, research and development groups, universities and colleges, other companies and markets is offered
since ~2010
Increasing cooperation between industry players

2 "A4rb_Premium" – 2012-02_v02 – do not delete this text object! Speech
19 Roland Berger_Alexander Keller_Preparation is key to future site readiness.pptx
However, security of utilities supply and competitive prices are the most important expectations towards chemical park operators
19
PRODUCTION ENVIRONMENT
Customer expectations towards chemical park operators in Germany
Source: Roland Berger Strategy Consultants
Average evaluation of industry experts (N = 25; 5 = I totally agree; 1 = I totally disagree)
3.2
3.5
3.5
3.5
3.7
3.9
4.3
4.8 Security of utilities supply
Competitive prices
No monopoly on provision of services
Ability for contracting/investing
Cost transparency
Broad spectrum of services
Excellence in individual services
High level of value chain integration
RELATED TO ENERGY EFFICIENCY

2 "A4rb_Premium" – 2012-02_v02 – do not delete this text object! Speech
20 Roland Berger_Alexander Keller_Preparation is key to future site readiness.pptx
Installation of CHP power plants are an effective lever to optimize the costs of the utilities supply in a chemical park
20
PRODUCTION ENVIRONMENT
Estimated primary energy savings by CHP
Source: IEA; Roland Berger Strategy Consultants
1) Primary energy savings are compared to average CHP efficiency of 81% 2) Current power efficiency has been estimated based on IEA Energy Statistics 3) State-of-the-art power efficiencies are based on the performance of two NGCC (natural gas combined cycle), power plants in Korea (52.5%) and efficiency of Siemens-E.ON CCGT
(combined cycle gas turbine) power plant under construction in Irsching, Germany (60%) 4) Reference efficiency of state-of-the-art coal power plant with its start-up planned in 2015 in Wilhelmshaven, Germany
Reference power plant Fuel type
Reference efficiency
Primary energy savings 1) Boiler Power
Current 2)
State-of-the-art 3)
State-of-the-art 4)
Current mix
Natural gas
Coal
90%
90%
90%
40%
52.5-60%
50%
20%
10-40%
12%

2 "A4rb_Premium" – 2012-02_v02 – do not delete this text object! Speech
21 Roland Berger_Alexander Keller_Preparation is key to future site readiness.pptx
Tapping this optimization potential requires new cooperation models – Park operators increasingly partner with external energy players
21
PRODUCTION ENVIRONMENT
Optimized energy generation – snapshot on two recent examples
Source: Company information; Roland Berger
TAKE AWAYS > Cooperation with energy
companies allows – More efficient use of
fossil fuels – Lower CO2 emissions
> Thus, stability on energy costs
> Energy companies are actively looking for opportunities to diversify generation mixture
> Co-location with allows optimization of by-products (e.g., steam)
> In 2010 decision to build a 430 MW CHP power plant at the Chempark in Leverkusen – Completion expected for 2014
> Investment value of EUR 340 m (Repower as investor) > Plant management through Currenta > Electricity also be sold to external customers > Repower already operating wind farms in Germany
> In 2009 Alpiq opened a CHP plant on Cimo's Monthey site
> Thermal power of 43 MW and electrical power of 55 MW > Steam and part of the electricity delivered to Cimo for
main on-site customers (BASF, Syngenta and Huntsman) > Excess electricity delivered into local power grid > Alpiq is already operating 2 similar power plants together
with chemicals companies in Northern Italy since 2006

2 "A4rb_Premium" – 2012-02_v02 – do not delete this text object! Speech
22 Roland Berger_Alexander Keller_Preparation is key to future site readiness.pptx
Beyond energy - The Danish Industrial Symbiosis aims at improving the environmental standard through an ecological "Verbund"
22
PRODUCTION ENVIRONMENT
Ecological "Verbund" strategy – Industrial Symbiosis Kalundborg (Denmark)
Source: Industrial Symbiosis, Roland Berger Strategy Consultants
Lake Tisse
Fertilizer Industry
Sulphur Fertilizer
Statoil Refinery
Gyproc
Sea water
Surface water
Waste water treatment
RGS 90
Alcoholic Residues
Biomass/ NovoGro
Yeast slurry
Pig Farms Farms
KARA/Noveren Used plasterboards for recycling
Industrial Symbiosis Institute
Contrete and Cement Industry
Gypsum
Deionized water Drain water
Steam
Cooling water
Techwater
Fish farm
Steam
Heat
Flyash
Surface water Water
Waste water
Sludge
Surface water
Heat Purification
of water
Soil and buildingmaterials for recycling
NETWORK COOPERATION
Asnaes Power Station
Re-use basin
Novozymes
Novo Nordisk
The Municipality of Kalundborg
> A network cooperation between seven companies and the Municipality of Kalundborg
> Goal is to improve the environmental standard through efficiency and exchange of utilisation of by-products
> One company's by-product becomes an important resource to one or several of the other companies
> Collaborating partners also benefit financially since the individual agreement is based on commercial principles

2 "A4rb_Premium" – 2012-02_v02 – do not delete this text object! Speech
23 Roland Berger_Alexander Keller_Preparation is key to future site readiness.pptx
Production environment offers additional efficiency potentials beside optimization of own production
23
Source: Roland Berger
≙ Limited ≙ Very high
Potential along both dimensions needs to be exploited
Use of energy for product treatment (e.g., thermal treatment, synthesis)
Chemical site PRODUCTION
PRODUCTION ENVIRONMENT
Supply of required energy for production (typically electricity, steam or cooling water) and exchange of energy and (by-)products
Chemical players focused
mostly on their own
production
Cooperation would pave the way for additional potentials
Contribution so far…
…future contribution

2 "A4rb_Premium" – 2012-02_v02 – do not delete this text object! Speech
24 Roland Berger_Alexander Keller_Preparation is key to future site readiness.pptx
24
C. Food4thought – How to cope with the energy challenge

2 "A4rb_Premium" – 2012-02_v02 – do not delete this text object! Speech
25 Roland Berger_Alexander Keller_Preparation is key to future site readiness.pptx
Early adaption of the right thinking is crucial to prepare chemical sites for the next decades
25
Source: Roland Berger Strategy Consultants
GO FOR ECOLOGICAL NETWORKING > Design of the production environment should not only be motivated by cost reasons > Instead, consideration of ecological aspects leads to sustainable competitive advantages
MEASURE USAGE OF AVAILABLE TECHNOLOGIES > Existence of new technologies does not lead automatically to efficiency increases > Open models – such as comprehensive industry benchmarking – provide clear indications
on needs for action
> Energy generation is not the core business of chemicals companies > Instead, specialized energy companies are actively looking for new generation opportunities
– co-location with chemicals companies effective lever to maximize energy efficiency
BE OPEN FOR PARTNERSHIPS
GET INVOLVED INTO TECHNOLOGY DEVELOPMENT > Expected efficiency increases are promising and will reduce the energy burden > Realization of step changes requires open cooperation and involvement into technology
development (with both technology provider and competitors)
Rising energy prices
Fiercer global competition
Rising ecological awareness
RELEVANT TRENDS
POSSIBLE REACTIONS – Food4thought 4 FOOD
THO
UG
HT

2 "A4rb_Premium" – 2012-02_v02 – do not delete this text object! Speech
26 Roland Berger_Alexander Keller_Preparation is key to future site readiness.pptx
26