- journal of information technology in ... · critical challenges of information overload and the...
TRANSCRIPT

www.itcon.org - Journal of Information Technology in Construction - ISSN 1874-4753
ITcon Vol. 19 (2014), Hou et al., pg. 360
AN INTEGRATION FRAMEWORK OF ADVANCED TECHNOLOGIES FOR PRODUCTIVITY IMPROVEMENT FOR LNG MEGA-PROJECTS
SUBMITTED: January 2014 REVISED: June 2014 PUBLISHED: September 2014 at http://www.itcon.org/2014/22 GUEST EDITORS: Wang X., Li H., Wong J. and Li H.
Lei Hou, PhD, Australasian Joint Research Centre for BIM, School of Built Environment, Curtin University, Australia; [email protected]
Xiangyu Wang, Curtin-Woodside Chair Professor for Oil, Gas & LNG Construction and Project Management Co-Director of Australasian Joint Research Centre for BIM, Curtin University; International Scholar of Department of Housing and Interior Design, Kyung Hee University, South Korea [email protected]
Jun Wang, Visiting Academic School of Construction Management and Real Estate, Chongqing University, China; Australasian Joint Research Centre for BIM, School of Built Environment, Curtin University, Australia; [email protected]
Martijn Truijens, Lean Construction Technology Advisor Woodside Energy Ltd., Australia; [email protected]
SUMMARY: Construction productivity issues in the Liquefied Natural Gas (LNG) construction industry can lead to project cost blowouts. Time wasted by construction personnel getting the right information on megaprojects can be a substantial contributing factor. It appears that the traditional method of communication on site is not cost effective, judging by the number of large project that have experienced budget overruns in the past. The concept framework defined in this research paper will form the basis for a scientific validation that aims to support the hypothesis that productivity can be substantially improved in the LNG construction industry. The approach is based on a novel context-aware mobile computing framework that integrates innovate concepts and technologies including but not limited to Information Communication Technology (ICT), Building Information Modeling (BIM), advanced visualization, Radio Frequency Identification (RFID) and laser scanning. The integration of these technologies in a cohesive dynamically updated database combined with real time visualisation will give construction personnel a superior advantage compared to current practice; site personnel waiting for permits, waiting for materials, searching for information only to realise that the drawing in their hand was incorrect in the first place. The next phase of this study will conduct a series of experiments based on a real scale construction module. It is believed the results will reveal positive effects in labour productivity that will benefit lean construction practitioners in today’s global LNG construction industry.
KEYWORDS: LNG construction, system ICT, BIM, advanced visualization, RFID, laser scanning, productivity.
REFERENCE: Lei Hou, Xiangyu Wang, Jun Wang, Martijn Truijens (2014). An integration framework of advanced technologies for productivity improvement for LNG mega-projects, Journal of Information Technology in Construction (ITcon), Special Issue BIM Cloud-Based Technology in the AEC Sector: Present Status and Future Trends, Vol. 19, pg. 360-382, http://www.itcon.org/2014/22
COPYRIGHT: © 2014 The authors. This is an open access article distributed under the terms of the Creative Commons Attribution 3.0 unported (http://creativecommons.org/licenses/by/3.0/), which permits unrestricted use, distribution, and reproduction in any medium, provided the original work is properly cited.

ITcon Vol. 19 (2014), Hou et al., pg. 361
1. BACKGROUND Now natural gas has accounted for a large portion of the world's total energy production, and is likely to gradually substitute oil and coal in future because it is pollution-free, highly efficient and safe. Liquefied Natural Gas (LNG) is converting natural gas to liquid form for ease of storage or transport. Globally, LNG construction projects account for a large proportion of the construction industry in terms of either construction scale or cost (Sheehan and Gregory, 2013). Building new LNG infrastructure is deemed to be a massive industrial undertaking considering scale, cost and significance. In Australia, it is also very challenging as it can be capital and labour intensive costing billions of dollars and a large local workforce (Engineers Australia Western Australia Division, 2012). A recently released report indicates with as little as a one-percentage increase in productivity, the Australian construction industry can increase revenue by a total amount of 1.3 billion Australian dollars a year (Henderson et al., 2012). In the 2012 fiscal year, the Australian construction industry contributed A$99.5 billion, making a significant contribution to the economy; however, the productivity of the industry has lagged behind world standards for many years (referenced from www.globaltimes.cn/content/819108.shtm). It is reported by McKinsey that the LNG sector is now at a point where ‘getting productivity right’ is likely to secure tremendous additional investments with corresponding wealth creation for the nation (Ellis et al., 2013). Conversely, failing to do so means losing this opportunity for at least a decade and possibly longer. As a promising solution to the productivity problems of mega construction projects, the application of advanced technologies should be targeted for the rapid advances in LNG infrastructure. Unfortunately, the Australian construction industry still suffers a high dependency on foreign labour and a poor application of technology (Ellis et al., 2013).
2. LITERATURE REVIEW This section reviews a wide range of approaches and technologies that the building construction industry has generally applied for the productivity purpose. The study acknowledges the merits of these promising approaches or technologies, and aims at pushing the extent of technological integration in order to reform the productivity weaknesses for LNG construction. The conventional way of conducting general construction is normally based on documented-resources such as technical drawings and manuals, from where the information retrieving activities have been proved to be prone with errors, inefficient and time consuming (Hou et al., 2013; Zhang et al., 2013; Shih, 1996; Eastman et al., 2011). With a wide range of advanced technologies in place, such as information communication technology (ICT), building information modeling (BIM), radio frequency identification (RFID), sensing and tracking and photogrammetry (Adriaanse and Voordijk, 2005; Dobkin, 2012; Dong et al., 2009; El-omari and Moselhi, 2008; Han et al., 2013; Hou and Wang, 2011; Park et al., 2013; Siu et al., 2013; Wang et al., 2012a, 2012b), engineered components can be effectively managed while non-work-piece related time can be extensively reduced (Hou and Wang, 2013; Ren et al., 2011; Chand et al., 2008). Given that factors involving tools and consumables, materials, engineering drawing management and construction equipment are also identified as the greatest impacts on workers’ productivity, the research works have also sought solutions from human cognitive and ergonomic aspects (Lee and Jeon, 2013; Jamil et al., 2013; Gatti et al., 2013). Although positive, these attempts are still progressing slowly in the building construction industry, compared with its state-of-the-art in other industries such as manufacturing (Chien et al., 2012; Shi et al., 2013). It is also approved that the majority of companies do not fully achieve the benefit that existing technologies can truly generate (Kang et al., 2013). With several initiatives instigated by academics standardization bodies, industry associations and manufacturers, IT-sustained construction practice facilitates better communication between the stakeholder and the relevant companies, helps them to meet the productivity expectation and further facilitates project management and operation (Schwalbe, 2010). Like other types of technology such as ICT, mobile computing, virtual reality (VR), augmented reality (AR), cloud, photogrammetry, RFID and laser scanning, BIM is only a part of the thriving development of IT (Buyya et al., 2009; Chi et al., 2013; Dawson, 2008; Goulding et al., 2012; Hou and Wang, 2010; Sacks et al., 2010; Shin et al., 2005; Wang, 2007, 2009; Wang and Dunston, 2007, Wang and Schnabel, 2009; Wang et al., 2008; Zhu and Donia, 2013). It is acknowledged that the technological package is becoming more popular in addressing the real issues that commonly occur in construction practice (Leonardi and Barley, 2010). The benefits include but are not limited to: improved project visualization for stakeholders, improved project communication, automated drawing generation, automated quantity estimation, identification of design conflicts, schedule optimization using 4D

ITcon Vol. 19 (2014), Hou et al., pg. 362
simulation, energy analysis, and structural analysis (Tanyer and Aouad, 2005; Eastman et al., 2008; Hao and Gu, 2011; Hartmann et al., 2008; Azhar et al., 2008; Saini and Mhaske, 2013; Momma and Izumi, 2008). Kang et al. (2013) suggests that business processes and methods become redesigned with the use of IT to make them more efficient or effective which leads to organization improvement and/or increase in profits, productivity and employee satisfaction.
3. PROBLEMS AND OBJECTIVES There is a significant cost saving and productivity improvement as a result of innovative IT producing better project outcomes (Paul et al., 2010; Brynjolfsson et al., 2010; Kang et al., 2013). It is demonstrated that the traditional engineering approaches and construction strategies are no longer effective when considering the substantial size and complexity of industrial LNG construction projects (Berends, 2007). With the advancement of communication and network demand, as well as the massive scale of the assets involved, the industry is facing critical challenges of information overload and the manageability of mega-scale projects. The traditional approach in LNG construction is primarily based on static and passive information collected through 2D technical drawings, basic phone and computer communications, without considering the rich behavioral interactions between the entities (Weems and Hwang, 2013; Lin et al., 2010; Stalhane et al., 2012). Inadequate information management in similar mega-projects is the main problem leading to poor productivity. The information available to workers is often insufficient or overwhelming (Colwell, 2008). The interactions between entities are complex due to the diverse relationships between individuals, the dynamic changes of the work status caused by external factors, such as delays of the preceding activity and failure to locate the required materials. In addition, the traditional approach also fails to integrate the entities in a holistic manner, which is one of the key reasons for lost productivity. It is very essential that the complex relationships between entities are exploited. Although some new technologies promise to improve construction productivity, their ability to deliver in LNG is not always realized. This could be reflected from the technological gap in the industry, as most of the research focuses on industry development, safety, operation, residential demand, pricing mechanisms, and optimal investment options (Cleaver et al., 2007, Foss, 2007; Havens and Spicer, 2007; Hasan et al., 2009; Khalilpour and Karimi, 2011). Within the practice, on-site personnel have the overwhelming task of managing massive amounts of project information, much of which may be irrelevant for their particular roles. Studies have proven that 35-45% of workers’ time is spent looking for the right information, materials and tools for their tasks (Hewage and Ruwanpara, 2009). At the same time, the cost of building new LNG projects has increased tremendously in the past decade and is now about 20-30% higher (Ellis et al., 2013). The higher costs jeopardize the chance of potential projects being built, and the economic benefit that this would bring. As global capacity is expected to rise higher than global demand, Australia needs to reduce costs by 20-30% to remain its competitiveness (Ellis et al., 2013). When at work, time spent working productively is low due to multiple causes, such as material and equipment not being available and time is spent less effectively due to relatively less experienced workers, which can lead to rework. In Australia, labor costs are much higher than many countries, so any type of rework can be subject to a huge monetary loss.
In oil and gas sector, constructing a typical LNG mega-project can be a challenging business, as it is difficult to conceive the scale of a project and the complexity of information flow. In a traditional LNG construction project, as a matter of fact, the activities of information management and processing refer to equipment and material status and even production information. Main issues are normally manifested as low efficiency and poor performance in dealing with very large datasets of complex drawings, overdue schedule and cost overrun. This not only means only very limited information can be assessed and delivered by the right people at the right time, but also means low productivity. To look into the possibility of deploying diverse enabling approaches/proof-of-concepts in LNG construction, this paper demonstrates an ongoing collaborative project-based study in boosting up productivity at every stage of the project lifecycle (Wang et al., 2013). Even though many researchers have researched on construction productivity issues using different approaches, there is still a lack of consolidated proof of success in generating common insights for the industry, either from technology itself or a validation perspective. The underlying point of our study is to test the technological framework that selectively applies diverse context-aware approaches during the construction phase of a real scale module, and assess the productivity impact of them on this test bed through a series of experiments. In more detail, the following sections will present the preliminary design of the study, including four aspects: 1) developing the identification and localization of engineered components via sensor and tracker; 2) developing

ITcon Vol. 19 (2014), Hou et al., pg. 363
the automated progress check approach via laser scanning; 3) developing a smart information integration platform and visualization tool for construction work from BIM and AR, and 4) proposing a series of pilot experiments to investigate the productivity gains from a practical level. The next section situates the reader in the context of the extensive study of technology-supported practices on an LNG project as a baseline, and identifies the opportunities for better aiding the improvement of productivity via the listed technologies. Productivity measurement indicators reflecting labor performance are formulated. Finally, the conclusions summarize the findings of this study and suggest future efforts.
4. CONCEPTUAL FRAMEWORK OF IN-SITU TECHNOLOGIES This technological framework is underpinned by integrating ICT, BIM, AR, GPS-based RFID, laser scanning and other technologies. ICT is often used as an extended synonym for IT, but is a more specific term that stresses the role of unified communications for users to access, store, transmit, and manipulate information (Murray, 2011). In LNG construction, the development of a data management ICT system allows every participant to look more closely into the project information. BIM is technically comprised of a series of interconnected modules and databases, mainly serving for accessing the right information fast and with great efficiency. When schedule (4D) and cost (5D) information is incorporated, consolidated building information models are produced. AR can be used to visualize a facility in the context of the real workspace, to enable comparisons between ‘as built’ progress with ‘as planned’ (Wang et al., 2012). RFID uses radio frequency waves to transmit data between readers and tags. RFID has recently attracted significant attention in construction, in areas such as material tracking, quality control, equipment monitoring and inspection and maintenance (Chin et al., 2008; Wahab et al., 2010; Lin et al., 2014). Laser scanning is a useful tool in either accessing field data at a construction site or measuring data for an interior environment (Liang et al., 2013). A context-aware ICT platform based on mobile devices is considered to manipulate these technological entities, while the data can be converged and processed very conveniently and flexibly. The technological realization features using RFID as the main technology for real time assets tracking, AR as an innovative way of displaying modular construction in front of the assemblers’ viewpoint, and BIM + laser scanning as a dynamic progress check solution (Figure 1).
FIG. 1: The framework of real-time information acquisition and integration.
• central data management system (ICT system)
The data management system allows every user to look more closely into the project information. Data is intelligently linked to the mobile end-user platform (Fig. 2: ICT System-based Handheld Tablet). Users can

ITcon Vol. 19 (2014), Hou et al., pg. 364
access information from the equipment, including 3D models, smart photographs, videos, intelligent drawings and data sets, material status, even real time production information, and so on. Figure 2 demonstrates the ways of enhancing information communication by taking into account the interactions between the information source layers. Such information circulation is especially important for the LNG construction industry, as the projects in this industry are normally massive and involve a huge number of people working simultaneously. The inclusion of different information source layers in the framework process is a crucial breakthrough which will empower the communication between different specialties and professionals, laying a foundation for utilizing the mobile computing approach.
FIG. 2: Information layer communication for construction participants.
• real-time assets management (GPS + RFID + quick reference)
The real-time assets management tool uses a blend of GPS, RFID and other wireless technologies to track and monitor assets via the web-based platform that can be accessed via Wi-Fi from mobile devices. The assets can be conveniently managed at any time and at any place. This is especially significant to the oil and gas sector, for example, assets such as trucks, equipment, components and tools are constantly in motion during construction, and often in remote locations throughout the quite large construction site. The real-time tracking solution offers the assurance of always knowing where those assets are and when they are going to be in place. This solution also facilitates logistics. When ordered, the newly fabricated components will be in transit, the GPS-based RFID tags can help inform where they are from a global perspective (Figure 3). To ensure site safety, these tags can be also attached to moving workers and any hazardous objects. When the workers enter high-risk locations or hazardous materials are in transit, the web-based system can automatically give warnings to the central monitor. Using quick references, the construction worker can also retrieve the pre-defined information assigned with the assets such as part ID, attribute, technical drawings, etc. The ICT platform also embeds the RFID/QR reader, with which the user can acquire the right information by instant scan.

ITcon Vol. 19 (2014), Hou et al., pg. 365
FIG. 3: GPS-based RFID helps inform the location of LNG parts
• periodical progress check (laser scanning + BIM)
A solution for accurately, comprehensively and efficiently tracking the 3D status of LNG construction is very significant for boosting productivity. Initially, assessing progress in construction activities is time consuming and requires the use of specialized personnel (Yang et al., 2010). To address the time, error, cost, workforce and overall efficiency issues, our study formulates an automated progress check and quality control approach using 3D laser scanning and BIM. Laser scanners can be deployed on site before construction starts, so that in each construction milestone, the current construction status can be scanned and reflected from the point cloud models. The data can support decision-making regarding a complicated erection plan and also can support the presentation and comparison between the ‘as planned ’and ‘as-built’ progresses. ‘As-planned’ presentation shows the expected status of construction schemes, depending on whether the status of the parts are procured, in-transit, received-at-site, or installed. ‘As-built’ presentation shows the status of the actually installed parts on site. Figure 4 shows how laser-scanning approach is employed to compare the “as planned” and “as built” models. To the test bed, laser scanning can provide the high-density point cloud data, with which the installation progress and quality can be easily inspected by a contrast with the building information models. The scheduler could therefore supervise the actual schedule of construction. Further improvements are necessary to reduce the scanning cost, accelerate the registration process of multiple scans, and automate the processing of point cloud models to the irregular parts in the LNG site.

ITcon Vol. 19 (2014), Hou et al., pg. 366
FIG. 4: Use laser scanning to assess the completeness and quality of an as built module.
• animated construction progress simulation (AR)
In the practice of constructing LNG parts, isometric drawings are commonly used in construction assembly work. It is not usually the real scale and shapes along each axis of the pipes and fittings that reflect in isometric views. In this study, our treatment is to simulate a real assembly environment using AR, where the participants could assemble physical parts by following the optimized assembly sequence and path simulated under AR. The AR representation can be placed on mobile devices such as iPad or an intrinsically safe rubberized PC tablet. When being guided in this manner, the user could retrieve both real and virtual parts that can be spatially coincided in real time so that he/she can securely follow the predefined assembly clues such as sequence, path and safety precautions. The benefit of such a guiding approach has been investigated in our previous research work (Wang et al., 2012), which demonstrates the potentials in the context of down scale modular assembly, for instance, boosting productivity, reducing errors, time and improving workspace engagement and motivation.
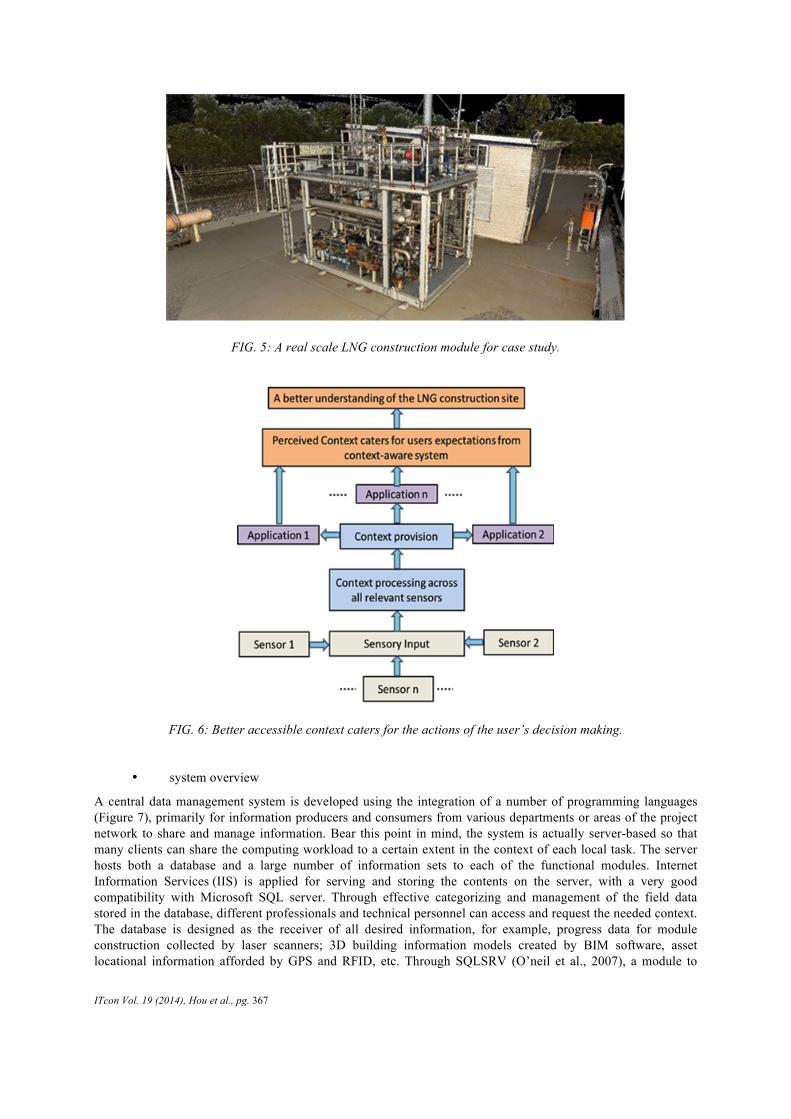
5. Case Illustration This section illustrates a case study that encapsulates the approaches of prototyping the system and the experimental design based on a real scale LNG construction scenario (Figure 5). The objective of the case study is to evaluate the feasibility of the proposed technologies at the practical level. At the practical level, the context-aware system prototype should be an accurate representation of the ambient information that caters for the users’ decision making. As the technological framework streamlines the information input by leveraging sensor-based channels to provide assets/workforce activities, it is believed that the right information could be accurately accessed for different users to implement different applications. That is why a better accessible context caters for the actions of the user’s decision making (Salmon et al., 2010) (Figure 6).
ITcon Vol. 19 (2014), Hou et al., pg. 367
FIG. 5: A real scale LNG construction module for case study.
FIG. 6: Better accessible context caters for the actions of the user’s decision making.
• system overview
A central data management system is developed using the integration of a number of programming languages (Figure 7), primarily for information producers and consumers from various departments or areas of the project network to share and manage information. Bear this point in mind, the system is actually server-based so that many clients can share the computing workload to a certain extent in the context of each local task. The server hosts both a database and a large number of information sets to each of the functional modules. Internet Information Services (IIS) is applied for serving and storing the contents on the server, with a very good compatibility with Microsoft SQL server. Through effective categorizing and management of the field data stored in the database, different professionals and technical personnel can access and request the needed context. The database is designed as the receiver of all desired information, for example, progress data for module construction collected by laser scanners; 3D building information models created by BIM software, asset locational information afforded by GPS and RFID, etc. Through SQLSRV (O’neil et al., 2007), a module to

ITcon Vol. 19 (2014), Hou et al., pg. 368
interact with PHP and SQL server, the system has realized a user interface that can accesses the server and also triggers off the AR application (AR models are loaded from the same server) (Figure 8). This is particularly crucial for the onsite construction work. By scanning the QR attached to each component, the standard attribute list can be triggered so the site workers can view the attributes of any objects such as pipe, screw, connector, reducer and so on. Meanwhile, AR context can be demonstrated to instruct the site workers of assembly sequence. The next phase of system developing work will enable the user to start other applications such as RFID, barcode/QR reading and laser scanning from the existing interface in order to achieve a high level of functional integration of the system.
FIG. 7: A framework of interaction between tiers.
FIG. 8: An overview of central data management system interface which demonstrates the main menu, AR model
and its attribute list. Left: maintenance instruction (‘Maintenance’ button is pressed); Right: report a problem (‘Problems’ button is pressed)
• real-time tracking
The RFID-based solution is enabled in this study for both assets real-time on-site tracking and global localization.

ITcon Vol. 19 (2014), Hou et al., pg. 369
The former is realized using a typical RFID system that includes pairs of antennas, transceivers (RFID readers) and transponders (Radio Frequency tags). The antennas generate electromagnetic zones where the RFID tags detect the activation signal and respond by sending the stored data from their memory through radio frequency waves. The hardware setup includes 4 FMR readers, 8 pairs of 12” patch antennas and a number of active and passive RFID tags, as stated in Figure 9. Figure 10 demonstrates an example of the graphical interface of the tracked items at 4 zones within the module. Signal can be created from either the active RFID tags or the RMR readers. Being enlarged by the RFID antennas, the signal can be backscattered between the readers and the tags. In order to estimate the distances between the readers and the tags within the system setup, an absolute Received Signal Strength Indication (RSSI) positioning algorithm is applied. Within the algorithm, the position of the tags is estimated down to pre-defined micro-zones based on the reference tags. The read-range of RSSI signals (signal strength) is tested to meet with the expectation, which is to ensure the site assets attached with RFID tags can be accurately traced. The entire system is also applied for yard management and automatic inventory update by attaching the tags to the assets and installing the readers nearby (in this study, RFID readers are positioned approximately 20 meters away from the warehouse). The assets manager equipped with a hand-held device is thus aware of the assets’ activities from the warehouse to the construction site.
FIG. 9: The demonstration of portable RFID system: GPS tags, passive tags, readers and pole antennas
FIG. 10: a) A graphical interface of the tracked items at 4 zones within the module.

ITcon Vol. 19 (2014), Hou et al., pg. 370
The emphasis of assets tracking is also placed on accurately monitoring the visibility of construction components throughout the supply chain. This could provide a better understanding of the issues associated with material availability at any project phase, including design, procurement, manufacture, transportation, installation, and operations and maintenance. This is realized by using GPS-embedded RFID tags and other wireless technologies (Snow and Ratcliff, 2010). This technological solution is especially prominent with the ability to remotely monitor the inventory assets from practically anywhere in the world. Like GPS, these tags could communicate with satellites at a specified frequency and operate entirely on batteries for several years (Figure 9). According to a web-based interface, the user could view the global location and other valuable information such as detailed history, velocity, run-time and sensor status (Figure 11). This means without any software to install, the user is able to dispatch and manage a large volume of assets remotely and efficiently. Here the example illustrates how the material coordinator used this interface to monitor the logistics of some ordered LNG parts from when they were fabricated in a warehouse in the USA:
1. Dashboard presents an overview of the assets status (Figure 11a). These assets were attached with GPS tags following fabrication in a warehouse in the USA. Every 8 hours (for this study, the time interval was set as every 8 hours), information was updated so the assets manager knew how many assets (Asset Flag Status) were fabricated, which assets were subject to which group (Asset Group Counts), the assets event (Recent Activity) and where the assets were (Asset Seen Recently, Asset Not Seen Recently).
2. Map tells where the assets were globally every 8 hours (Figure 11b). The drop-down box can filter the search by inputting a particular day. With the buttons ‘Zoom to Box’, ‘Find Nearest’ and ‘Box Search’, the positions of the assets (for example, asset ID: C-2) were very accurately told using latitude/longitude coordinates (for example, 47.69736/-117.19243).
3. List demonstrates the statistical information for all assets, including asset names, IDs, locations and so on (Figure 11c).
4. Reports Interface generates different formats of reports. When the ‘Asset Notes’ was clicked, an excel file (Days On Location By Assets) was generated (Figure 11d).
(a)

ITcon Vol. 19 (2014), Hou et al., pg. 371
(b)
(c)

ITcon Vol. 19 (2014), Hou et al., pg. 372
(d)
FIG. 11: The interface for real-time assets management.
• Progress check, quality control and constructability review
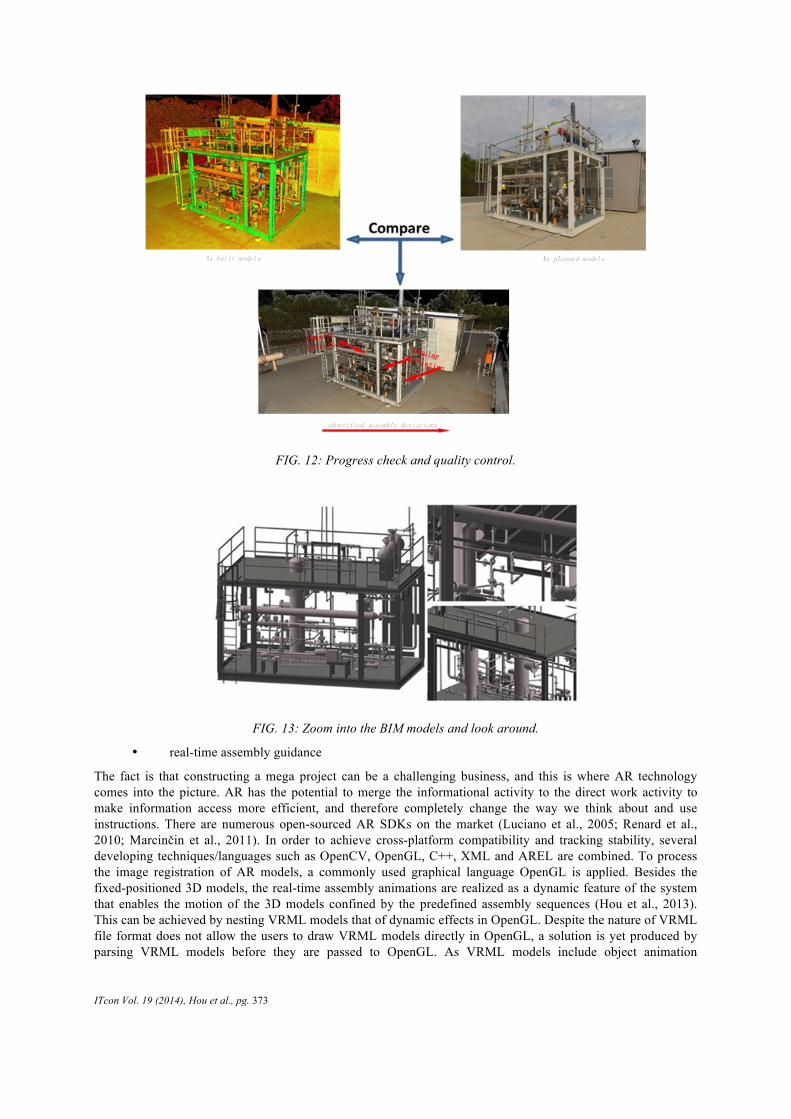
Data capture using laser scanning completely eliminates the need for surveyors to work on site. Coupled with high-speed 360° HDS scanners with high accuracy GPS and inertial technology, the laser scanning system generates the 3D point cloud data of the entire construction module (Figure 12). The mechanism of scanning uses a constant laser beam emitted from the scanners to scan the interior architectural structure, generating the detailed point cloud models of the facilities. The scanners are positioned in several locations within and outside the module. The module has been scanned several times at different construction milestones from different lines of sight. The scans are merged using the registration process and all the points on the object (not only those facing the scanner) are captured. The setup can measure the distance from the scanners to the targets (by calculating the amount of time it takes for the pulse of the laser to reach and return from objects), as well as the size. Using a panoramic point cloud view tool, the point cloud data can be manipulated over the web, e.g., view, pan, zoom, measure and markup. The setup delivers a safe and quick way of acquiring data (around 1 million points per second). The registration process performs optimal alignment transformations using to make sure that the targets used as constraints are aligned as closely as possible. The registration is completed by including the IDs of points and their x, y, z coordinates into a single file. Construction progress and quality at the milestone is assessed based on the comparison of object recognition results from the analysis of scans acquired on that date (as built information) and the 4D building information models at that day (as planned information) (Figure 12). The original LNG 3D models are created while a further refined schedule is generated in, for the purpose of constructability review. These smart BIM models allow you to move in, out and around the models (Figure 13). The user can also isolate layers of the structure, which is particularly useful when conducting safety, design and constructability reviews.
ITcon Vol. 19 (2014), Hou et al., pg. 373
FIG. 12: Progress check and quality control.
FIG. 13: Zoom into the BIM models and look around.
• real-time assembly guidance
The fact is that constructing a mega project can be a challenging business, and this is where AR technology comes into the picture. AR has the potential to merge the informational activity to the direct work activity to make information access more efficient, and therefore completely change the way we think about and use instructions. There are numerous open-sourced AR SDKs on the market (Luciano et al., 2005; Renard et al., 2010; Marcinčin et al., 2011). In order to achieve cross-platform compatibility and tracking stability, several developing techniques/languages such as OpenCV, OpenGL, C++, XML and AREL are combined. To process the image registration of AR models, a commonly used graphical language OpenGL is applied. Besides the fixed-positioned 3D models, the real-time assembly animations are realized as a dynamic feature of the system that enables the motion of the 3D models confined by the predefined assembly sequences (Hou et al., 2013). This can be achieved by nesting VRML models that of dynamic effects in OpenGL. Despite the nature of VRML file format does not allow the users to draw VRML models directly in OpenGL, a solution is yet produced by parsing VRML models before they are passed to OpenGL. As VRML models include object animation

ITcon Vol. 19 (2014), Hou et al., pg. 374
information in terms of indicators such as time and frame, a constant change on these indicators can produce a coherent representation of the AR animation in OpenGL. In this study, the optimum assembly sequence is first rehearsed and refined in a virtual 3D environment in BIM to ensure a safe and successful installation. Then the relevant information reflecting both assembly sequences and paths is visually demonstrated to the site workers via a head mounted display or hand-held devices. To perceptively cater for the viewpoint of site workers, the AR clues are adjusted to superimpose onto the positions after the physical counterparts are installed (Figure 14). The AR environments in LNG construction are based on a set of functionalities that can dynamically trigger the augmented models into our mobile devices via AR fiducial markers or 3D feature tracking (Gordon and Lowe, 2006). AR markers are normally attached on the peripheral structure such as girders and H bars. For the components with complex shapes within the module, 3D feature tracking triggers off the corresponding AR models by overlaying upon the model contour. Now the technician can hold his tablet and search the target in the real space. By clicking these AR components, the conjoint components pop up, so it well understood what to assemble then. Basically workers can review each step by going forwards or backwards in the animation. In this manner, workers can accurately and immediately recognize the interdependency of each installation step and therefore minimize the rework caused from picking the wrong component, choosing the wrong installation sequence, and adopting the wrong installation path.
FIG. 14: Display of AR assembly context: a) marker tracking; b) 3D feature tracking.
• Discussion
The case illustration identifies the viability of deploying the technological framework for meeting different purposes in different instances, for example, supply chain management, field work instruction, progress check, quality assurance/check, etc. Tentatively, the framework will achieve the productivity requirement by changing the conventional work flows and patterns. In particular, an integration of BIM platform and AR visualization can visually demonstrate the information layers without sacrifice human spatial awareness. Combining mobile devices with smart tags, the tracking systems are able to accurately trace the site assets and display their geometrical information for better awareness of location. With the animated AR assembly instructions, fitters can easily follow the predefined paths to assemble valves, vessels and pipes, and can get rid of the underlying conflicts and assembly errors, which in a sense can reduce rework significantly. To identify the productivity gain in a quantitative manner, future work will be conducted.
6. CONCLUSION AND FUTURE WORK Focusing on information processing and visualization perspectives, this paper studies the issues of the traditional manner of implementing construction activities. Although there are several widely adopted IT approaches and applications throughout the entire construction market, few of them maintain the realistic possibilities for providing and supporting LNG construction practices. Therefore, the key focus of this study is concerned with putting forward a conceptual framework that integrates advanced technologies including ICT, RFID, smart tag,

ITcon Vol. 19 (2014), Hou et al., pg. 375
laser scanning, BIM and AR in real LNG construction. A series of technological deployments are presented to describe how the framework can be used for reasoning the interdependences of tasks, spatial site layout of the to-be-built, project progress monitoring, linking digital to physical, material flow tracking and management, visualizing design during production and so on. In particular, the use of context-aware intelligent platform architecture provides a manner that is able to couple BIM and laser scanning data so that information about ‘as built’ and ‘as planned’ progress can be obtained and inspected visually. The tracking/sensing for context aware is deemed to be crucial for enabling information communication in an ICT system, but also for dynamic (real time) assets and supply chain planning management to occur. The features of advanced visualization such as AR can be fully utilized to improve the efficiency and effectiveness of onsite installation work.
As an ongoing study, this project has just manifested the potential to improve efficiency and productivity by delivering the right information to the right people at the right time. To empirically examine how the proposed integrated framework can promote substantial productivity and performance improvements to the workforce, experiments will be conducted on a real scale LNG module. The amount of labor time spent on constructing components on the lay down yard will be measured by a ratio. The number of components not correctly installed will also be calculated as a ratio. It is expected as a consequence of these productivity improvements, that widespread utilization of the framework will result in a significant positive benefit to cost ratio as well. Besides, more research works will be carried out in close collaboration with industrial personnel to gain real-life experience in understanding LNG construction & operations practices. The credibility of data collected from a real facility in terms of implementing the approach will also give insights for training a highly skilled construction workforce with ICT expertise in addressing real-world on-site challenges. Aiming to create predictable workflow for the LNG construction forming, the framework will be applied in more mega projects. Beyond improving productivity for oil and gas, it is envisaged this solution can also enhance safety and reliability and be readily applied to projects in other industries.
Despite the functionality of the framework has been preliminarily realized, there are still a few of technical and ethical issues that should be addressed in priori to an extensive deployment of the framework. Technically speaking, for example, when the focus is on a detailed workpiece, more detailed AR components should be shown with different level-of-details. In this sense, the stability of AR tracking and registration is challenged due to the constantly changing outdoor environments such as sunray and raining. When considering the differences with the conventional residential projects, the jobsite environment of LNG, features its harsh requirement on wireless signal coverage, there could be some places not covered by wireless signal, which causes difficulty in triggering the information from the server. To overcome a mismatch between the level of details between construction site and user side, the system interface should be improved to be more information critical, intelligent, and context-aware. Besides the technical obstacles, it is observed from our pilot study that contractors still tend to embrace their ‘comfort zone’ within which they unreflectively adopt tried and tested technologies rather than evaluate and adopt new technological solutions such as AR. Our work should also focus on ethical development and uptake of advanced tools by taking into account the social phenomenon associated with this. As there are multiple factors in LNG construction projects relating to rework, productivity and waste being discovered, the framework should be rigorously undertaken. In the next 2-3 years, the framework prototype will be tested by a series of experiments on site. The trials are designed to focus in particular on the productivity measurements of the labor activities throughout the project lifecycle. The trials will be conducted by comparing the traditional practice (applying paper-based 2D isometric drawings to direct construction activities on site) with this innovative new framework (as described in this report). There are 90 critical indicators that have been identified for evaluating task performance analysis, as per the table below (Table 1). This study carries out regular meetings between the research center and the LNG company. The weekly meetings aim to provide a platform for the academics and practitioners to update project progress and share case studies, data, and expertise. Via consulting with a large number of practitioners from the LNG projects, the lab eventually formulates the authentic breakdown structure of the performance measurement metric by taking into account the measurable variables related to work stages, environmental variables and ergonomics evaluation to create a comprehensive analysis. It is envisaged that most of these metrics will form part of future trials. There is also a need for a further research that can prolong the lifespan and magnify the effects of conducting construction activities using the framework throughout the project lifecycle and be capable of handling more complex cases that refer to productivity issues. It is envisaged that the rapid advancements in advanced technologies increase the demand for the proper use of the framework in future mega-projects.

ITcon Vol. 19 (2014), Hou et al., pg. 376
Table 1. Breakdown of Performance Measurement Metric Project Activities Productivity Indicators
Supply Chain Management:
1. Time to generate material delivery manifest 2. Total number of materials to be tagged with GPS RFID 3. Time to attach GPS RFID 4. Cost to attach GPS RFID 5. Average time to log assets information into delivery manifest (time / asset)
6. Total Man-Hrs saved 7. Expected labor savings 8. Productivity of knowing exactly what has been transported / arrived on-site 9. Time to locate assets per crew or per shift 10. Time delays in delivery to warehouse manager who is waiting for materials
Sign-off and Receipt
11. Time to track vehicle registration on/off site 12. Est. time saved through auto vehicle registration per on/off event 13. Total number of vehicles tracked 14. Average entries / exits per day per vehicle 15. Total Man-Hrs saved 16. Expected labor savings
17. Time to process arrival of materials/assets at the warehouse Est. time saved receiving material items on site
18. Time to update materials log when received on site 19. Level of risk when assessing material quality (ensure quality control) 20. Efficiency to access certification documents 21. Reduction in use of paper sheets to process handover
Assets Management in Warehouse
22. Time to tag assets with RFID 23. Number of assets to be tagged with RFID 24. Time to locate assets on warehouse for delivery to laydown yard 25. Est. time saved locating and updating BIM models
26. Delays in delivery to storage yard Time to update inventory 27. Reduction in use of paper sheets to process inventory 28. Total Man-Hrs saved 29. Expected labor savings
Assets Management in Laydown Yard
30. Time to locate material items on laydown yard for issue to work crews 31. Number of materials/assets that are not prepared for pickup from laydown yard
32. Time delays in delivery to workers who are waiting for installation 33. Total Man-Hrs saved 34. Expected labor savings
Site Installation
35. Productivity of knowing what has arrived on-site 36. Delays in construction activities waiting for materials 37. Time due to system use 38. Time due to materials searching 39. Time due to materials not prepared for pickup from laydown yard 40. Time to locate material items and corresponding position on site 41. Average time spent locating a material item with RFID 42. Work crews’ travel time 43. Time saved per material / shift 44. Time to locate supporting equipment 45. Time to collect work-in-progress information by tracking asset status 46. Est. time saved progressing construction status of a key asset
47. Percentage of total assets progress that can be tracked at a detailed level 48. Reduction in use of isometric drawings to process installation 49. Total Man-Hrs saved 50. Expected labor savings 51. Percentage of cases where RFID tags/3D PDF helps locate materials / assets on site 52. Cost for misplaced materials 53. Number of misplaced materials 54. Time to identify misplaced materials 55. Time to rectify misplaced materials 56. Reduction in use of paper sheets to process installation 57. Total Man-Hrs saved 58. Expected labor savings 59. Time saved per working shift (hrs)
Fit-Out / Commissioning
60. Time to locate equip per crew / per shift 61. Time saved per working shift 62. Est. time saved identifying asset in field and locating in BIM model 63. Time to collect data in the field
64. Reduction in use of paper sheets to process Fit-Out 65. Total Man-Hrs saved 66. Expected labor saving
Inspection and Maintenance
67. Level of flexibility in terms of service delivery and response times (if needed) 68. Level of streamlined access to engineering information during the testing and
inspection process 69. Average time spent tracking assets during operations 70. Time spent on tools operation 71. Time to collect data needed for maintenance 72. Time to track and locate facility assets requiring maintenance
76. Number of misplaced materials Time to identify misplaced materials 77. Time to rectify misplaced materials 78. Reduction in use of paper sheets to capture field notes for maintenance progress 79. Time to order, receive and handle replacement of assets (if needed) 80. Cost for misplaced materials Level of information communication in overall FM cycle 81. Time to locate equip per crew or per shift 82. Reduction in use of paper sheets to process FM

ITcon Vol. 19 (2014), Hou et al., pg. 377
73. Time to load the FM database 74. Est. time saved per asset in loading asset data into FM database 75. Time to perform maintenance activities on assets
83. Total Man-Hrs saved 84. Expected labor savings 85. Est. minutes saved identifying asset in field and locating in BIM model 86. Time to update BIM model

ITcon Vol. 19 (2014), Hou et al., pg. 378
ACKNOWLEDGEMENT The work presented in this paper was initiated by Mr. Martijn Truijens, the Lean Construction Technology Advisor, Woodside Energy Limited (WEL) as part of the Project Echo Construction Research initiative. Acknowledgement also goes to the Department of Innovation & Research of the Australian Government for co-funding this unique research work and the contributions of other Woodside professional experts to the study and developmental work that has been described and presented in this paper. The authors would also like to acknowledge companies Industrial Automation and Geoforce for their contribution of RFID knowledge and devices to this study.
DISCLAIMER The views expressed in this paper are the author’s personal views and are not attributable to Woodside. The paper is intended to be a general discussion and does not constitute advice. Information has not been verified by Woodside. No representation or warranty is made as to the accuracy, completeness or reliability of the information. All liability for any loss or damage incurred by any person as a result of using, acting on, relying on or disclosing any of the information contained in this paper or otherwise in connection with this paper is disclaimed.
REFERENCES Activities using MOST Analysis-A Case Study. Global Journal of Researches In Engineering, 13.
Adriaanse, A. and Voordijk, H. (2005). Interorganizational communication and ICT in construction projects: a review using metatriangulation. Construction Innovation: Information, Process, Management, 5, 159-177.
Azhar, S., Nadeem, A., Mok, J. Y. and Leung, B. H. (2008). Building Information Modeling (BIM): A new paradigm for visual interactive modeling and simulation for construction projects. Proc., First International Conference on Construction in Developing Countries, 435-446.
Berends, K. (2007). Engineering and construction projects for oil and gas processing facilities: Contracting, uncertainty and the economics of information. Energy policy, 35(8), 4260-4270.
Brynjolfsson, E., Hofmann, P. and Jordan, J. (2010). Cloud computing and electricity: beyond the utility model. Communications of the ACM, 53, 32-34.
Buyya, R., Yeo, C. S., Venugopal, S., Broberg, J. and Brandic, I. (2009). Cloud computing and emerging IT platforms: Vision, hype, and reality for delivering computing as the 5th utility. Future Generation computer systems, 25, 599-616.
Chand, S., Bapat, V. R., Hall, K. H., Morse, R. A., Owen JR, J. P., Pietrzyk, A. P., Somogyi, A. and Tinnell, K. A. (2008). Mobile RFID reader with integrated location awareness for material tracking and management. Google Patents.
Chi, H.-L., Kang, S.-C., Wang, X. (2013). Research trends and opportunities of augmented reality applications in architecture, engineering, and construction. Automation in Construction, 33, 116-122.
Chien, C.-F., Kim, K. H., Liu, B. and Gen, M. (2012). Advanced decision and intelligence technologies for manufacturing and logistics. Journal of Intelligent Manufacturing, 1-3.
Chin, S., Yoon, S., Choi, C. and Cho, C. (2008). RFID+ 4D CAD for Progress Management of Structural Steel Works in High-Rise Buildings. Journal of Computing in Civil Engineering, 22, 74-89.
Cleaver, P., Johnson, M. and Ho, B. (2007). A summary of some experimental data on LNG safety. Journal of hazardous materials, 140, 429-438.
Cohen, J. (1988). Statistical Power Analysis for the Behavioral Sciences: Lawrence Erlbaum.
Colwell, D. (2012). Improving risk management and productivity in megaprojects through ICT investment, available at ctca.unb.ca/ctca1/whitepaper.pdf.

ITcon Vol. 19 (2014), Hou et al., pg. 379
Dobkin, D. M. (2012). The RF in RFID: UHF RFID in Practice, Newnes.
Dong, A., Maher, M. L., Kim, M. J., Gu, N., and Wang, X. (2009). Construction Defects Management Using a Telematic Digital Workbench, Automation in Construction, 18 (6), 814-824.
Eastman, C., Teicholz, P., Sacks, R., and Liston, K. (2008). Frontmatter. BIM Handbook: A Guide to Building Information Modeling for Owners, Managers, Designers, Engineers, and Contractors, i-xiv.
Eastman, C., Teicholz, P., Sacks, R. and Liston, K. (2011). BIM handbook: A guide to building information modeling for owners, managers, designers, engineers and contractors, Wiley.
Ellis, M., Heyning, C. and Legrand, O. (2013). Extending the LNG boom: Improving Australian LNG productivity and competitiveness, Report, McKinsey Global Institute
El-omari, S. and Moselhi, O. (2008). Integrating 3D laser scanning and photogrammetry for progress measurement of construction work. Automation in Construction, 18, 1-9.
Enigeers Australia Western Australia Division. (2012). Recommended Practices for the Application of LEAN Construction Methods to Building New Australian LNG Capacity. http://www.engineersaustralia.org.au/sites/default/files/shado/Divisions/Western%20Australia%
Foss, M. (2007). Introduction to LNG, Center for Energy Economics, Energy Economics Research. The University of Texas at Austin, 1–40.
Gatti, U. C., Migliaccio, G. C., Bogus, S. M. and Schneider, S. (2013). An exploratory study of the relationship between construction workforce physical strain and task level productivity. Construction Management and Economics, 1-17.
Gordon, I., and Lowe, D. G. (2006). What and where: 3D object recognition with accurate pose Toward category-level object recognition. (pp. 67-82): Springer.
Goulding, J., Nadim, W., Petridis, P. and Alshawi, M. (2012. Construction industry offsite production: A virtual reality interactive training environment prototype. Advanced Engineering Informatics, 26, 103-116.
Han, S., Achar, M., Lee, S. and Peña-Mora, F. (2013). Empirical assessment of a RGB-D sensor on motion capture and action recognition for construction worker monitoring. Visualization in Engineering, 1(1), 1-13.
Hao, L.-J. and Gu, H.-M. (2011). Fast Generation of Drawing Based on Pro/E Secondary Development. Coal Mine Machinery, 2, 131.
Hartmann, T., Gao, J. and Fischer, M. (2008). Areas of application for 3D and 4D models on construction projects. Journal of construction engineering and management, 134, 776-785.
Hasan, M., Razib, S. and Karimi, I. (2009). Optimization of compressor networks in LNG operations. Computer Aided Chemical Engineering, 27, 1767–1772.
Havens, J. and Spicer, T. (2007). United States regulations for siting LNG terminals: problems and potential, Journal of Hazardous Materials, 140. 439–443.
Henderson, D., Pricewaterhousecoopers, L. and Mittl, R. (2012). Balanced Scorecards: The Integration Point between Enterprise Information and Performance Monitoring.
Hewage, K. N. and Ruwanpura, J. Y. (2009). A novel solution for construction on-site communication-the information booth. Canadian Journal of Civil Engineering, 36, 659-671.
Hou, L. and Wang, X. (2010). Application of augmented reality technology in improving assembly task proficiency. CD proceedings of the 10th international conference on construction applications of virtual reality, 4-5.
Hou, L. and Wang, X. (2011). Experimental Framework for Evaluating Cognitive Workload of Using AR System for General Assembly Task. Proceedings of the 28th International Symposium on Automation and Robotics in Construction.

ITcon Vol. 19 (2014), Hou et al., pg. 380
Hou, L. and Wang, X. (2013). A study on the benefits of augmented reality in retaining working memory in assembly tasks: A focus on differences in gender. Automation in Construction.
Hou, L., Wang, X. and Truijens, M. (2013). Using Augmented Reality to Facilitate Piping Assembly: An Experiment-Based Evaluation. Journal of Computing in Civil Engineering.
Jamil, M. G., Saxena, A. and Mr Vivek, M. (2013). Optimization of Productivity by Work Force Management through Ergonomics and Standardization of Process
Kang, Y., William, J. and Stephen, P. (2013). Value of It: Indirect Impact of It on Construction Project Performance Via Best Practices. Automation in Construction 35, 383-396.
Khalilpour, R. and Karimi, I. (2011). Investment portfolios under uncertainty for utilizing natural gas resources. Computers and Chemical Engineering, 35, 1827–1837.
Liang, J. Z., Corso, N., Turner, E. and Zakhor, (2013). A. Reduced-Complexity Data Acquisition System for Image Based Localization in Indoor Environments. International Conference on Indoor Positioning and Indoor Navigation
Lin, Y.-C., Cheung, W.-F. and Siao, F.-C. (2014). Developing mobile 2D barcode/RFID-based maintenance management system. Automation in Construction, 37, 110-121.
Lee, P. J. and Jeon, J. Y. (2013). Relating traffic, construction, and ventilation noise to cognitive performances and subjective perceptions. The Journal of the Acoustical Society of America, 134, 2765.
Leonardi, P. M. and Barley, S. R. (2010). What’s under construction here? social action, materiality, and power in constructivist studies of technology and organizing. The Academy of Management Annals, 4, 1-51.
Lin, W., Zhang, N. and Gu, A. (2010). LNG (liquefied natural gas): A necessary part in China's future energy infrastructure. Energy, 35, 4383-4391.
Luciano, C., Banerjee, P., Florea, L., and Dawe, G. (2005). Design of the ImmersiveTouch™: a high-performance haptic augmented virtual reality system. Paper presented at the Proceedings of the 11th international conference on human-computer interaction, Las Vegas, Nevada.
Marcinčin, J. N., Barna, J., Janák, M., and Fečová, V. (2011). Utilization of open source tools in assembling process with application of elements of augmented reality. Paper presented at the Proceedings of the 10th International Conference on Virtual Reality Continuum and Its Applications in Industry.
Momma, K. and Izumi, F. (2008). VESTA: a three-dimensional visualization system for electronic and structural analysis. Journal of Applied Crystallography, 41, 653-658.
Murray, J. (2011). Cloud network architecture and ICT, Modern Network Architecture, IT blogs.
O'neil, D. A., Welch, C., Arceneaux, J., Bulgatz, D., Hunt, M. and Young, S. (2007). Lessons Learned from Deploying an Analytical Task Management Database.
Park, C.-S., Lee, D.-Y., Kwon, O.-S., Wang, X. (2013). A framework for proactive construction defect management using BIM, augmented reality and ontology-based data collection template. Automation in Construction, 33, 61-71.
Paul, S. M., Mytelka, D. S., Dunwiddie, C. T., Persinger, C. C., Munos, B. H., Lindborg, S. R. and Schacht, A. L. (2010). How to improve R&D productivity: the pharmaceutical industry's grand challenge. Nature reviews Drug discovery, 9, 203-214.
Ren, Z., Anumba, C. J. and Tah, J. (2011). RFID-facilitated construction materials management (RFID-CMM)–A case study of water-supply project. Advanced Engineering Informatics, 25, 198-207.Renard, Y., Lotte, F., Gibert, G., Congedo, M., Maby, E., Delannoy, V. and Lécuyer, A. (2010). OpenViBE: an open-source software platform to design, test, and use brain-computer interfaces in real and virtual environments. Presence: teleoperators and virtual environments, 19(1), 35-53.
Sacks, R., Koskela, L., Dave, B. A. and Owen, R. (2010). Interaction of lean and building information modeling in construction. Journal of construction engineering and management, 136, 968-980.

ITcon Vol. 19 (2014), Hou et al., pg. 381
Saini, V. K. and Mhaske, S. Y. (2013). BIM An Emerging Technology in AEC Industry for Time Optimization, International Journal of Structural and Civil Engineering Research, 2, 195-200.
Salmon, P. M., Stanton, N. A., Jenkins, D. P., Walker, G. H. and Rafferty, L. (2010). Decisions, decisions… and even more decisions: evaluation of a digitized mission support system in the land warfare domain. Intl. Journal of Human–Computer Interaction, 26, 206-227.
Schwalbe, K. (2010). Information Technology: Project Management, Cengage Learning.
Sheehan, P. and Gregory, R. G. (2013). The Resources Boom and Economic Policy in the Long Run. Australian Economic Review, 46, 121-139.
Shi, J., Liu, J., Ning, R. and Hou, W. (2013). A Collisions Evaluation Method in Virtual Environment for Collaborative Assembly. Journal of Network and Computer Applications.
Shin, N.-J. (1996). A study of 2D-and 3D-oriented architectural drawing production methods. Automation in Construction, 5, 273-283.
Shin, D. H., Dunston, P. S., and Wang, X. (2005). View Changes in Mixed Reality-based Collaborative Virtual Environments. ACM Transactions on Applied Perception, Association for Computing Machinery (ACM), 2 (1), 1-14.
Siu, M.-F. F., Lu, M. and AbouRizk, S. (2013). Combining photogrammetry and robotic total stations to obtain dimensional measurements of temporary facilities in construction field. Visualization in Engineering, 1(1), 1-15.
Snow, E. and Ratcliff, D. (2010). GeoFORCE Texas: Six Years of Experience Turning Rural and Urban, Mostly-Minority High School Students into College Science Majors.
Stalhane, M., Rakke, J. G., Moe, C. R., Andersson, H., Christiansen, M. and Fagerholt, K. (2012). A construction and improvement heuristic for a liquefied natural gas inventory routing problem. Computers & Industrial Engineering, 62, 245-255.
Tanyer, A. M., and Aouad, G. (2005). Moving beyond the fourth dimension with an IFC-based single project database. Automation in Construction, 14(1), 15-32.
Wahab, M. H. A., Kadir, H. A., Tukiran, Z., Tomari, M. R., Mutalib, A. A., Mohsin, M. F. M. and Idrus, M. N. E. M. (2010). Web-based laboratory equipment monitoring system using RFID. Intelligent and Advanced Systems (ICIAS), IEEE, 1-5.
Wang, X. (2007). Using Augmented Reality to Plan Virtual Construction Worksite. International Journal of Advanced Robotic Systems, 4 (4), 501-512.
Wang, X. (2009). Augmented Reality in Architecture and Design: Potentials and Challenges for Application. International Journal of Architectural Computing, 7(2), 309-326.
Wang, X. and Dunston, P. S. (2007). Design, Strategies, and Issues towards an Augmented Reality-based Construction training Platform. Journal of Information Technology in Construction (ITcon), International Council for Research and Innovation in Building and Construction (CIB), Rotterdam, Netherlands, 12, 363-380.
Wang, X. and Schnabel, M.A. (eds.) (2009). Mixed Reality in Architecture, Design, and Construction, ISBN: 978-1-4020-9087-5, Springer-Verlag.
Wang, X., Gu, N., and Marchant, D. (2008). An Empirical Case Study on Designer's Perceptions of Augmented Reality within an Architectural Firm. Journal of Information Technology in Construction (ITcon), International Council for Research and Innovation in Building and Construction (CIB), Rotterdam, Netherlands, Vol. 13, 536-552.
Wang, X., Love, P. E. and Davis, P. R. (2012a). BIM+ AR: A Framework of Bringing BIM to Construction Site. Construction Research Congress, 1175-1181.

ITcon Vol. 19 (2014), Hou et al., pg. 382
Wang, X., Truijens, M., Hou, L. and Wang, Y. (2013). Application of Collaborative Mobile System in AR-Based Visualization, Data Storage and Manipulation. Cooperative Design, Visualization, and Engineering. Springer.
Wang, X., Love, P. E., Klinc, R., Kim, M. J. and Davis, P. R. (2012b). Integration of E–learning 2.0 with Web 2.0. Journal of Information Technology in Construction (ITcon), 17, 387-396.
Weems, P. R. and Hwang, M. (2013). Overview of issues common to structuring, negotiating and documenting LNG projects. The Journal of World Energy Law & Business, 6, 267-299.
Yang, J., Arif, O., Vela, P. A., Teizer, J. and Shi, Z. (2010). Tracking multiple workers on construction sites using video cameras. Advanced Engineering Informatics, 24, 428-434.
Zhang, S., Teizer, J., Lee, J.-K., Eastman, C. M. and Venugopal, M. (2013). Building information modeling (BIM) and safety: Automatic safety checking of construction models and schedules. Automation in Construction, 29, 183-195.
Zhu, Z. and Donia, S. (2013). Spatial and Visual Data Fusion for Capturing, Retrieval, and Modeling of As-built Building Geometry and Features. Visualization in Engineering, 1(1), 1-15.