ć ć - irc · ppda public procurement and disposal of public assets act (2003) ... uganda...
TRANSCRIPT

ć ć


CBO Community-Based Organisation
CLTS Community-Led Total Sanitation
CSO Civil Society Organization
DIM District Implementation Manual
DLG District Local Government
DP Development Partner
DWO District Water Office
FPO Focal Point Officer
HPMA Hand Pump Mechanics Association
JSR Joint Sector Review
JWESSP Joint Water and Environment Sector Support Programme
LG Local Government
LGMSD Local Government Management and Service Delivery Programme
LWI Living Water International
MDG Millennium Development Goal
MLG Ministry of Local Government
MoE Minstry of Education
MoFPED Ministry of Finance Planning and Economic Development
MoGLSD Ministry of Gender Labour and Social Development
MoH Ministry of Health
MoU Memorandum of Understanding
MWE Ministry of Water and Environment
NDP National Development Plan
NETWAS Network for Water and Sanitation
NGO Non-Governmental Organisation
O&M Operations and Maintenance

PEAP Poverty Eradication Action Plan
PPDA Public Procurement and Disposal of Public Assets Act (2003)
PPP Public-Private Partnership
QDA Qualitative Document Analysis
QIS Qualitative Information System
SIP Sector Investment Plan
SPR Sector Performance Report
SWAp Sector Wide Approach
SWSSB Subcounty Water Supply and Sanitation Board
TSU Technical Support Unit
UGsh Uganda Shillings
URWA Uganda Rainwater Association
UWASNET Uganda Water and Sanitation NGO Network
UWS Uganda Work Stream (of Triple-S)
WASH Water, Sanitation and Hygiene
WESWG Water and Environment Sector Working Group
WG Working Group
WSDF Water and Sanitation Development Facilities
WUC Water User Committee

The International Working Stream would like to acknowledge the support of the Uganda Working Stream for its assistance before, during and after the workshop, and all participants of the workshop, without which the scoring ladders refinement would not have been possible, as well as Ella Hayward, for her work coding the documents.

Policy and operational documents are continually revised. Following earlier studies of documents developed by international development partners of the Triple-S programme, a review of national water sector policy documents in Ghana and Uganda was undertaken to evaluate changes in policy over the course of the Triple-S country programmes.
In Uganda, policy documents were analysed for evidence of 10 principles, or building blocks, of sustainable service delivery in rural areas, using a combination of qualitative document analysis and qualitative information system methodologies. A comparison of baseline and current documents shows a slight improvement in addressing service delivery sustainability issues over the 10-year study period, 2004 to 2014. Although detail on implementing the service delivery approach remains low at the national level, some of the principles embodied by the 10 building blocks of sustainable service delivery are strongly represented in operational-level documents. In particular, the financial aspects of sustainable service delivery still need more attention in Uganda legislation. Certain aspects of rural water service delivery (such as harmonisation and coordination) have been consistently well addressed in Ugandan WASH legislation for the past 12 years, suggesting it is possible for other principles to receive the same level of attention.
Our results identify some discrepancies between what practitioners think should be standard and what is actually addressed in the policy. These gaps can be a starting point for discussions about how to make water service delivery more sustainable.
Triple-S (Sustainable Services at Scale), led by IRC, is a six-year, multi-country learning initiative to improve water supply to the rural poor. The initiative is currently operating in Ghana, Uganda, and Burkina Faso. Lessons learned from work in these countries feeds up to the international level, where Triple-S is promoting a re-appraisal of how development assistance to the rural water supply sector is designed and implemented.
In 2011, at the international level, Triple-S undertook a review of 11 major WASH development partners’ policy documents from 2008–2009, using a technique known as qualitative document analysis (QDA). The aim of this initial exercise was twofold: firstly, to evaluate the extent to which the principles of sustainability were reflected in these partners’ priorities at the start of the Triple-S programme (~2008), and secondly, to collect evidence to assess progress by which the effects of Triple-S could be measured at the end of the six-year period (2014). This was followed up by a review of ‘practice’ documents of those same development partners in 2012.
The QDA was then extended to two Triple-S countries, Ghana and Uganda, to assess the uptake of service delivery concepts in national-level policy and operational documents between 2008 and 2014. This report details the results of the QDA exercise for Uganda.

Qualitative document analysis (QDA) is a research method used to analyse written documents in a rigorous and systematic way (Wesley, 2011). In Triple-S, this research method has been used to investigate how sustainability of rural water service delivery is addressed in water, sanitation and hygiene (WASH) policies and strategies.
The QDA process has explicit steps (Altheide, 1996): (a) setting criteria for the selection of documents, (b) collecting documents, (c) articulating main areas of analysis, (d) coding the documents, (e) verifying preliminary results and (f) analysing the findings. QDA allows an impartial, concrete and thorough analysis of written documents: Impartial: conclusions are made based on what is written in the document. A second validator
ensures that the conclusions are fair and well justified. Concrete: the actual text of policy documents is quoted and analysed so that researchers can
evaluate the policy. Thorough: each document is analysed for strengths and weaknesses using a framework of
principles for sustainable water service.
Analysis is considered ‘dependable’ if another reader would have reached the same general conclusion about the same set of documents under similar conditions.
For the WASH sector, QDA has two major uses: Engagement. With concrete evidence of the strengths and weaknesses of a policy, and
information about why that is important, development partners can engage policy makers in improving future policies.
Tracking changes over time. Analysis of documents released in 2008 and updated documents released in 2012–2013 reveals the extent of progress.
Modifications to the method were made after feedback from the first two QDA exercises carried out in 2011–2012. Firstly, a scoring system (qualitative information system ladders, described below) was developed for each building block of sustainable service delivery. Secondly, a workshop in Uganda was convened in February 2014 to refine the building blocks and advise on document selection. (Workshop participants are listed in the Annex, Section 6.7.)
QDA has certain limitations. It cannot show how a policy was developed, is implemented, or will be changed in the future. It examines only what is written in the documents under review. Selection of documents with sufficient level of detail is therefore critical. In addition, even if the documents describe actual practice, QDA does not assess actual practices and is not a substitute for a field visit. However, the findings (i.e., what the policy documents actually say and omit) can be used as a platform for stakeholder interviews or other qualitative research to better understand policy processes.
Triple-S is encouraging the WASH sector to shift from implementing stand-alone projects and building infrastructure to delivering sustainable water service. A study of 13 country sectors carried out at the beginning of the Triple-S project identified 10 principles, or building blocks, of service delivery that are critical to this shift (Lockwood and Smits, 2011).

The building blocks became the framework for the QDA analysis and were adapted to reflect the Uganda sector’s practice, terminology and priorities. During the February 2014 workshop, groups of five to six practitioners from the Uganda WASH sector customised the 10 building blocks to the local context and language. Results were refined in plenary sessions in a two-day process. Table 1 presents the results.
Feedback from the first two rounds of analysis (2011–2012) at the international level indicated that the QDA methodology’s scoring criteria needed better definition and transparency, to be achieved through a qualitative information system (QIS). This is a technique for quantifying otherwise qualitative information with the help of progressive scales, or ladders (Wijk-Sijbesma, 2002). Each of the four steps on the ladder represents a condition or characteristic, and all four conditions together represent the ideal situation (Table 2). In this way, qualitative indicators,

such as participation and inclusiveness, and outcome indicators, such as behavioural change, can be ranked. (For more detail about QIS, see the Annex, Section 6.5.)
For the QDA exercise in Uganda, the QIS ladders were developed in the workshop. Participants defined the criteria to reflect the concerns of the national WASH sector. The benchmark was calibrated to what practitioners would consider a minimum level of sustainable service delivery.
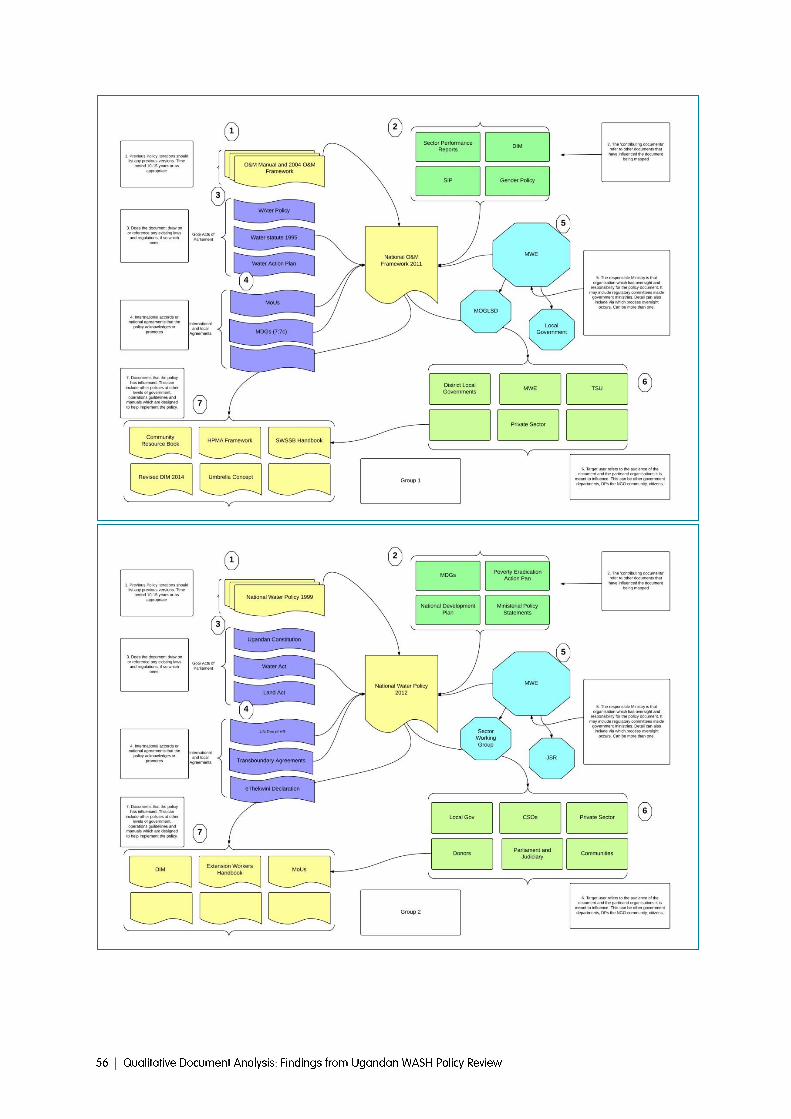
A document mapping exercise was carried out during the February 2014 workshop. In groups, participants analysed the relationships and functions of selected WASH sector documents. The aims were to assist in the document selection process and to clarify present and past versions of documents and their function.
The exercise explored seven areas: Previous iterations of the document Contributing documents that had direct or indirect influence Laws and regulations that the document draws on International accords and agreements that the document references Ministry responsible for oversight of the document Target users of the document Other documents influenced by the document
Figure 1 is an example of a document map.

Twelve documents were mapped in this way:
National Water Policy National Framework for Operation and Maintenance of Rural Water Supplies Water and Sanitation Sector District Implementation Manual Joint Water and Sanitation Sector Performance Report Joint Water and Environment Sector Support Programme Water and Sanitation Sectoral Specific Guidelines Memorandum of Understanding between Local Government and Ministry of Water and
Environment Water and Sanitation Sub-Sector Gender Strategy Improved Sanitation and Hygiene Financing Strategy Local Government Assessment Reports Public Procurement and Disposal of Public Assets Authority’s Guidelines on Procurement
Document maps are given in the Annex, Section 6.8.

A total of 23 documents were found to be important in Ugandan WASH sector and selected for the analysis. The selected documents comprised a baseline group and a current group. The baseline group consists of documents released between 1999 and 2010 (two years into the Triple-S project). The current documents were released from 2010 onwards. Of the 23 documents, 18 were paired (i.e., there were previous and current versions of the document) and five were stand-alone (i.e., no previous or successor version existed) (Table 3).
The following sub-section presents general findings from the comparison of paired documents. (Detailed analyses of baseline and current documents are given in the Annex, Sections 6.2 and 6.3.)
The overall results show that harmonisation and coordination is well addressed in most of the analysed documents, with an average of score 3.3 out of 4 for the 23 documents. Least-addressed building blocks—those that on average scored below the benchmark—were asset management (score of 1.7) and financing to cover all life-cycle costs (score of 1.8). The average scores for the whole set of documents are presented in Figure 2.

2.0 2.2
2.4
2.0 2.1
2.4 2.2
1.9
2.5
2.9 3.0
0.0
1.0
2.0
3.0
4.0
1999 2004 2005 2007 2008 2009 2010 2011 2012 2013 2014
Average QIS Scores per year
2.7
2.3
2.5
3.3
2.5
2.5
2.0
1.7
2.6
1.8
0.0 1.0 2.0 3.0 4.0
1. Professionalisation of community management
2. Recognition and promotion of alternativeservice provider options
3. Monitoring service delivery and sustainability
4. Harmonization and coordination
5. Direct support to service providers
6. Capacity support to service authorities
7. Learning and adaptive management
8. Asset management
9. Regulation of rural services and serviceproviders
10. Financing to cover all life-cycle costs
Further analysis of average scores per year shows a positive trend (Figure 3), with an average score of 2.0 in 1999 and 3.0 in 2014. The only score below the benchmark in recent years was for 2011, when the Clients Charter was published. This particular document, although important for the sector, focuses on client relations between the service provider (Ministry of Water and Environment) and users. The nature of the document meant that it received low scores, which pulled down the average for 2011.

2.5
2.1
2.3
3.2
2.5
2.4
1.5
1.7
2.6
1.9
2.8
2.6
2.7
3.4
2.4
2.6
2.5
1.7
2.6
1.6
0.0 1.0 2.0 3.0 4.0
Average of 1. Professionalisation of communitymanagement
Average of 2. Recognition and promotion ofalternative service provider options
Average of 3. Monitoring service delivery andsustainability
Average of 4. Harmonization and coordination
Average of 5. Direct support to service providers
Average of 6. Capacity support to serviceauthorities
Average of 7. Learning and adaptive management
Average of 8. Asset management
Average of 9. Regulation of rural services andservice providers
Average of 10. Financing to cover all life-cyclecosts
current baseline
Analysis of the two groups of documents (Figure 4) shows an overall positive trend except for financing to cover all life-cycle costs and direct support to service providers. Asset management and financing to cover all life-cycle costs received the lowest average scores in both sets of documents. Learning and adaptive management saw the biggest change, from 1.5 in the baseline group to 2.5 in the current documents. Recognition and promotion of alternative service provider options also improved, from 2.1 to 2.6, as did monitoring service delivery for sustainability, whose score increased from 2.3 to 2.7.
The improved score for professionalisation of community management (from 2.5 to 2.8) can be attributed to the decision to pilot and implement support structures (e.g., hand pump mechanics associations, sub-county water supply and sanitation boards, and capacity building on gender issues in WASH) as well as the development and professionalisation of the local private sector and the development of public-
private partnership (PPP) arrangements. All these issues are well addressed in newer policies.

The increase in the average score for recognition and promotion of alternative service provider options (from 2.1 to 2.6) is due to increased recognition of different models of self-supply and different technologies related to it, as well as promotion of PPP.
The average score for monitoring service delivery and sustainability saw a slight increase (from 2.3 to 2.7). After 2012 this building block received high scores because the government is piloting a more holistic approach through two initiatives: development of service delivery indicators, and real-time data collection on functionality to reduce facilities’ out-of-service time.
2.0
3.0
4.0
3.0
2.0 2.3
2.0 2.0
3.0 3.0
3.5
0
1
2
3
4
2.0 2.0 2.0 2.0
3.0
2.0 2.0
1.0
3.3
2.5
3.5
0
1
2
3
4
2.0 2.0
1.0
2.0
3.0
2.5
2.0
1.5
3.0 3.0
3.5
0
1
2
3
4

2.0
3.0 3.0 3.0
2.0 2.3 2.5 2.5
2.0
2.5
3.3
0
1
2
3
4
Harmonisation and coordination scores were consistently high. The average score increased in the current set of documents (from 3.2 to 3.4) because of evidence that financing is being channelled through common funding mechanisms and that the government is implementing a fiscal decentralisation strategy.
Direct support to service providers scores fell slightly (from 2.5 to 2.4) and show a slightly negative trend for the whole set of documents. Although the importance of direct links between capacities at the local government and service provider level was acknowledged, no further references to this principle were found in any of the analysed documents. It remains unclear whether support will be on a supply or on-demand basis, and which agencies will be involved.
The average score for capacity support to service authorities rose slightly (from 2.4 to 2.76). Although a capacity development strategy was adopted in November 2012, only two of the four documents from 2013–14 refer to it when referencing building the capacities of service authorities.
3.0 3.0 3.0 3.0 3.0
3.6
2.5 2.5
3.8 3.5 3.8
0
1
2
3
4
2.0
1.0
3.0
2.0 2.0
2.6
3.0
2.5
2.0
3.3 3.0
0
1
2
3
4
1999 2004 2005 2007 2008 2009 2010 2011 2012 2013 2014

The average learning and adaptive management scores rose significantly for the current group of documents (from 1.5 to 2.5). This building block is showing rapid progress, with scores either at benchmark or higher for post-2009 documents. The sector appears vibrant in learning and sharing. However, some regular events (e.g., Joint Sector Reviews, Local Government Budget Framework Paper regional consultative workshops, Water and Environment Sector working group meetings, bi-annual inter-district meetings) may be for coordination purposes only. In addition, more structure is needed in terms of defining roles among partners and ensuring resources to sustain learning platforms and alliances, especially at regional and local levels and in the NGO sector.
Asset management received the same below-benchmark score for both sets of documents (1.7), showing persistent lack of attention to this issue in the policy documents.
1.0 1.0 1.0
0.0
1.0
2.2 2.0 2.0
2.3
3.5
2.0
0
1
2
3
4
1999 2004 2005 2007 2008 2009 2010 2011 2012 2013 2014
1.0
3.0
2.0
1.0 1.0
1.5 1.5 1.5 1.5
3.0
2.0
0
1
2
3
4
1999 2004 2005 2007 2008 2009 2010 2011 2012 2013 2014

Regulation of rural services and service providers scored the same for both sets of documents (2.6). The above-benchmark average score indicates that the rural water service sector is relatively well regulated in Uganda.
Financing to cover all life-cycle costs scores fell for the current set of documents (from 1.9 to 1.6), which offered fewer details about financial planning tools. In general, less attention is given to financial planning for rural water service delivery in the more recent documents.
Some building blocks were consistently well addressed and scored above the benchmark over the whole period (1999–2014):
1. Professionalisation of community management 2. Harmonisation and coordination 6. Direct support to service providers 7. Regulation of rural services and service providers
Building blocks that need more attention are asset management and especially financing for all life-cycle costs, for which scores are lower in recent policy documents.
When paired documents are compared, most show improvement over time (for more details, see the Annex, Section 6.4). Table 4 provides an overview of positive and negative changes in average QIS scores for each pair of documents.
3.0
2.0
3.0
2.0 2.0
2.8 2.5
2.0
2.5
3.0 3.0
0
1
2
3
4
1999 2004 2005 2007 2008 2009 2010 2011 2012 2013 2014
2.0 2.0 2.0 2.0 2.0 1.8
1.5 1.5 1.8
1.5
2.0
0
1
2
3
4
1999 2004 2005 2007 2008 2009 2010 2011 2012 2013 2014

Key: + positive change; ++ significant positive change; – negative change
Building blocks that show the most positive change across the paired documents are as follows:
1. Professionalisation of community management 2. Recognition and promotion of alternative service provider options 3. Capacity support to service authorities 4. Learning and adaptive management
Three documents showed the most positive change across 10 building blocks, compared with their predecessor documents:
Water and Sanitation Sector District Implementation Manual (2014) Joint Sector Review Report (2012–13) Joint Water and Environment Sector Support Programme (2012)

Although the QDA methodology proved useful for this exercise, it relies solely on what is written in the documents. To address this limitation, the next round of analysis should include interviews with policy makers to clarify the issues and triangulate data.
QIS ladders helped achieve scoring transparency because the criteria were determined by consensus among stakeholders. However, in some instances, the benchmark was perhaps set too high, resulting in low scores for certain building blocks.
This indicates that in practice, the benchmark condition as defined by water professionals in Uganda might not be shared by policymakers. This and other gaps—between what implementers consider important and what policymakers have written—can open dialogue about the building blocks of sustainable service delivery that need more attention, in particular, financing for life-cycle costs, asset management and direct support to service providers.
Results also show that certain aspects of rural water service delivery are consistently well addressed in Uganda’s policy documents. For example, the Sector-Wide Approach was adopted in Uganda in 2002, and in 2014, 12 years later, it is still receiving attention. This suggests that given similar levels of attention, the challenges to sustainability of service delivery can be addressed.

The following documents on the WASH sector in Uganda were selected for analysis.
Baseline documents
1999. The National Water Policy. MWE, Government of Uganda.
2004. A National Framework for Operation and Maintenance of Rural Water Supplies. MWE, Government of Uganda.
2007. Water and Sanitation Sector District Implementation Manual. MWE, Government of Uganda.
2009. Joint Water and Environment Sector Support Programme (2008–2013). MWE, Government of Uganda.
2009. Strategic Sector Investment Plan for the Water and Sanitation Sector in Uganda (2009-2014). MWE, Government of Uganda.
2009. Water and Sanitation Sector Performance Report. MWE, Government of Uganda.
2009. Water and Sanitation Sector Performance Report Minutes of Meeting. MWE, Government of Uganda.
2009. NGOs in the Ugandan Water and Sanitation Sector Performance Report for FY 2008/09. Uganda Water and Sanitation NGO Network (WASNET).
2010. Ministerial Policy Statement for Water and Environment FY 2009/2010. MWE, Government of Uganda.
2010. Sectoral Specific Schedules/Guidelines 2009/10. MWE, Government of Uganda.
Current documents
2010. Water and Sanitation Sub-Sector Gender Strategy (2010–2015). MWE, Government of Uganda.
2011. Clients Charter, MWE, Government of Uganda.
2011. National Framework for Operation and Maintenance of Rural Water Supplies in Uganda. MWE, Government of Uganda.
2012. Joint Sector Performance Report. MWE, Government of Uganda.
2012. Joint Sector Review Minutes. MWE, Government of Uganda.
2012. Ministerial Policy Statements 2012/2013. MWE, Government of Uganda.

2012. Water and Sanitation Sector Sectoral Specific Guidelines 2012/2013. MWE, Government of Uganda.
2012. Water and Sanitation Sector Sectoral Specific Guidelines 2012/2013. MWE, Government of Uganda.
2013. Joint Sector Performance Report. MWE, Government of Uganda.
2013. Joint Water and Environment Sector Support Programme (2013–2018). MWE, Government of Uganda.
2013. Ministerial Policy Statements 2012/2013. MWE, Government of Uganda.
2014. Water and Sanitation Sector District Implementation Manual. MWE, Government of Uganda.
2013. NGOs in the Ugandan Water and Sanitation Sector Performance Report for FY 2012/13. Uganda Water and Sanitation NGO Network (WASNET).

The baseline group consists of documents released between 1999 and 2010 (two years into the Triple-S project). Table 5 presents an overview of QIS scores per building block for each document, as well as average scores and medians. Scores below the benchmark (the minimum standard for sustainable service delivery) are shaded red; the highest scores are shaded blue.

The average score for all documents selected in the baseline group is 2.3, which is above the benchmark level set by the QIS indicators. The median score is also 2.3. The highest-scoring document is the 2009 Strategic Sector Investment Plan for the Water and Sanitation Sector in Uganda (2009–2014), with an average score of 2.7. The lowest is the 2009 Joint Sector Review Minutes, with an average score of 1.9, followed by the 1999 National Water Policy and 2007 Water and Sanitation Sector District Implementation Manual, both scoring 2.0. Average scores by building block are presented in Figure 15.
The building block that scored the highest in the baseline documents is harmonisation and coordination (3.2 out of 4), followed by regulation of rural water service and service providers, direct support to service providers and professionalisation of community management, which all scored the same (2.5). Building blocks that scored lowest were learning and adaptive management (1.5), asset management (1.7) and financing to cover all life-cycle costs (1.9).
On average, this building block scores 2.5, and all documents score above the benchmark. The baseline documents all referred to structures, roles and responsibilities of community-based management committees, as well as strengthened committee capacity with approved by-laws or ordinances
The link between community capacity and functionality of water points is emphasised in many documents. For example, according to Water and Sanitation Sector Performance Report Minutes of Meeting (MWE, 2009) “A revitalised Community Based Maintenance System (CBMS) has been implemented, leading to the improved functionality of water points in 50% of the districts”. According to Water and Sanitation Sector Performance Report (MWE, 2009), in order to ensure success, district local governments are required to regularly follow up communities to guide and
2.5
2.3
2.2
3.1
2.6
2.4
1.5
1.8
2.5
1.9
0.0 1.0 2.0 3.0 4.0
1. Professionalisation of communitymanagement
2. Recognition and promotion of alternativeservice provider options
3. Monitoring service delivery andsustainability
4. Harmonization and coordination
5. Direct support to service providers
6. Capacity support to service authorities
7. Learning and adaptive management
8. Asset management
9. Regulation of rural services and serviceproviders
10. Financing to cover all life-cycle costs

support them to effectively carry out their roles and responsibilities with respect to their improved water supply and sanitation facilities.
This building block also scores above the benchmark1 (2.3 out of 4) for the baseline documents because of the recognition of the benefits that self-supply can have, especially in water-scarce areas. All documents say that the concept has been promoted by the Ministry of Water and Environment, as well as the Ministry of Education and Sport (MWE, Sectoral Specific Schedules/Guidelines 2009/10, 2010; MWE, Joint Water and Environment Sector Support Programme (2008 - 2013), 2009; MWE, Water and Sanitation Sector Performance Report, 2009). In addition, evidence of the government effort to scale up the approach in several districts was found in several documents.
Although different technologies are mentioned, rainwater harvesting is the predominant method addressed in all documents analysed. It has been recognised however, that the sector needs additional regulation in this respect: “Uganda Rainwater Association (URWA) notes that the advancement of rainwater harvesting is hampered by the lack of complementary policies and legislation at district and national levels” (UWASNET, 2009).
This building block scored 2.2 out of 4, which is above the benchmark2, confirming that Ugandan monitoring system with defined indicators is often referenced in documents. The National Water Policy (2009) defines roles in the process: “Monitoring and evaluation of the performance and management of schemes will be done routinely by the Central Government and districts authorities…. Monitoring and evaluation of the general trend in sector development efforts and water supply coverage levels will be established in the Directorate of Water Development and appropriate capacity established at the district and lower levels of governance”.
Monitoring is well organised in Uganda: “Every year the water and sanitation sector compiles a Sector Performance Report (SPR) to measure the sector’s performance and guide in planning for the subsequent year. The focus of the report is the ten golden indicators. Information from the Districts serves as a basis for the analysis of these indicators... DWD may request Districts to carry out a number of specific surveys relating to the the golden indicators in order to improve quality of reporting… The Districts may budget for this activity under the category referred to as “Monitoring” in the attached format for the annual work plan. The expenditure has to be clearly justified…” (MWE, Sectoral Specific Schedules/Guidelines 2009/10, 2010)
Adaptive management and improvement of the monitoring approach (and system) were described in the Water and Sanitation Sector Performance Report 2008:
“Over the past decade MWE has undertaken several initiatives to improve information management related to water supply and sanitation. Currently, two activities are in progress:
1. Revitalisation of Water Supply and Sanitation Management Information System (MIS) involves assessing constraints, redefining the vision and strengthening capacity for data management in the sector. In FY 2007/8 the focus has been on sub‐sector specific databases. In this regard

MWE has improved the information flow between local and central governments through a revised reporting system for the DWSCDG. Data collection, validation and dissemination strategies have been formulated for rural water supplies and water for production. Baseline surveys have been carried out for water for production and urban water supplies. The tools used to store, process and analyse data are being upgraded.
2. Revise performance measurement framework. The 2006 Joint Sector Review resolved to “Revise sector performance measurement framework, the criteria and the way it defines, establishes, validates and harmonises information regarding access to and use of safe water and sanitation in Uganda” as one of its undertakings. This has been undertaken over the last two years and has resulted in new definitions and calculation methods for five of the Golden Indicators. These will take effect from FY 2008/9 and thus be reported on in the 2009 Sector Performance Report.”
This building block scored quite high, 3.2 out of 4, which indicates that considerable attention is given to this issue in Uganda. All baseline documents refer to the Sector Wide Approach (SWAp) established in Uganda: “SWAp framework for the sector was adopted in September 2002. It is a mechanism whereby Government, civil society and development partners support a single policy, development plan and expenditure programme, which is under Government leadership and follows a common approach” (MWE, A National Framework for Operation and Maintenance of Rural Water Supplies, 2004; MWE, Sectoral Specific Schedules/Guidelines 2009/10, 2010; MWE, Water and Sanitation Sector Performance Report, 2009).
At the national level, NGOs and community-based organisations (CBOs) coordinate within UWASNET and contribute through it to the SWAp framework. According to the Joint Water and Environment Sector Support Programme (MWE, 2009), district water and sanitation coordination committees have been established at the district level. Their membership consists of administrative and political leaders, technocrats and NGO/CBO representatives. The role of the committees is to oversee the implementation of programmes and to strengthen collaboration and coordination with other sectors such as health, education, social development and agriculture. The private sector, NGOs and CBOs and other civil society players are all important stakeholders in implementation and follow-up.
Evidence of implementation of the Fiscal Decentralisation Strategy was also found in several documents.
Direct support to service providers scored above benchmark3, 2.6 out of 4, for the baseline documents. Roles are sufficiently well described in relation to the decentralised sector. Emphasis is primarily on activities for capacity building for service delivery at a local level: “Software toolkits are used to provide training to water user committees (WUCs), communities and primary schools (where applicable) on SWAP, Gender Task Analysis, Gender Resources, Community Mapping, Participatory Monitoring. The following members of the private sector have received training: hand-pump mechanics, scheme attendants (for piped systems), water source caretakers (trained with basic skills in preventive maintenance, record keeping, clearing the drainage channel and protecting the catchment area (springs and gravity schemes) and detecting leakages of pipes (gravity flow scheme)” (MWE, Sectoral Specific Schedules/Guidelines

2009/10, 2010). “For issues related to the low functionality of water facilities, the planned actions for the FY2009/10 are to: Design and develop a database for functionality; Train water user committees/boards; Establish a spare parts supply chain; and Train village level pump mechanics and artisans” (MWE, Ministerial Policy statement for Water and Environment FY 2009/2010, 2010).
Evidence of establishment of umbrella organisations at a regional level was also found, providing some clarity about which bodies will provide support. According to Strategic Sector Investment Plan for the Water and Sanitation Sector in Uganda (MWE, 2009), these organisations’ principal objective is providing operation and maintenance back-up support. They should provide training, technical, legal and organisational support to their member water boards, including specific services such as the supervision of rehabilitation and extension works and water quality monitoring.
Capacity building to service authorities scored 2.4 out of 4, which is above the benchmark level4. The Directorate of Water Development carries out the principal role and is “responsible for regulation of provision of water supply and sanitation and the provision of capacity development and other support services to Local Governments, Private Operators and other service providers” (MWE, Water and Sanitation Sector Performance Report, 2009).
In 2002, technical support units (TSUs) have been established as a short-term intervention by the Directorate of Water Development to “help Districts build the capacity required to implement their roles, with a particular focus on sustainability” (MWE, A National Framework for Operation and Maintenance of Rural Water Supplies, 2004). However, these bodies became permanent and in charge for capacity building and technical support for authorities at the district and local level (MWE, Sectoral Specific Schedules/Guidelines 2009/10, 2010).
Evidence of continuous and funded support through TSUs was found in this set of documents: “Capacity building support will be provided by integrated and holistic technical support units (TSUs) and funded through the SPS component” (MWE, Joint Water and Environment Sector Support Programme (2008 - 2013), 2009). However, it appears that sufficient funds are not yet available to bridge the capacity gap. In addition, it is often assumed in the documents that district-level capacity is sufficient to deal with local issues, but this is not verifiable.
This building block scored below the benchmark5 (1.5 out of 4). Evidence of the need to have a decentralised learning and adaptive management system in place was found in the documents: “There is the need to share information and facilitate discussion on the costs (investment and maintenance) and management and maintenance implications of the different technologies” (MWE, A National Framework for Operation and Maintenance of Rural Water Supplies, 2004); furthermore, “NGOs increasingly recognise the need to share information and improve coordination in their various levels of operation, a) between NGOs and government actors at central and local levels (e.g. District Water Offices); b) among NGOs – at central and local level, and between humanitarian and development NGP interventions; and c) among UWASNET

regions – in order to avoid duplication and increase efficiency and effectiveness of interventions” (UWASNET, 2009).
Another reason why this building block scored low was the lack of commitment from different sector players to resources for learning and adaptive management was found.
This building block scored below the benchmark6 (1.8 out of 4). Most of the baseline documents made reference to planning for minor and major repairs. Occasionally there was evidence of a clear mechanism or a standard for response time.
Roles for asset management were defined:
“Local Governments share their responsibilities for implementation and O&M with the users/ customers, with whom they closely cooperate” (MWE, Joint Water and Environment Sector Support Programme (2008 - 2013), 2009).
“The Sub-County Water and Sanitation Committees (SWSC) are responsible for initial resource allocation, and should support establishment of private hand-pump mechanics and spare parts dealers. These private practitioners may then assist the WSCs with maintenance tasks beyond their capability.
The District Water Office (DWO) should monitor operation and maintenance performance and provide back-up support.
Rehabilitation and major repairs of boreholes are to be carried out by a Borehole Maintenance Unit (BMU)” (MWE, A National Framework for Operation and Maintenance of Rural Water Supplies, 2004).
“There must be a 3-year realistic and viable plan to ensure continuous and reliable operation of the completed facilities” (MWE, Water and Sanitation Sector District Implementation Manual, 2007)
When it comes to general funding relating to this issue, it appears that 8% to 10% of the development partners’ budgets is allocated for the rehabilitation of boreholes (MWE, A National Framework for Operation and Maintenance of Rural Water Supplies, 2004; MWE, Sectoral Specific Schedules/Guidelines 2009/10, 2010). In several document misuse of funds for major reparations was reported. In response, “specific guidelines have now been issued to Districts on the assessment, classification of required work and supervision of borehole rehabilitation, which have reduced on the misuse of such funds” (MWE, A National Framework for Operation and Maintenance of Rural Water Supplies, 2004).
UWASNET (2009) reported the implementation of a new MIS (replacing Excel spreadsheets) for analysis and reporting for planning and decision-making purposes in Masindi District, but no scale up of this initiative was found.
Asset management is better structured for urban water supply than in rural areas: “The institutional development of the National Water and Sewerage Cooperation (NWSC) will result in development of a unit for Assets Management” (MWE, Strategic Sector Investment Plan for the Water and Sanitation Sector in Uganda (2009-2014), 2009). However, for rural water supply, the main focus is on two activities: operation and maintenance (within the funding capacities of

community-based management), and rehabilitation of boreholes (which need external funding and support).
This building block scored 2.5 out of 4, which is above the benchmark7. Evidence of designated institutions and occasionally evidence was found for a designated independent regulatory body for rural WASH services:
“The Ministry of Water and Environment has the responsibility for setting national policies and standards, managing and regulating water resources and determining priorities for water development and management. It also monitors and evaluates sector development programmes to keep track of their performance, efficiency and effectiveness in service delivery” (MWE, Water and Sanitation Sector Performance Report, 2009).
“The Directorate of Water Development (DWD) of the MWE is the Government’s lead sector agency and assumes regulatory, policy, overall planning (incl. budgeting), financing and overall monitoring as well as evaluating functions and provides support services to Local Governments (LGs) and other service providers” (MWE, Joint Water and Environment Sector Support Programme (2008 - 2013), 2009).
“The main coordination body at national level is the Water and Sanitation Sub-Sector Working Group (WSSWG), now part of the wider Water and Environment Sector Working Group (WESWG)” (UWASNET, 2009).
This building block scored below the benchmark8, at an average 1.9 out of 4. The baseline documents predominantly refer to investment per capita and the unit cost of production. A significant amount of attention is given to the planning and reporting cycle as well as financial auditing.
Evidence of community contribution options was also found: “Community Cash Contribution towards Capital Cost should be part of the Investment Projection and one of the funding mechanisms ... Communities express indicate their ability to maintain for the facilities through their cash contribution” (MWE, Sectoral Specific Schedules/Guidelines 2009/10, 2010; MWE, The National Water Policy, 1999). There was also evidence of using the unit cost estimating tool (which can provide realistic benchmarks for per capita costs that take account of poor technology) or the strategic sector investment model (which provides estimates of the investment needs according to sector targets) (MWE, Strategic Sector Investment Plan for the Water and Sanitation Sector in Uganda (2009-2014), 2009).
There are two stand-alone documents in this group: the Clients Charter (2011) and the 2010 Water and Sanitation Sub-Sector Gender Strategy (2010–2015). The remaining documents have earlier versions in the baseline (see previous section) with which they can be compared. Table 6 shows an overview of the scores per building block for each document, as well as the average

score and median score. Cells shaded red mark scores below the benchmark, cells with the highest scores are shaded blue.

The average score for all documents selected in the baseline group is 2.5, which is above the benchmark level. The median score is slightly higher, 2.8. The highest-scoring documents are the 2013 Joint Water and Environment Sector Support Programme (2013–2018) and the 2014 Joint Sector Performance Report, both of which score an average of 3.0. The lowest is the 2011 Clients Charter (average score 1.0), followed by the Joint Sector Review Minutes (average score 1.7). Average scores are presented in Figure 16.
Building blocks that scored the highest in this group are harmonisation and coordination (3.4 out of 4), followed by professionalisation of community management (2.8). Building blocks that scored the lowest are financing to cover all life-cycle costs (1.6) and asset management (1.7).
This building block scored 2.8, which is above the benchmark9. Five of 11 current documents refer to the establishment of hand pump mechanics associations as a supporting structure ( (MWE, Joint Sector Review Minutes , 2012; MWE, Ministerial Policy Statements 2012/2013, 2013; UWASNET, NGOs in the Ugandan Water and Sanitation Sector Performance Report for FY 2012/13, 2013; MWE, Joint Sector Performance Report , 2013; MWE, Joint Water and Environment Sector Support Programme (2013 - 2018), 2013). Other supporting activities include the formation and training of sub-county water supply and sanitation boards by Civil Society Organizations - CSOs (UWASNET, NGOs in the Ugandan Water and Sanitation Sector Performance Report for FY 2012/13, 2013), capacity building on gender issues in WASH (MWE, Water and Sanitation Sub-Sector Gender Strategy (2010 – 2015), 2010), and the development and professionalisation of the local private sector and develop appropriate PPP arrangements (MWE, Joint Water and Environment Sector Support Programme (2013 - 2018), 2013).
2.8
2.6
2.7
3.4
2.4
2.6
2.5
1.7
2.6
1.6
0.0 1.0 2.0 3.0 4.0
1. Professionalisation of community management
2. Recognition and promotion of alternativeservice provider options
3. Monitoring service delivery and sustainability
4. Harmonization and coordination
5. Direct support to service providers
6. Capacity support to service authorities
7. Learning and adaptive management
8. Asset management
9. Regulation of rural services and serviceproviders
10. Financing to cover all life-cycle costs

This building block scored above the benchmark10 (2.6 out of 4). “There is a deliberate effort by the Ministry of Water and Environment (MWE) to promote rainwater harvesting for household, institutional and communal water supply systems mainly for domestic purpose” (MWE, Water and Sanitation Sector District Implementation Manual, 2014). Ministerial Policy Statements 2012/2013 (2012) state that “the construction of domestic rainwater harvesting tanks has been approved by the budget” as well as “2 solar power water systems” and that “the capacity building for the appropriate technologies especially domestic rain water harvesting will be provided”.
In addition, guidelines and manuals have been developed: “Appropriate Technology Centre (ATC) have developed a manual for the construction of hand dug wells in Uganda. The Uganda Rainwater Harvesting Association (URWA), with support from the Self Supply Steering committee developed a construction guide for ferro-cement tanks (FCT) and water jars” (MWE, Joint Sector Performance Report , 2013).
This building block scored 2.7, which is above the benchmark level11. “The sector has developed a fully operational performance monitoring framework that consists of a set of key indicators and sub-sector indicators, regular sector reviews (Joint Sector Review (JSR) / Joint Technical Review (JTR)) informed by high-quality annual Sector Performance Reports (SPRs), the related data collection and reporting systems as well as a Management Information System (MIS)” (MWE, Joint Water and Environment Sector Support Programme (2013 - 2018), 2013). It is also reported that indicators are used for output oriented budgeting and in the context of the joint budget support framework. In addition, “JSR critically examines the achievement of annual targets for sector indicators, prior actions and attainment of undertakings from previous year(s), and formulates the undertakings for the following year(s)” (MWE, Joint Sector Review Minutes , 2012).
Evidence of MWE involvement in developing service delivery indicators to improve monitoring of rural water services was found in the Joint Sector Performance Report (2013), as well as effort to establish the collection of real-time data on the functionality of water services in the districts. These two innovative approaches are now incorporated in the ministry’s management information systems.
This building block scored well above the benchmark12 (3.4 out of 4). The SWAp was referenced in every analysed document. In addition, evidence of continuous coordinated effort between stakeholders was found in Joint Sector Performance Report (2012): “MWE, together with sector [development partners] started preparation of a 5-year Joint Water and Environment Sector Support Programme (JWESSP) for the period 2013/14-2017/18. This programme is a follow-up to the present Joint Water and Sanitation Sub-sector Support Programme, whose implementation started in June 2007 and is scheduled to end in June 2013”. Funding coordination efforts also include “the establishment of the Joint Partnership Fund (JPF), a basket funding arrangement that is operational since 2003” (MWE, Joint Water and Environment Sector Support Programme (2013 - 2018), 2013; MWE, Joint Sector Performance Report , 2012), and the Government’s Fiscal

Decentralisation Strategy, which support formats for water supply and sanitation activities (MWE, Water and Sanitation Sector District Implementation Manual, 2014; MWE, Water and Sanitation Sector Sectoral Specific Guidelines 2012/2013, 2012).
Furthermore, additional emphasis was given to decentralised structures: “Implement a co-ordination framework for de-concentrated structures of the Water and Sanitation Development Facilities, Technical Support Units, Umbrella organisations, Water Management Zones (WSDF, TSU, UOs, and WMZ) at regional level by the end of FY 2012/13” (MWE, Joint Sector Performance Report , 2013).
Coordination with NGOs and community-based organisations was also mentioned: “The Water Sector Liaison Division (WSLD) will work with UWASNET to ensure that this strategy document is well disseminated among sector NGOs to provide a harmonised roadmap for gender mainstreaming” (MWE, Water and Sanitation Sub-Sector Gender Strategy (2010 – 2015), 2010).
Direct support to service providers scored 2.4, which is above the benchmarkl13. According to Water and Sanitation Sector Sectoral Specific Guidelines (MWE, 2012), the role of local government is to provide post-construction support and monitor, regulate and facilitate operation and maintenance. Evidence of the importance of a direct link between local government capacities and the service provider level has been also found in documents. “Analysis of data from 5514 district annual reports reveals that only 53% of District Local Governments provided post construction support to communities” (MWE, Joint Sector Performance Report , 2013). Although this is recognised, no further mentions of support were found in the analysed documents. It is also not clear whether support is provided on a supply basis by an external agency or on an on demand-basis from communities.
Although three documents refer to newly established structures that provide capacity support—Umbrella Organisations (MWE, Joint Sector Performance Report , 2013; MWE, Joint Water and Environment Sector Support Programme (2013 - 2018), 2013; MWE, Water and Sanitation Sector District Implementation Manual, 2014)—the role of those structures lacks definition. “Umbrella Organisations (UOs) are regional organisations constituted as associations of the local Water Supply and Sanitation Boards (WSSBs) with the principal objective of providing operation and maintenance (O&M) back-up support. The organisations provide the following services to their member boards: training, support, legal support, organisational support, and support supervision of rehabilitation and extension works” (MWE, Water and Sanitation Sector District Implementation Manual, 2014). However, QDA revealed that capacity building is necessary for these organisations as well, which brings up the question of whether these were really necessary to introduce, as they are not part of the de-concentrated entities of MWE and they are not government bodies, which would receive support from technical support units.
Capacity building for service authorities scored 2.6, which is above the benchmark14. Most of the analysed documents specify who will provide capacity support; for example, “The mandate of TSUs is to support the capacity building of district-based structures. This involves training, technical advice, support supervision of Districts to enable them effectively implement for their

roles in the rural sub-sector” (MWE, Water and Sanitation Sector District Implementation Manual, 2014).
However, it is not clear if there is any coordination between technical support units and NGOs or community-based organisations. This is important due to the predominance of funding from donors to NGO/CBOs: more than 50% of 975mill UGSh in 2009; around 75% of 1,594 UGSh in 2010; 66% of 1,832 UGSh in 2012; and 1,768 UGSh in 2013 (MWE, Ministerial Policy Statements 2012/2013, 2012).
In addition, a capacity development strategy has been adopted in November 2012, although only two documents refer to it: the Joint Sector Performance Report (2013) and the Joint Water and Environment Sector Support Programme (2013).
This building block scored 2.5, which is above the benchmark level15. The main learning event in Uganda WASH sector is an annual review: “The Joint Sector Review (JSR) allows a broad spectrum of stakeholders to get an insight into, discuss, and influence sector developments. The JSR draws conclusions and makes recommendations on overall developments in the sector. The JSR critically examines the achievement of annual targets for sector indicators, prior actions and attainment of undertakings from previous year(s), and formulates the undertakings for the following year(s)” (MWE, Joint Sector Review Minutes , 2012). However, evidence of many other initiatives that also take place was found:
Bi-annual inter-district meetings, working groups, District Water Supply and Sanitation Coordination Committee (DWSSC) meetings, UWASNET Monitoring &Evaluation on-line database (UWASNET, NGOs in the Ugandan Water and Sanitation Sector Performance Report for FY 2012/13, 2013)
Learning forums, learning journeys and capacity building workshops, as well as WASH platforms at the division, district and sub-county levels (MWE, Joint Sector Performance Report , 2013)
National Learning forum on self supply (MWE, Joint Sector Performance Report , 2012) Learning alliances for gender mainstreaming (MWE, Water and Sanitation Sub-Sector Gender
Strategy (2010 – 2015), 2010) Learning forum on self supply (MWE, Ministerial Policy Statements 2012/2013, 2012) Annual reviews and evaluations meetings (MWE, National Framework for Operation and
Maintenance of Rural Water Supplies in Uganda, 2011) Regional workshops (MWE, Water and Sanitation Sector Sectoral Specific Guidelines
2012/2013, 2012)
As shown by the above examples, there are many ways of information sharing and learning, as well as different working groups and learning alliances and platforms found in the documents. However, it appears that a more structured approach is needed to coordinate these efforts. In addition, there was little evidence of clear roles between partners for dedicating resources to support these groups and platforms.

Asset management scored 1.7, which is below the benchmark16. Emphasis is on operations and maintenance, replacement and rehabilitation. Communities need to prepare three-year O&M plans, under supervision of sub-county officials (MWE, Water and Sanitation Sector District Implementation Manual, 2014). “The District should budget for major repairs/rehabilitation as part of the planning process... It is important in O&M planning to clearly identify what aspects are to be financed by whom” (MWE, National Framework for Operation and Maintenance of Rural Water Supplies in Uganda, 2011).
It is also recognised that the backlog of broken facilities is increasing: “There is a need to develop a strategy for rehabilitation, replacement of pumping & other electromechanical equipment in water supplies with aging facilities” (MWE, Ministerial Policy Statements 2012/2013, 2012). However, no clear mechanism or standard for reducing response time to breakdowns was mentioned.
This building block scored 2.6, which is above the benchmark17, largely because the sector is guided by a set of written rules and norms, has a designated institution that ensures that service and providers meet standards, and has an independent regulatory body.
“Directorate of Water Development (DWD) responsible for providing overall technical oversight for the planning, implementation and supervision of the delivery of urban and rural water and sanitation services across the country, including water for production. DWD is responsible for regulation of provision of water supply and sanitation and the provision of capacity development and other support services to Local Governments, Private Operators and other service providers” (UWASNET, NGOs in the Ugandan Water and Sanitation Sector Performance Report for FY 2012/13, 2013; MWE, Water and Sanitation Sector Sectoral Specific Guidelines 2012/2013, 2012; MWE, Water and Sanitation Sector District Implementation Manual, 2014; MWE, Joint Water and Environment Sector Support Programme (2013 - 2018), 2013)
Financing to cover all life-cycle costs scored 1.6, which is below the benchmark18. Evidence of financial planning that covered the cost of new systems, O&M and major repair was found in all documents. Emphasis was on value for money and per capita investment cost, as well as the unit cost of rehabilitation. However, it is not clear which tool is used for planning and whether it covers all life-cycle cost items.
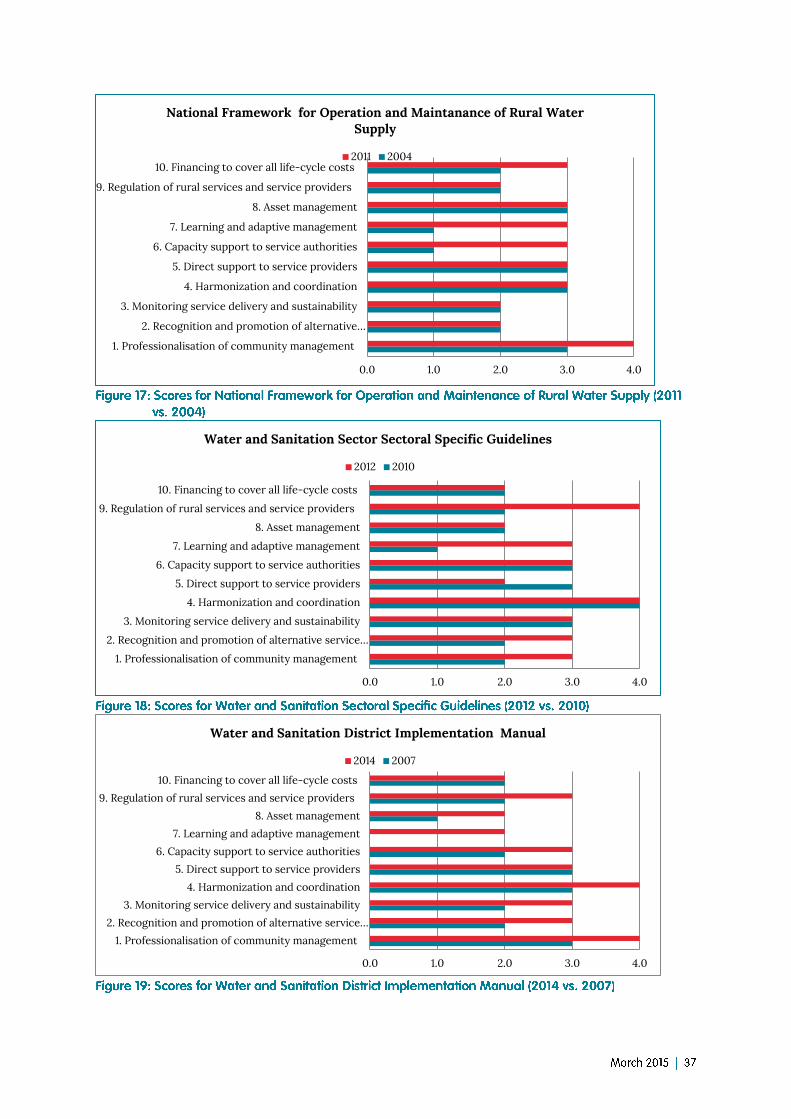
The following figures present the results of the comparison of current set of documents (published after 2010, in red bars) with their previous versions (published before 2010, in blue bars).
0.0 1.0 2.0 3.0 4.0
1. Professionalisation of community management
2. Recognition and promotion of alternative…
3. Monitoring service delivery and sustainability
4. Harmonization and coordination
5. Direct support to service providers
6. Capacity support to service authorities
7. Learning and adaptive management
8. Asset management
9. Regulation of rural services and service providers
10. Financing to cover all life-cycle costs
National Framework for Operation and Maintanance of Rural Water Supply
2011 2004
0.0 1.0 2.0 3.0 4.0
1. Professionalisation of community management
2. Recognition and promotion of alternative service…
3. Monitoring service delivery and sustainability
4. Harmonization and coordination
5. Direct support to service providers
6. Capacity support to service authorities
7. Learning and adaptive management
8. Asset management
9. Regulation of rural services and service providers
10. Financing to cover all life-cycle costs
Water and Sanitation Sector Sectoral Specific Guidelines
2012 2010
0.0 1.0 2.0 3.0 4.0
1. Professionalisation of community management
2. Recognition and promotion of alternative service…
3. Monitoring service delivery and sustainability
4. Harmonization and coordination
5. Direct support to service providers
6. Capacity support to service authorities
7. Learning and adaptive management
8. Asset management
9. Regulation of rural services and service providers
10. Financing to cover all life-cycle costs
Water and Sanitation District Implementation Manual
2014 2007

0.0 1.0 2.0 3.0 4.0
1. Professionalisation of community management
2. Recognition and promotion of alternative service…
3. Monitoring service delivery and sustainability
4. Harmonization and coordination
5. Direct support to service providers
6. Capacity support to service authorities
7. Learning and adaptive management
8. Asset management
9. Regulation of rural services and service providers
10. Financing to cover all life-cycle costs
Joint Sector Riview Report
2012/13 2008/09
0.0 1.0 2.0 3.0 4.0
1. Professionalisation of community management
2. Recognition and promotion of alternative service…
3. Monitoring service delivery and sustainability
4. Harmonization and coordination
5. Direct support to service providers
6. Capacity support to service authorities
7. Learning and adaptive management
8. Asset management
9. Regulation of rural services and service providers
10. Financing to cover all life-cycle costs
Joint Water and Environment Sector Support Programme
2013 2009
0.0 1.0 2.0 3.0 4.0
1. Professionalisation of community management
2. Recognition and promotion of alternative service…
3. Monitoring service delivery and sustainability
4. Harmonization and coordination
5. Direct support to service providers
6. Capacity support to service authorities
7. Learning and adaptive management
8. Asset management
9. Regulation of rural services and service providers
10. Financing to cover all life-cycle costs
Ministerial Policy statement for Water and Environment
2013 2009

0.0 1.0 2.0 3.0 4.0
1. Professionalisation of community management
2. Recognition and promotion of alternative service…
3. Monitoring service delivery and sustainability
4. Harmonization and coordination
5. Direct support to service providers
6. Capacity support to service authorities
7. Learning and adaptive management
8. Asset management
9. Regulation of rural services and service providers
10. Financing to cover all life-cycle costs
NGOs in the Ugandan Water and Sanitation Sector Performance Report
2012 2010

A qualitative information system (QIS) quantifies qualitative indicators, such as participation and inclusiveness, and outcome indicators, such as behavioural change, with the help of progressive scales, or ladders. QIS defines the scoring criteria by which a policy can be assessed. The aim is to ensure that the QDA analysis reflects the concerns of the national sector and that the framework for analysis (the building blocks) is appropriate.
Each step on the ladder has a short description, or mini-scenario, which describes the situation represented by a particular score. Typically, scores are structured as follows:
A score 0 indicates a situation in which the condition or practice is not present. A score of 1 is below the benchmark: the minimum standard that the programme wants to
achieve is not reached. A score of 2 is the benchmark situation: this is the minimum standard. A scores of 3 is above the benchmark: the programme is achieving above the standard. A score of 4 represents an ideal situation.
QIS scales are thus programme-specific, and to capture the field realities, they must be developed through consensus by sector workers with extensive experience. A typical QIS scale looks like the table below:
Below is a proposal of QIS scoring ladders – one per Triple-S building block. Each QIS scoring ladder was developed based on documents and descriptions available for each building block, as well as discussion and further clarification per building block that took place during practice document analysis in 2012. This QIS scoring ladder proposal requires discussion and agreement with Triple S ILW as well as with the Uganda and Uganda country work streams to ensure the use of language and concepts are contextually relevant.
In the International QDA on policy and practice documents, the framework used was based on the building blocks of sustainable service delivery. Country-level QDA should adopt the same approach so that results can be compared and lessons drawn.

In practice, this means that a researcher assigns a score to specific part of the analysed document by applying QIS scoring ladders. While assigning a score, s/he needs to indicate the underlying reason.
Comments are aggregated in a summary sheet per document and per building block, based on which a final score per building block is decided. Final scores need to be explained. A sample final summary sheet is presented below:

This approach would allow more structured and transparent way of documenting the findings and the analysis, as well as the foundation for further research development.

The professionalisation of community based-management (CBM) means moving away from an approach based purely on volunteerism towards a more professional, competent and effective management of rural water services working to agreed standards, and with greater transparency and accountability.
Conventional approaches to CBM have had an overwhelming reliance on volunteer management arrangements, which have often limited the capacity and skills of operators. Lack of more formalised relationships has also resulted in inadequate or low levels of accountability. Poor management, lack of checks and balances and insufficient incentives can all lead to inadequate technical, financial and managerial performance, and ultimately system breakdowns and service failure.
When looking for evidence of professionalisation of community management in policy and practice documents, consider the following criteria for deciding on scores:

Alternative service provider options refer to models such as self-supply and public-private partnerships that are a departure from the conventional model of community-based management (CBM) that has tended to dominate many rural water sectors.
Sustainable service provision through community based management needs service options to be well matched to the local context, service levels, technology and type of settlement. If it is formally recognised and supported, CBM can work. However, in many settings it struggles because of the reliance on volunteers and informal community institutions. Alternatives such as municipal supply, small-scale private suppliers (public-private partnerships) or self-supply, where properly supported, can improve service to rural water users and extend it to those who are currently without.
When looking for evidence of recognition and promotion of alternative service provider options in policy and practice documents, consider the following criteria for deciding on scores:
Monitoring, which comprises regular collection, collation and analysis of reliable data, is a crucial building block in delivering sustainable services. Monitoring systems should track not only access but also the quality of a service over time, as well as performance of operators in key technical, financial and management functions.
Basic monitoring data are critical for performance management and to enable local operators to assess problems, anticipate and address them, before the quality of service starts to deteriorate. Setting explicit targets for the levels of service in addition to coverage also helps countries focus their efforts to improve service delivery, measure progress and take corrective actions at the sector level.
When looking for evidence of monitoring of service delivery and sustainability in policy and practice documents, consider the following criteria for deciding on scores:

Harmonisation and coordination means that all actors—national and local governments, donors, lending banks, NGOs and other water sector stakeholders—recognise and adhere to common principles and approaches when supporting rural water services. It includes the principles of 'aid effectiveness', meaning especially that external actors better coordinate amongst themselves and align behind a recipient country's national policies, priorities and systems. It means that implementation of programmes (at local level) should follow nationally set guidelines and standards.
Establishing common ‘rules of the game’ with standardised policies—on things like levels of service, technology, cost recovery, types of operator and monitoring frameworks—means that all stakeholders can work towards supporting the development of the sector. With improved coordination it is likely that newly built infrastructure will be better maintained and supported by permanent institutions, regardless of provenance of investment.
When looking for evidence of harmonisation and coordination in policy and practice documents, consider the following criteria for deciding on scores:

Direct support refers to the structured support activities provided to service providers as well as to users or user groups. This may be provided in a variety of ways.
Community-based service providers often need regular, structured support to help them fulfill administration, operation, asset management and maintenance functions. This has been shown to improve the likely sustainability of water services and to help reduce major breakdowns and faults.
When looking for evidence of direct support to service providers in policy and practice documents, consider the following criteria for deciding on scores:

Capacity support refers to support activities towards water service authorities and includes the provision of technical assistance, monitoring and training of service authority staff in the functions they are responsible for.
A growing number of governments in developing countries have devolved the responsibility for water and sanitation services to local government. Although it is recognised that capacity support is critical to successful decentralisation, in practice, the type of support required has been lacking, resulting in a vicious circle of low capacity and service delivery failure.
When looking for evidence of capacity support for local government in policy and practice documents, consider the following criteria for deciding on scores:

A ‘learning sector’ is one that engages in continual learning and reflection and is thus able to adapt to changing circumstances and demands. Ideally, learning takes place at all levels and brings people together at each level. Alliances can link learning initiatives horizontally and vertically (between districts and national level) to help ensure that lessons from practice feed into policy guidelines and that tools are shared with those responsible for service delivery.
Building a learning sector with the capacity to continually innovate, evolve and adapt based on evidence is a must for delivering sustainable services and requires the capacity and willingness to address failure and do things together, better and differently.
When looking for evidence of learning and adaptive management in policy and practice documents, consider the following criteria for deciding on scores:

Asset management is “the combination of management, financial, economic, engineering and other practices applied to physical assets with the objective of providing the required level of service in the most cost-effective manner” (National Asset Management Steering Group, 2006). In practical terms it is the maintenance of a desired level of service at the lowest life-cycle cost. Asset management is a scalable approach that can be implemented for systems of any size.
Asset management leads to more realistic budgeting and planning and enables considerable cost savings over the medium and long term. Major replacements need to be planned for and financed properly, and long-term planning for replacement is crucial if sustainable services are to be maintained permanently. In theory this is usually done by the service authority, such as local government or another external body; therefore the service provider may not have full responsibility for large-scale capital replacement or upgrading.
When looking for evidence of asset management in policy and practice documents, consider the following criteria for deciding on scores:
Regulation is a set of functions, norms and enforcement processes that ensure both services and service providers (operators) meet nationally set guidelines and standards. Regulation can cover economic, environmental and public health aspects of service provision.
In the rural water sector regulation of services refers to setting and checking service provision standards most commonly relating to water quality and tariffs so that that consumers receive the intended level of service and are protected from monopolistic behaviour and unfair charges. Regulation may also apply to service providers and their performance in meeting national standards and to resolve potential conflicts with consumers.

More formalised regulation provides a mechanism for protecting both consumers and service providers and for strengthening the accountability relationships between the two. Without regulation, rural water services may be more vulnerable to a cycle of poor services and non-payment of tariffs by unhappy consumers, and ultimately a deterioration of services.
When looking for evidence of regulation of rural service and service providers in policy and practice documents, consider the following criteria for deciding on scores:

Life-cycle costs represent the aggregate costs of ensuring delivery of adequate, equitable and sustainable WASH services indefinitely to a population in a specified area:
Capital expenditure on hardware and software CapEx) (new investments) Operating and minor maintenance expenditure (OpEx) (operational cost for service providers) Capital maintenance expenditure (CapManEx) (major replacement cost) Costs of capital (interest of loans etc.) (CoC) (loans) Expenditure on direct support (ExpDS) (monitoring and operational cost for district and
regional level) Expenditure on indirect support (ExpIDS) (cost of national level support)
Planning and budgeting for life-cycle costs is an essential aspect of a service delivery approach. The life-cycle costs approach ensures that budgeters take into account the real costs of delivering a service and include all life-cycle costs—from construction of new systems to short-term and long-term maintenance, district-level and national-level administration and planning, extension and improvement of services and eventual replacement of the infrastructure.
All of these costs, taken together, form the total cost of providing a sustainable level of service. By monitoring how each cost component affects the overall costs of the service, governments, investors, donors, service providers and service authorities can plan for sustainable and appropriate levels of service and keep service levels high.
When looking for evidence of financing to cover all life-cycle costs in policy and practice documents, consider the following criteria for deciding on scores:


Altheide, D., 1996. ‘Process of Qualitative Document Analysis’, in Qualitative Media Analysis. London: Sage Publications.
Lockwood, H. and Smits, S., 2011. Supporting rural water supply: moving towards a service delivery approach. Rugby: Practical Action Publishing.
Wesley, J., 2011. ‘Analyzing Qualitative Data’, In Explorations: A Navigator’s Guide to Quantitative Research in Canadian Political Science, Archer, K. and Youngman-Berdahl, L., (eds.). Oxford: Oxford University Press.
Wijk-Sijbesma, C., 2002. The Best of Two Worlds? Methodology for Participatory Assessment of Community Water Services, PhD dissertation, Wageningen University. Available at: <http://edepot.wur.nl/139858>.
