© ifp controlled co 2 | diversified fuels | fuel-efficient vehicles | clean refining | extended...
TRANSCRIPT
© I
FP
Controlled CO2 | Diversified fuels | Fuel-efficient vehicles | Clean refining | Extended reserves
DIP workshop– Seismic interpretation – 14th December 2010
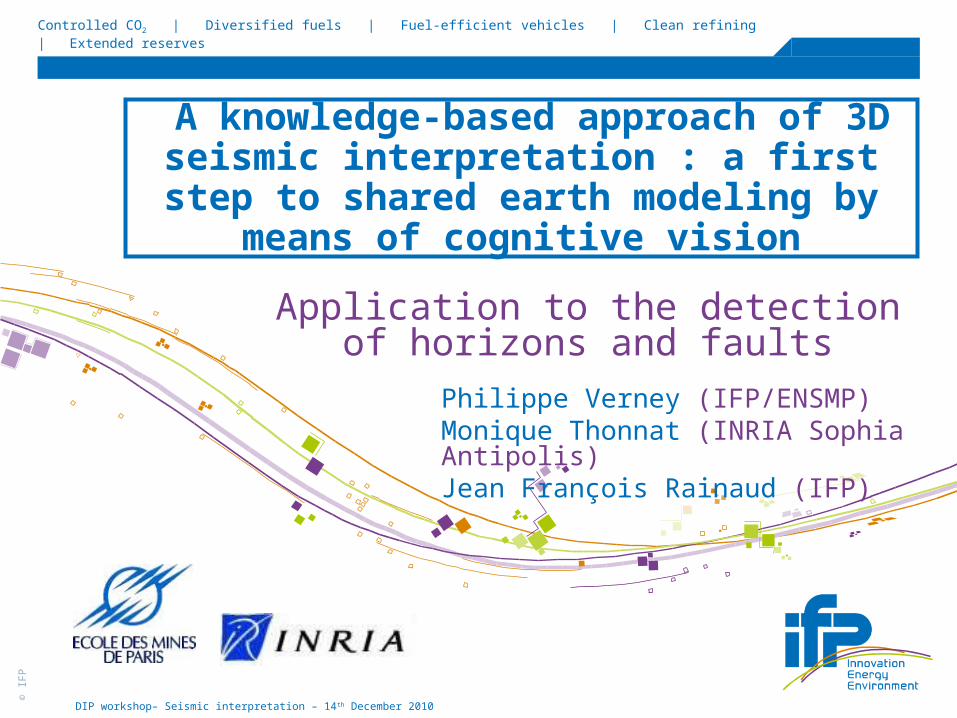
A knowledge-based approach of 3D seismic interpretation : a first step to shared earth modeling by means of
cognitive vision
Application to the detection of horizons and faults
Philippe Verney (IFP/ENSMP)Monique Thonnat (INRIA Sophia Antipolis)Jean François Rainaud (IFP)

© I
FP
2 DIP workshop– Seismic interpretation – 14th December 2010
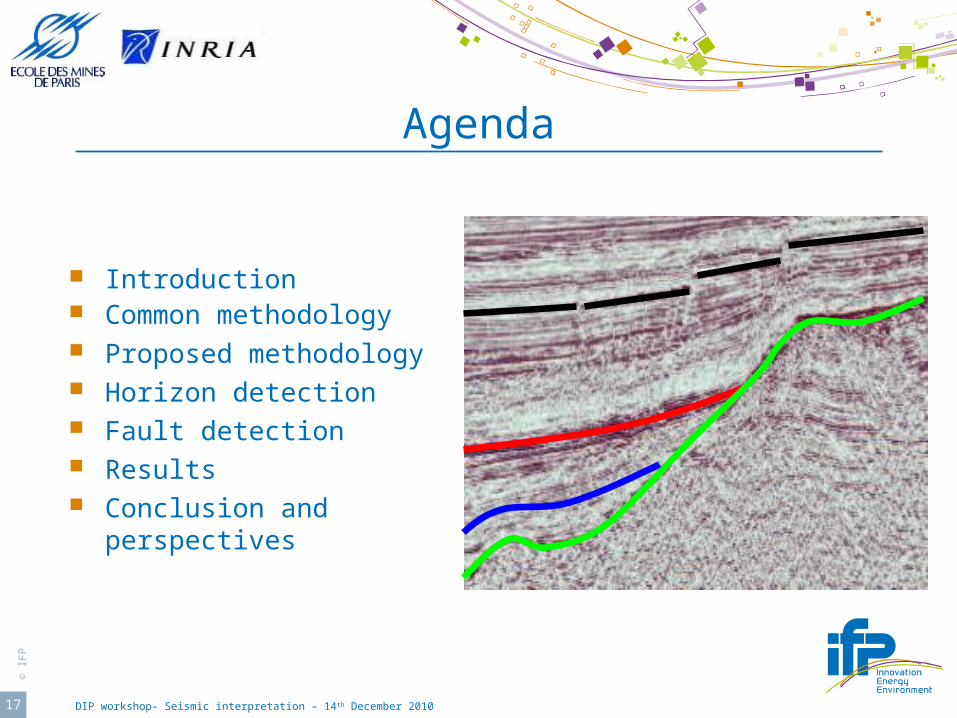
Agenda
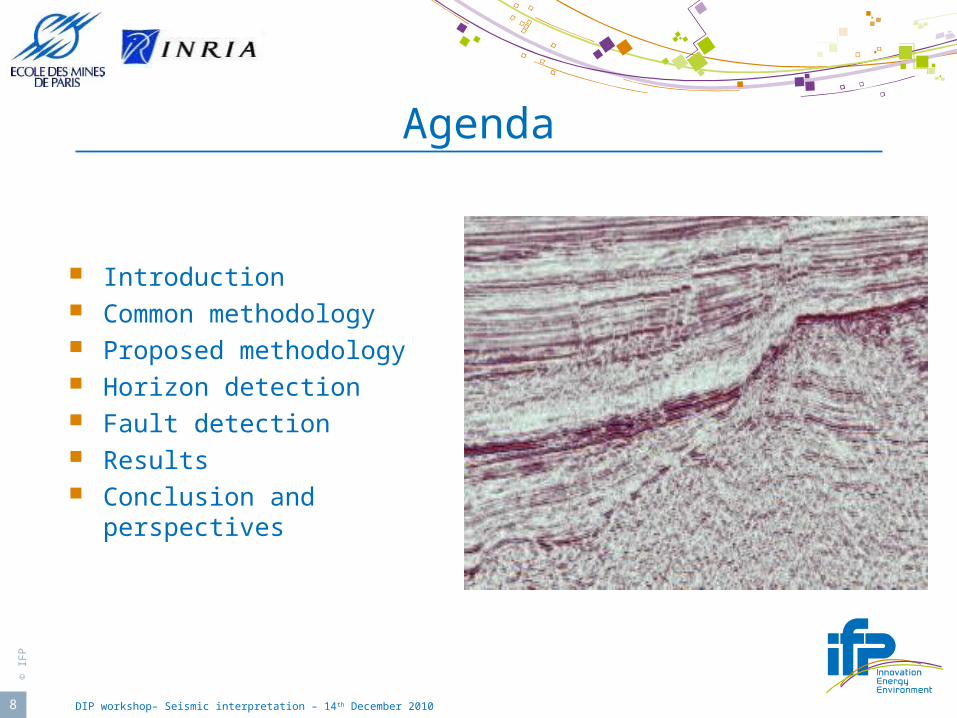
Introduction Common methodology Proposed methodology Horizon detection Fault detection Results Conclusion and
perspectives

© I
FP
3 DIP workshop– Seismic interpretation – 14th December 2010
Introduction Area of oil exploration
Aims to compute the amount of hydrocarbon extraction in an oil field.
Goal Where is the oil located? Which objects
(surfaces) do mark the boundaries of this zone? How to answer?
By representing the subsurface for a geological study.
First step The seismic interpretation : to transform a
seismic image into a structural model (horizons, faults and their mutual relationships).
© I
FP
4 DIP workshop– Seismic interpretation – 14th December 2010
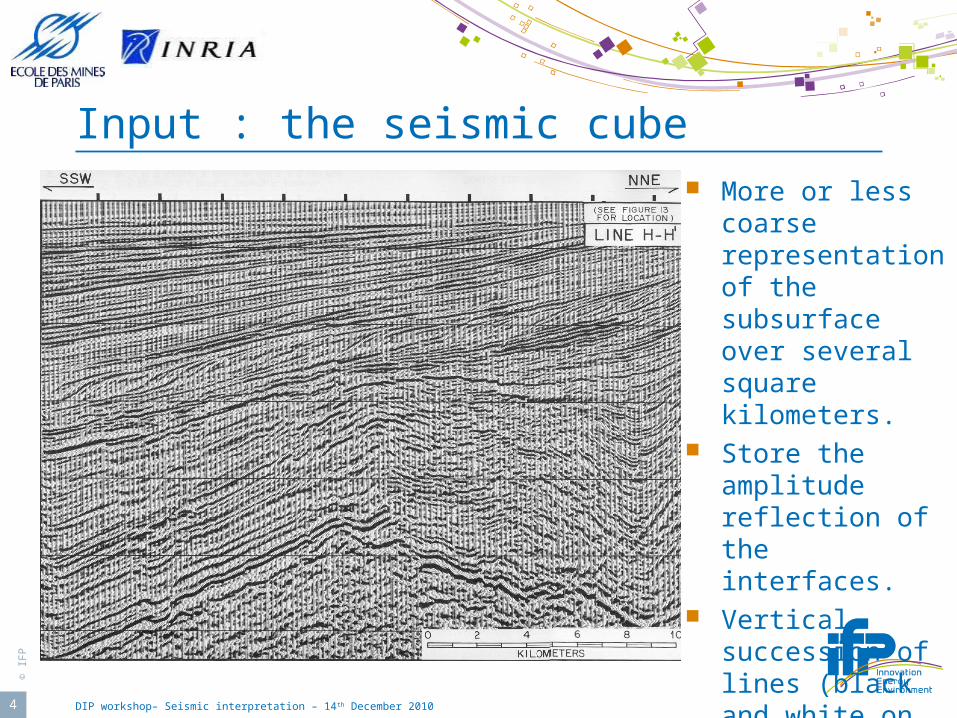
Input : the seismic cube More or less
coarse representation of the subsurface over several square kilometers.
Store the amplitude reflection of the interfaces.
Vertical succession of lines (black and white on the left image) called “reflectors”

© I
FP
5 DIP workshop– Seismic interpretation – 14th December 2010
Another input : the well markers
Intersection between the trajectory of a well and a geological surface identified either by a geophysical method or by sample cores.
Most accurate representation of a geological surface.

© I
FP
6 DIP workshop– Seismic interpretation – 14th December 2010
Output
Interpretation of the global structure of the subsurface.
Relationships between those surfaces to build a structural model.
© I
FP
7 DIP workshop– Seismic interpretation – 14th December 2010
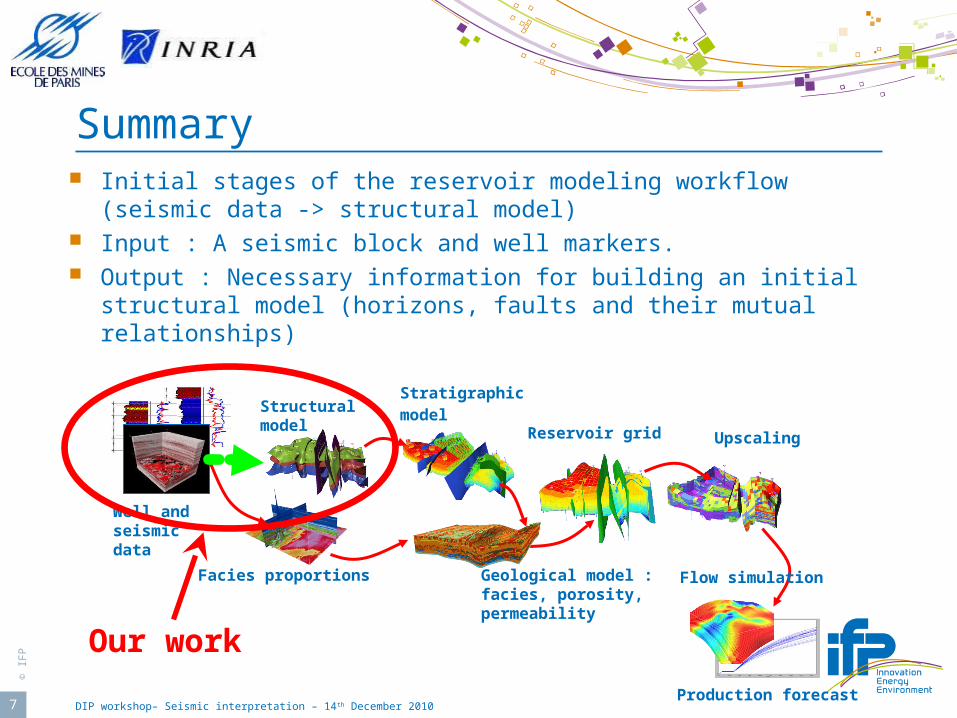
Summary Initial stages of the reservoir modeling workflow (seismic data
-> structural model) Input : A seismic block and well markers. Output : Necessary information for building an initial structural
model (horizons, faults and their mutual relationships)
Production forecast
Reservoir grid Upscaling
Flow simulationGeological model :facies, porosity, permeability
Structuralmodel
Well and seismicdata
Facies proportions
Stratigraphicmodel
Our work
© I
FP
8 DIP workshop– Seismic interpretation – 14th December 2010
Agenda
Introduction Common methodology Proposed methodology Horizon detection Fault detection Results Conclusion and
perspectives
© I
FP
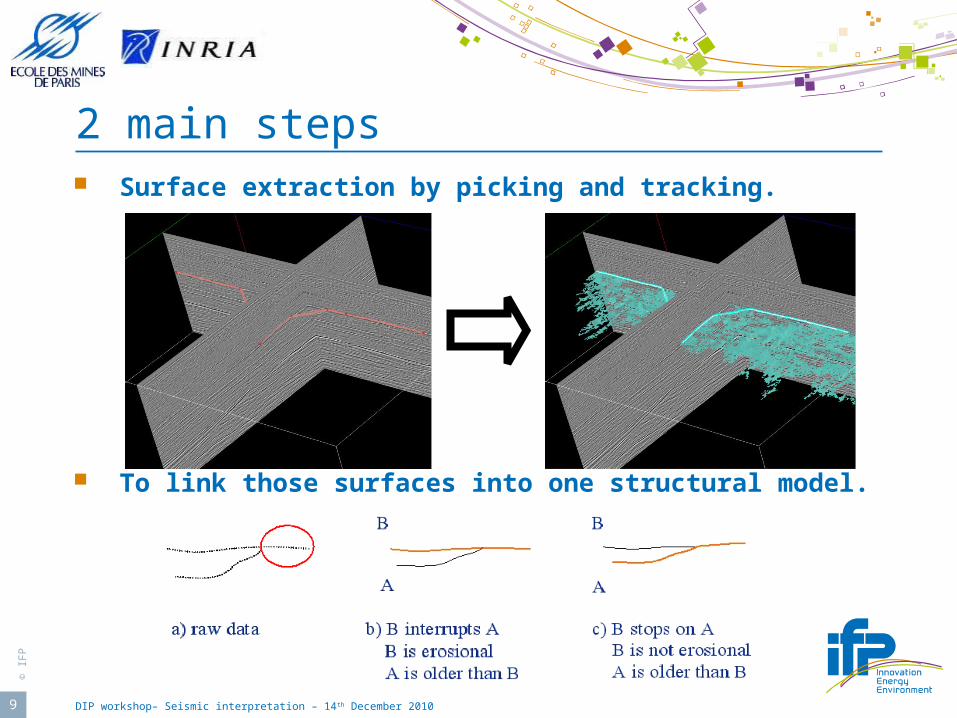
9 DIP workshop– Seismic interpretation – 14th December 2010
2 main steps Surface extraction by picking and tracking.
To link those surfaces into one structural model.
© I
FP
10 DIP workshop– Seismic interpretation – 14th December 2010
Issues and current solutions The latter operations are not automatic. They
need a user having a very high level of geological and geophysical knowledge for. Choosing where to pick Choosing the tracker parameters Choosing how to link the extracted surfaces
Current help Seismic attributes [Chopra, 2005]
Intend to output a subset of the data that quantifies a specific seismic characteristic interpreters are interested in. For instance, the local continuity or dip of reflectors.
Neural networks [Meldhal, 2000] Intend to highlight objects using several seismic
attributes and “learning” from one similar identification executed by an expert user.
Image processing (after operations Ant Tracking [Randen, 2001] or before operations [Barnes, 2006])

© I
FP
11 DIP workshop– Seismic interpretation – 14th December 2010
Lack of the current solutions
Data based and not enough knowledge based. The software doesn’t really propose
interpretations of the seismic block by itself. It just modifies the seismic block in order to provide an easier interpretation for the user.
No information on extracted data The reasons which lead to one surface
extraction are not stored with the data. Most of time, only the geometry of the surfaces are stored.

© I
FP
12 DIP workshop– Seismic interpretation – 14th December 2010
Agenda
Introduction Common methodology Proposed methodology Horizon detection Fault detection Results Conclusion and perspectives
© I
FP
13 DIP workshop– Seismic interpretation – 14th December 2010
Main idea
Seismic interpretation must first rely on geological knowledge. Need to formalize this knowledge for a use with
computers (Geological Evolution Schema [Perrin, 1998])
Inspirations Cognitive vision for a knowledge based image
interpretation Mainly Orion/Pulsar team (INRIA Sophia Antipolis)
[Hudelot, 2005], [Thonnat, 2002] Semantic web for the formalization and the
exchange of the knowledge Ontologies [Monnin, 2009] and OWL [Smith, 2004]
© I
FP
14 DIP workshop– Seismic interpretation – 14th December 2010
Ontology
This is a formal model used in order to describe a particular domain of the real world [Fensel, 2003][Staab, 2004]
In an ontology, the concepts define the basic elements. They are described by means of specific properties (attributes) and can be represented by means of several individuals (instances).The concepts can also be linked together by relationships.
© I
FP
15 DIP workshop– Seismic interpretation – 14th December 2010
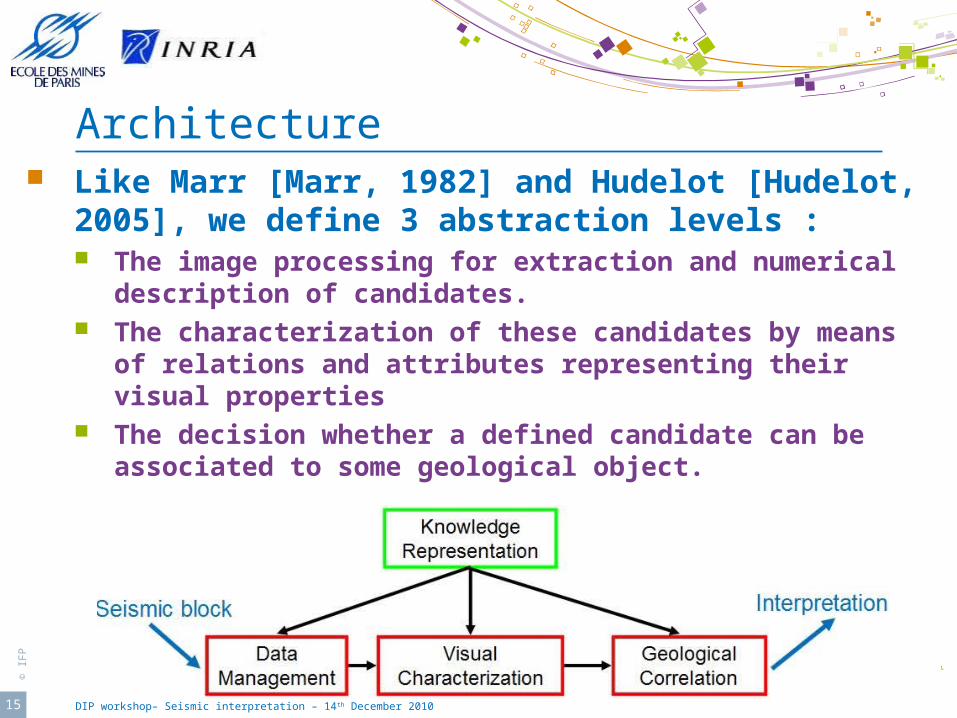
Architecture Like Marr [Marr, 1982] and Hudelot [Hudelot,
2005], we define 3 abstraction levels : The image processing for extraction and numerical
description of candidates. The characterization of these candidates by means of
relations and attributes representing their visual properties
The decision whether a defined candidate can be associated to some geological object.
© I
FP
16 DIP workshop– Seismic interpretation – 14th December 2010
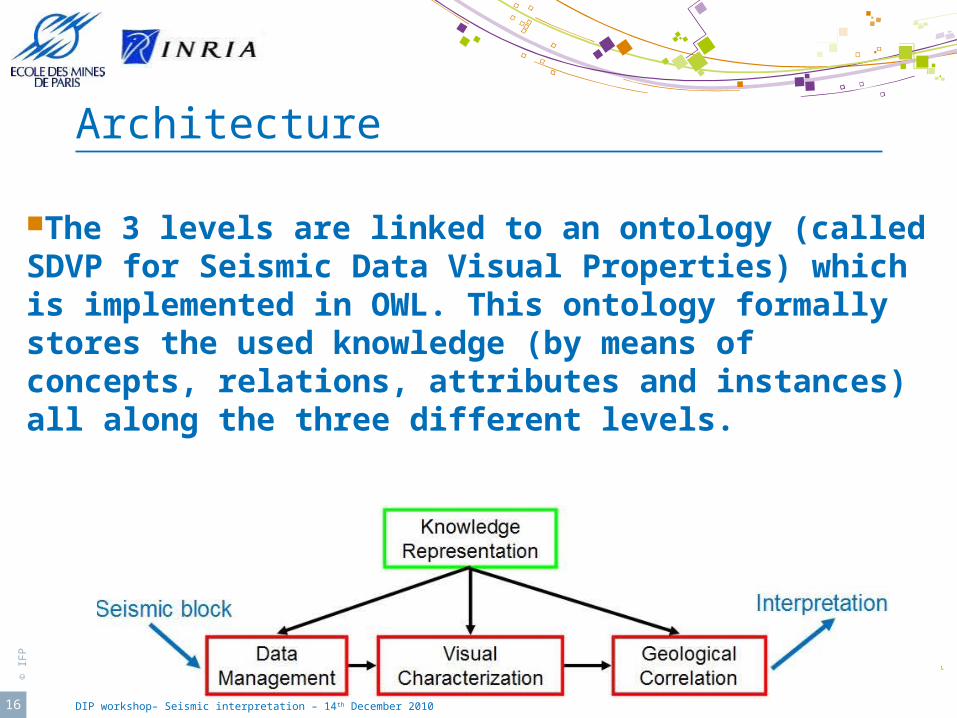
Architecture
The 3 levels are linked to an ontology (called SDVP for Seismic Data Visual Properties) which is implemented in OWL. This ontology formally stores the used knowledge (by means of concepts, relations, attributes and instances) all along the three different levels.
© I
FP
17 DIP workshop– Seismic interpretation – 14th December 2010
Agenda
Introduction Common methodology Proposed methodology Horizon detection Fault detection Results Conclusion and
perspectives

© I
FP
18 DIP workshop– Seismic interpretation – 14th December 2010
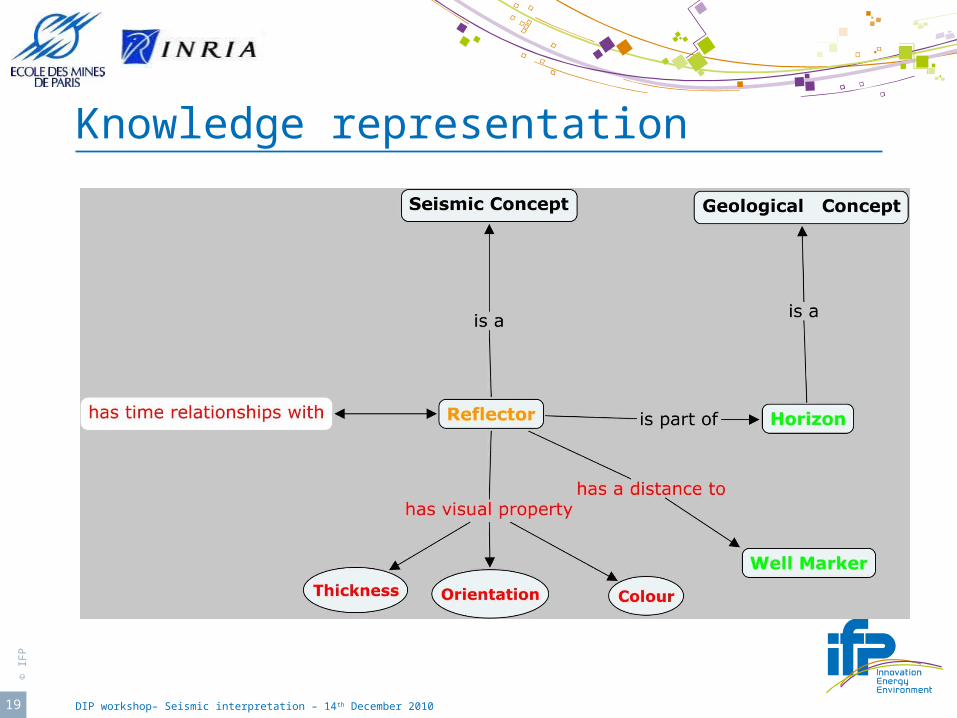
Knowledge representation Sets of reflectorsreflectors (lateral successions of points having
approximately the same amplitude) 1 horizon = several reflectors sharing
the same visual attributes thickness, orientation (dip), colour (amplitude value)
the same time relationships with other reflectors the same distance relationships with a one same well
marker.
© I
FP
19 DIP workshop– Seismic interpretation – 14th December 2010
Knowledge representation

© I
FP
20 DIP workshop– Seismic interpretation – 14th December 2010
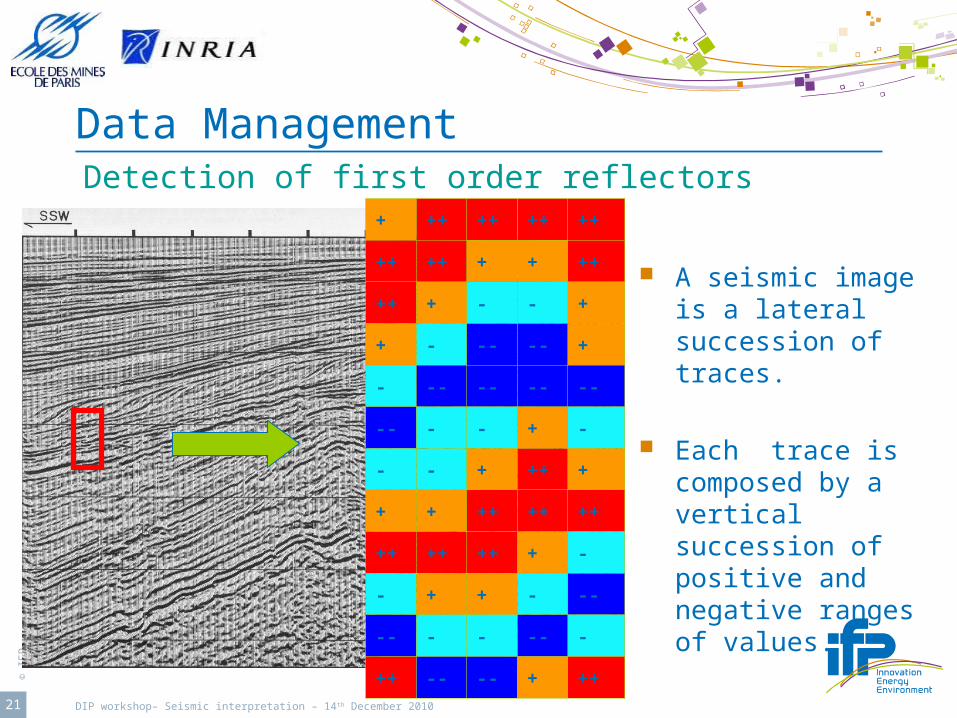
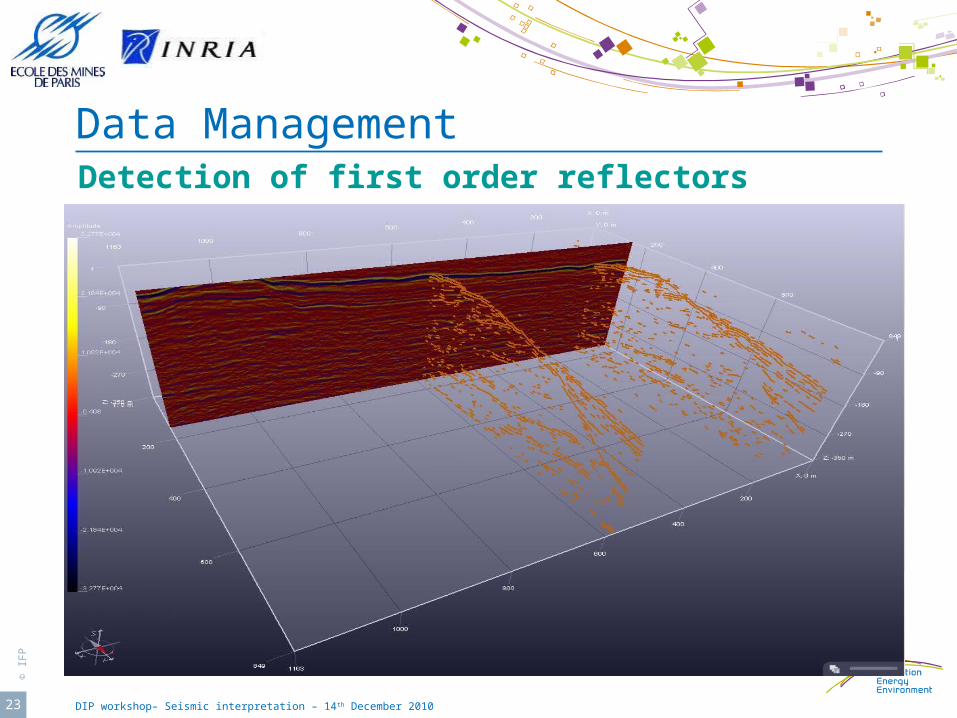
Data ManagementDetection of first order reflectors
© I
FP
21 DIP workshop– Seismic interpretation – 14th December 2010
Data Management
+ ++ ++ ++ ++
++ ++ + + ++
++ + - - +
+ - -- -- +
- -- -- -- --
-- - - + -
- - + ++ +
+ + ++ ++ ++
++ ++ ++ + -
- + + - --
-- - - -- -
++ -- -- + ++
A seismic image is a lateral succession of traces.
Each trace is composed by a vertical succession of positive and negative ranges of values.
Detection of first order reflectors

© I
FP
22 DIP workshop– Seismic interpretation – 14th December 2010
Data Management
Threshold values are put on amplitudes for reducing noise and decreasing the necessary memory size.
Thinning of the result in order to obtain a surface 1 pixel thick.
Labelization of connected voxels (without Z multi evaluations).
Detection of first order reflectors
© I
FP
23 DIP workshop– Seismic interpretation – 14th December 2010
Data ManagementDetection of first order reflectors
© I
FP
24 DIP workshop– Seismic interpretation – 14th December 2010
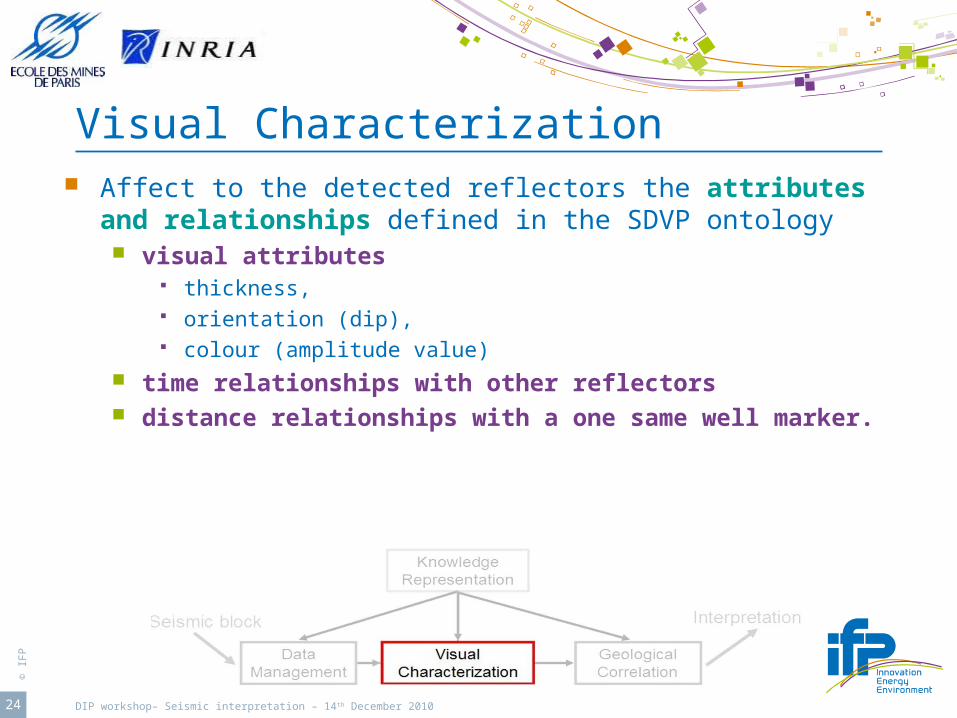
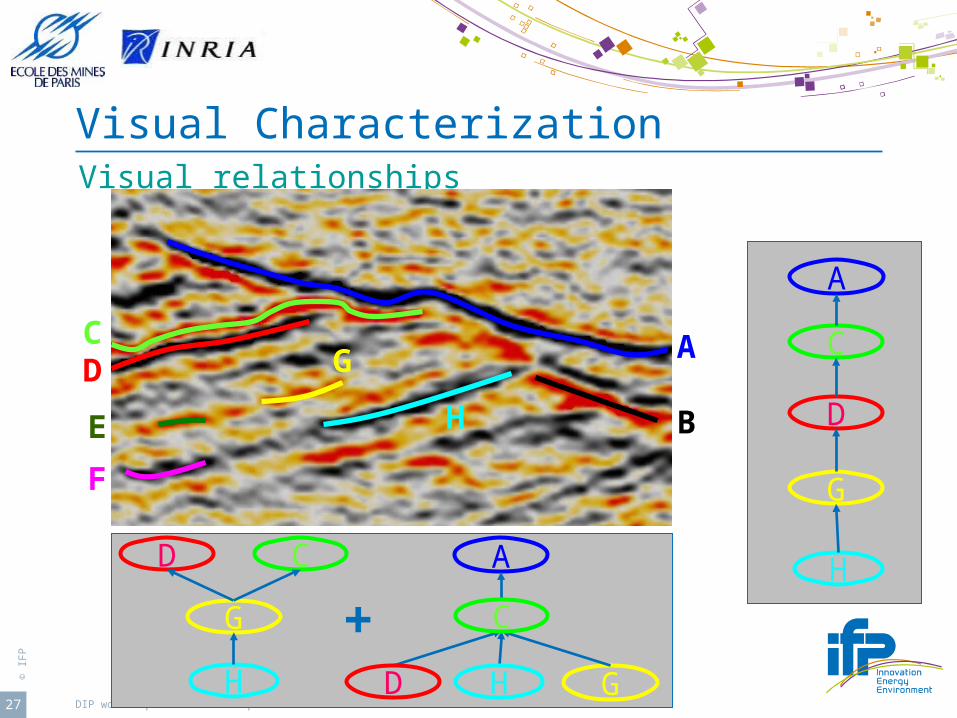
Visual Characterization Affect to the detected reflectors the attributes and
relationships defined in the SDVP ontology visual attributes
thickness, orientation (dip), colour (amplitude value)
time relationships with other reflectors distance relationships with a one same well marker.
© I
FP
25 DIP workshop– Seismic interpretation – 18 April 2023
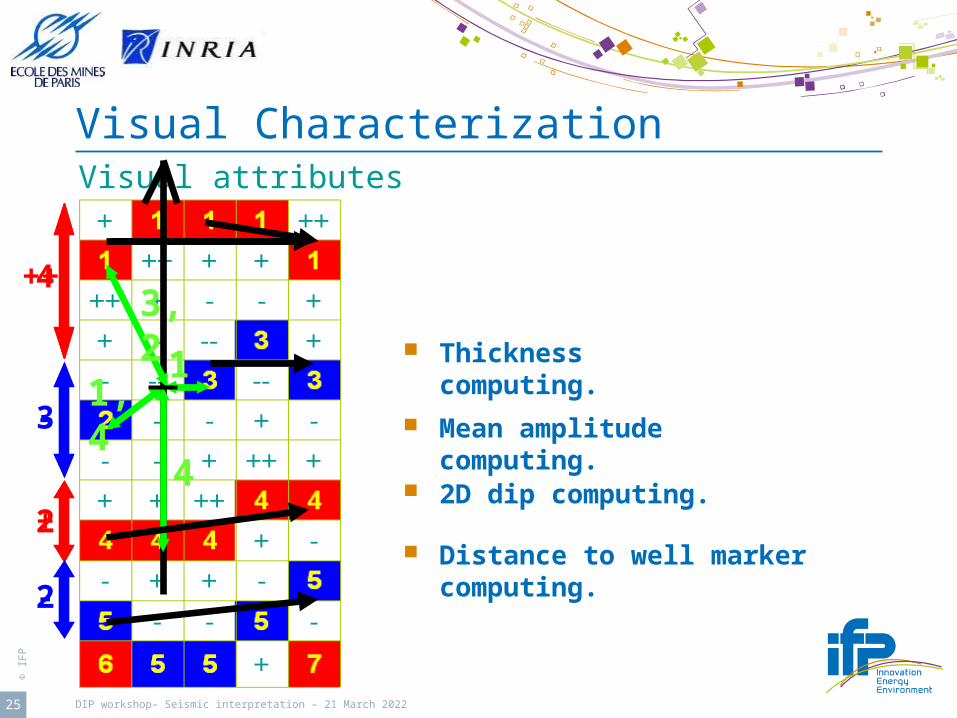
Visual Characterization
Mean amplitude computing.
Thickness computing.
2D dip computing.
Visual attributes
4
3
2
2
++
-
+
-
Distance to well marker computing.
11,4
3,2
4

© I
FP
26 DIP workshop– Seismic interpretation – 18 April 2023
Visual Characterization
Vertical distance (in voxels) to the first visible reflectors (upwards and downwards).
Construction of a locallocal chronological relation graph.
Time relationships of one reflector with respect to the others
8 49
2
3 54
A
B
C
D
E
F G
H
I
© I
FP
27 DIP workshop– Seismic interpretation – 18 April 2023
Visual Characterization
H
G
D C
+
Visual relationships
A
B
CD
F
E H
G
G
A
HD
C
H
G
C
D
A

© I
FP
28 DIP workshop– Seismic interpretation – 18 April 2023
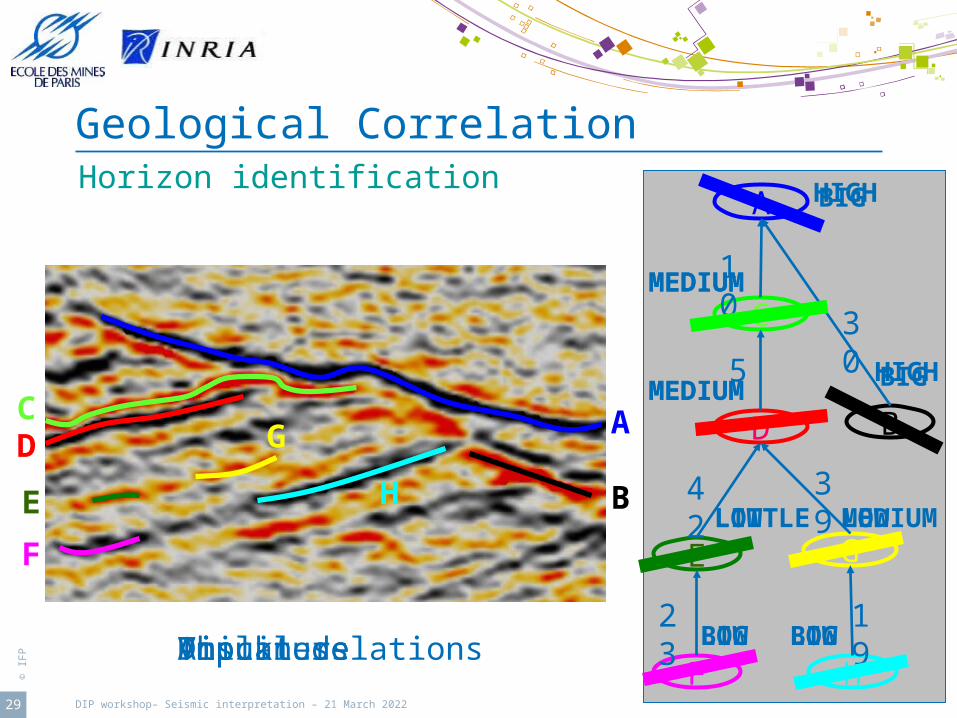
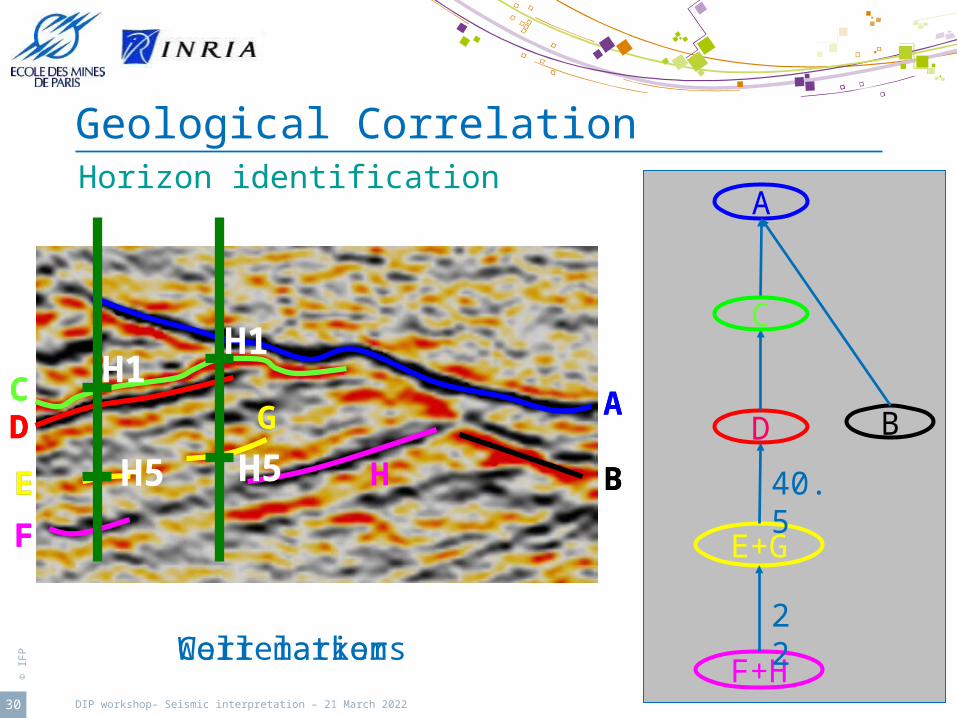
Geological Correlation Identify the geological horizons corresponding
to the various detected reflectors
© I
FP
29 DIP workshop– Seismic interpretation – 18 April 2023
Visual relationsThicknessDipAmplitude
Geological CorrelationHorizon identification
A
B
CD
F
E H
G
H
G
C
D
A
B
E
F
30
10
5
42 39
23 19
BIG
BIGBIG
BIG
LITTLE MEDIUM
MEDIUM
MEDIUM
HIGH
HIGH
MEDIUM
MEDIUM
LOW LOW
LOW LOW
© I
FP
30 DIP workshop– Seismic interpretation – 18 April 2023
H
G
C
D
A
B
E
F
42 39
23 19
C
Correlation
Geological CorrelationHorizon identification
A
B
CD
F
E H
G A
B
CD
F
E H
G
H
E+G
D
A
B
F
40.5
23 19
C
E+G
D
A
B
F+H
40.5
22
C
CD
F
H
G
Well markers
H1
H5H5
H1

© I
FP
31 DIP workshop– Seismic interpretation – 18 April 2023
Detection of the patches that identify the same horizon
Merging of all the nodes that share the same attributes and relations.
Results on a real block

© I
FP
32 DIP workshop– Seismic interpretation – 18 April 2023
Agenda
Introduction Common methodology Proposed methodology Horizon detection Fault detection Results Conclusion and
perspectives

© I
FP
33 DIP workshop– Seismic interpretation – 18 April 2023
Knowledge representation
In seismic data, dip-fault mirrors are observed as successions of horizon vertical disconnections producing reflector gapsreflector gaps.
1 dip fault = several reflector gaps sharing the same visual attributes
dip, heave (through crosslines and inlines) throw
belonging to one same plane University of Wisconsin-Stevens Point
http://www.uwsp.edu/geo/faculty/hefferan/geol320/faults13.jpg

© I
FP
34 DIP workshop– Seismic interpretation – 18 April 2023
Knowledge representation
© I
FP
35 DIP workshop– Seismic interpretation – 18 April 2023
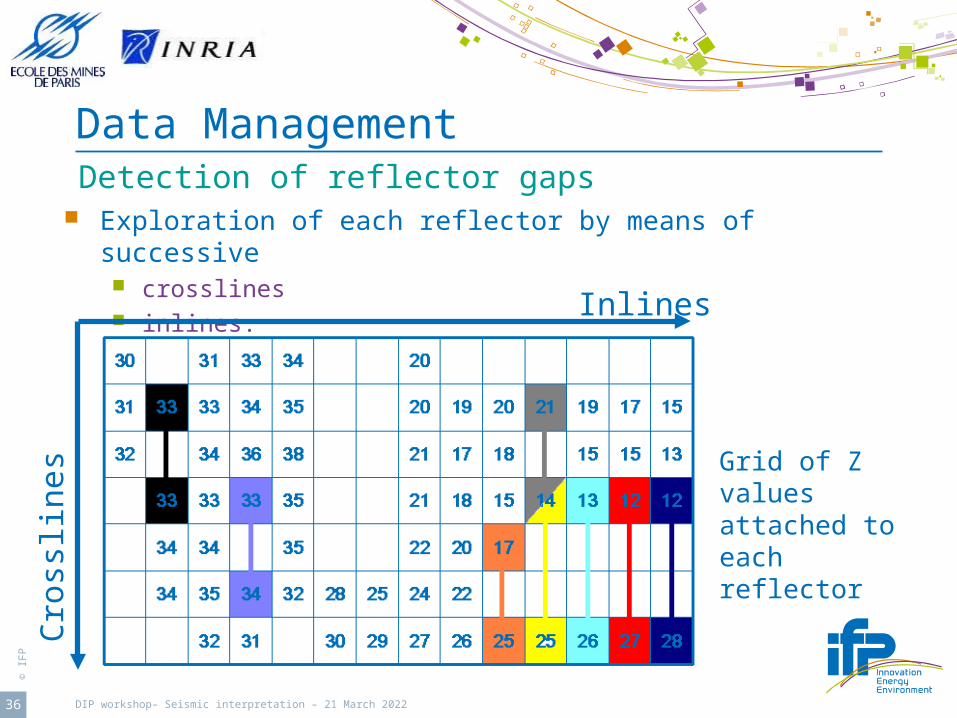
Data ManagementDetection of reflector gaps
© I
FP
36 DIP workshop– Seismic interpretation – 18 April 2023
Data ManagementDetection of reflector gaps
Exploration of each reflector by means of successive crosslines inlines. Inlines
Cro
sslin
es
Grid of Z values attached to each reflector
© I
FP
37 DIP workshop– Seismic interpretation – 18 April 2023
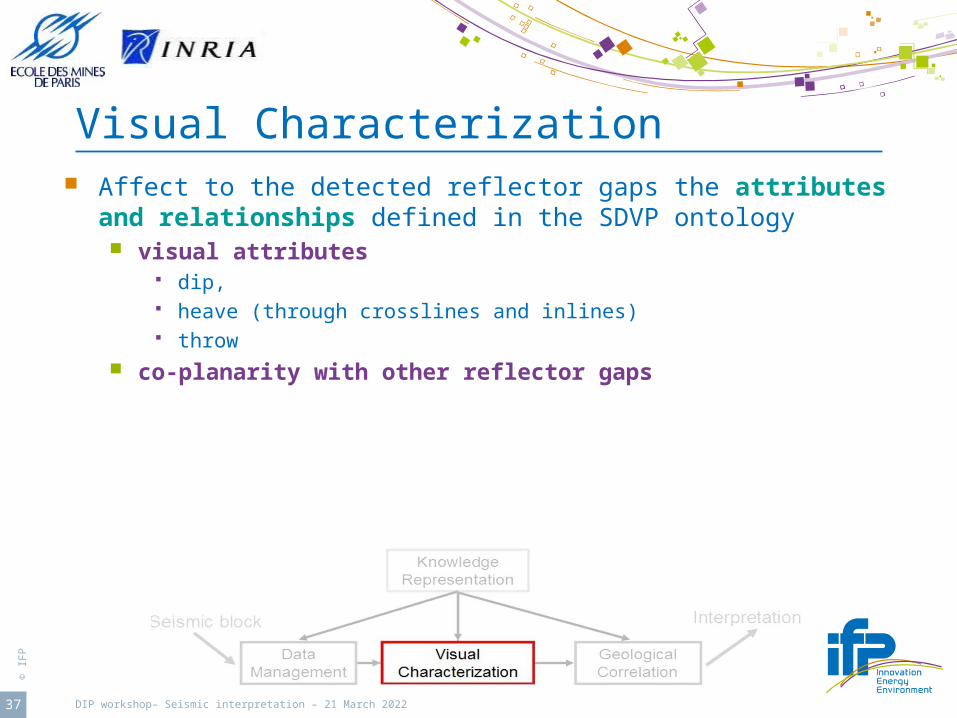
Visual Characterization Affect to the detected reflector gaps the attributes and
relationships defined in the SDVP ontology visual attributes
dip, heave (through crosslines and inlines) throw
co-planarity with other reflector gaps
© I
FP
38 DIP workshop– Seismic interpretation – 18 April 2023
Visual CharacterizationVisual attributes
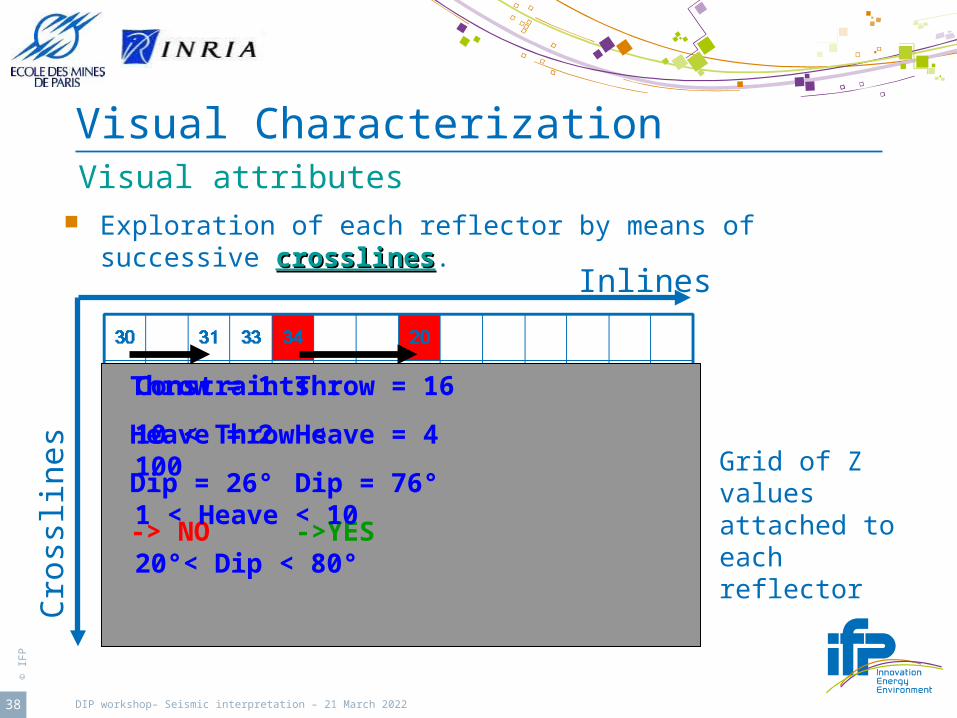
Exploration of each reflector by means of successive crosslinescrosslines.
Inlines
Cro
sslin
es
Throw = 1
Heave = 2
Dip = 26°
-> NO
Throw = 16
Heave = 4
Dip = 76°
->YES
Grid of Z values attached to each reflector
Constraints :
10 < Throw < 100
1 < Heave < 10
20°< Dip < 80°

© I
FP
39 DIP workshop– Seismic interpretation – 18 April 2023
Visual CharacterizationVisual attributes
Exploration of each reflector by means of successive inlinesinlines.
Inlines
Cro
sslin
es Throw = 16
Heave = 4
Dip = 76°
->YES
Grid of Z values attached to each reflector

© I
FP
40 DIP workshop– Seismic interpretation – 18 April 2023
Visual CharacterizationVisual attributes
Labelization of connected voxels having the same visual attributes.
Inlines
Cro
sslin
es
Grid of Z values attached to each reflector
© I
FP
41 DIP workshop– Seismic interpretation – 18 April 2023
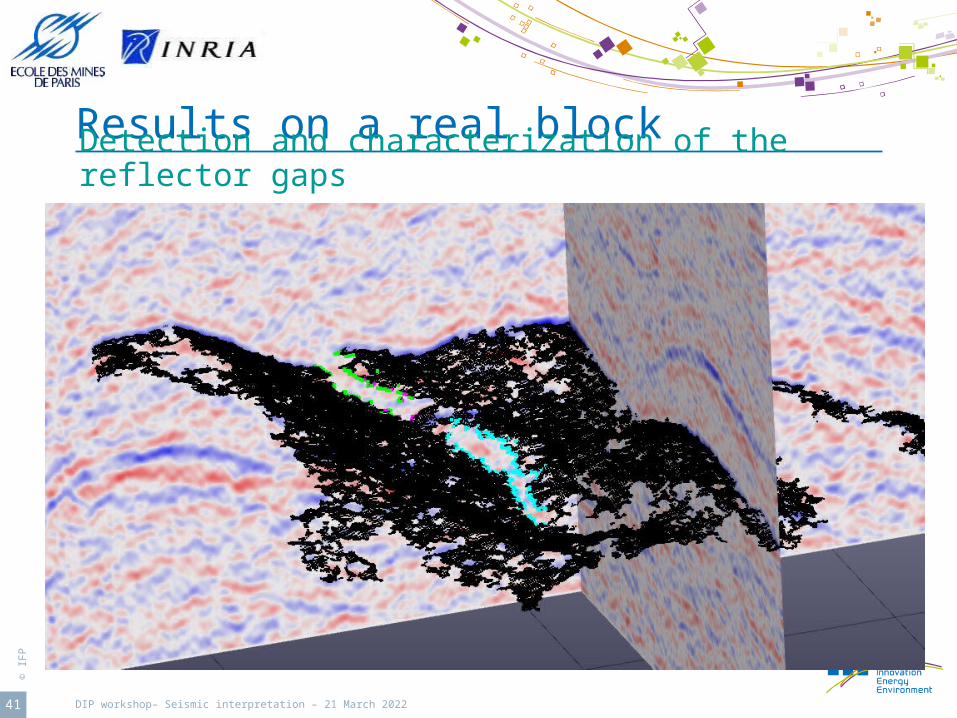
Results on a real blockDetection and characterization of the reflector gaps
© I
FP
42 DIP workshop– Seismic interpretation – 18 April 2023
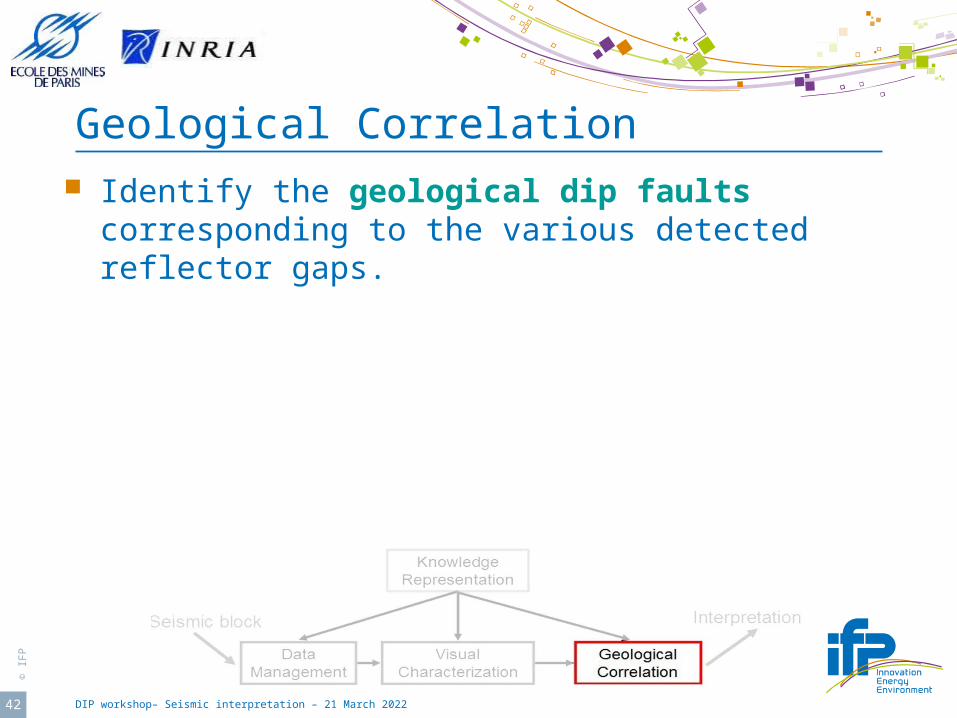
Geological Correlation Identify the geological dip faults
corresponding to the various detected reflector gaps.
© I
FP
43 DIP workshop– Seismic interpretation – 18 April 2023
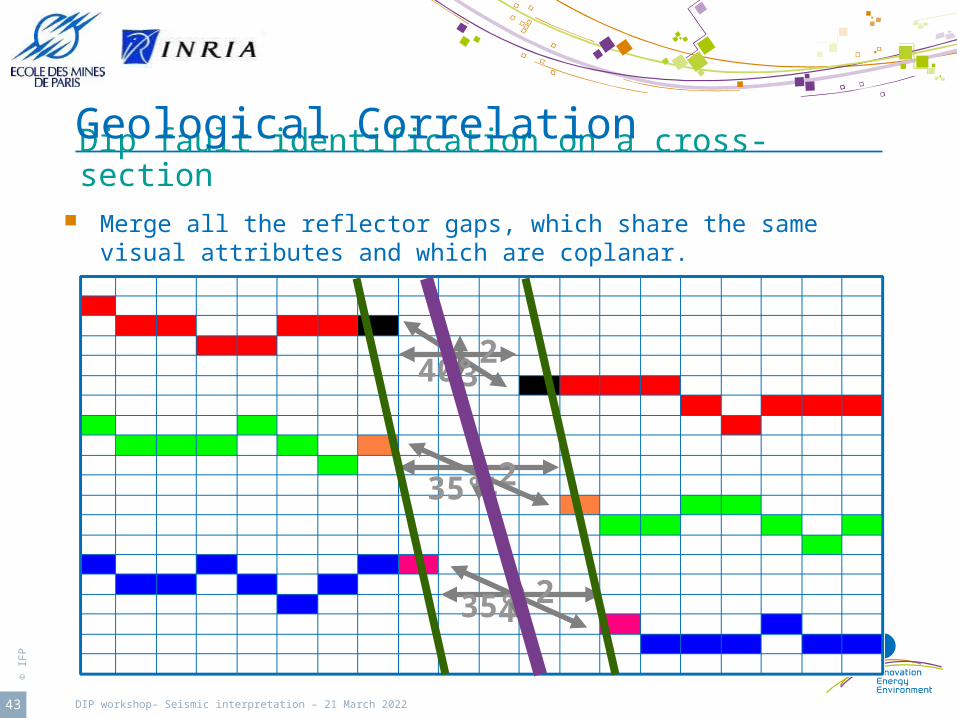
Dip fault identification on a cross-section Merge all the reflector gaps, which share the same visual
attributes and which are coplanar.
Geological Correlation
3
4
4
2
2
2
40°
35°
35°
© I
FP
44 DIP workshop– Seismic interpretation – 18 April 2023
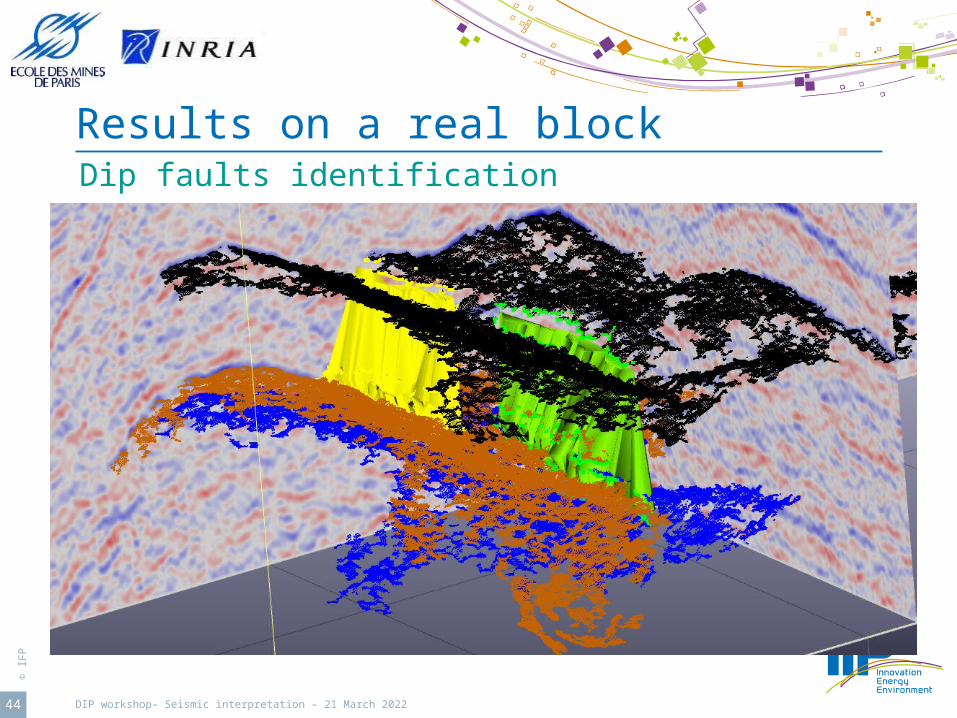
Results on a real blockDip faults identification
© I
FP
45 DIP workshop– Seismic interpretation – 18 April 2023
Agenda
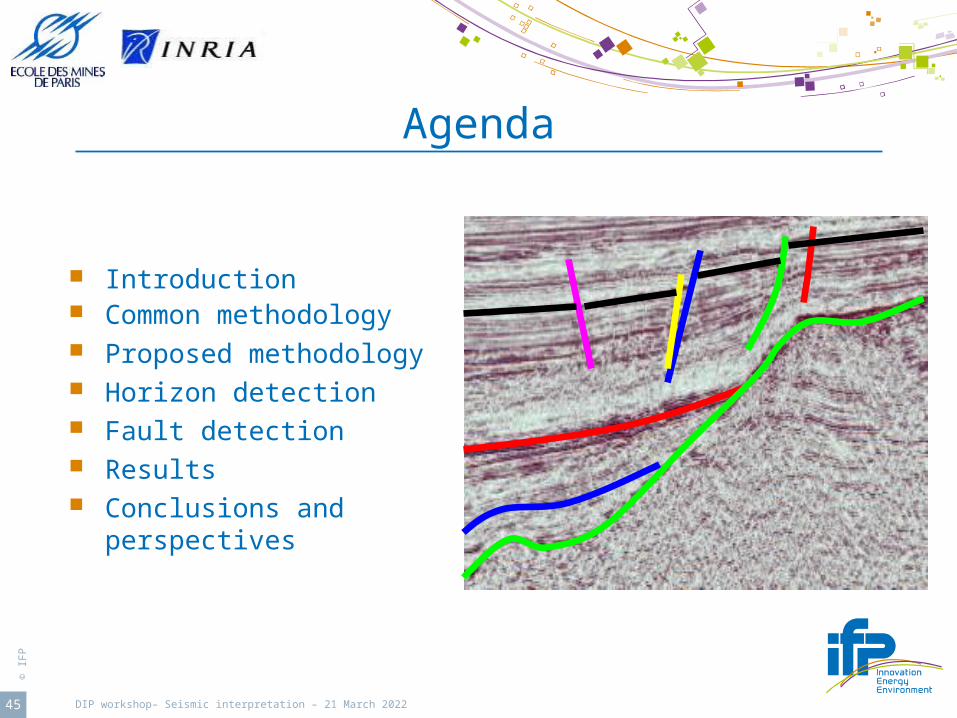
Introduction Common methodology Proposed methodology Horizon detection Fault detection Results Conclusions and
perspectives

© I
FP
46 DIP workshop– Seismic interpretation – 18 April 2023
Alwyn field Field provided by TOTAL UK. It is located east of
the Shetland islands. The structural style corresponds to tilted and
eroded fault blocks dipping to the west and aligned in a north-south direction corresponding to the main normal fault trend.

© I
FP
47 DIP workshop– Seismic interpretation – 18 April 2023
The seismic block
Acquired in 1996. Lateral resolution : 25m x 25m. Vertical resolution : around 15 meters 1163 inlines, 849 crosslines and 1001
timelines (about 4 gigabytes) Study operated only on the most
interesting part of the block (only last 351 timelines) : about 1,4 Gb.
6 wells with around 4 markers each in central part.

© I
FP
48 DIP workshop– Seismic interpretation – 18 April 2023
Comparison with validated results.
Our results are compared with the ones that students from ENSMP obtained during theirs training sessions on geophysics. Professors, who well know this block, validated the interpretations.
© I
FP
49 DIP workshop– Seismic interpretation – 18 April 2023
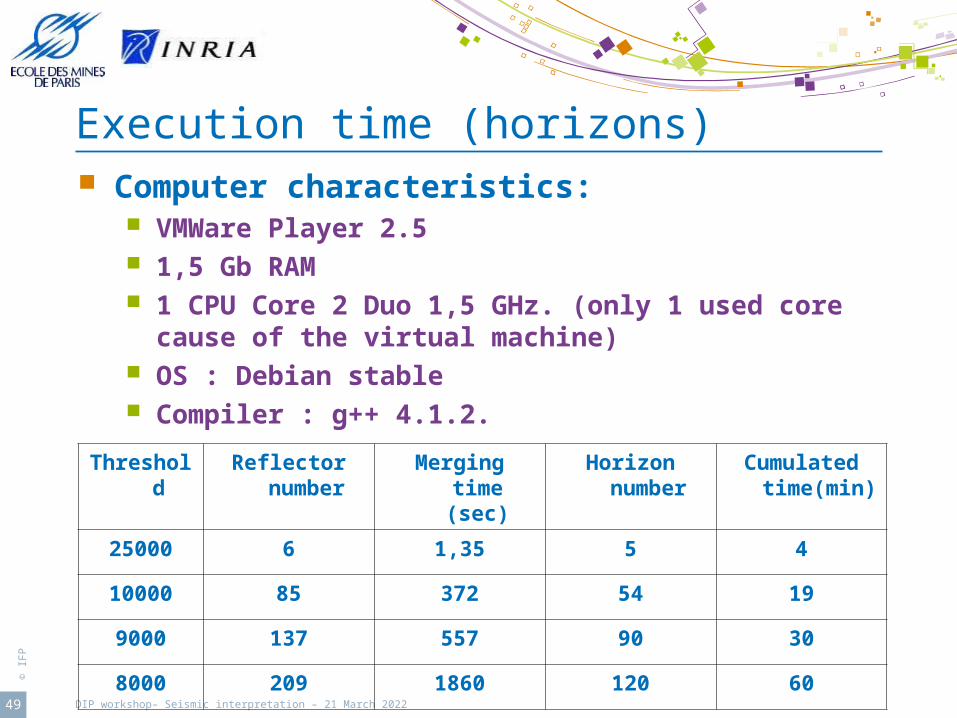
Execution time (horizons)
Threshold Reflector number
Merging time (sec)
Horizon number Cumulated time(min)
25000 6 1,35 5 4
10000 85 372 54 19
9000 137 557 90 30
8000 209 1860 120 60
Computer characteristics: VMWare Player 2.5 1,5 Gb RAM 1 CPU Core 2 Duo 1,5 GHz. (only 1 used core cause
of the virtual machine) OS : Debian stable Compiler : g++ 4.1.2.

© I
FP
50 DIP workshop– Seismic interpretation – 18 April 2023
Identification of surfaces which are associated to well markers.
Horizon identification
© I
FP
51 DIP workshop– Seismic interpretation – 18 April 2023
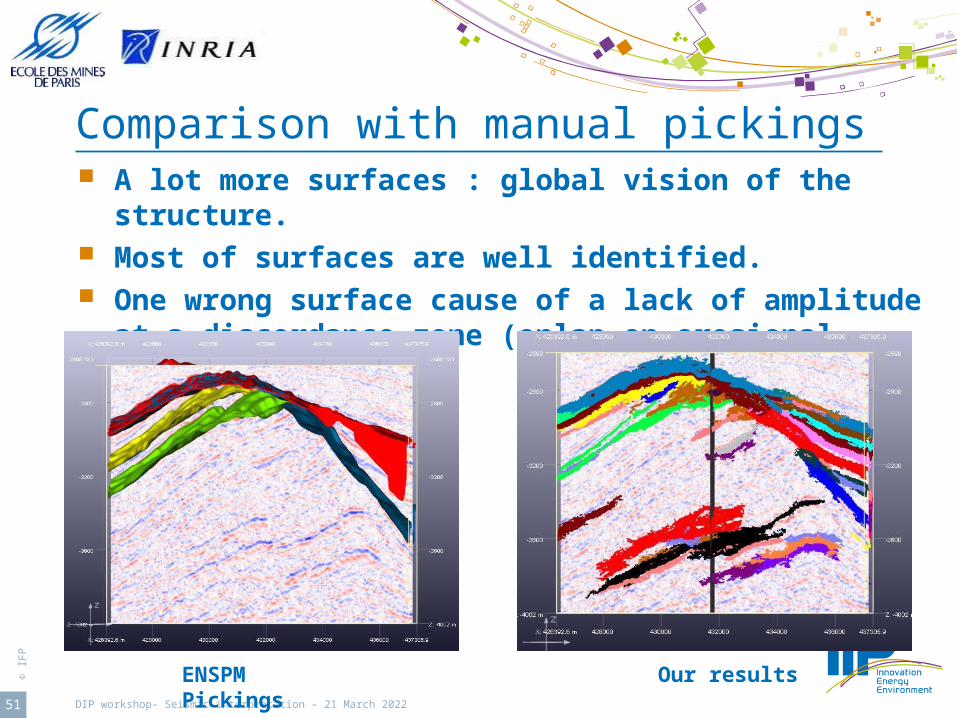
A lot more surfaces : global vision of the structure.
Most of surfaces are well identified. One wrong surface cause of a lack of amplitude
at a discordance zone (onlap on erosional surface)
Comparison with manual pickings
ENSPM Pickings Our results

© I
FP
52 DIP workshop– Seismic interpretation – 18 April 2023
Execution time (Faults)
ThresholdTime to extract and
characterize (sec)
Fault mirror number
Time to merge fault
mirrors (sec)
Fault number
25000 8,5 40 0,5 0
10000 127 1191 475 44
9000 161,5 1976 1214 101
8000 223,7 4215 5356 287
© I
FP
53 DIP workshop– Seismic interpretation – 18 April 2023
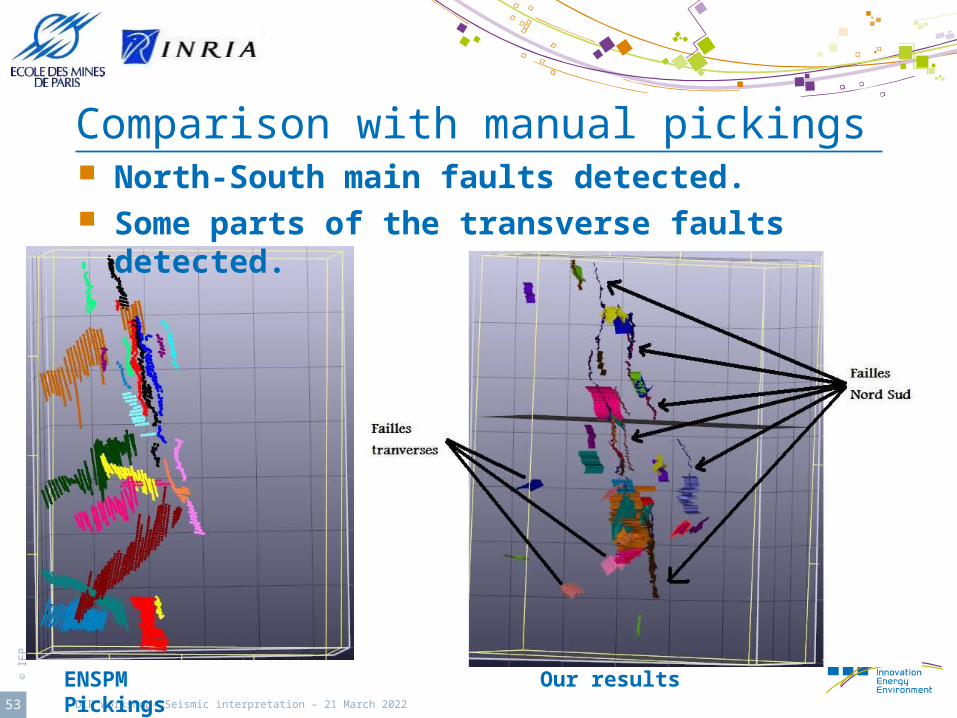
Comparison with manual pickings North-South main faults detected. Some parts of the transverse faults
detected.
ENSPM Pickings Our results

© I
FP
54 DIP workshop– Seismic interpretation – 18 April 2023
Fault Horizon mapping
Better mapping between faults and horizons..
ENSPM pîckings Our method

© I
FP
55 DIP workshop– Seismic interpretation – 18 April 2023
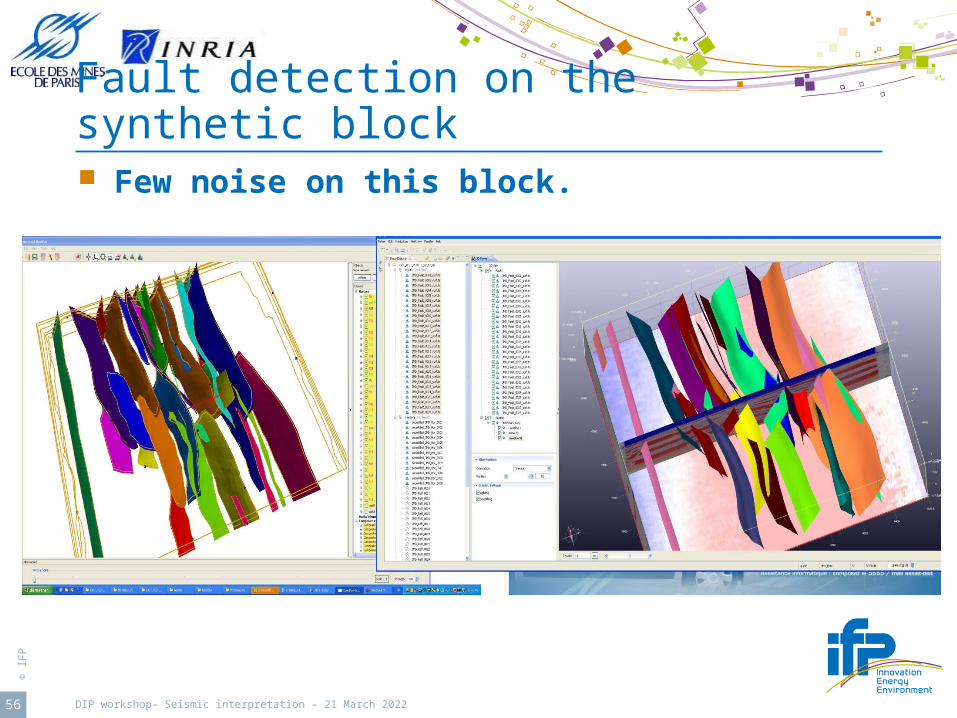
Application on synthetic block Obtained from an artificial model by
extension and compression of various sand layers.
© I
FP
56 DIP workshop– Seismic interpretation – 18 April 2023
Fault detection on the synthetic block Few noise on this block.

© I
FP
57 DIP workshop– Seismic interpretation – 18 April 2023
Store the interpretation Directly into the ontology as individuals/instances of
the concepts. Not only the data itself is stored but also the reasons (by means of (visual attributes and relationships) that led to this interpretation.

© I
FP
58 DIP workshop– Seismic interpretation – 18 April 2023
Agenda
Introduction Common methodology Proposed methodology Horizon detection Fault detection Results Conclusions and
perspectives

© I
FP
59 DIP workshop– Seismic interpretation – 18 April 2023
Conclusions (1/2) New seismic interpretation platform development :
knowledge based using visual attributes and relationships of geological objects.
Using an optimized data structure (sparse matrix) using less memory and improving computing time.
2 use cases : Horizon interpretation Fault interpretation
Validation of the methodology on a real seismic block.
© I
FP
60 DIP workshop– Seismic interpretation – 18 April 2023
Conclusions (2/2) Generic platform able to detect other geological
objects by defining: New concepts associated to visual attributes
and relationships into the SDVP ontology. New specific algorithms to extract candidates to
characterize.
Thanks to the SDVP ontology, we can store the reasons one candidate has been interpreted as a particular geological object.

© I
FP
61 DIP workshop– Seismic interpretation – 18 April 2023
Perspectives (1/2)
To introduce new concepts into the SDVP ontology Horizon boundaries for fault detection. Use of stratigraphic columns for fault detection. Chanel characterization.
V2 (more optimized data structures and a GUI)
© I
FP
62 DIP workshop– Seismic interpretation – 18 April 2023
Perspectives (2/2)
Better processing of the output in order to be better accepted by next softwares of the earth modeling workflow (smoothing, hole filling, extrapolation…) .
Store the SDVP ontology data into an ontology database (Mastella, 2009) for sharing on the semantic web and optimizing data management.
Management of the succession of the various steps of the interpretation using a workflow model (Belaid, 2009)
© I
FP
63 DIP workshop– Seismic interpretation – 18 April 2023
Thank you.

© I
FP
64 DIP workshop– Seismic interpretation – 18 April 2023
Publications
70th EAGE Conference & Exhibition An Approach of Seismic Interpretation Based on Cognitive
Vision, P. Verney, M. Perrin, M. Thonnat, JF. Rainaud, B024, Juin 2008
An approach of seismic interpretation based on cognitive vision, P. Verney, M. Perrin, M. Thonnat, JF. Rainaud, Student poster, Juin 2008.
SEG Las Vegas 2008 Annual Meeting A knowledge-based approach of seismic interpretation :
horizon and dip-fault detection by means of cognitive vision, P. Verney, JF. Rainaud, M. Perrin, M. Thonnat, pp 874-875, Novembre 2008.
Patent PROCEDE POUR CONSTRUIRE UN MODELE STRUCTURAL AU
MOYEN DE TECHNIQUES DE VISION COGNITIVE, P. Verney, JF. Rainaud, M. Perrin, M. Thonnat, numéro 08/03.178, 9 Juin 2008.
© I
FP
65 DIP workshop– Seismic interpretation – 18 April 2023
Références (1/2) [Barnes, 2006] Barnes A. E., A filter to improve seismic discontinuity
data for fault interpretation, Geophysics, vol. 71, issue 3, 2006, p. P1
[Chopra, 2005] Chopra S., Marfurt K. J., Seismic attributes — A historical perspective, Geophysics, Vol. 70, No. 5, Septembre-Octobre 2005, p. 3SO–28SO
[Fensel, 2003] Fensel D., Hendeler J., Lieberman H., Wahlster W., Spinning the semantic web. The MIT Press, Cambridge, Massachusetts, 2003
[Ganter, 1999] Ganter B., Wille R., Formal Concept Analysis, Springer, Berlin, 1999.
[Hudelot, 2005] Hudelot C., Towards a Cognitive Vision Platform for Semantic Image Interpretation; Application to the Recognition of Biological Organisms, Thèse d'informatique. Université de Nice – Sophia Antipolis, France, 2005
[Marr, 1982] Marr. D., Vision, W.H. Freeman and Company, New York , 1982
[Meldhal, 2000] Meldhal P., Heggland R., De Groot P., Bril B., Semi-automated detection of seismic objects by directive attributes and neutral networks, method and applications, EAGE 62nd Conference and Technical Exhibition, A-04, Glasgow, Scotland, 2000
© I
FP
66 DIP workshop– Seismic interpretation – 18 April 2023
Références (2/2) [Monnin, 2009] Essai de comparaison des ontologies informatiques
et philosophiques. Entre être et artefacts. XVIèmes Rencontres interdisciplinaires sur les systèmes complexes naturels et artificiels de Rochebrune, Ontologie et dynamique des systèmes complexes, perspectives interdisciplinaires., Megève, France, 2009.
[Perrin, 1998] Perrin M., Geological consistency : an opportunity for safe surface assembly and quick model exploration, 3D Modeling of Natural Objects, A Challenge for the 2000’s, 3(4-5), Juin 1998.
[Randen, 2001] Randen T., Pedersen S. I., Sonneland L. Automatic Extraction of Fault Surfaces from Three-Dimensional Seismic Data, Annual International Meeting, Society Exploration Geophycist, Expanded abstract, 2001.
[Smith, 2004] Smith M. K., Welty C., McGuinness D. L., OWL Web Ontology Language Guide, ed. W3C Recommendation, 10 February 2004, available at http://www.w3.org/TR/owl-guide/ accessed July 15th, 2009.
[Staab, 2004] Staab S., Studer R., ed. Handbook on Ontologies. Springer, Berlin, 2004.
[Thonnat, 2002] Thonnat M., Knowledge-based techniques for image processing and for image understanding, J. Phys. IV France EDP Science, Les Ulis, 12:189{236, 2002.