· ha,spital case mix costing project 1991/92
TRANSCRIPT

•• •• 1111111111111 1111111111111
au aa 1111 liD 1111 1111 •••a 111111111
1111111!1 1111111111 ·•• am ·1111 •• 1111 111!1
81!111111!11!1 111111111111!1 •• . ..
· Ha,spital Case Mix Costing Project 1991/92.
December 1994
Manitoba Centre for Health Policy and Evaluation. Depa.rtmellt of Community Health Sciences Faculty of Medicine, University of Manitoba
Marian Shanahan, R.N., M.A. Michael Loyd, M.A. Noralou P. Roos; Ph.D. Marrii Brownell, Ph. D.


Hospital Case Mix Costing Project
1991/92
Manitoba Centre for Health Policy and Evaluation Department of Community Health Sciences Faculty of Medicine, University of Manitoba
Marian Shanahan, R.N., M.A. Michael Loyd, M.A. Noralou P. Roos, Ph.D. Marni Brownell, Ph.D.


Acknowledgements
The authors would like to acknowledge the efforts and expertise that many individuals contributed in producing this report. Carmen Steinbach, Charles Burchill, Marina Yogendran and Marion Harrison provided the technical support, while Shannon Lussier and Trish Franklin prepared the final documents. Keumhee Chough Carriere and Robert B. Tate provided statistical advice.
We thank the staff at Laboratory and Imaging Services for data and help in developing costs for rural diagnostics. We also thank the many individuals at both Manitoba Health and individual hospitals who provided valuable input into the completion of this project. We especially thank Ed Golembiowski, Julene Reimer, John Gow and Marlene White for their assistance in solving some of the complex issues involved in this project.
We are grateful to the many individuals who provided feedback on a draft version of this document: Morris Barer, Jean Freeman, Phil Jacobs, Evelyn Shapiro, Charlyn Black, Carolyn DeCoster, Cam Mustard, Les Roos, Ron Wall, Victor Fuchs and Robin Currie.
We acknowledge the financial support of the Health Services Development Fund. The results and conclusions are those of the authors and no official endorsement by Manitoba Health was intended or should be inferred.

The Manitoba Centre for Health Policy and Evaluation
The Manitoba Centre for Health Policy and Evaluation (MCHPE) is a unit
within the Department of Community Health Sciences, Faculty of Medicine,
University of Manitoba. The MCHPE is active in health services research,
evaluation and policy analysis, concentrating on using the Manitoba health data base
to describe and explain patterns of care and profiles of health and illness.
Manitoba has one of the most complete, well-organized and useful health
data bases in North America. The data base provides a comprehensive,
longitudinal, population-based administrative record of health care use in the
province.
Members of the MCHPE consult extensively with government officials,
health care administrators, and clinicians to develop a research agenda that is
topical and relevant. This strength, along with its rigorous academic standards and
its exceptional data base, uniquely position the MCHPE to contribute to
improvements in the health policy process.
The Centre's researchers are widely published and internationally
recognized. They collaborate with a number of highly respected scientists from
Canada, the United States and Europe.

TABLE OF CONTENTS
I. Executive Summary . . . . . . . . . . . . . . . . . . . . . . . . . . . . . . . . . . . . . . . . 1 Findings . . . . . . . . . . . . . . . . ...... • , . . . . . . . . . . . . . . . . . . . . . . . . 1 The Implications of These Findings . . . . . . . . . . . . . . . . . . . . . . . . . . . . . . 3 Conclusions . . . . . . . . . . . . . . . . . . . . . . . . . . . . . . . . . . . . . . . . . . . . . 4
II. Introduction . . . . . . . . . . . . . . . . . . . . . . . . . . . . . . . . . . . . . . . . . . . . 6 Background . . . . . . . . . . . . . . . . . . . . . . . . . . . . . . . . . . . . . . . . . . . . . 6 Existing Case Mix Costing Methodologies . . . . . . . . . . . . . . . . . . . . . . . . . . 7
III. Methods . . . . . . . . . . . . . . . . . . . . . . . . . . . . . . . . . . . . . . . . . . . . . 11 Overview and Basic Framework . . . . . . . . . . . . . . . . . . . . . . . . . . . . . . . 11 Steps . . . . . . . . . . . . . . . . . . . . . . . . . . . . . . . . . . . . . . . . . . . . . . . . 12
1. Case Weight Development . . . . . . . . . . . . . . . . . . . . . . . . . . . . 14 2. Allocation of Manitoba Hospital Cost Data . . . . . . . . . . . . . . . . . . 18
Identifying Inpatient Costs . . . . . . . . . . . . . . . . . . . . . . . . . 18 Areas of Expenditure ................... ·. . . . . . . . . 20
3. Application of Case Weights to Manitoba Hospital Data Base . . . . . . 24 RDRG Classification . . . . . . . . . . . . . . . . . . . . . . . . . . . . 25 Assignment of RCWs to Inpatient Cases -Typical and Atypical . . . . . . . . . . . . . . . . . . . . . . . . . . . . . . . . . . . 27
i. Deaths . . . . . . . . . . . . . . . . . . . . . . . . . . . . . . . 31 ii. Transfers . . . . . . . . . . . . . . . . . . . . . . . . . . . . 33 iii. Out! iers . . . . . . . . . . . . . . . . . . . . . . . . . . . . . 35 iv. Non-acute Days - Extended Care and Panelled Patient Days . . . . . . . . . . . . . . . . . . . . . . . . . . . . 38
Comparison of Case Mix Across Hospitals Using Case Weights . 41 All Cases . . . . . . . . . . . . . . . . . . . . . . . . . . . . . . . . . . . 46 Advantages of Using CMG versus RDRGs ............. .
4. Cost per Weighted Case ............................ . 49 52
IV. Findings . . . . . . . . . . . . . . . . . . . . . . . . . . . . . . . . . . . . . . . . . . . . . 53 Urban Hospitals . . . . . . . . . . . . . . . . . . . . . . . . . . . . . . . . . . . . . . . . . 54 Rural Hospitals . . . . . . . . . . . . . . . . . . . . . . . . . . . . . . . . . . . . . . . . . 55 How Important Are the Cost Differences? . . . . . . . . . . . . . . . . . . . . . . . . . 57 How Accurately Are We Assessing Efficiency? . . . . . . . . . . . . . . . . . . . . . 59
1. Adjusting for Patient Acuity and Complexity . . . . . . . . . . . . . . . . 59 Sensitivity Tests . . . . . . . . . . . . . . . . . . . . . . . . . . . . . . . 59
2. Adjustment for Atypical Cases . . . . . . . . . . . . . . . . . . . . . . . . . 62 Other Characteristics Associated with High or Low Cost per Weighted Case . . . . . . . . . . . . . . . . . . . . . . . . . . 62
Urban Hospitals . . . . . . . . . . . . . . . . . . . . . . . . . . 62 Rural Hospitals . . . . . . . . . . . . . . . . . . . . . . . . . . . 63
Nursing Costs . . . . . . . . . . . . . . . . . . . . . . . . . . . . . . . . . . . . . . . . . . 63 Teaching Hospital Analysis . . . . . . . . . . . . . . . . . . . . . . . . . . . . . . . . . . 65
Interprovincial Comparisons . . . . . . . . . . . . . . . . . . . . . . . . . . . . 65 American Experience . . . . . . . . . . . . . . . . . . . . . . . . . . . . . . . . . 66

Table of Contents (Con!' d)
Sensitivity of the Results to Changes in the Case Weight Methodology- Relative Weights . . . . . . . . . . . . . . . . . . . . . . . . . . 67 Hospital Cost Analysis Regressions . . . . . . . . . . . . . . . . . . . . . . . . . . . . . 68
V. Quality of Care - Readmissions . . . . . . . . . . . . . . . . . . . . . . . . . . . . . . 69
VI. Limitations of the Study and Possible Improvements . . . . . . . . . . . . . . . . 70 Analyses Conducted on 1991192 Data . . . . . . . . . . . . . . . . . . . . . . . . . . . . 70 Lack of Local Cost Data . . . . . . . . . . . . . . . . . . . . . . . . . . . . . . . . . . . . 70 Transfers . . . . . . . . . . . . . . . . . . . . . . . . . . . . . . . . . . . . . . . . . . . . . 72 Appropriateness . . . . . . . . . . . . . . . . . . . . . . . . . . . . . . . . . . . . . . . . . 72 Generalizability of Results . . . . . . . . . . . . . . . . . . . . . . . . . . . . . . . . . . . 73 Other Limitations . . . . . . . . . . . . . . . . . . . . . . . . . . . . . . . . . . . . . . . . 73
VII. Suggestions for Manitoba Health and Government Policy Implications . . . . . 73
VIII. Conclusions . . . . . . . . . . . . . . . . . . . . . . . . . . . . . . . . . . . . . . . . . . . 74
References . . . . . . . . . . . . . . . . . . . . . . . . . . . . . . . . . . . . . . . . . . . . . . . . . 79

Appendix
1. Technical Appendices A to L are available from MCHPE upon request. Contact Carole Ouelette at 204-789-3805.
2. Appendix Tables A-1 to A-6 provide hospital specific information and are found at the end of this document. Tables A-7 to A-9 with RDRG specific information may be obtained upon request.


Table 1:
Table 2:
Table 3:
Table 4:
Table 5:
Table 6:
Table 7:
Table 8:
Table 9a:
Table 9b:
Table 10:
Table 11:
Table 12:
Table 13:
Table 14:
Table 15:
Table 16:
Table 17:
Table 18:
Table 19:
LIST OF TABLES
Sample RDRGs and Their Case Weights . . . . . . . . . . . . . . . . . . . . . 10
Example of RCW Methodology . . . . . . . . . . . . . . . . . . . . . . . . . . 17
Distribution of Dollars Within Hospital for All Hospitals . . . . . . . . . . . 22
Cases and Days in Each Hospital Type, 1991/92 . . . . . . . . . . . . . . . . 25
Average Number of Diagnoses per Case by Hospital Type . . . . . . . . . . 26
Adjustment Factor for Patients Whose Hospital Stay Ends in Death . . . . 32
Deaths - Cases and Days as a Percentage of Totals in Each Hospital Type 32
Multipliers for Transfers In and Out . . . . . . . . . . . . . . . . . . . . . . . 33
Transfers In (Cases Received by Hospital) . . . . . . . . . . . . . . . . . . . . 34
Transfers Out (Cases Transferred Elsewhere Upon Separation) . . . . . . . 35
Outlier Cases (Excluding Deaths and Transfers) . . . . . . . . . . . . . . . . 36
RCW vs. Case Weight for Same RDRG . . . . . . . . . . . . . . . . . . . . . 37
Non-Acute Care: Days and Cases . . . . . . . . . . . . . . . . . . . . . . . . . 40
Examples of Typical Weights From Each Resource Use Group . . . . . . . 41
Characteristics of Resource Groups - All Cases . . . . . . . . . . . . . . . . . 47
RDRGs versus CMGs - Distribution of Cases for AMI . . . . . . . . . . . . 50
Average Indexed CWC by Hospital Type . . . . . . . . . . . . . . . . . . . . 56
Percentage Savings . . . . . . . . . . . . . . . . . . . . . . . . . . . . . . . . . . 58
Significant Correlations Between CWC and: . . . . . . . . . . . . . . . . . . . 61
Hospitals and Hospital Categories 76

Figure 1:
Figure 2:
Figure 3:
Figure 4:
Figure 5:
Figure 6:
Figure 7:
Figure 8:
Figure 9:
Figure 10:
Figure 11:
Figure 12:
Figure 13:
Figure 14:
Figure 15:
Figure 16:
Figure 17:
Figure 18:
Figure 19:
Figure 20:
Figure 21:
LIST OF FIGURES
Methodology . . . . . . . . . . . . . . . . . . . . . . . . . . . . . . . . . . . . . . 13
Expenditure Distribution by Hospital Type . . . . . . . . . . . . . . . . . . . 21
Distribution of Inpatient Dollars by Hospital Type . . . . . . . . . . . . . . . 23
Distribution of Severity Levels Within Each Hospital Type . . . . . . . . . 27
Percentages of Cases in Each Severity Level, by Hospital Type . . . . . . . 28
Percentages Typical & Atypical Cases, All Hospitals . . . . . . . . . . . . . 29
Percentages of Days for Typical & Atypical Cases, All Hospitals 30
Percentages of Cases Treated by Each Hospital Type, Within Each Resource Use Group (Typical Cases) . . . . . . . . . . . . . . . 43
Distribution of Resource Use Groups Within Each Hospital Type (Typical Cases)
Average Indexed Case Weights by Hospital (Expected Average Resource Use), Typical Cases
44
45
Expected Day Weights by Hospitals . . . . . . . . . . . . . . . . . . . . . . . . 46
Percentage of Cases Treated by Each Hospital Type, Within Each Resource Use Group (All Cases) . . . . . . . . . . . . . . . . . 47
Average Indexed Case Weights by Hospital, All Cases . . . . . . . . . . . . 48
RCWs versus R!Ws for Urban Hospitals (Typical Cases) . . . . . . . . . . . 51
Average Indexed Cost per Weighted Case by Hospital (All Cases) 53
Average Indexed Cost per Weighted Case For Rural Hospitals With Northern and Federal Hospitals Separated (All Cases) . . . . . . . . . 55
Percent Status Indian & Percent Transfer-In by CWC (Urban Hospitals) 60
Percent Non-Acute Days & Outlier Weights by CWC (Urban Hospitals) 61
Occupancy Rates by CWC (All Rural Hospitals) . . . . . . . . . . . . . . . . 63
Percent Surgical Cases by CWC (Small Rural Hospitals) . . . . . . . . . . . 64
Nursing Expenditures & Nursing CWC Index by CWC (All Hospitals) . . . . . . . . . . . . . . . . . . . . . . . . . . . . . . . . . . . . . 64

Preface
In the past, the Manitoba Centre for Health Policy and Evaluation has adopted
a policy of not releasing the names of facilities that it has studied. As a research
organization, we were accustomed to keeping all such identifying information
anonymous as that is the custom for papers published in scholarly journals.
Our Advisory Board has recently recommended that we routinely identify the
health care facilities whose activities are reviewed in our reports. The Board felt that
doing so would promote a more meaningful discussion of the results, and would be
more useful to the Management and Boards of the health care facilities as well as to
the public. The Board also advised that, since our health care system is publicly
funded, everyone has a right to know about the activities of the various health care
facilities the taxpayers are supporting. Our peer organizations in Saskatchewan
(Health Services Utilization and Research Commission) and Ontario (Institute for
Clinical Evaluative Science) also routinely release the names of the facilities with their
reports. We will of course continue to maintain the confidentiality of individual
patients and physicians.
Accordingly, in this report, we have identified the hospitals. Because the
report was written prior to the Board's recommendation, you will see that the facilities
are not identified by name in the report; however, in keeping with the Board's
recommendation, we have provided an identification key (see page 76, Table 19:
Hospitals and Hospital Categories).


I. EXECUTIVE SUMMARY
The Government of Manitoba spends approximately one-third of its total operating budget on
health care, of which over half is consumed by hospitals. In view of the cost of this portion
of the health care sector and the current financial constraints. Manitoba Health asked MCHPE
to develop a method for assessing the cost efticiency of Manitoba hospitals.
Assessing efficiency is not easy due to the scarcity of detailed cost information and the
differences in the types of patients treated in each hospital. To develop our methodology, we
relied on the experience gained by Alberta and Ontario in previous work on hospital costs.
Essentially, we combined available financial information on case-mix adjusted charge data
from the State of Maryland with information on the mix of cases at each Manitoba acute care
hospital and actual Manitoba hospital budgets information. Adjustments were made for
factors expected to affect costs: non-acute care cases, very long lengths of stay, deaths and
transfers.
We used 1991/92 hospital data to develop the method described in this report. Although
significant changes have occurred since then, this year was chosen because it was relatively
free from major changes in all the health care sectors of Manitoba. Our intent was to develop
a sound method for assessing the relative efficiency of Manitoba hospitals that could be
applied to subsequent years of data.
Findings
• Our method for adjusting for case mix appears to have worked well as evidenced by
the distribution of cases across Manitoba hospitals. As one would expect, most of the
high resource-intensive cases were at the teaching hospitals.
• Manitoba hospitals differed markedly in the cost efficiency with which they delivered
care even after adjusting for differences in the case mix of patients.
HOSI' CASE MIX COSTING !991192

2
• Variations in efficiency in Winnipeg and Brandon hospitals are particularly important
since these eight institutions served 65% of the patients and accounted for 76% of the
provincial expenditures for inpatient care. The results indicate that:
Two urban community hospitals appeared to be very efticient relative to the
others, with the other four urban community hospitals ranging from 4% to
35% more expensive than the most efficient urban hospital.
The teaching hospitals, although similar to each other in costs, spent
approximately 55% more than the second most efticient urban hospitals to
provide care to patients. Indirect teaching costs do not appear to explain all
of this difference.
The teaching hospitals had a considerable portion of low acuity, low resource
use cases, evidence that they function not only as tertiary care institutions but
also as large community hospitals, particularly for pediatric and obstetric
admissions.
• The northern hospitals were higher cost institutions than other hospitals. The reasons
for this difference may be higher wages, shipping costs and, in many cases, low
occupancy rates. These hospitals were among the most expensive in every hospital
type. The cost of care was particularly high at the northern isolated institutions;
however these units accounted for less than I% of the total provincial hospital
expenditures.
• Among the major rural hospitals, three appeared to be very efficient relative to the
others. Costs at the four other (non-northern) major rural hospitals were 21% to 38%
higher than the two most efficient hospitals.
• Among the intermediate rural hospitals, three appeared to be very efficient relative to
the others. Costs at the six other (non-northern) intermediate rural hospitals were
HDSP CASE MIX COSTING J!J'.H/9:!

11% to 27% higher than the three mnst efticient hospitals. The intermediate rural
hospitals appeared to be the most efticient group of hospitals, having the lowest
overall average cost.
3
• While there were marked variations in efticiency across the small rural institutions,
findings based on one year of data for these small hospitals are problematic due to the
small number of cases.
• High occupancy rates appeared to be associated with cost efticiency in both urban
(non-teaching) and rural hospitals.
• Cost efticiency did not appear to produce lower quality care as measured hy
readmission rates.
The Implications of These Findings
These analyses suggest that substantial savings could have heen achieved by increasing the
cost efticiency of the less efticient hospitals without jeopardizing access to and quality of care,
especially since expenditures per capita on hospitals in Manitoba were substantially higher
than the Canadian average ($918 vs $802 in 1991192). Indeed, we estimated that
improvements in efticiency could have lead to savings of over 20% in inpatient expenditures.
Close to three-quarters of these estimated savings came from the teaching and urban
community hospitals. By increasing the efticiency of the provision of inpatient care at the
teaching hospitals, we estimated that over 10% of the total Manitoba inpatient budget could
have been saved.
It is important to bear in mind that these analyses were conducted on 1991192 data. Since this
time, there have been major changes in Manitoba with the teaching hospitals in particular
experiencing bed closures and budget constraints. Whether budget reductions will translate
into greater efficiency will depend on whether reductions in cases were comparatively small.
If the decrease in cases was small relative to the dollars cut at the teaching hospitals, then
their relative efficiency should improve markedly; however the opposite could also occur.
HOSP CASE MIX COSTING 1991/92

4
Clearly, replication of these analyses will be necessary not only to assess the stability of the
findings, but to provide a more current assessment of the cost efficiency of the teaching
hospitals.
Because the teaching institutions are so large and consume such a large proportion of the
provincial hospital budget, their role in the system must be scrutinized carefully. Aside from
the direct teaching costs which we excluded (salaries for interns and residents), the U.S.
reimbursement system acknowledges higher indirect costs at teaching hospitals, allowing them
12% higher costs. Even taking this into consideration, the Manitoba teaching institutions
were more costly than urban community hospitals. This was the case, despite the fact that the
teaching hospitals served a community hospital role for many patients.
Two of the urban hospitals that operated more cost efficiently than the others were also
identified in a previous study as the hospitals that discharged patients more efticiently. This
suggests that it should be possible to treat patients in a shorter time periLJd without incurring
greater costs.
Conclusions
We have highlighted marked differences in cost efficiencies acrLJss hospitals for 1991/92. If
analyses in subsequent years support our initial assessments, such data cnuld provide
important information with which to adjust global hospital budgets. We do nnt, however,
recommend moving to a system of funding hospitals based only on case-mix adjusted cnsts
because experience in both Canada and the U.S. indicates that such a system is very
"gameable". Instead, information which is gained hy such work shnuld he one tool used to
adjust budgets based on hospital performance; other indicators may include efticiency of
discharge, age, and needs of the community. Also, committees should he established within
each hospital group to monitor cost efficiency. Inefficient hospitals should be encouraged to
work with more efficient institutions to identify where improvements might be made.
HOSP CASG MIX COSTING 199119:!

5
This report also highlights the need to:
• Improve system-wide data on outpatient care and costs. Outpatient care accounts for
20% of hospital budgets and this is increasing. It is currently impossible to assess the
cost efficiency of this sector. It is important that hospitals be examined in their
entirety;
• Require hospitals to report data on non-acute patients more accurately;
• Review the rural hospital system regarding the. costs of numerous small hospitals.
Improving cost efficiency will not be easy. However, since it does not appear that more
expensive hospitals offer higher quality care, government has a fundamental responsibility to
the public to develop policies to encourage the efticient use of health care resources within the
hospital sector.
HOSP CASE MIX COSTING 1991192

6
II. INTRODUCTION
Background
The government of Manitoba spends approximately one-third of its total operating
expenditures on health care (Estimates of Expenditures for the Province of Manitoba for the
Fiscal Year ending March 31, 1994). Over half of those health care dollars are allocated to
operating costs for hospitals. In view of the cost of this health care sector and the current
financial constraints, Manitoba Health asked the Manitoba Centre for Health Policy and
Evaluation (MCHPE) to develop a method for comparing the cost efficiency of Manitoba
hospitals.
This request came in part from a report on hospital funding methods hy Black and Frohlich
(1991) that concluded global funding is one of the best mechanisms for constraining hospital
expenditures. The advantages of global funding include low administrative costs, as well as a
fairly efficient means of controlling overall cost increases. Global funding has its drawbacks,
however, including the lack of micro data which hampers efforts to analyze the efticiency of
hospitals, and the fact that funding is frequently based on precedent. The Black and Frohlich
report therefore suggested that Manitoba Health maintain global funding, providing concepts
of efficiency and effectiveness were incorporated into funding negotiations.
Following the Black and Frohlich report, Brownell and Roos (1992) undertook an initial
assessment of hospital efficiency by comparing length of stay patterns at Manitoba's major
urban hospitals. Focusing on the average length of stay for common conditions. this study
identified substantial differences across hospitals in how eftlciently patients were discharged.
While this study did not examine cost eftlciency, it did demonstrate the potential for
considerable savings in bed days across urban hospitals. It also demonstrated the importance
of adjusting for differences in patient types (case mix) when comparing resource use across
hospitals, and that administrative data could he used for this purpose.
Wall, DeCoster and Roos (1994) and Michael Loyd and Associates (1992) examined hospital
specific costs to determine the feasibility of estimating inpatient per diems for Winnipeg
HOSP CASE MIX COST! NO \9911'1:!
7
community hospitals. Two different methods and two sets of tinancial data for each hospital
were used for these estimations. The less complex method. which used the HS-1 (Hospital
Statistics, Part One)' data, was shown to be sufficiently robust for determining the costs for
urban community hospitals. The resulting per diems could not be used to assess efticiency
however, because no adjustment was made for the different types of patients treated at each of
the hospitals.
The current report expands on methods developed in the previous MCHPE reports to develop
a methodology for assessing the cost efficiency of Manitoba hospitals. Efticiency was
assessed by combining hospital-specific cost information on all Manitoba hospitals with case
mix information.
Existing Case Mix Costing Methodologies
Any hospital could determine its own cost per case simply hy dividing its expenditures by the
nm_nber of cases treated per year. Such a measure would not be comparable across hospitals
however, due to the wide range of patient types treated in different hospitals. Case-mix
costing methods employ case-mix measures to weight cases so that patients who are sicker and
require more resources are assigned greater weight. Inpatient hospital costs are calculated by
removing non-patient care cost~. and then dividing by the weighted cases to arrive at a cost
per weighted case, which can then be compared across hospitals.
One of the most commonly used case-mix classification systems is the Diagnosis Related
Groups (DRG) developed by researchers at Yale University. The DRGs group together
patients who are similar clinically in terms of diagnosis and treatment, and in their
consumption of hospital resources, thus allowing comparisons of resource use across hospitals
with varying mixes of patients. In the U.S., data on the charges for different DRGs are
gathered from several million Medicare cases each year and used as a proxy for resource use.
Relative weights are developed from these data and standardized so that a DRG with a weight
of 2.0 is twice as expensive as the average case in the database. However, because Medicare
1 Hospitals are required to file this report with Statistics Canada on an annual basis.
liOSI' -C,\SE ,'1,.11X COSTING 1991/9:!

8
recipients are primarily aged 65 or older, weights based on American Medicare patients are
not representative of all age groups, nor would they necessarily reflect the longer hospital
stays generally found in Canada.
In Canada, the Hospital Medical Records Institute (HMRl) developed and introduced Case
Mix Groups (CMGs), a derivative of DRGs, in 1983, to enable Canadian hospitals to
compare themselves with other institutions according to how efficiently they discharged their
patients. Originally, CMGs were almost identical to DRGs; today, a resemblance remains,
but subsequent CMG versions have included a few unique refinements.'
In 1987, HMRI developed case weights for CMGs, known as Resource Intensity Weights
(RIWs). Because case weight development requires large amounts of case-specitic cost data,
and because Canadian hospitals typically have little idea of how much it costs to treat
individual patients,' HMRI had to rely on case-cost data from a 1985 New York database.'
To make these data more applicable to Canadian hospitals, they used Canadian length of stay
information to adjust the New York length of stay. HMRI has relied on this same cost tlata
set for subsequent versions of its RIWs due to a continuing Jack of suitable Canadian cosr
data.' However, the usefulness of these nine-year-old data has steadily decreased with
changes in treatment protocols, advances in technology and increased tiscal pressures. As
2 Version 2, which marked the beginning of the divergence between CMGs and DRGs, expanded lht:! number of CMGs to 553. HMRI has implemented some of the refinements that'U.S. slate DRG systems have developed as well as a few of its own. HMRI is now CIHI (Canadian Institute for Health Information).
3 This is due, in part, to global funding. While global funding has the advantage of providing an efficient means of controlling overall cost increases, and lowering administrative costs rdative to the U.S. (Evans et al. 1989, Woolhandler and Himmelstein 1991), there have been few incentives to track costs per case.
4 HMRI developed its costs for some higher cost types of procedures (e.g. transplants) from sources not included in the New York cost data. It also employed other sources for some of its fine-tuning of the CMGs.
' All versions of HMRI R!Ws prior to 1994/95 were based on 1985 New York costs. New York developed these costs in an experimental project that was never repeated.
HOSP CASE MIX COSTING 199119:!

well, the 1985 New York cost data relate to an outdated set of ICD-9-CM' diagnostic codes.
The 1994/95 version of R!Ws will employ more current Maryland charge data.
9
Both DRGs and CMGs have been criticized for failing to distinguish cases according to
severity of illness. That is, cases within the same DRG (or the equivalent CMG in Canada)
may have quite different resource requirements if comorbidities or complications are present.
In response to this criticism, the researchers at Yale who developed the original DRGs
developed the Refined Diagnostic Related Groups (RDRGs) (Health Systems Management
Group, 1989). This system initially groups patients into 334 medical or surgical categories
based on combinations of JCD-9-CM diagnosis and procedure codes found on hospital
discharge abstracts. Additional diagnoses are used to subdivide the 334 categories into
different levels of severity, based on different comorbidities and complications (CCs) expected
to have an impact on resource use. Medical categories have three levels of severity ranging
from no/minor CCs to major CCs whereas surgical categories have an additional level of
severity: catastrophic CCs (Fetter, 1991). Two examples, one surgical and one medical
(Table 1), demonstrate the types of CCs associated with the various RDRG categories.
In 1989, Alberta Health introduced a new funding system which used RDRGs for case-mix
costing. Rather than applying RDRGs directly to a cost data set however, Alberta used the
1985 New York cost data by mapping New York DRG per diem weights onto CMGs, which
were subsequently mapped onto RDRGs. Numerous problems involved in this methodology
called into question the validity of these weights (Jacobs, Bay and Hall, 1993).
Due to the myriad problems associated with existing case-mix costing systems and available
case weights, we opted to develop our own set of weights for the current efficiency study,
using RDRGs to capture differences in severity of illness and using more up-to-date charge
data.
6 International Classification of Diseases, 9th revision, Clinical Modification.
HOSI' CASE MIX COSTING 1991/92

10
Table 1: Sample RDRGs and Their Case Weights
RDRG
1540
1541
1542
1543
1270
1271
1272
Description
Surgical
Stomach, Esophageal & Duodenal Procedure
Stomach, Esophageal & Duodenal Procedure
Stomach, Esophageal & Duodenal Procedure
Stomach, Esophageal & Duodenal Procedure
Medical
Heart Failure & Shock
Heart Failure & Shock
Heart Failure & Shock
Severity Level
No/Minor CCs
Moderate CCs -e.g., renal colic
Severe CCs-e.g., cellulitis of trunk
Catastrophic CCs -e.g., acute myocardial infarction
No/Minor CCs
Moderate CCs -e.g., closed skull fracture
Severe CCse.g., Cerebral Vascular Accident
RCW7
1.98
3.13
3.78
6.62
1.02
1.32
2.13
Marginal Cost Weight
.161
.193
.207
.223
.141
.145
.166
7 RCW - Relative Case Weight and Marginal Cost Weights will be referred to in following sections. It is sufficient to say here that a larger RCW implies a more expensive case.
HOSP CASE MIX COSTING 1991/91

11
III. METHODS
Overview and Basic Framework
We have paid extraordinary attention to detail in the development of this methodology,
improving on systems developed and used by the Ontario and Alberta governments. This
section provides a brief and non-technical introduction to case-mix costing for the general
reader who wants a succinct description of the approach. The appendix is available for those
readers interested in a detailed description of the technical aspects of the methodology.
A hospital's cost per weighted case is its own inpatient costs for the year (derived mainly
from HS-1 data) divided by its total weighted cases. To calculate the hospital's total weighted
cases, one sums the case weights, which are composed of the relative case weights (RCWs),
and adjustment factors for atypical cases.
Using the cost per weighted case, one can compare hospital inpatient costs across different
classes of hospitals with different mixes of patients. A hospital's average cost per weighted
case may exceed the provincial average because its average length of stay exceeds the
provincial average for its mix of patients and/or its cost per day exceeds the average for its
patient mix. In addition to case mix, one must examine other variables that drive costs to
determine whether a hospital's comparatively high case costs result from inefticiency or from
some other cause such as "teachingness" or a northern location.
We used 1991/92 hospital data to develop the method described in this report. Although
significant changes have since occurred, this year was chosen because it was relatively free
from major changes in all the health care sectors of Manitoba. Our intent was to develop a
sound method for assessing the relative efticiency of Manitoba hospitals that could be applied
to subsequent years of data.
The major steps involved in this project are listed below, providing an outline of how the
various data sets were combined to develop specific case weights for every inpatient case as
HOSP CASE MIX COSTING 19'Jl/92

12
well as an average cost per weighted case for each hospital. These steps are expanded in the
subsequent sections of this report and in the appendix. A flow chart of the methodology is
given in Figure 1.
Steps
1. Case Weight Develooment using Maryland Charge Data for 1991 & 1992 ( -630,000 cases annually)
a) Average length of stay (ALOS) calculated for each RDRG b) Case charges for all typical cases in each RDRG category determined and
converted to weights c) Marginal costs' for each RDRG category determined for Manitoba outlier
days from Maryland charges and converted to weights
using Manitoba hospital discharge data for 1990/91 and 1991/92 ( -175,000 cases annually)
d) Trim point' and ALOS for typicaJI0 Manitobapatients, in each RDRG category calculated"
e) Manitoba relative case weights (RCWs) calculated for each RDRG using Maryland case weights adjusted with Manitoba ALOS
2. Allocation or Manitoba Hospital Cost Data using HS-1 hospital data, 1991192
f) Hospital specific inpatient costs ascertained from budgetary data reported by each of the 76 acute care facilities
3. Application or Case Weights to Manitoba Hospital Data Base using Manitoba hospital discharge data for 1991192 and 1992/93 g) All patients with hospital days in 1991/92 were classitied into RDRGs -
175,000 cases -only days within the 1991/92 tiscal year included h) Each 1991/92 inpatient case weighted using Manitoba RCWs
8 The t~rm "marginal cost" is the cost for an additional day in hospital. \V~ converted tht! marginal cost into a weight that was applied to all days of stay after ALOS once the patient stayed heyond the trim pui111 (Note 9).
9 Trim point is the point after which a length of stay is determined to he abnormally long.
10 The definition of a typical patient simply refers to all patients who are relatively homogenous in their resource use within their RDRG, where the stay does not involve transfers, end in death, have non-acute days or days beyond the trim.
11 Two years of data (1990/91 and !991192) were used to determine ALOS and trim. If there were less than 15 cases in an RDRG the ALOS was estimated using available data from adjacent RDRGs. This procedure is described in Appendix A.
HOSP CASE MIX COSTING I!JJI/9:

Figure I: Methodology
Maryland Charge Maryland Patient 1990/91 & Manitoba Hospitals Data 1991 & 1 992 Data 1991 & 1992 1 991/92 Manitoba Inpatient$
Patient Data 1 991/92
\ .11 \II
\ !; \ I; ALOS by Typical RDRG a Patients
\ II Marginal
\II Cost/Case Cost by
by RDRG b RDRG c \ I; Trim & ALOS \ I
\ I; \ I! by RDRG d
Manitoba
--- Relative ..---- 1991/92
/ Case Weights ~ Patient Data
e g
--- ..----/
\ I; "-._
Hospital ...___ ..---- Hospital
"' Specific Case 0 / "-._ Specific
~
Weights ~ h,i,j,k \ I; n Costs f > ~
"' " ;;; n Hospital Average 0 ~
:! Costs per z 0 Weighted Case I ~ s
"'

14
Steps
i) Adjustment factor for non-acute days, outliers, transfers, deaths j) Calculation of hospital specific case weights = sum all case weights in each
hospital k) Calculation of hospital specific average case weight = sum all case weights in
each hospital/total hospital cases
4. Calculation of Cost per Weighted Case I) Hospital average cost per weighted case = Total inpatient dollars (from point
2 above) I Total hospital case weights (from point 3 above)
1. Case Weight Development
When Alberta and Ontario introduced funding systems linked in part to the types of cases
treated, they were forced (as we were) to estimate the relative costs of different types of cases
using American hospital charge data. This approach assumes that relative costs are, on
average, similar across jurisdictions. Tltat is, in both countries it will be more costly to treat
a patient undergoing bypass surgery or bone marrow transplant than to care for a mother and
baby involved in a normal delivery. Since Canadian hospitals typically have longer lengths of
stay than American hospitals, we have followed the approach used hy HMRI and Jacobs eta!.
(1993), in adjusting for Manitoba typical lengths of stay.
In Alberta, Jacobs, Bay and Hall (1993) used Maryland data from 1990 and 1991 to develop
marginal cost weights and case weights with length of stay adjustments. This methodology
provided the basis for the current methodology. We chose data from the 1991 and 1992
Maryland Health Services Cost Review Commission data set," which includes the charges
for acute care patients in all Maryland general hospitals (including several teaching hospitals).
to develop the RCWs for three main reasons.
• New Maryland case charges are available each year, subject to data collection and
processing delays of about one year. Thus, changes in treatment protocols and the
J:: Features of the Maryland data set and a description of the regulatory environmt!nt are ,given in Appendix K.
HOSP CASE MIX COSTING 199119:!

resultant relative case charges, as well as lCD-9-CM changes. are reflected in the
data.
• Maryland charges reflect all acute cases in the state, not just a subset, such as
Medicare-based DRGs' over-65 year age group (plus dependents) or the patients of
only some of the payers in a system.
• State regulation ensures that Maryland hospital charges retlect actual costs." more
than in hospitals which are free to vary mark-ups across product lines and thereby
destroy relativity between costs and charges."
15
The two years (199!, 1992) of Maryland charge data were combined with two years
(1990/91, 1991/92) of Manitoba length of stay data to develop the RCWs. The RDRG
classification system groups inpatient cases into I, 170 potential RDRG categories, using ICD-
9-CM diagnostic information and procedural codes as well as other hospital abstract data. A
standardized relative case weight (RCW), was developed for each category, representing the
expected relative cost of treating the average case in an RDRG. (RDRGs and their RCWs are
available upon request). In essence, the RCW for an RDRG is based on the average charge
for treating the average patient in that RDRG in the average Maryland acute general hospital,
adjusting for differences between Maryland and Manitoba hospitals in average length of stay
for that RDRG. A detailed description of the allocation of Maryland charges can be found in
Appendix A and steps required to derive and adjust Maryland marginal costs are provided in
Appendix B.
Relativity among RCWs was established by indexing the average case costs of each RDRG
against the average case cost for all RDRGs, which was assigned a value of 1.00. Thus, the
anticipated cost of a case in the RDRG for heart failure with severe co morbidities and
IJ In light of this, we will use the terms ncharges" and "costs" interchangeably when referring to the Maryland data.
14 Other researchers have shown that differences between charges and costs are increasing only slightly and that charge-based weights are more likely to represent the true dispersion between high and low resource use DRGs (Carter and Farley, 1992).
HOSP CASE MIX COSTING 199119::!

16
complications (CCs) (see Table I) with an RCW of 2.1 is roughly twice the average case
cost; a case with an RCW of 0.81 is expected to be 19 percent less costly than the average.
A high RCW index does not necessarily imply that the average case in that RDRG involves a
high intensity of expensive servicing; RDRGs with comparatively long lengths of stay and low
daily intensities of servicing will also tend to have high case weight indices.
Our model adjusts typical RCWs for classes of cases whose average costs differ systematically
from the typical weights for the RDRGs to which they belong. These classes of cases.
denoted atypicals, consist of outlier cases (which stay much longer than the average), cases
that end in death, and transferred-in and transferred-out cases." The model also applies
special weights to the non-acute portions of cases, det1ned as cases that are panelled (waiting
for placement in a personal care home) or receiving care on a lung-term unit."' Further
details regarding our treatment of atypical cases can be found in the section: Application of
Case Weights to the Manitoba Hospital Data Base.
The relative case weights are known as standardi2ed weights because the RCW that a
Manitoba hospital receives for a case depends only on its RDRG class ant! rypical or arypical
status. The RCW is otherwise independent of the actual costs of treating the particular
patient. For example, each Manitoba hospital would be credited with the same weight for a
typical case in an RDRG irrespective of whether the specitic case wore more expensive than
the RDRG average or whether the hospital is generally a very ineftlcient or high cost
institution.
An example of how the Manitoba RCWs were calculated is fount! in Table 2 where the
assumption is made that there are only 5 RDRGs that incluue all possible uisease processes.
Manitoba estimated costs (Column F) are calculated using Maryland case and marginal costs
and Maryland and Manitoba average lengths of stay for each RDRG. given in equath>n I:
J!i The daily costs of these atypical cases and their behaviour n\'er Jiffer~nt portions of the stay were inferred from Maryland data. The length Of stay effects Wl!fd deri\'ed from !vlanitoha Uata.
16 These weights were largt:iy based on Manitoha data.
HOSP CASE MIX COSTING 191Jli'l:

Manitoba Estimated cost {F) = B + [(E-D) • C], where
B is Maryland case costs
(E - D) is the difference in ALOS between Maryland and Manitoba
C is the Maryland Marginal charge
17
Total resource expenditure is then calculated using the Manitoba Estimated Costs and the total
number of Manitoba cases for each RDRG, given in equation 2:
total resource expenditure (H) = F • G where
F is the Manitoba estimated cost
G is the total number of Manitoba cases
The total resource expenditure (Column H) is summed across all RDRGs (I .665,000) and is
then divided by the total number of cases (Column G) summed across all RDRGs (350) to
obtain the average estimated charge (4757) for the data set. The RCW for each RDRG is
then calculated by dividing the Manitoba estimated charge for each RDRG (Column F) by the
average estimated charge for all RDRGs (4757). In this example, if the 5 RDRGs and
frequency of cases defined the whole population of the provincial hospital data set, the relative
weights in column I would be the RCWs for typical cases in those RDRGs.
Table 2: Example of RCW Methodology
TOTAL COST/ MARGINAL Mil MR REL CASE COST ALOS ALOS ESTIMATEI> Mil EXI'ENI> CASE
RDRG MYLD MYLI> MYLI> MR COST CASES -ITURES WT
A B c D E F~ G H~ I~
B + l(E- G*F F/4757 D)*C]
1 1,000 100 5 6 1,100 100 110,000 0.23
2 2,200 200 10 15 3,200 100 320,000 0.67
3 7,000 250 12 II 6,750 50 337,500 1.42
4 10,000 500 20 25 12,500 50 625,000 2.63
5 5,000 450 3 4 5,450 50 272,500 1.15
TOTAL 25,200 350 I ,665,000
HOSI' CASE MIX COSTING 1991/92

18
2. Allocation of Manitoba Hospital Cost Data
Iderzti.fyillg lllpatierlt Costs
Historically, Canadian hospitals have been funded on the basis of global budgets, fixed
envelopes of money with which they are obliged to provide services. While there have been
general funding guidelines, such as one full-time equivalent (FTE) for 27,250 kgs of laundry
processed and one FTE per 2,500 meal days/7 there are many historical arrangements of
one institution being funded to provide services for another which make the identification of
hospital-specific costs a daunting challenge.
All Canadian hospitals annually file HS-1 forms with Statistics Canada. The HS-1, which
consists of hospital costs and statistics in an aggregate form, was the primary source of
financial data for our analysis. We focused on inpatient costs, excluding the costs of
hospitals' outpatient activities, their non-patient care activities and the overheads associated
with these activities. 18 A more complete efficiency analysis would focus on both inpatient
and outpatient services. Although hospitals report outpatient surgical activity, outpatient
services were excluded from this analysis because detailed diagnostic coding of non-surgical
outpatient activity is not required, hence case-mix adjusted comparisons of outpatient
expenditures with outpatient activity could not be made. Moreover. outpatient case-mix
adjusted costing methodologies are largely in the developmental phase.
Hospitals make detailed reports on all inpatients treated, therefore our analysis of cost
efticiency focused on inpatient activity. This focus on only one portion of hospitals' output
made it necessary to allocate overhead costs (such as administration or housekeeping services)
as well as diagnostics (laboratory and radiology), therapeutics. drugs and medkal ami surgical
supplies to both outpatient and inpatient activities. Indicators, such as weighted units for
physiotherapy and meal days were used to allocate costs between inpatient and outpatient. In
17 Personal correspondence August ll, 1994.
18 Excluded costs are medical reimbursements, interns' and residents' salaries, special research, the direct costs of teaching programs (teachers' salaries and trainee remuneration), heating costs of University of Manitoba Medical School and Cadham Laboratory, all outpatient costs including those for outreach clinics, interest payments and depreciation. See Appendix G.
HOSP CASE MIX COSTING 1991/9':!

19
order to ensure accurate allocation of overhead. costs wue allocateu to uutpatient cust centres
and non-patient care areas prior to their exclusion. Observation units (OU) are included in
outpatient departments but many urban hospitals in fact admit patients while they are in OU
and they may remain there for several days. We determined the inpatient days spent in OU in
each hospital, and for that group of patients, an average cost of $307 per day spent in the
Observation Unit was added to inpatient costs." We were then ahle to arrive at an estimate
of total inpatient costs.
The lack of outpatient cost centres in many rural hospitals necessitated the development of an
average cost per outpatient visit to fully remove outpatient costs from these hospitals. The
average cost per visit was compiled using data from those rural Manitoba hospitals which
captured salaries and supplies in outpatient cost centres.
The HS-1 data were supplemented by other sources including data from Finandal Information
Systems (FIS), Laboratory and Imaging Services (LIS)'". Community Therapy Services
(CTS) and South Central Therapy Services (SCTS). FIS data were used to provide audited
and inventory-adjusted cost data for drugs, and medical ant.! surgical supplies fur the rural
hospitals. 21
LIS provides diagnostic services for many rural hospitals. Hospitals have agreements with
LIS to pay for these services, but in many instances charges are based on historical
arrangements and may not reflect the actual costs for each facility. Therefore, we excluded
laboratory and imaging costs from the HS-1 data and used data provided by LIS.
19 These costs were based on actual cost data (including overhead costs) for the one hospital for which financial data was reported for the observation unit.
"' Data were provided by LIS staff for all hospitals for which they provide services.
21 Some rural hospitals do not have audited and inventory adjusted information available when the HS-1 is filed.
HOSP CASE MIX COSTING 1991192

20
Expenditures on staffing and supplies, and statistics for inpatient and outpatient activity were
used to estimate the costs of imaging and laboratory services for each rural hospital."'
Occupational therapy and physiotherapy may be provided by outside agencies without direct
charges to hospitals. Community Therapy Services and South Central Therapy Services
(SCTS)" provide services for several hospitals and the costs of these services were attributed
to the hospitals which are served by these therapy services. A more complete discussion of
the stepdown methodology and the estimation of laboratory, radiology and imaging costs
(including other assumptions used in the development of inpatient costs for each hospital) is
found in Appendix G.
Areas of Expenditure
Manitoba hospitals were classified into the following groups based on function, location and
size:" teaching, urban community, major rural, intermediate rural, small rural, multi-use
and northern isolated. A complete listing of hospitals in each group is found at the end of
this report.
While results are presented for all groups of hospitals, emphasis is given to the results as they
pertain to the urban hospitals (teaching and urban community) due to the percentage of the
total provincial hospital budget consumed by these facilities. Manituha Health payments to
!:! Thompson Hospital does not use LTS, while Churchill uses only the administrati\'c and educational facilities. There are two types of arrangements with other rural hospitals: LIS provi~ing all staff and supplies or LIS providing only supplies and administrative services.
23 Morden Hospital, from which the SCTS is run, may he attributed with hi,ght!r than actunl l:Osls for treatment to their patients as current accounting methods do not allow for full allocation of the O\'t!rhcad of SCTS.
" This was done by Manitoba Health Capital Planning and Charlyn Black for the Population Health Information System: Utilization of Hospital Resources, an~ reflects the size an~ function of the hospitals in 1991192.
HOSP CASE MIX COSTI!"G ]f)JJi<r.

Expenditure Distribution by Hospital Type
Figure 2a: Teaching Oher Excluded 13%
Inpatient 58%
Figure 2b: Urban Community a her Excluded 10%
. . . ~ ·.
fll·· !""~"co• Remuneration 5%
& Residents 0%
'I
Figure 2c: Rural
21
HOSP CASE MIX COSTJNG 1991/9:!

22
the two teaching and six urban community hospitals were $677 million in 1991/92, which
accounted for 80% of the total public general hospital budget.'-'
Figures 2a-2c illustrate the variation in expenditures across hospital types. Inpatient costs
ranged from 58.3% of teaching hospital budgets to 68.5% of rural hospital budgets. The
"other excluded" category consisted of such items as education and research costs, heating and
services for the University of Manitoba Medical School and Cadham Laboratory. Excluded
costs, i.e., those not directly associated with inpatient or outpatient care, were larger for
teaching hospitals than for urban community and rural hospitals, 13.3% compared to 9.5%.
Hospital specific information is found in Table A-1.
Medical remuneration, excluding intern and resident salaries, accounts for 5.4% of teaching
hospital budgets compared to 1.6% of the rural hospital budgets. The removal of all medical
remuneration was necessary to allow a comparison across hospitals as some hospitals pay the
total salary for all physicians employed in the community and other hospitals have little or no
salary expenses.
Table 3: Distribution of Dollars Within Hospital for All Hospitals
Category All Hospitals
Inpatient Services 63.2%
Outpatient 19.4%
Medical Remuneration 4.6%
Interns & Residents 1.4%
Other Excluded 11.4%
25 Annual Report 1991-92, Manitoba Health Services Commission.
HOSP CASE MIX COSTING 1991192

Figure 3: Distribution of Inpatient Dollars by Hospital Type
Multi·UH & N. lao! 1% Small Rural
I ntsrmsclla1e Rural
MaJor Rural 1
Taachlng 46%
Urban Community 30%
23
Overall, inpatient services accounted for 63.2% of hospital expenditures (Table 3). Of these
expenditures on inpatient care, 46.3% were spent at teaching hospitals, and teaching and
urban community hospitals combined accounted for 76.7% (Figure 3). Northern isolated
hospitals, shown later to have the highest costs per weighted case, accounted for less than 1%
of the overall inpatient budget. These proportions underscore the importance of focusing on
the urban and par1icularly the teaching hospitals concerning issues of efficiency.
While considerable effort went into compiling total costs of patient care at all hospitals, there
are missing costs. Some costs for work done by one hospital for another were not allocated
to the appropriate centres because information was not available for us to do so.16 A more
complex accounting system would be necessary to track services supplied by one hospital for
"" If the patient was at hospital A but a test was performed at hospital B both the test and the costs would be excluded from both hospitals' inpatient data, since the test would be classified as either "outpatient" or "referred-in,,
HOSP CASE MIX COSTING 199119:!

24
another so costs could be allocated back to the hospital where the patient was admitted. Data
were also not available for Cadham Laboratory27 nor the Red Cross (blood products and
tests). In order for the data to be complete we would need the actual costs from both the
Cadham Laboratory and the Red Cross for services provided to hospitals, with a distinction
made between inpatients and outpatients. Despite these gaps in information, the overall effect
was not expected to be significant.
3. Application of Case Weights to the Manitoba Hospital Data Base
Hospital abstracts submitted to Manitoba Health for the 1991192 fiscal year were used to
obtain case-specific information. The total number of cases used for analysis was 175,062."
The total cases and days at each hospital type in Table 4 indicates that the teaching hospitals
provided 36% of the days of care (whereas they accounted for 46.3% of the inpatient
expenditures, Figure 3) and urban community hospitals used 35% of the days (and accounted
for 30.4% of the inpatient expenditures, Figure 3).
27 Other than services which are provided by LIS.
"Inadvertently, 800 cases were double counted, however additional analysis indicated that this did not have a significant impact on results.
HOSP CASE !'.fiX COSTING 1991/92

25
Table 4: Cases and Days in Each Hospital Type, 1991/92t
Proportion Proportion of Total or Total
Hospital Type Total Dayst Total Days Casest Cases
Teaching 563,701 0.36 61,221 0.35
Urban 541,288 0.35 52,228 0.30 Community
Major Rural 211,753 0.14 29,886 0.17
Intermediate 76,717 0.05 10,145 0.06 Rural
Small Rural 149,540 0.10 19,093 0.11
Multi-use 10,237 0.01 1,035 0.01
Northern Isolated 6,596 0.004 1,454 0.01
TOTAL 1,559,832 1.01 175,062 1.01
t Does not include those cfl.!lcs (u.nd dnys) not yet discharged us of March 31, 1993.
· * Mny not = 1 due to rounding.
RDRG Classification
In order to account for the different mix of patients seen at different hospitals, all separations
from Manitoba acute care facilities were grouped into RDRGs."·'0•31 This classification
system is dependent on the coding done on individual hospital abstracts at each of the
hospitals. Table 5 illustrates that, by current coding practices, the patients at the teaching
hospitals averaged a higher number of diagnoses on the discharge abstract. This is consistent
29 It has been previously determined that the Manitoba hospital data are adequate for identifying the mix of patients treated, with diagnosis and procedures codes recorded with a high rate of validity (Roos, Roos, Cageorge & Nicol, 1982; Roos, Sharp & Wajda, 1989).
"'The grouping was done using RDRG Version 5 grouper software. The RDRG software was designed to use the "principal diagnosis" to group patients into diagnostic categories, however Manitoba Health data do not identify a principal diagnosis, and therefore data were grouped according to the "most responsible diagnosis". The software selects the most resource intensive procedure for categorizing surgical cases.
31 Adjustments to select for newborns were required as the newborn diagnosis may not be the most responsible diagnosis in 1\tlanitoba. The first three diagnoses positions on the abstract summary were therefore searched for the newborn diagnosis.
HOSP CASE MIX COSTING 1991192

26
with expectations that the sicker, more complex patients are found at these facilities. It may
also reflect a coding bias, with the larger hospitals coding more proficiently, or their
physicians documenting more pertinent information."
Table 5: Average Number of Diagnoses per Case by Hospital Type
Average Number of Hospital Type Diagnoses
Teaching Hospital 3.25
Urban Community 2.79
Major Rural 2.4
Intermediate Rural 2.04
Small Rural 2.02
Multi-Use 1.91
Northern Isolated 1.71
As illustrated in Figure 4, the teaching hospitals had the lowest proportion of RDRGs with no
or minor comorbidities or complications (CCs), 68% of their total case load, while the small
rural hospitals averaged 79%. A large portion of urban hospital cases (I 0-12%) had severe
or catastrophic CCs, but all hospital groups had some cases with major CCs.
While Figure 4 provides the distribution of cases "within" hospital type, Figure 5 illustrates
the distribution of all cases treated in Manitoba hospitals by hospital type and case severity.
RDRGs with no/minor CCs accounted for 72% of all patients, with the teaching hospitals
having 24% and the urban community hospitals 22%. Cases with severe and catastrophic
CCs accounted for less than 2% of all cases. 33
J: Any biases in under- or over-coding of diagnoses will operate to overestimate the severity of cases at the teaching and larger hospitals and to underestimate the severity of cases treated at the smaller institutions.
33 The distributions of cases by severity level represented in Figures 4 and 5 are very different from those of Medicare patients reported by the Health Systems Management Group (1989). These researchers found that Medicare patients with no CCs accounted for about 34% of medical patients and 47% of surgical patients. This difference is likely due to the difference in the ages of the two populations, with the Medicare population being primarily elderly patients, possibly to more accurate and detailed coding of additional diagnoses and more outpatient surgery in American hospitals.
HOSP CASE MJX COSTING 1991/92

Figure 4: Distribution of Severity Levels Within Each Hospital Type
,<" ,~·' ' ,!•' .;1 J'. ,,, .f.
~.f"" "' ,. ,. / ,& ~ ,, ,- ,,o ,. ~
.., .$'
~"" .,v"
.,p" j' ..; •' '
Assignment of RCWs to Inpatient Cases - Typical and Atypical
1!1!1 Catastrophic cc
•severo cc
filll Moderale cc
• No/Minor cc
In order to more fully understand hospital costs, it is important to examine the various
characteristics of patients which affect the costs. This section examines some factors that
make one patient's hospital stay more or less costly than another's. Such factors include
death, transfers between acute care hospitals, time spent in an extended care bed or awaiting
placement in a personal care home, or a length of stay which is unusually long for a given
RDRG. Each of these factors will have resource implications which are different from the
typical RCW.
27
HOSP CASE MIX COSTING 1991f92

28
Figure 5: Percentages of Cases in Each Severity Level, by Hospital Type
• No/Minor CC
l!!l Moderate CC
DMaJor CC
i§ll Catastrophic CC
Typical patients are defined as those whose hospitalization had a normal length of stay (not
longer than the trim point"), whose treatment was completed in a single acute care facility,
whose course of treatment did not end in death," and whose hospitalization did not include
days classified as non-acute (extended care or panelled). Of the 175,062 cases, 143,606
(82%) were typical cases, 31,456 (18%) atypical (See Figure 6). HMRI reports 86.6% of
cases are typical and 13.4% are atypical for the hospitals from which they collect data
(HMRI, 1992).
J.4 The trim poim is the point after which any additional days are classified as outlier days. Outlier days are not excluded, but costs are calculated using the marginal costs weights. The methodology used to establish the trim point for each RDRG is explained in detail in Appendix C.
" Patients classified as medical (as opposed to surgical), who die within 48 hours of admission are grouped into RDRGs separate from other admissions with a similar diagnosis which either do not die or die after a longer length of stay. These are not classified as atypical because they are relatively homogeneous within their group. There were 1001 such patients in 25 RDRGs.
HOSP CASE MIX COSTING 1991192

Figure 6: Percentages Typical & Atypical Cases, All Hospitals
(82%)
Typical cases were assigned a relative case weight (RCW, described in step I above)
according to their RDRG category regardless of where the case occurred (teaching or rural
hospital) or how long their length of stay was (as long as the patient was discharged before
the trim point"). Referring back to Table 2, typical patients in RDRG 1540 (stomach,
esophageal & duodenal procedures with no/minor CCs) received a case weight of 1.98,
whether they stayed for 8 days or 15 days.
29
Atypical cases are defined as those whose resource use is different from typical patients within
that RDRG. These include outliers (cases with stays longer than the trim point), some deaths
36 It should be noted that patients who stayed longer than the ALOS but were discharged before the trim point were not given credit for days between the ALOS and the trim point. These patients can thus have a major impact on the efficiency of the hospital.
HOSP CASE MIX COSTING 1991/91
30
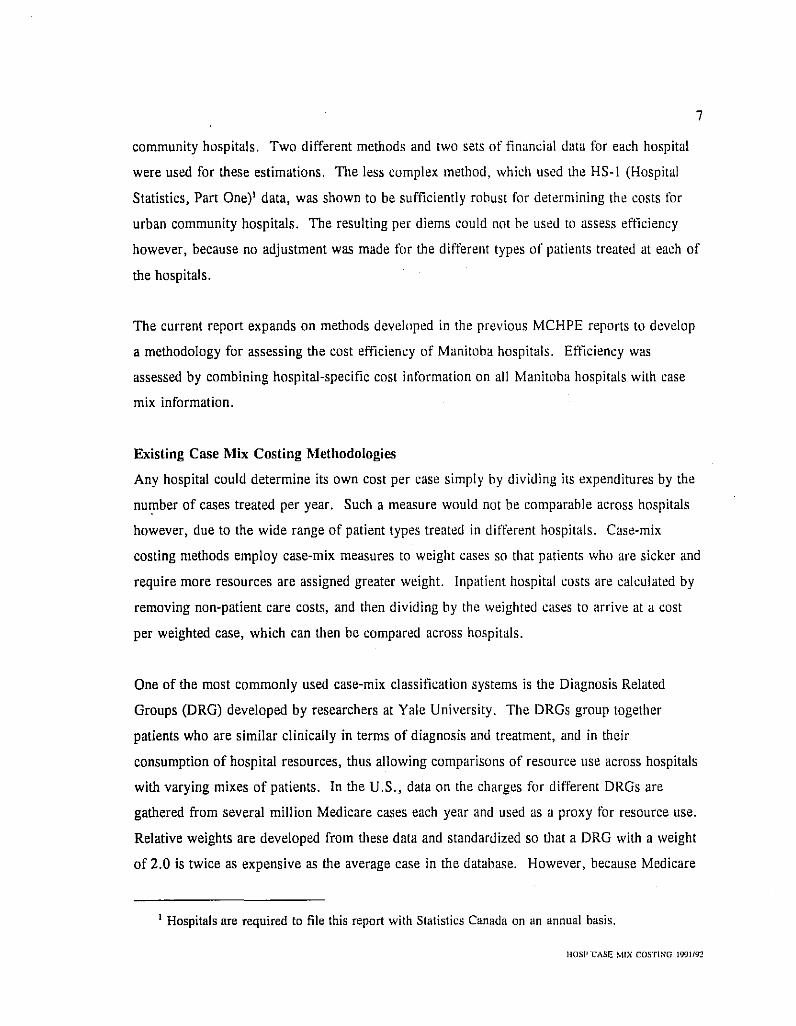
Figure 7: Percentages of Days for Typical & Atypical Cases, All Hospitals
Typlcalt
Non-Acuta 17.2%
(see note 35), transfers, and non-acute care patients. Although atypical'' cases comprise a
smaller number of cases than typical cases, they consume an inordinately large number of
days. Across all hospitals, atypical cases accounted for only 18% of cases, but these cases
accounted for 55% of the total days (Figures 6 and 7)." The large number of days
consumed by atypical cases were not excluded from the data set, however, adjustments were
made to the calculations of the weights for these cases because their resource use differs from
typical cases. It is important to note that not all of the days belonging to the atypical cases
37 Cases are classified using several independent criteria. One patient could have long-term care days, stay longer than the trim, be involved in a transfer and then die. Therefore a hierarchy was used to obtain frequencies in each category where non-acute days bad highest priority followed by deaths, transfers, and lastly LOS greater than trim.
38 HMRI found 64.4% of days were typical days, while 16.4% of days belonged to cases which were outliers, 9.6% to transfers and 8% of days belonged to cases which ended in deaths. The HMRI data set does not include daYs or costs for patients classified as long term care. These cases remain in our data set as the coding of these cases in not consistent across the province. Further discussion is found in the section on non-acute days.
HOSP CASE ~iiX COSTING 1991/92

31
were treated as atypical days. For example, the 5.4% of the cases which stayed beyond the
trim accounted for 16.4% of all days, but only half of these days were classified as outlier
days. These cases received the appropriate RCW for the initial portion of the stay and the
marginal cost was applied to days after the ALOS. Each of the atypical classifications and
their weighting formulas are discussed in detail below. Atypical cases may receive more than
one adjustment. For example, cases which had non-acute days received appropriate weights
for both the non-acute and acute days of their hospital stay. Similarly, cases which were
outliers and whose stay ended with a transfer received both adjustments.
i) Deaths. Studies have demonstrated that costs for patients in American hospitals whose
hospitalizations ended in death were consistently higher than for those patients in the same
diagnostic category (DRG or CMG) who were discharged alive (HMRl, 1991; Carter, 1993).
Our examination of the Maryland data using RDRGs demonstrated similar results.
Comparisons between Manitoba and Maryland data showed that the average length of stay for
patients who died was much longer in Manitoba. In the Maryland data base, 92% of the
deaths occurred within 40 days but this was the case for only 74% of the deaths in the
Manitoba data. This likely reflects the increased numbers of non-acute care cases in the
Manitoba data base. Based on examination of the Maryland data and the Manitoba lengths of
stay for deaths, a multiplier of 2 was used for non-medical deaths which occurred within 2
days of admission,'' and a multiplier of 1.2 was used if length of stay was longer than 2
days. 40 The multipliers were applied on a daily basis to no more than 40 days prior to
death, to days which occurred in 1991/92 fiscal year, and to cases which had no non-acute
days. The full description of all analyses and subsequent adjustments regarding deaths are
found in Appendix E.
" Only non-medical RDRGs are included here. For medical categories, deaths within less than three days are placed into distinct RDRGs and therefore do not require adjustment. (See note 35).
'"' Analysis of the Maryland data showed that no length of stay adjustment was required for deaths because within RDRGs the per diem is constant over length of stay. That is, the same multiplier could be used for all stays of 3 days or longer because cost per day for deaths does not vary over the length of stay.
HOSI' CASE MIX COST! NO 1991/92

32
Table 6: Adjustment Factor for Patients Whose Hospital Stay Ends in Death
Length of Stay Multiplier
2 days or less 2.0039
> 2 days 1.2041
Distribution of Deaths
The proportion of cases whose hospital stay ended in death ranged from 1.4% in northern
isolated hospitals (Table 7) to 4.8% at the multi-use hospitals. Table A-4 provides hospital
specific data.
Table 7: Deaths- Cases and Days as a Percentage of Totals in Each Hospital Type
Deaths as % of total % of total days Hospital Type Deaths cases in hospital type by hospital type
Teaching 1,380 2.8 8.0
Urban 1,639 3.8 10.3
Major 547 2.3 8.6
Intermediate 266 3.3 13.1
Small 464 3.2 9.1
Multi-use 45 4.8 11.5
Northern Isolated 11 1.4 6.4
Total 5,353 3.1 9.2
The larger proportion of deaths at the multi-use facilities, combined with the fact that these
institutions had a high proportion of non-acute days may indicate that many of these cases
were comfort care. It is important to note that cases coded as non-acute care did not have a
"Applied to case weight, for stays not longer than 40 days, at the end of the stay, but only to those days in the 1991/92 fiscal year
HOSP CASE MIX COSTING 1!J91f!12

multiplier applied to them. 42 As well, the restriction on the total days per stay to which the
multiplier is applied, combined with the RDRG classification system, should minimize any
over-estimation of costs where patients are receiving comfort care.
ii) Transfers. Transfers are defined as patients transferred between acute care facilities
within the province. We undertook analyses to assess differences in length of stay and costs
for patients who were transferred both from and to acute care facilities. Patients transferred
from or to personal care homes, rehabilitation hospitals, nursing stations or out of province
were not included in these analyses.
33
Analysis of the Maryland data did not demonstrate large differences in daily costs between
transfers and non-transfers; thus our weight adjustment involved applying the appropriate
multiplier to the case weight and giving the hospital credit for the actual length of stay, rather
than the ALOS as in the typical cases.43 The multiplier for transfers was applied only up to
a maximum of 44 days. Multipliers for the various lengths of stay and the types of transfers
are given in Table 8. See Appendix E for a description of all analyses and adjustments
regarding transfers.
Table 8: Multipliers for Transfers In and Out
Length of Stay Transfers Out Transfers In To
Within 2 days .957 1.182
3 to 5 days .981 1.035
> 5 days 1.03644 0.892"
"This was done for those hospitals where coding was adequate. For hospitals which did not code nonacute days, the total hospital case weight was adjusted based on the number of long-term care days reported by Manitoba Health and ratios in good coding hospitals.
43 For transfers and deaths, unlike typical cases, hospitals only received a portion of the RCW if the stay was less than the ALOS.
HOSP CASE. MIX COSTING 1991/9Z

34
Distribution of Transfers
The percentage of cases transferred in and out, tbe percentage of days involved and tbe
percentage of weights for each hospital type are given in the following tables. The percentage
of cases that were received by acute care facilities (transfers in) ranged from 0.3% of the
cases at the northern isolated hospitals to 6.9% at the teaching hospitals (Table 9a). The
larger percentages at the teaching hospitals likely reflect the use of these institutions as
referral centres for all types of cases, not just those requiring tertiary care. Intermediate rural
hospitals received a relatively high 5.2% of their cases as transfers.
Transfers out of acute care facilities (Table 9b) ranged from 2.4% of cases at the teaching
hospital to 9.6% of the cases in the northern isolated facilities. The low number of acute
transfers out of the teaching hospitals suggests that the teaching hospitals, and to a certain
degree the other urban hospitals, were not returning patients to smaller hospitals for the
recuperative stages of tbe hospital episode.
Table 9a: Transfers In (Cases Received by Hospital)
Percent or Percent or Percent or Hospital Type Cases Days Weights
Teaching 6.9 10.9 I !.I
Urban Community 3.0 4.3 3.9
Major Rural 2.4 6.6 4.8
Intermediate Rural 5.2 9.6 8.3
Small Rural 2.7 8.2 6.7
Multi-use 2.7 6.7 5.7
Northern Isolated 0.3 2.5 1.5
44 This is applied only to a maximum of 44 days at the end of the stay and only for those days within the fiscal year of 1991/92.
45 The multiplier is applied to days at the beginning of the stay, and for no more than 44 days.
HOSP CASB MIX COSTINO 1991192

35
Table 9b: Transfers Out (Cases Transferred Elsewhere Upon Separation)
Percent or Percent or Percent or Transfer Out Of Cases Days Weights
Teaching 2.4 5.7 5.8
Urban Community 3.8 6.8 6.5
Major Rural 4.4 5.1 4.9
Intermediate Rural 7.4 8.1 7.5
Small Rural 6.9 8.5 8.1
Multi Use 6.8 10.8 10.5
Northern Isolated 9.6 21.3 14.4
The issue of transfers is complex. Large teaching hospitals receive many acutely ill cases
which are resource intensive, but the use of the RDRG methodology ensures they receive the
appropriate weights for these cases. A major adjustment needs to be made only if a
transferred case required many more resources than a similar case admitted directly to the
teaching hospital. Since many transfers come from small rural hospitals, it is not clear why
the resources used by these patients would be more expensive than those used by an urban
resident admitted for the same diagnosis. This is an area which may warrant further
investigation. Table A-4 provides hospital specific data for all transfers, the days involved
and the percentage of weights used by patients involved in transfers at each hospital.
iii) Outliers. Outliers refer to cases that stay much longer than expected for a given RDRG.
A formula was developed to determine the trim point for each RDRG, after which the case
was considered an outlier. A description of outlier methodologies is found in Appendix C.
Case weights for outliers were adjusted for length of stay on a daily basis using RDRG
specific marginal costs. The full explanation of the development of the marginal cost weights
and their allocation is described in Appendix A. Table 10 provides information for hospital
types on the frequency of outlier cases and the percentage of the total days which were
HOSP CASE MIX COSTING 1991/92

36
beyond the trim. The percentage of these days varied from 8% at the northern isolated
facilities to 22% at the urban communities facilities.
Table 10: Outlier Cases (Excluding Deaths and Transfers)
Percentage of Percentage of Percentage of Days after I he Total
Hospital Type Cases Trim" Weights
Teaching 6.3 17.2 22.5
Urban Community 7.3 21.9 28.0
Major Rural 6.6 17.9 23.8
Intermediate Rural 6.1 13.9 21.7
Small Rural 6.3 18.5 26.6
Multi-use 10.1 19.2 31.0
Northern Isolated 3.3 8.2 12.4
Total 6.6 18.9 24.9
Table 11 provides examples of the effect of long stays on case weights for four different
cases, three of which stayed beyond the trim point for their particular RDRG. The RCW for
RDRG heart failure and shock with no/minor CCs is 1.02; because this case was an outlier it
received a marginal cost weight adjustment for all days beyond the ALOS. The resulting case
weight was 20.74 = 1.02 +[ .145 *(144-7.99)]." A more complex and higher severity
case, such as cardiac valve procedure with catheterization with catastrophic CCs, has an RCW
of 11.426. In this example the case's length of stay was equal to the ALOS and therefore
received no adjustment. From these examples, it is clear that the many long stay patients in
Manitoba hospitals have a strong impact on increasing a hospital's average case weight
although this may be lessened if these patients have designated non-acute days.
" This is only those days after the trim relative to all days in the data set.
.., Although outlier adjustment is triggered when there are days beyond the trim point, the adjustment is then applied to all days after the ALOS. Cases which stay longer than the ALOS but less than the trim point for that RDRG do not receive outlier adjustments, just as cases which are discharged before the ALOS do not have any negative adjustments.
HOSP CASI! MIX COSTING 1!1911!12

Table 11: RCW. vs. Case Weight for Same RDRG
RDRGName
Degenerative Nervous System Disorder with no/minor CCs
Heart Failure & Shock with no/minor CCs
Diabetes age > 35 with major CCs
Cardiac Valve Procedure with Cath with catastrophic CCs
48 Average length of stay for RDRG.
" Actual length of stay.
Length or Stay Effect on Case Weights
Relative Case Weight
1.80
1.02
2.086
11.426
Marginal Cost Weight
.132
.145
.169
.382
AWS"
10.71
7.99
10.61
24.53
HOSP CASE MIX COSTING 1991192
37
LOS'" Caseweight
151 days 20.32
144 days 20.74
302 days 51.33
24 days 11.43
~

38
iv) Non-acute days - Extended Care and Panelled Patient Days. Patients awaiting nursing
home placement or receiving care on an extended care unit typically have lower daily costs.
These patients are frequently referred to as long-term care cases; we have chosen to refer to
them as non-acute because many of the days which we classify as non-acute occur early in a
patient's stay. A marginal cost weight, developed from Manitoba data, was applied to the
non-acute portion of any stay identified by the use of specific service codes. Hospitals were
surveyed to determine whether specific service codes were used for chronic, respite, panelled
or non-acute care days. When hospitals used distinct service codes to identify when a patient
should be classified as non-acute, a weight of .085"' was applied to those non-acute days,
and the acute portion of the stay received the appropriate acute weight. Hospitals which
consistently reported non-acute status of their patients were identified as "good coding"
hospitals; 19% of the total days at these hospitals was spent in non-acute care. Thirty-three of
the 76 hospitals were classified as "poor coding" hospitals;" these tended to be the smaller
hospitals and accounted for only 26,303 (15%) of the total 175,062 cases or 12% of the total
days.
While it was impossible to determine the number of non-acute days at "poor coding" hospitals
from the hospital data base, an alternate data source" indicated that non-acute days
accounted for 17.5% of the total days at these hospitals. Because these data were not
reported on a case-by-case basis, we had no knowledge as to which RDRGs these patients
were in, and it was therefore necessary to develop a way to apply non-acute weights to these
days. Using the "good coding" hospitals, we identified which RDRGs had the largest
proportions of non-acute days and adjusted each "poor coding" hospital's total case weights
proportionately to the number of non-acute days. Further details on this step are found in
" This weight was coincidentally equal to the lowest adult marginal cost weight calculated for an RDRG. A further discussion on the calculation of this weight is found in Appendix D.
n Seveml hospitals indicated that they were not using specific service codes for long-term care, but when the data were examined, it was found that they did. Also, it was found that several hospitals that reported using specific codes actually did not. In both instances hospitals were placed in the appropriate category .
., This information was obtained from revenue days as reported by the hospitals to Manitoba Health.
HOSP CASB MIX COSTINO 1991192

Appendix D. Table 12 provides the distribution of "good coding" and "poor coding"
hospitals, cases and days across hospital types. "Percent of Total Days" indicates the
percentage of non-acute days in each category (for example: Major Rural, 29% of "good
coding" hospitals' days are non-acute and 13% of "poor coding" hospitals days are non
acute).
39
The impact of applying the non-acute weight to the non-acute days can be illustrated using the
third example in Table 11; if 200 of the 302 days are actually non-acute, the case weight
becomes 34.5 = 2.086+ (91.39 days* .169) + (200 days *.085) rather than 51.33. In this
example it was assumed that the non-acute days were at the end of the stay but the method
used allowed for adjustments if the non-acute days were interspersed with acute days.
HOSP CASE MIX COSTINO 1991/92

40
Table 12: Non-Acute Care: Days and Cases
Non-Number of Acute Percent of Acute Care
Hospital Type Hospitals Cases Days Total Days Days"
Teaching good coding 2 2,841 124,487 22% 23,769 poor coding 0 - - - -
Urban Conununity good coding 6 2,268 112,836 21% 34,044 poor coding 0 - - - -
Major Rural good coding 7 1,160 44,915 29% 9,314 poor coding 3 NA" 7,908 13% NA
lntennediate good coding 7 102 4,336 8% 4,183 poor coding 3 NA 7,725 30% NA
Small good coding 15 114 9,389 16% 3,216 poor coding 22 NA 14,709 16% NA
Multi-Use good coding 4 17 530 10% 274 poor coding 2 NA 1,812 35% NA
Northern Isolated good coding 2 26 924 22% I poor coding 3 NA 941 16% NA
TOTAL good coding 43 6,528 297,417 17.5% 74,801 poor coding 33 33,095
"' These are the acute care days for only those patients who have non-acute days.
54 For those hospitals classified as 'poor coders' we do not know either the number of cases involved nor the acute care days used by those patients.
HOSP CASE MIX COSTINO 19911!12

41
Comparison of Case Mix Across HospiJals Using Case Weights
Once an RCW was determined for every RDRG, we examined the typical cases to determine
whether their distribution was logical. This was done by first dividing all typical cases into
five groups, based on their RCWs, ranging from the most expensive (top 1%) to the least
expensive (lowest 20% ). Table 13 provides examples of diagnoses found in each of the '
groups."' As mentioned previously, the RCW represents expected resource use for each
RDRG rather than actual resource use. Procedures such as bone marrow transplant, kidney
transplant and cardiac valve procedures were found among the most expensive (top 1%) while
non-surgical back problems with moderate CCs were found in the intermediate class (21-
80%). Diagnoses such as D&C, tonsillectomy, and urinary stones fell into the least resource
intensive group (lowest 20% ).
Table 13: Examples of Typical Weights From Each Resource Use Group
RDRG Frequency RCW Description
1% Most Resource intensive
4813 9 64.947 ° Bone Marrow Transplant w catastrophic CCs
3023 4 22.950 Kidney Transplant w catastrophic CCs
3863 63 21.044 Birth weight < 1000G w catastrophic Neonate CCs
4830 179 13.433 Tracheostomy w no/minor CCs
1043 26 10.984 Cardiac Valve Proc w Pump & w Card Cath w catastrophic CCs
2-5% Most Resource intensive
1072 172 5.057 Coronary Bypass w/o Cardiac Cath w major CCs
1483 335 5.023 Major Small & Large Bowel Procs w catastrophic CCs
2090 709 4.660 Major Joint & Limb Reattachment Procs w no/minor CCs
1953 11 4.065 Total Cholecystectomy w C.D.E. w catastrophic CCs
4302 78 4.072 Psychoses w major CCs
55 A full list of RDRGs, weights and marginal cost weights can be obtained upon request.
HOSP CASE MIX COSTING 1991192

42
RDRG Frequency RCW Description
6-20% Most Resource Intensive
3342 46 2.899 Major Male Pelvic Procedures with major CCs
2712 12 2.855 Skin Ulcers with major CCs
3882 94 2.797 Birth Weight 1000-2499G with major Neonate CCs
3162 120 2.794 Renal Failure with major CCs
3363 36 2.779 Transurethral Prostatectomy with catastrophic CCs
21-80% Most Resource Intensive (Intennediate)
3242 15
1572 51
2431 231
4601 20
4401 21
20% Least Resource Intensive
3641
0592
3280
0240
3240
40
25
15
1085
737
1.485
1.463
1.457
1.444
1.432
0.476
0.474
0.470
0.455
0.454
Urinary Stones with major CCs
Anal and Stomal Procedures with major CCs
Medical Back Problems with moderate CCs
Non-Extensive Bums w/o O.R. Procedure with no/minor CCs
Wound Debridement for Injuries with modemte CCs
D&C, Conization Except for Malignancy with moderate CCs
Tonsillectomy &/or Adenoidectomy only with moderate CCs
Urethral Stricture with no/minor CCs
Seizure and Headache with no/minor CCs
Urinary Stones with no/minor CCs
As one would expect, the distribution of typical cases across hospitals shows that those
RDRGs that are relatively more expensive (i.e., have the larger weights) were found
primarily at the teaching and urban community hospitals (Figure 8). The teaching hospitals
had 65% of the most expensive (top I%) RDRGs and 50% of the 2-5% most expensive
RDRGs; the urban community hospitals had 35% and 40% respectively. Also of note, the
teaching hospitals had 40% of the least expensive typical cases as well.
HOSP CASH MIX COSTING l99JI!n

Figure 8: Percentages of Cases Treated by Each Hospital Type, Within Each Resource Use Group (Typical Cases)
IIIIIIIIIHIIO .. N. lool
ll'i!Smoll Rural
ll!llnlonnadlate Rural
D lla)or Rural
~Urban Community
.Tiachlng
43
The high cost, high resource intensive cases (top two groups) accounted for less than 10% of
any hospital type's typical patient load (Figure 9). Although the teaching hospitals had the
more expensive cases, it is also important to note that over 20% of their typical cases were
found in the least resource intensive, least expensive RDRGs. A large portion of these cases
are normal newborns, uncomplicated deliveries and pediatrics, however it has also been found
that a considerable proportion of the surgical cases at the teaching hospitals are of relatively
low intensity and low severity (Barer, Brownell, Sheps, 1994). Even though the teaching
hospitals have the tertiary care cases, it is clear that they also function as community
hospitals, and only a small minority of patients treated at the teaching hospitals require
complex, expensive treatment.
HOSP CASE MIX COSTING 199119'2

44
Figure 9: Distribution of Resouce Use Groups Within Each Hospital Type (Typical Cases)
IJrt:.l ...... lVIII ...,...._Ia ._.. Rural HonOr. Jaa .. t•d ~ ....... 1.1&1111·11-
Haspltal 1'/PII
[!lil201(, Laaat E>cp•natw
D 21-8m' lnltrmtdlatt
mi!e-2Cn' Uo!t Expun!!IIVO
[?1] 2-5')(, Mast Expanalva
• 110 Moat Expensive
Figure 10 shows the average indexed,. RCWs for all typical cases in each hospital type."
This figure makes it possible to compare the various types of hospitals according to how
complex and/or resource intensive, on average, their typical cases are expected to be. (Each
+ represents the average cost for one specific hospital, and the • represents the average of all
hospitals in that group.) Reassuringly, we found that the overall complexity/resource intensity
at the teaching hospitals and the other urban hospitals was markedly higher than that at the
rural hospitals (large black dots on Figure 10). The average indexed RCWs for various rural
hospital groups were essentially the same, at .96 to .98, with the northern isolated at .90.
56 The average of all hospitals' RCWs was indexed to 1 and each hospital type's RCW (and each hospital's RCW) is presented relative to the provincial average.
"Keep in mind that the RCWs represent expected complexity and/or expected resource use per case, and are therefore an indication of the case mix at each of the hospitals and do not depict the costs per weighted case (discussed below in the Findings Section).
HOSP CASE MIX COSTING 1991/92

Figure 1 0: Average Indexed Case Weights by Hospital, (Expected Average Resource Use), Typical Cases
•
.. ++ +,_.. *f ....
.. -i··t!l* 1.33 ····tl· ····~;t···· D.D.Ij- + 0.00 .........•...•... ·····r=p· ·····f········· +*
' • ' .I'
45
Figure 10 also shows average indexed RCWs for each hospital (as plus signs). As one might
expect, there was little variation across rural hospitals in the mix of cases. Interestingly, two
of the urban community hospitals had higher average case weights than the two teaching
hospitals. The reason for this unexpected finding appears to be the absence of obstetrics at
these two hospitals. Although obstetrics cases may be resource intensive on a daily basis,
they tend to have lower case weights relative to other RDRGs, due to very short lengths of
stay. This results in lowering the average case weights for hospitals with significant numbers
of obstetric cases. When one looks at the average expected day weights of typical cases for
each hospital, the impact of length of stay on the obstetrical and normal newborn cases
disappears (Figure 11). This figure also provides some insight as to the average daily acuity
level at each of the hospitals. This value is calculated using the actual case weights for each
hospital and the expected total days (based on ALOS) given the mix of cases in each hospital.
In this figure the results are as one would expect with the urban hospitals having the highest
HOSP CASE MIX COSTING 1991192

46
expected day weights and the smaller rural hospitals having lower expected day weights,
reflecting lower expected resource use.
All cases
Because Figures 8 to 11 include only typical cases, they tell only part of the story. While the
typical cases made up 82% of the total cases, they accounted for only 45% of the days spent
in Manitoba's acute hospitals; therefore data for all cases (typicals and atypicals) were
examined. Figure 12 is comparable to Figure 8, except that it includes all cases in the data
set. When all cases were included only 40% of the most expensive cases were found at the
teaching hospitals, down from 65% when only typical cases were examined. The rural
hospitals jumped to treating 21% of the most expensive cases, compared to less than 5%
when only the typicals were examined. This suggests that once long stay cases, deaths and
transfers are included there are some very expensive cases in the rural hospitals.
12
IJ5
IJ
O.!Ni
OS
OBS
Figure 11: Expected Day Weights by Hospitals
--, -• -• ••
·-·-- • --- • -•• -• • • .... , -• ••• -· ... • • • -• •• • •• •
• • • ... •
11'""'1m'lfmltffi#IIII5555WE'W'fli5flj.Wf,ffH{iffiitfjffljfi!jlfll'!ffil({flilf
Hnspit.ai Type
HOSP CASE MIX COSTINCl 1991/!12
I ~cted day wts I 1: Tooching
2: Urban Community
3: llajor Rural
4: lnlmnedinte Rural
5: Small Rural
6: llclli-U..
7: Nortliem Jaolaled

Figure 12: Percentage of Cases Treated by Each Hospital Type, Within Each Resource Use Group (All Cases)
Table 14: Characteristics of Resource Groups - All Cases
Resource Mean Percent Percent Group ALOS Weight Deaths Transfers
1% most expensive 181 25.1 20.7 44.6
2-5% most expensive 42 4.2 15.0 21.5
6-20% most expensive 13 2.4 5.7 12.2
21-80% most 4 0.9 1.9 4.5 expensive
20% least expensive 2.3 0.3 0.8 9.8
Percent Non-Acute
46.7
16.2
5.2
1.9
3.0
liiii MultJ..u .. 1. N. 1101
121smaD Ru..-1
Ellil-modloto Rurol
D M.,.r Rural
~Urban Community
.lN.Chlng
Percent Outliers
93.4
57.0
22.7
2.5
0.7
47
Percent Typical
3.6
29.1
61.5
90.2
86.5
HOSP CASE MIX COSTING 1991192

48
It is clear from the striking changes between Figures 8 and 12 that atypical cases have a huge
impact on case weights, and Table 14 provides insight into this impact. Using the previously
defined resource groups, the types of cases within each group were examined. Cases with the
highest case weights (the 1% most expensive) were primarily atypical; for example, 93% of
those in the most expensive group were outliers and 44% were transfers. 58 Indeed, only
3.6% of the cases in the most expensive group were classified as typical. In the intermediate
group (21-80% most expensive), only 2.5% were outliers, 1.9% were deaths and the average
length of stay was 4 days, down from 181 days in the most expensive group. Clearly, the
more expensive the group, the greater the concentration of atypical cases, especially long stay
outliers.
Figure 13: Average Indexed Case Weights by Hospital, All Cases
• :j:
+ ' 1.5 + + +
>D+ !+ + + ... .. j-;~. ~-**+ +Ill
... ±..± __ .. ±_*± ... • ······-·-·-·- ·t·+·rr¥· ··········+····· ··················· + +,n+ ++
:j: + =l=:j: + •• + +
§
l
• ' ' ... '
/"
58 Keep in mind that these atypical categories are not mutually exclusive, thus the same patient could be classified as outlier, transfer, non-acute and death.
HOSP CASE MIX COSTING 1991/92

49
The average case weights for each hospital, when all cases were included, are found in Figure
13. A much wider range in expected costliness of the average case was found within hospital
types when atypical cases were included. The importance of the weights attributed to the
atypical cases becomes obvious since the teaching hospital group was not identified as having
the highest average case weights. Indeed, four of the major urban hospitals had higher
average case weights than the two teaching hospitals when all cases were examined. The high
average case weights found in small hospitals may be a result of only a few atypical cases in
each facility; with small caseloads these atypical cases have a major impact on average case
weight."
Calculation of the case weights for a second more recent year of data 1992/93; demonstrated
that overall there was a strong positive correlation (r=.81, p=.OOOl) between hospital
average case weights for 1991/92 and those for 1992/93. The relationship was weaker,
though still highly significant, for the small rural hospitals (r= .65, p= .0001). When small
hospitals' data were examined individually, it was found that those hospitals which had
average case weights that were very different from the mean for their hospital type in 1991/92
all had substantially different results in 1992/93. These hospitals had case loads of fewer than
300 cases suggesting that our method is unstable for hospitals with low case loads. Further
study is required to determine the case load level necessary for stable results.
Advantages of Using CMGs versus RDRGs
RDRGs were chosen by MCHPE because they measure the acuity level of hospital cases.
Our use of RDRGs has the disadvantage that Manitoba hospitals that use CMGs to describe
their cases cannot easily translate our results. As we want this analysis to be useful, we have
attempted to determine if the additional precision which we believe the RDRG system
provides to case-mix costing is worth the inconvenience to the urban hospitals.
Since the CMGs as well as the RDRGs were both developed directly from the original DRG
system, there are many similarities between the two. To illustrate this, Table 15 demonstrates
" If this pattern is not consistent over time, the results have less predictive power.
HOSP CASE MIX COSTING 1991f92

50
how the CMG and the RDRG systems classify patients with acute myocardial infarction
(AMI). CMG has two categories of AMI patients: those with cardiovascular complications
and those without (CMGs 194 and 195 respectively). The RDRG system has four categories
of AMI patients, each with different levels of cardiovascular complications as well as other
CCs expected to have an impact on resource use."' The RCWs for each RDRG level (far
right column in Table 15) indicate the different resource use expected for each category. Of
the 570 cases the CMG categorizes as having complications, the RDRG system classifies 95%
[(350 + 120 + 69)/570] as having CCs, with 120 (21 %) of these receiving additional weight
because they had severe CCs. Only 31 (5%) of the cases identified as having complications
in the CMG system were not classified as CCs in the RDRG system. In contrast, fully 27%
[(279 + 63)/1247] of the cases that the CMG system would put in the no complication
category were classified as having moderate or severe CCs by the RDRG system, and
therefore received higher case weights accordingly.
Table 15: RDRGs versus CMGs -Distribution of Cases for AMI
RDRG CMG
194 195 No Cardiovasc Cardiovasc
Comp Comp RCW
1210 - no/minor CCs 814 31 1.998
1211 - Moderate CCs 279 350 2.295
1212 - Severe CCs 63 120 3.121
Early Death (2 days 91 69 0.571 or less)
TOTAL 1247 570
00 AMI case.< resulting in death within 48 hours are categorized separately by the RDRG system reflecting the cost experience of these patients found in Maryland and New York data.
HOSP CASE! MIX COSTING 1991/92

51
To further investigate whether using the RDRG case-mix system affected our assessment of
hospital case weights, we calculated both an average CMG weight (using the RIW developed
by HMRl) and an average RCW for cases treated at each hospital during the year. All typical
patients were used in this analysis. A Spearman Rank order correlation test suggested that
there was a strong positive relationship between the rankings of the two methods (corr= .83,
p= .0001); hospitals that had a costly case mix using the CMG system also had a costly case
mix using the RDRG system.
Figure 14: RCWs versus RIWs For Urban Hospitals {Typical Cases)
~1.6,-----------------------------------------------,
II
1l. 1.5
t~ ~ ~1.3 e p.. 1.2
s
r: _j__--,----,---,--,-----.-------,---,----,--' TA IKll l1CC urn UCF
Hospitals
1---- RCWs ---+-- RIWs
As can be seen in Figure 14, the RDRG system also appeared to give more credit to the
urban hospitals for having a more complex case mix, a result that seems reasonable given our
expectations that this system does a better job of distinguishing acuity. The urban community
and teaching hospitals had a higher indexed weight when judged by RCWs, which suggests
that the increased acuity levels picked up by the RDRG coding system benefited the teaching
and urban hospitals. Over half of the 42 smaller and multi-use hospitals had a lower average
RCW than RIW index and among those with a higher RCW index the difference was very
HOSP CASE MIX COSTING 1991192

52
small. This suggests that the use of CMGs to develop case-mix adjusted costs would tend to
underestimate the costs at urban hospitals relative to the rural hospitals.
In summary, the system used to describe the costliness of cases treated at Manitoba's acute
hospitals appears to have worked well. The RDRG system provided a method more sensitive
to capturing case severity than did the simpler CMG system with which hospitals are more
familiar. Using RDRGs, we found a large proportion of the costliest cases being treated at
the urban hospitals and few at the smaller hospitals. However, the teaching hospitals also had
a large secondary care component and thus performed many community hospital functions
(such as obstetrics and pediatrics). The vast majority of their cases were of relatively low
levels of complexity and without characteristics (transfers, deaths or very long stays) which
would classify them as atypical .
When only the typical cases were examined, the average hospital case weights appeared in a
more logical pattern, with the highest average case weights for the teaching hospitals and the
lowest for the northern isolated hospitals. Since the atypical cases made up about 55% of the
overall days at Manitoba hospitals, as Figure 7 illustrates, they had a major impact on how
costly, on average, each hospital's cases were expected to be.
4. Cost oer Weighted Case
The average cost per weighted case (CWC) was calculated for each hospital by summing the
weights assigned to all cases treated by a hospital during the 1991/92 fiscal year (described in
step 3 above) and dividing the resulting number into the hospital's total inpatient expenditures
(step 2 above}.61 This was the final step in the flow chart (Figure I}, and the focus of this
report. As discussed earlier, in calculating the case weights we made every attempt to adjust
for differences in patient acuity across hospitals.
61 Because the denominator for the CWC consists of weights developed using Maryland charges and Manitoba lengths of stay, the values calculated will not represent actual dollars spent per case, but relative costs.
HOSP CASE MlX COSTING 1991192

53
IV. FINDINGS
The ewes for each twspital represent their average cost per case, adjusted for the types of
patients they treated, We compared ewes across hospitals to determine whether there were
major differences across Manitoba hospitals in the relative efficiency with which cases were
treated.
Figure 15: Average Indexed Cost Per Weighted Case by Hospital (All Cases)
3.5
' 3 • g 02.6
" 0
" 1 a: ~ D.S
D
'-"' •+ +
:j::""' +...;!:
~id ······+·t·· --tt· .. *li" ' '
I + lndMdunl Hasp Aug 11:1-ID:Sp Type Avg I
+ +
'-" • + +
+ ~1 .................. ++
Figure 15 plots the indexed" average ewe for each hospital within their hospital type,
along with the mean for that type. There was considerable variation both within and across
most types of hospitals. The costs at northern isolated hospitals were significantly higher than
those of other hospitals. The reasons for these differences were not explored in detail, but
62 The provincial average, calculated by summing all hospitals' average cost per weighted case and dividing that by the number of hospitals, was indexed to I, and each hospital's ewe was indexed accordingly.
HOSP CASE MIX COSTING 1991192

54
were likely due to very low occupancy rates, which ranged from 20.2 to 40%, in combination
with such probable factors as northern transportation costs, higher wages and/or past funding
patterns. Because these are relatively small institutions treating 105 to 747 cases a year with
total budgets ranging from $666,166 to $2 million compared with urban hospital budgets of
$24 to $287 million, we did not further investigate the reasons for their apparent costliness in
the current study.
The costs for the remaining hospitals ranged from 57% lower to 52% higher than the
provincial mean ewe. The teaching hospitals were considerably less efficient than other
hospitals, scoring 29% higher than the provincial average, while the intermediate rural
hospitals were on average the most efficient, scoring 22% lower than the provincial average.
The greatest range in efficiency was found at the small rural hospitals, although due to the
small number of cases treated at some of these institutions, we will be more confident about
assessing efficiency for this group after additional years of data have been examined.
Urban Hospitals
The urban hospitals (teaching and non-teaching) ranged from 14% below to 31% above the
provincial average ewe. Variations in efficiency in these hospitals are particularly important
considering these eight institutions served 65% of the patients and accounted for 76% of the
provincial expenditures for inpatient care. Two urban community hospitals had relatively low
ewes when compared to the other urban hospitals, (that is they were more efticient) and the
two teaching hospitals were considerably more expensive. Using the second most efficient
urban community hospital (UeB) as the standard, the other urban community hospitals were
14 to 35% more expensive, while one teaching hospital was 56% more expensive than this
hospital.
Interestingly, the two urban hospitals with the lowest ewes were also identified in a previous
study as two of the hospitals that discharged patients more efficiently (Brownell and Roos,
1992). This suggests that it should be possible to treat patients in a shorter time period
without incurring greater costs.
HOSP CASE MIX COSTING 199119'2

55
Rural Hospitals
As was discussed earlier, the placement of the hospitals into the various groups was done
based on both the size and the function of the hospital. One would then expect that CWCs
should be relatively similar within the groups. Yet the range for rural hospitals in Figure 15
is considerable, from 57% below to 52% above the provincial mean. Among the major rural
hospitals, three appeared to be very efficient relative to the others. Costs at the other (non
northern) major rural hospitals were 21 to 38% higher than the two most efticient hospitals.
There were also three intermediate rural hospitals that appeared to be very eftident relative to
the others, with costs at the other (non-northern) intermediate rural hospitals II to 27%
higher than the three most efficient hospitals. While there were marked variations in
efficiency across the small rural institutions, tindings based on one year of data for these
small hospitals are problematic due to the small number of cases.
Figure 16: Average Indexed Cost Per Weighted Case For Rural Hospitals With Northern and Federal Hospitals Separated (All Cases)
~·r---------r-----------r--------------,---------,
3
8 2.5 • c
~ - 2 •
+ +
+ • + 2.06
OL_------~----------~-------------L---------t Llajor Rural lnkmnedialro Autal Smnll Rum! fJofthcm & Fede1111
I +Individual Ho10p Avg e Hosp Type:: Avt~
HOSP CASE MIX COSTING 1991192

56
One factor that likely affected northern hospital costs, for which we did not adjust in this
analysis, was northern location. We the~efore placed the ,three major rural hospitals, the one
intermediate rural hospital, and the one small rural hospital that are located in the north into a
group which also included the northern isolated faciliries ,(Figure 16). By moving the
northern hospitals into a separate group, the mean for each of the rural hospital groups
declined ,as did the variation across hospitals (compare Figures 15 and 16). In Figure 16 the
more expensive facilities in the northern group were the northern isolated facilities. Even
with the separation of all northern facilities, there remained considerable variation between
CWCs across all rural hospitals, with the largest variation in the ,small rural and multi~use
facilities. Average indexed CWCs and their standard deviations by hospital type are found in
Table 16.
Table 16: Average Indexed CWC by Hospital Type
Average Standard Hospital Type Indexed CWC deviation
'
Teaching 1.29 0.035
Urban Community 0.95 0.127
Major Rural 0. 8863 0.13"
Intermediate Rural 0.71" ·0.'07'0
Small Rural 0.86 0.292
Multi-use 1.05 0.621
Northern Isolated 2.45 0.478
As a group, the intermediate rural hospitals appeared to function the most cost-efticiently; the
northern isolated facilities the least so. Within the small rural .and multi-use .groups there
fiJ These values were calculated without .the northern _ho.s,pitals. When the northern hospitals were included the corresponding values were: mean ewe of .98, with a standard deviation of .221 for the major rural hospitals and a mean ewe of .78, with a standaFd deviation of .213 for the intermediate rural hospitals.
HOSP CASE MIX COSTING !991/9:!

57
were several hospitals that were substantially more expensive than the others. While this may
suggest that there was considerable room for improvement in efficiency within these groups,
one must be cautious when interpreting these data as there were very few cases in many of
these hospitals. Additional years of data will make it possible to review the costs of
numerous small hospitals.
How Important Are the Cost Differences?
Major attention is currently being paid to the costliness of the acute hospital sector. Hospitals
account for approximately 60% of health care costs in Manitoba and any attempt to move
funding towards community-based alternatives will focus on the acute hospital sector as the
source of the shift. Since a major reason for undertaking this report was to determine if some
hospitals are more costly than others, holding case mix constant, it is useful to highlight
where the major cost inefficiencies were identified and the effect of these inefficiencies.
Using various efficient hospitals as benchmarks we estimated the percentage savings possible
if hospitals could achieve a given level of efficiency. Table 17 shows these potential savings,
given the following assumptions: teaching hospitals operating at the level of the average of the
urban community hospitals; urban community hospitals operating at the level of efficiency of
the second most efficient urban community hospital (UeB); the major rural hospitals
operating at the level of the three most efficient major rural hospitals; the intermediate rural
hospitals operating at the level of the three most efficient intermediate hospitals; the small and
multi-use facilities operating at the average of the small rural hospitals, and; the northern
isolated hospitals operating at the provincial average ewe. The majority of savings came
from improved efficiency at the teaching hospitals, with over half of the estimated savings
found at these institutions. This is a function of the size and average efficiency, as measured
by the ewe, at these two hospitals. If the teaching hospitals were to reach the level of
efficiency of the average of the urban community hospitals, savings of 10.7% of the total
inpatient budget for the province could be achieved. Although the northern isolated hospitals
were very expensive and there were large variations across the small rural and multi-use
facilities, the estimated potential savings in percentage terms at these facilities were low. The
total estimated savings, given these assumptions, were 21% of the inpatient budget. If the
HOSP CA~E MIX COSTING 1991192

58
benchmark for the teaching hospitals was changed so that they were operating at the efficiency
level of the second most efficient urban community hospital, (with all other hospital
benchmarks remaining the same) the total estimated savings for all hospitals would be 25% of
the inpatient budget. It must be noted that these calculations were done at a poillt prior to the
extensive changes that have since occurred at the teaching hospitals. Further, the teaching
hospitals did not have an adjustment for "teachingness" factored into their CWCs. However,
even if a 10% teachingness factor was allowed, which is roughly what is used in the U.S,
considerable differences between the teaching hospitals and least expensive urban community
hospitals would have remained.
Table 17: Percentage Savings
Percentage Savings of Conditions Required at Total Provincial
each of the Hospitals Inpatient Expenditures
Teaching @ CWC of Average of 10.68 Urban Community
Urban Community @ CWC of UCB 3.57
Major Rural @ average CWC of 4.04 MRI & MRF
Intermediate Rural @ average CWC 0.84 of IB, IG & II
Small Rural @ Small Rural Average 0.59 ewe
Northern Isolated @ Provincial 0.92 Average CWC
Total Savings 20.82
HOSP CASE MIX COST! NO 1991/9:!

How Accurately Are We Assessing Efficiency?
1. Adjusting for Patient Acuity and Complexity
59
Although every effort was made to adjust for key patient characteristics that might make care
more costly, no system is perfect. We attempted to determine if key factors that affect the
costliness of some hospitals were overlooked, or if the methodology described above did not
adjust sufficiently for the resource requirements of certain types of cases. For example, if the
method for case-mix adjustment worked as it should, we should find that hospitals which treat
many patients who are near death were in general no more costly (after adjustment) than were
hospitals who treat relatively few patients of this type.
Our approach to case-mix adjustment appears to have worked well. We tested our methods
statistically by correlating hospitals' average cost per weighted case with a number of different
characteristics that could potentially influence cost. After adjustment, hospitals with a high
proportion of elderly cases, very short-stay cases, non-acute days, or cases resulting in death
were no more likely to be costly than hospitals with a low proportion of such cases.
Sensitivity tests
These findings were further supported with the use of regression analysis in which we found
no significant relationship between cost per weighted case and the following variables: outlier
cases, cases that ended in 1-3 days, Status Indian cases, cases transferred in and out, typical
cases, pediatric cases, elderly cases, and cases with non-acute days and cases discharged
before the trim. Similar analysis was done using the case weights rather than number of cases
and again the results held.
It is possible that hospitals with large outpatient surgical programs might have only sicker,
more complex cases treated surgically on an inpatient basis. Although RDRGs should handle
any differences in inpatient acuity arising from differences in emphasis on outpatient surgery,
we still wanted to test for the possibility that there was a relationship between the proportion
of cases operated upon using outpatient surgery and the costliness of the hospital. For rural
hospitals, case-mix adjusted rates of outpatient surgery were actually found to be negatively
correlated with high inpatient costs, indicating that higher cost hospitals did less outpatient
HOSP CASE MIX COSTING 1991192

60
surgery. Urban hospitals that performed more outpatient surgery also had a negative, though
not statistically significant, relationship between ewe and outpatient surgery. Therefore, the
RDRG system with its varying levels of acuity appears to adjust well for hospitals which had
high outpatient surgery rates.
Figure 17:
16
14
12
"'il10
~ a &: 6
4
2 "'
"' .. •
Percent Status Indian & Percent Transfer-In by CWC (Urban Hospitals)
~
•
- -.... ..
0 1600 1600 2000 2200 2400
Average Cost per Weighted Case 2600
• % Slatus Indian "' % Tnmsfer In
2800
Across rural hospitals there appeared to be no characteristics associated with the acuity or
complexity of cases. However, across the eight urban hospitals, we found that those hospitals
treating a higher proportion of Status Indian patients tended to have higher than average
ewes (p = .006, Table 18) and that the three urban hospitals that had a higher than average
proportion of their case weights associated with cases transferred in from another hospital (12
to 14% compared with 2 to 3% for the lower cost urban hospitals) tended to be more costly
(Figure 17). Statistical correlations do not measure cause and effect. Hence, this could be a
coincidental finding given the domination of the costly hospitals by the teaching institutions;
the teaching hospitals receive more transfers and treat more Status Indians. Neither factor
(percent Status Indians nor percent of case weights associated with cases transferred in) was
associated with higher ewes in the rural hospitals or northern facilities. To explore the
potential impact of transfers on efficiency ratings, sensitivity analysis was performed, where
HOSP CASF. MIX COSTING 1991/9:!

the case weights for all transfers into urban hospitals were increased by 20%. This resulted
in only a I% change in average CWC for these hospitals, thus it does not explain the large
differences in costs. Whether these are real limitations of our adjustment techniques or
whether the correlations are influenced by the small number of urban hospitals requires
further examination.
Table 18: Significant Correlations" Between CWC and:
Nwnber %Cases Percent of total Weights of Status Occupancy for Cases Transferred
Hospitals Hospitals Indian Rates Into a Hospital
All excluding 71 -.22 Northern (p= .05) Isolated
All Rural 63 -.48 (p=.OOO!)
Urban 8 .84 .70 (p=.009) (p=.05)
Northern and 10 -.74 Federal (p=.002)
Figure 18: Percent Non-Acute Days & Outlier Weights
40
35
30
15 I
10
5 1600
..
-1800
•
by CWC (Urban Hospitals)
• •
..
.. •
2000 2200 2400 Average Coot per Weighted Case
• Non .lcuto Ilol'f .A. OUtlier 1feights
64 For all correlations in this table, the probability was < .05.
•
.. • ..
2600 2800
61
HOSP CASE MIX COSTING 1991/92

62
2. Adjustment for Atypical Cases
Our approach for adjusting case weights for cases that had an atypical hospital stay and for
non-acute cases appears to have worked well. Hospitals with a high proportion of such
patients were not found to be either particularly costly or inexpensive. Figure 18 graphs both
the percentage of non-acute days and percentage of total case weights attributed to outliers
against the average CWC for each of the urban hospitals. There was no direct relationship
between CWCs and these measures. Nor was there a direct relationship between the
percentage of outlier cases and CWCs. Similar results were also found when rural hospitals
were examined using these variables.
The adjustment for cases that were transferred out of facilities appears to work well as there is
no correlation in any of the hospital groups between CWC and either the percent that were
transferred out or their total case weights.
Other Characteristics Associated with High or Low Cost per Weighted Case
Urban Hospitals
The two teaching hospitals were clearly the most costly urban hospitals even after adjusting
for the complexity and acuity of their case mix. This has been observed in other jurisdictions
(Case Mix Research, 1989; Thorpe, 1988; Rogowski, 1992). Since the two teaching hospitals
are by far the largest institutions it is difficult to assess the finding that size was strongly
associated with costliness, whether size is judged by total cases or by funded beds.
Correlations done with both teaching hospitals and northern isolated hospitals removed from
the analysis found size was not significant among the remaining 63 hospitals.
HOSP CASE MIX COSTING 1!19119'2

00
3()
~00
Rural Hospitals
•
[000
Figure 19: Occupancy Rates by CWC (All Rural Hospitals)
•
•• -•
•
••
• • • • .. • , .. ·-
• • • • • •• • • • - • • • • • •• • • • • •
a
• • l~OO 2000 2500
Average Cost per Weighted Case
63
• •
• 3000 3500
Across the rural hospitals we found no relationship between size and costliness. There were
costly large hospitals and costly small hospitals; this was true even when the larger northern
hospitals were excluded. However, occupancy rates and costliness were related. with the nine
costliest hospitals having occupancy rates of 60% or less (Table 18, Figure 19).
As surgical programs are often thought to be associated with high costs, particularly in
smaller hospitals, we also examined whether rural hospitals' relative costliness was associated
with having a small (or large) surgical program. No correlation was found (Figure 20).
Nursing Costs
To determine whether differences in nursing costs drive differences in ewes, total inpatient
nursing costs were examined. A nursing ewe was calculated and proved to be highly
correlated with the total ewe suggesting that those hospitals with high ewes also had high
nursing expenditures (Figure 21). In other words, those hospitals that were least efficient in
all aspects of nursing seemed to be those that were also least efficient in terms of overall
costs.
HOSP CASE MIX COSTING J991f92

64
16
~ 12
~ 10
! 8
1:l 6
~ ~ 2
0
Figure 20: Percent Surgical Cases by ewe (Small Rural Hospitals)
.. "'
w
,. .. .. .. ,.,. .. "' ,.
"' "'., .. w -
,._ "' "' ,. BOO 1000 1200 1400 1600 1800 2000 2200 2400 2600 2800
Average Coot per Weighted Case
Nursing Expenditures & Nursing ewe Index
65 ,_------~b~vcw~c~L~All~H~os~oii~ta~ls~)------~~2 •
Figure 21:
• 60 • 1.8 •
• • + 1.6 55 "- • • • • • • • • .... + + J.4 • • ro • • • • - ... -... ·· .. ..: ....
• • "'" -. -,,. . + 1.2
1!.45 .. • ""'. ........ + • • + ... ++
...... • J • ++.j,. • + +
40 • .A: ""=t+ + + + ++ • 0.8
++.w. ......... + """> ...... 35 :t; • 0.6 .... 30
~
0.4 0.~ 0.6 0.8 1 1.2 1.4 1.0
ewe Index
• % lnpl Nurs Expend ... N=ing ewe Index
HOSP CASE MIX COSTING 199119'2
~ .s ~ u
.s ~
i

65
The total ewe and percent of total inpatient budget allocated to nursing departments were not
significantly correlated. Further investigation is required to understand the importance of
nursing costs and their effect on ewe.
Teaching Hospital Analysis
One striking finding of this study was the difference between teaching and urban community
hospitals' average costs per weighted case. It is often argued that there is a "teachingness"
factor, resulting from indirect costs incurred by interns and residents, which would explain
the differences between the costs at teaching and non-teaching hospitals.
If one accepts that the difference between costs after case-mix adjustment is entirely related to
the indirect costs of interns and residents, this would imply that each of the 372 interns and
residents enroled at the Manitoba Medical School were responsible for more than $175,000 of
indirect costs each year. Once one adds the direct costs (largely interns' and residents'
salaries), this number increases to over $220,000 per year for each intern and resident. It is
hard to believe that all these excess costs associated with teaching hospitals are the result of
the activities of residents and interns.
lnJetprovincial Comparisons
As a first step in further investigating the relationships between teaching and community
hospital costs we compared Manitoba data" to similar data available for Alberta and
Ontario. Due to different methodologies, direct comparisons of costs per weighted case are
misleading; therefore we compared cost relationships between the different types of hospitals.
The difference in ewe between teaching hospitals and the major urban hospitals ranged from
6% in Alberta to 40% in Manitoba, with Ontario teaching hospitals being in between at 33%
more expensive than urban community hospitals. This implies that in Alberta the teaching
hospital ewes were only 6% greater than at urban community hospitals while in Manitoba
they were 40% higher.
65 Brandon Hospital was not included as a Major Urban Hospital for interprovincial comparisons. Only hospitals in cities larger or similar in size to Winnipeg, Edmonton and Calgary were included in the Major Urban category.
HOSP CASE MIX COSTING 1991f92

66
Before one accepts that teaching hospitals are inevitably more expensive, one must consider
possible explanations. For example previous funding patterns may have reinforced these
differences, as in Ontario where teaching hospital peer groups were funded on a higher cost
per weighted case than other hospital groups. A more detailed discussion of these data and
their implications can be found in Appendix J.
American Experience
The differences between teaching and community hospitals have been studied in depth in the
United States and results suggest that a "teachingness" adjustment would not be sufficient to
explain why teaching hospitals were 35% more expensive than the Urban Community"
hospitals.
When two models specified by Thorpe (1988) were applied to Manitoba urban hospital data it
was estimated that 6.7% to 9.4% of TA's costs and 7.7% to 9.4% of TB's costs could be
attributed to teachingness. Another model by Rogowski estimated a teachingness variable
which would explain only 1.2% of each hospitals' costs."
These regression models used the ratio of interns and residents to beds as one of the
independent variables to capture the teachingness costs. If teachingness costs are indeed a
significant factor in the cost difference between teaching and urban community hospitals then
as the number of interns and residents decreases in the province so should the total costs
attributed to the teachingness factor. While there was considerable variation in results using
these different specifications, (described in more detail in Appendix J), the message is the
same: none of the U.S. models explain the 35% plus difference between the teaching hospital
CWC and that of the Urban Community hospitals. There may well be other logical reasons
as to why the teaching hospitals' costs per weighted case were higher than that of urban
.. Here Brandon Geneml Hospital was included in the Urban Community Hospital analysis.
" Application of a U.S. econometric model which excluded bed size variables (Rogowski and Newhouse, 1992) suggested that 16.8% and 19.2% of the costs at TA and TB, respectively, could be attributed to teachingness.
HOSP CASE MIX COST! NO 1991191

67
community hospitals. This may relate to the practice habits of those physicians who admit or
consult at teaching hospitals. It may be that they order more tests and prescribe more
expensive drugs than do physicians practising in non-teaching hospitals. The issues
surrounding indirect teaching costs and other costs associated with teaching hospitals are
complex and this is an area which requires further examination.
Sensitivity or the Results to Changes in the Case Weight Methodology -Relative Case Weights
The method for calculating case weights described in this paper was a priori our preferred
method. This method used all cost components available in the Maryland data (diagnostics,
nursing, supplies etc.), information on cost data over various length of stay intervals and
different types of cases (medical, surgical, obstetrics and others). As a test of how sensitive
our results were to complex adjustments, we used a second, less complex method, dropped
the detailed analysis of costs and examined differences between type of case (surgical,
obstetrics, etc). This is similar to the methodology used by the Rand Corporation researchers
(Carter and Farley, 1992).
Correlations on the average case weights obtained for each hospital across the two methods
(r= .99, p= .0001), suggested that Method 1 (our preferred method) is robust. Regressions
were run with the actual cost per case" for each hospital as the dependent variable and mean
case weight, from each of Methods 1 and 2, as the independent variables. The explanatory
power of the case weights from both methods was similar, with the mean case weight
explaining 56% of the variation in costs in method 1 and 54% in method 2. Thus, significant
changes in the methodology led to very little difference in the results; the much simpler
methodology may be sufficient in any subsequent work. The regressions also demonstrated
that the variation in average case costs explained by the case-mix adjustment was significant
and similar to that found by others.
01 Northern isolated hospitals were excluded.
HOSP CASE MIX COSTING 1991f92

68
Concerning the adjustment for non-acute cases, we wondered if the marginal cost weight
over-estimated the actual costs of long-stay outliers, and whether or not those hospitals which
correctly coded these cases may have been penalized by being assigned non-acute weights.
Two different sensitivity tests were done of the marginal costs. The first used 60% of the
marginal cost weights in Method 2 and yielded results similar to those we have reported here,
with the correlations between rankings significant and explaining 55% of the variation in
costs. The second method decreased the marginal cost weights used in Method I by 25%,
and again we found that the relative cost per weighted case changed very little across
hospitals. While this was a crude analysis which implied a constant reduction in all marginal
cost weights (unlikely in reality), it demonstrated that the sheer quantity of outlier days had a
major impact on hospital costs. Thus, despite the numerous atypical cases and their impact
on case weights, altering the marginal cost weight did not significantly alter the findings,
suggesting that hospitals that code non-acute cases accurately were not negatively affected.
Any small problems regarding allocations of costs or missing data appear unlikely to affect
results. The above findings, in combination with the previous allocation study (Wall,
DeCoster, Roos, 1993) which yielded comparable results when using two very different
allocation methods, suggest that our results are likely very robust.
Hospital Cost Analysis Regr~sions
While the goal of this paper was to adjust for case mix at the hospital level we also conducted
regression analyses to examine the importance of determinants of hospital costs. Teaching
hospitals and northern isolated hospitals were excluded from the following analysis due to
their anomalous costs.
Regression analysis was performed using cost per case as the dependent variable with the
following independent variables: indexed hospital average case weight (referred to as case mix
index CMI); occupancy rates; North - whether hospital was located in Norman or Thompson
region; and proportion of cases that involved a stay in an Intensive care unit (ICU). As we
expected, the CMI explained the greatest amount of variation between costs. Also not
surprisingly, we found a negative relationship between cost per Weighted case and higher
HOSP CASE MIX COSTING !991/92

69
occupancy rates. When one included the ICU variable as an additional measure of case mix,
we found that the higher the proportion of ICU days the higher the expected CWC. It may
be that the ICU variable captures some differences in case mix which are missed by the
RDRGs and may explain higher CWC costs at certain hospitals, although it would seemingly
do little to explain the differences in costs between the urban community hospitals and
teaching hospitals. One of the teaching hospital's proportion of ICU days was .8 percent
higher and the other about .6 percent lower than the average for the Winnipeg community
hospitals. The use of ICU days to supplement case mix will be further investigated when
examining 1993/94 data. It is important to remind the reader that the RDRGs appear to have
done a better job of explaining acuity levels than did the CMGs in 1991192 for the urban
hospitals.
The North variable implied that the average cost per case at northern hospitals would be 28%
higher than otherwise expected. It is not surprising that Northern cost per case would be
higher given the northern allowances and generally higher cost of goods and services. A more
complete discussion of the regression analysis is found in Appendix I.
V. QUALITY OF CARE- READMISSIONS
Readmission rates have been used in other studies to examine the issue of quality of care and
available resources. (HMRI, 1992; Corrigan and Martin, 1991; Burstin et al., 1993). To
investigate whether those hospitals that had been found to be more cost efficient were
delivering poorer quality care, we examined 30-day readmission rates for several high
frequency patient categories (typical patients only). Correlations between readmission rates
and CWCs were calculated for nine different diagnostic categories in each of the urban and
major rural hospitals (18 hospitals). No relationship was found between higher readmission
rates and lower average CWCs. In fact, the only significant relationship found was that high
cost hospitals had higher readmission rates for uterine procedures. Overall there appears to
be no evidence that hospitals that were more efficient delivered lower quality care.
HOSP CASE MIX COSTING 1991/92

70
VI. LIMITATIONS OF THE STUDY AND POSSffiLE
IMPROVEMENTS
Analyses Conducted on 1991/92 Data
It is important to bear in mind tbat tbese analyses were conducted on 1991/92 data. Since tbis
time, tbere have been major changes in tbe Manitoba system, witb tbe teaching hospitals in
particular experiencing bed closures and budget constraints. Whether budget reductions will
translate into greater efficiency will depend on whether reductions in cases were
comparatively small. If the decrease in cases was small relative to the dollars cut at the
teaching hospitals, then their relative efficiency should improve markedly; however the
opposite could also occur. Clearly, replication of these analyses will be necessary not only to
assess the stability of tbe findings, but to provide a more current assessment of the cost
efficiency of the teaching hospitals.
Lack of Local Cost Data
A major concern regarding this type of research in general is the use of American charges to
build weights. The implicit assumption underlying the use of American charge data is that
there is a constant relationship in relative case costs between Canada and the United States,
with, for example, cardiac bypass surgery being more expensive than hernia repair.
Certainly, Ontario and Alberta have been confident enough in the relative equivalencies
between Canadian and American hospital costs to make funding decisions based on similar
comparisons. We have used 1991 and 1992 Maryland charge data which are more current
than the 1985 New York data used by HMRI in Ontario and by Alberta. T~e tit of our
regression model suggests that U.S. charges can be used with some confidence to measure
expected costliness of Manitoba hospitals. The assumption about relativity of costs between
the two jurisdictions will continue to be made until Canadian specitic cost data are available;
however, we have no reason to believe the use of Maryland charges in conjunction with
Manitoba length of stay data would distort the weights to the extent that the results would be
inaccurate, particularly given tbe robust nature of the findings.
HOSP CASE MIX COSTING 1991/!Y.!

71
Until patient-specific Canadian cost data are available, several improvements could be made to
existing Manitoba data sources to ensure reliable and valid results:
1. Hospitals should be required to report HS-1 data in a consistent and correct manner.
This would alleviate much of the manual checking and verification of results in such areas as
census days. Requiring supplemental information, such as allocation of drugs and medical
and surgical supplies between inpatient and outpatient areas, would enhance the analysis.
2. Coding of diagnoses and procedures should be consistent across hospitals. Currently
some hospitals are very diligent about coding additional diagnoses, while others are not. This
may be a function of physicians failing to document all appropriate diagnoses or a failure of
these diagnoses to be abstracted. To understand more dearly the prevalence and overall costs
of non-acute patients in acute care beds, the coding of these cases should be improved at
"poor-coding" hospitals by appropriate use of the available service codes. Alternately, all
hospitals could indicate non-acute status with a separate admission (as in Ontario).
3. Many hospitals with attached personal care homes (PCH) are uncertain as to the
accuracy of the division of costs between the hospital and personal care home for shared
services. In order to obtain pure inpatient hospital costs, it is necessary to investigate further,
although to date we have not found any relationship between CWCs and hospitals with
attached PCHs.
4. More specific data should be collected regarding the provision of services by one
hospital for another. Many facilities are funded as regional centres, where pharmacy
services, dietetic advice or physiotherapy services are provided for another facility. Where
possible we reallocated costs to the appropriate facility, but in many cases it was not possible
to do so.
5. In order for the data to be complete, actual costs from both the Cadham Laboratory and
the Red Cross for services provided to hospitals are needed, with a distinction made between
inpatients and outpatients.
HDSP CASE MIX COSTING 1991/92

72
The lack of these cost data may create a bias against the two teaching hospitals as they will
more completely capture total costs for their patients. On the other hand, given the
complexity of their patients they are also proportionately more likely to use the yet uncosted
Red Cross and Cadham Laboratory services. Attempts will be made to quantify these services
when the work is repeated for another year. The extent to which services are provided by
major rural hospitals to other smaller rural hospitals needs to be further explored.
Transfers
Further examination of transfers between acute care facilities needs to be undertaken in order
to determine if and how the case weights developed in this report should be adjusted. The
dual roles of large teaching hospitals as both tertiary care centres and community hospitals
make this a complex issue, particularly if they receive many transfers that do not require
tertiary care.
Appropriateness
This study examined the types of cases being treated at the acute care facilities, and how
efficiently they were treated, but did not examine the appropriateness of admission or
treatment. Of concern is whether or not all patients admitted to hospital actually required
acute hospital services. A recent study in Ontario found that some areas of the province had
hysterectomy rates several times higher than those found in other areas of the province (ICES,
1994); whether all of the procedures, particularly those performed in high rate areas, were
appropriate is an important issue, but is not addressed by the current analysis. Likewise, a
recent study of medical admissions across Saskatchewan hospitals (HSURC, 1994) estimated
that 39 to 58% of adult medical days in urban hospitals and 45 to 76% of days in major and
intermediate rural hospitals could have been spent in alternative levels of care, such as
outpatient facilities, home care, or nursing homes. Since no such analysis of use of Manitoba
hospitals has been undertaken (although the MCHPE has begun such a study) we do not know
if there is a relationship between efficiency and appropriateness: a hospital that admits patients
who do not in fact require hospital care, and then discharges them quickly, could actually
.look quite cost efficient using the current methodology.
HOSP CASE MIX COSTING 19911!12

73
Generalizability of Results
It should also be kept in mind that the results reported above are all relative to Manitoba data.
That is, using the current methodology, we have no way of determining how efficiently
Manitoba hospitals are operating with respect to hospitals in other parts of the country.
Considering that expenditures per capita on hospitals in Manitoba are substantially higher than
the Canadian average ($918 vs $802 in 1991/92), this is an important area for future study.
Other Limitations
The results for small rural hospitals should be considered preliminary due to the small number
of cases at each of these facilities. Several years of data may be necessary to ascertain the
stability of the findings for these hospitals. As mentioned previously, although the costs at
northern isolated hospitals were significantly higher than those of other hospitals, the reasons
for these differences were not explored in detail. If these institutions are to be included in
efficiency comparisons in the future, an adjustment should be developed that will take into
consideration the high costs of such factors as extremely low occupancy, shipping of supplies,
higher wages and/or past funding patterns.
Vll. SUGGESTIONS FOR MANITOBA HEALTH AND
GOVERNMENT POLICY IMPLICATIONS
There are several areas where data collection could be improved in order to enhance this area
of investigation, some of which have been mentioned in the preceding section. One other
important area for improvement regards outpatient services and costs. In order to
comprehend fully the efficiency of hospitals in Manitoba, all areas of expenditure need to be
included. Outpatient services represent fully 20% of hospital activity, and this proportion is
increasing, underscoring the importance of comprehensive data on both costs and cases.
Improvements are required in both hospital data and charge data. More detailed coding of all
diagnoses and procedures would enable a distinction between a routine clinic visit and a true
emergency visit. Charge data should include: actual cost data for emergency rooms and other
outpatient areas; separate reporting of outpatient costs by all hospitals (currently not done by
HOSP CASE MIX COSTING 1991192

74
some rural hospitals); and a distinction between types of outpatient costs, for example,
separate cost centres for such diverse outpatient areas as dialysis units and obstetrical clinics.
Because the use of case-mix costing as a funding mechanism has led to gaming the system in
many instances, we would not recommend adopting case-mix costing as a sole funding
mechanism. In the U.S., where DRGs are used for case-mix funding, specific software has
been developed for coding diagnoses to maximize hospital case weights. As well, the
implementation of DRG-based funding led to an increase in diagnoses per case recorded. In
Canada, there is evidence of the shifting of inpatient costs to outpatient areas by hospitals to
maximize funding formulas to their advantage (Jacobs and Hall, 1993). Such a system could
also create incentives for over-admitting patients to hospital. We do recommend, however,
that the CWCs described in this report be used as part of a "report card" for hospitals so that
efficient hospitals could be rewarded for their efforts. Such a report card would also consider
factors such as efficiency of discharge, appropriateness of admission, available resources in
the community, as well as the age and health needs of the populations served.
Committees should be established within each hospital group to monitor efticiency.
Inefficient hospitals should be encouraged to work with more efficient institutions to identify
where improvements might be made.
Vill. CONCLUSIONS
Our case-mix adjustment for different types of patients across hospitals works well. Case
weights across Manitoba hospitals for typical patients were distributed the way one would
expect: most of the high resource-intensive, expensive cases were found at the teaching
hospitals, and the overall complexity/resource intensity of cases found at these two hospitals,
and at the other urban facilities, was markedly higher than that at the rural hospitals. Less
expected, perhaps, was the finding that the teaching hospitals also treat a considerable portion
of the low acuity, low resource intensive cases, suggesting they function not only as tertiary
care institutions but also as large community hospitals, particularly for pediatric and obstetric
admissions.
HOSP CASE MIX COSTING liJll/9'2

75
We have highlighted marked differences in cost efficiencies across hospitals for 1991/92. If
further analyses support our assessments, such data could provide important information with
which to adjust global hospital budgets. We do not, however, recommend moving to a
system of funding hospitals based only on case-mix adjusted costs because experience in both
Canada and the U.S. indicate that such a system is very "gameahle". Instead, information
which is gained by such work could be used as part of a "report card" for hospitals so that
efficient hospitals could be rewarded for their efforts. Such a report card would also consider
factors such as efficiency of discharge, appropriateness of admission, available resources in
the community, as well as the age and health needs of the populations served.
HOSP CASE MIX COSTING 1991/92

76
Table 19: Hospitals and Hospital Categories
I Hospital Type I Hospital Code Beds
Teaching St. Boniface Geneml Hospillll TA 756
Health Sciences Centre TB 986
Urban Community Brandon General Hospillll UCA 381
Gmce General Hospital UCB 333
Misericordia General Hospital ucc 388
Victoria General Hospital UCD 241
Concordia General Hospital UCE 136
Seven Oaks Geneml Hospital UCF 329
Major Rural Bethel Hospital, Winkler MRA 57
Bethesda Health & Social Services, Steinbach MRB 80
Dauphin Regional Health Centre MRC 124
Flin Flon General Hospital Inc. MRD 100
Morden District General Hospillll MRE 71
Porlllge District General Hospital MRF 131
The Pas Health Complex Inc. MRG 84
Selkirk and District General Hospital MRH 75
Swan River Valley Hospital MRI 87
Thompson General Hospital MRJ 100
Intennediate Rural Altona Community Memorial Health Centre lA 32
Beausejour District Hospillll IB 30
Carman Memorial Hospital IC 30
Churchill Health Centre ID 31
Johnson Memorial Hospital, Gimli IE 35
Minnedosa District Hospital IF 27
Neepawa District Memorial Hospital IG 38
Ste. Rose Geneml Hospital IH 68
HOSP CASB MlX COSTING 1991192

77
I Hospital Type II Hospital I Code I Beds I Souris Health District II 30
Health District No.IO, Virden u 25
Small Rural Arborg & District Health Centre SA 16
Baldur Health District SB 16
Boissevain Health District sc 12
Winnipegosis General Hospital SD 18
Rock Lake Health District, Crystal City SE 16
Southwest Health District, Deloraine SF 20
De Salaberry District Health Centre, St. Pierre SG 16
E.M. Crowe Memorial Hospital, Eriksdale SH 17
Erickson District Health Centre SI 12
Emerson Hospital SJ 12
Carberry Plains District Health Centre SK 29
Seven Regions Health Centre, Gladstone SL 20
Glenboro Health District SM 14
Grandview District Hospital SN 18
Hamiota District Health Centre so 23
Teulon-Hunter Memorial Health District SP 20
Lome Memorial Hospital, Swan Lake SQ 22
Tri-Lake Health Centre, Killarney SR 26
McCreary Alonsa Health Centre ss 13
Morris General Hospital ST 33
Notre Dame Medical Nursing Unit su 10
Pine Falls Health Complex SV 35
Pinawa Hospital sw 20
Roblin District Health Centre sx 25
Riverdale Health Services District, Rivers SY 16
Russell District Hospital sz 38
Birtle Health Services District SAA 19
HOSP CASE MIX COSTING 1991/92

78
I Hospital Type II Hospital I Code I Beds I Shoal Lake-Stmthclair Health Centre SBB 23
Stonewall and District Health Centre sec 18
Lakeshore Geneml Hospital, Ashern SDD 16
Ste. Anne Hospital SEE 21
Vita and District Health Centre Inc. SFF 11
St. Claude Hospital SGG 12
Tiger Hills Health District, Treheme SHH 18
Melita Health Centre sn 11
Wawanesa District Memorial Health Centre SJJ 9
Percy E. Moore Hospital, Hodgson SKK 16
Multi-use Benito Health Centre MUA 5
Pembina-Manitou Health Centre MUB 8
MacGregor and District Health Centre MUC 6
Health District No. 10, Reston MUD 17
Rossbum District Health Centre MUE 10
Wbitemouth District Health Centre MUF 6
Northern Isolated Snow Lake Medical Nursing Unit NIA 5
Gillam Hospital Inc. NIB 10
Lynn Lake Hospital NIC 25
Leaf Rapids Health Centre NID 8
Norway House Hospital N!E 16
HOSP CASE MIX COSTING 1991/92

79
REFERENCES
Barer M.L., Brownell M.D., Sheps S.B. Adult surgical utilization in Manitoba, 1981-1991. Manitoba Health. Winnipeg, 1994.
Black C, Frohlich N. Hospital funding within the health care system: Moving towards effectiveness. Manitoba Centre for Health Policy and Evaluation. University of Manitoba, 1991.
Brownell M.D, Roos N.P. An assessment of how efficiently Manitoba's major hospitals discharge their patients. Manitoba Centre for Health Policy and Evaluation. University of Manitoba, 1992.
Burnstin, Helen R., Lipsitz, Stuart R., Udvarhelyi Steven, Brennan, Troyen A. The effect of hospital financial characteristics on quality care. Hospitals and Quality Care August 1993;845-849.
Carter Grace M., Farley Donna 0. A longitudinal comparison of charge-based weights with costbased weights. Health Care Financing Review 1992;13:(3)53-63.
Case Mix Research. Indirect costs of teaching in Canadian hospitals. February 1989.
Cameron J .M. The indirect costs of graduation medical education. The New England Journal of Medicine 1985;312:1233-1238.
Corrigan, Janet M., Martin, James B. Identification of factors associated with hospital readmission and development of a predictive model. Health Services Research 1992;27:(1)83-101.
Estimates of expenditures for the province of Manitoba for fiscal year ending March 31, 1994. Manitoba Government.
Evans R.G., Lomas J ., Barer M.L., Labelle M.A., Fooks Catherine, Stoddart G.L., Anderson G.M., Feeny D., Gafne A., Torrance G., and Tholl W. Controlling health expenditures- The Canadian reality. The New England Journal of Medicine 1989;320:571-577.
Fetter, Robert B. DRGs their design and development. Ann Arbor: Administration Press, 1991.
Frick, Alexander, Grisez-Martin, Suzanne, Shwartz, Michael. Case-mix and cost differences between teaching and nonteaching hospitals. Medical Care 1985,23:(4)283-295.
Helyar C. Comparative analysis of the HMRI database. The Hospital Medical Records Institute, 1992.
HMRI resource intensity weight 1990 re-development project. Final project report, The Hospital Medical Records Institute, September 1990.
HOSP CASE MIX COSTING 1991/92

80
HMRI 1991 resource intensity weights summary of methodology. Tlze Hospital Medical Records Institute, September 1991.
HMRI Resource Intensity Weights 1993/94- Summary of Methodology. The Hospital Medical Records Institute, 1994.
Health Canada. Green Book Tables, Provincial Government Health Expenditures and Related Federal Contributions, Canada, the Provinces and the Territories, 1974-75 to 1992-93. Health Canada, July 1994.
Health Canada. Preliminary Estimates of Health Expenditures in Canada, Provincial/Territorial Summary Report, 1987-1991. Health Canada, 1994.
Health Services Utilization and Research Commission, Saskatchewan. Barriers to Community Care, SUIIlmary Report No. 3, September 1994.
Hochstein, Alan, A cost comparison in the treatment of long stay patients. Canadian Public Policy 1984;X:2:177-184.
Jacobs P, Hall EM, Lave J.R., Glendining M. Alberta's Acute Care Funding Project. Healtlzcare Management ForUIIl, 1992;5:4-11.
Jacobs P., Bay K., Hall E.M., RDRG V3.0 case and day weights: A research report submitted to the technical working committee, Alberta Health, 1993.
Manitoba Health Services Commission: Annual Report 1991-92, Government of Manitoba, 1992.
Mazes B., Easterling J., Sheiner L., Melman K., Kline R., Goldman E., Brown A. Case-mix adjustment using objective measures of severity: The case for laboratory data. Health Services Research February 1994;28:6;689-712.
Naylor David ed., Institute for Clinical Evaluative Sciences in Ontario. Pattenzs of Health Care in Ontario: The ICES Practice Atlas. Canadian Medical Association, 1994.
Newhouse JP, Anderson G, Roos LL. Hospital spending in the United States and Canada: A Comparison. Health Affairs 1988;6-24.
Nichols, Debra, Developing actual costs of patient services: The University of Alberta Hospitals. Journal of Ambulatory Care Management July 1993;61-68.
Pink, George H., Bailey, Hilda B., Physicians in Health Care Management: 4. Case Mix Groups and Resource Intensity Weights: physicians and hospital funding. Canadian Medical Association Journal April 1994; 1255-1261.
Rogowski JA, Newhouse JP. Estimating the indirect costs of teaching. Journal of Health Economics 1992, 11; 153-171.
HOSP CASE MIX COSTING 1991/92

81
Roos L.L., Roos N.P., Cageorge S.M., Nicol J.P., 1982, How good are the data? Reliability of one health care data bank. Medical Care 1982;20:266-276.
Roos L.L., Sharp S.M., Wajda A., Assessing data quality: a computerized approach, Social Science Medicine 1989,28:175-182.
Stearns, Sally C., Hospital discharge decisions, health outcomes, and the use of unobserved information on case-mix severity. Health Services Research 1991;26:1
Thorpe K.E., The use of regression analysis to determine hospital payment: The case of Medicare's indirect teaching adjustment. Inquiry 1988;25:219-231.
Wall R, DeCoster C, Roos NP. Estimating per diem costs for Manitoba hospitals: A first step. Manitoba Centre for Health Policy and Evaluation, University of Manitoba, 1994.
Woolhandler S. and Himmelstein D.U. The deteriorating administrative efficiency of the U.S. health care system, New England Journal of Medicine 1991 ;324: 1253-1258.
HOSP CASE MIX COSTING 1001192

Appendix Tables
These six Appendix Tables provide case, cost and weight information for individual hospitals -the key to these tables is found in Table 19 of the main document. There are three additional Appendix Tables, not included here, that provide case, cost and weight information for each of the RDRG categories. Because of their length, they will be available only upon request.
List of Appendix Tables
Table A-1 Calculation of Manitoba Hospital Acute Inpatient Costs, 1991/92 ................................ .
Table A-2 Hospital Case Cost Performance Indicators by Hospital, 1991/92 ........................•.... 8
Table A-3 Table 9 Summary Breakdown of Manitoba Weighted Cases and Costs by RDRG ......................... 15
Table A-4a Atypical Cases by Hospital -Deaths, Transfers, 1991/92 ....... 17
Table A-4b Atypical Cases by Hospital - Outliers, 1991/92 ............. 24
Table A-5 Atypical Cases - Non Acute ......................... 31
Table A-6 Percent Type of Case by Hospital, 1991/92 ............... 36

Appendix Table A-1 provides the calculation of inpatient costs for each of the acute care hospitals in Manitoba, for 1991/92. Further information about this calculation and the allocation methodology can be found in Appendix G.
1. Total Cost - this is the total operating expense from the HS-1 form.
2. Imputed Costs - this is the estimated costs for LIS and therapy costs.
3. Revised Total Costs - the imputed costs have been added in, and the amounts for purchased service contracts for these services have been removed.
4. Excluded Costs - the costs excluded here were medical remuneration, direct teaching costs and other non-patient care activities such as research, heating costs for Cadham laboratory and the medical school, etc.
5. Direct Outpatient Costs- costs directly attributed to outpatient services.
6. Allocated Outpatient Overhead - the portion of overhead costs that was allocated to outpatient services.
7. Recoveries Adjustments- this refers to cafeteria income which was added in to result in net cafeteria costs.
8. Inpatient Case Costs - this was the value used for inpatient care costs for other calculations in this study. It was calculated by subtracting columns 4 to 7 from column 3.

2
Table A-1
Cakulation of Manitoba Hospital Acute Inpatient Costs, 1991/92
------ -
Total Imputed Revised Total Excluded Direct Allocated Recoveries
Inpatient i
Hospital Code Cost Costs Costs• Costs
Outpatient Outpatient Adjustments
Care Costs Overhead Costs
I TA
I 173,453,010 0 173,453,010 29,172,255 19,000,848 13,280,434 1,427,760 110,571,713
TB 287,578,425 0 287,578,425 66,746,964 37,743,585 22,828,434 2,569,425 157,690,0!6
I Teaching Subtotal I 461,031,435 0 461,031,435 95,919,219 56,744,433 36,108,869 3,997,185 268,261,729
UCA 46,825,772 0 48,309,232 5,636,259 4,814,295 2,817,665 679,226 34,361,787
UCB 46,682,229 0 46,682,229 6,277,099 4,479,222 2,872,240 278,595 32,775,072
ucc 54,370,048 0 54,370,048 8,634,025 3,350,276 2,260,550 321,132 39,804,066
UCD 38,390,076 0 38,390,076 5,161,724 3,569,943 2,964,728 412,322 26,281,359
UCE 23,508,761 0 23,513,195 3,530,474 3,216,348 2,453,430 201,742 14,111,202
UCF 48,551,222 0 48,551,222 7,208,893 4,992,235 3,748,594 827,823 31,773,677
Urban Community 258,328,108 () 259,816,002 36,448,474 24,422,319 17,117,207 2,720,840 179,107,162
Subtotal
MRA 4,846,624 638,175· 5,053,412 61,218 796,525 245,877 32,575 3,917,217
MRB 7,791.660 775,289 8,102,765 1,293,532 I ,359,651 588,645 77,492 4,783,446
MRC 14,949,394 1,571,553 15,022,288 3,115,739 1,922,011 568,153 119806 9,296,579
MRD 10,335,664 1,085,548 10,451,651 195,560 1,571,812 694,350 68915 7,921,0!5
MRE 6,504,624 974,065 6,956,526 299,836 I ,258,266 326,892 29899 5,041,633

3
I
-
Total Imputed Revised Total Excluded Direct Allocated
Recoveries Inpatient
I Hospital Code Cost Costs Costs• Costs
Outpatient Outpatient Adjustments
Cure Costs Overhead Costs
MRF 10,228,888 1,142,116 10,303,889 477,181 I ,514,927 406,502 79580 7,825,699 1
I
MRG 11,372,596 1,354,727 11,479,557 870,878 2,171,464 1,112,826 99,475 7,224,913 !
MRH 10,248,276 1,273,233 10,805,769 2,427,716 1,808,288 751,919 56,765 5,761,081
MRI 7,029,066 658,024 7,018,249 113,661 877,399 291,447 68,827 5,666,915
MRJ 13,312,375 0 13,593,536 1,170,797 1,668,134 816,207 133,556 9,804,842 '
I Major Rural
96,619,167 9,472, 731 98,787,641 10,026,118 14,948,476 5,802,817 766,890 67,243,340 Subtotal
i
I
lA 2,057,243 254,640 2,113,689 122,901 352,253 115,767 25,309 I ,497,459
IB 2,256,244 267,137 2,293,271 93,523 304,362 92,432 21,394 1,781,560
I IC 2,995,124 272,778 2,974,530 442,429 399,273 165,957 18,914 1,947,958
ID 4,599,759 289,620 4,619,740 159,455 854,752 1,006,677 125,803 2,473,053
I IE 2,530,664 385,273 2,452,785 91,013 478,504 154,454 20,897 1,707,917
IF 2,868,846 273,427 2,909,876 296,397 388,663 171,382 31,451 2,021,983
i IG 3,019,102 576,293 3,318,877 333,707 685,053 186,440 15,020 2,098,656
IH 4,176,741 304,328 4,061,954 188,174 398,195 109,372 26,034 3,340,179
II 2,407,395 265,864 2,389,301 35,119 392,389 209,987 23,668 1,728,138
u 3,097,975 372,669 3,108,516 831,750 447,915 130,183 11,519 1,687,148
* Revised Total Costs - once the removal of purchased service contracts and the inclusion of the estimated rum! imaging, laboratory and therapy costs where applicable.

4
----
Total Imputed Revised Total Excluded Diroct Allocated
Recoveries Inpatient
Hospital Code Outpatient Outpatient Care Cost Costs Costs• Costs
Costs Overhead Adjustments
Costs
Intermediate 30,009,093 3,262,030 30,242,539 2,594,468 4,701,359 2,342,651 320,009 20,284,053
Subtotal
SA 1,517,940 143,141 1,535,574 374,031 170,640 78,002 12,825 900,076
SB 934,473 58,117 943,320 54,198 151,466 69,256 500 667,900
sc 1,262,827 145,293 1,285,509 78,404 209,903 109,862 8,886 878,454
SD 1,274,525 66,495 1,233,761 48,847 110,693 41,656 6,571 1,025,994
SE 1,180,432 147,953 1,266,890 119,593 165,713 38,591 9,119 933,873
SF 1,455,694 233,899 1,491,527 71,704 326,018 102,385 5,055 986,365
SG 1,200,856 196,193 1,194,860 60,432 207,486 70,069 8,336 848,538
SH 1,052,467 144,408 1,081,291 120,624 156,456 36,456 0 767,756
S1 989,175 87,429 1,026,241 115,836 138,310 55,521 5,996 710,578
SJ 1,121,000 99,861 1,169,085 297,243 113,342 23,756 1,843 732,902
SK 1.487,137 136,836 1,490,162 22,698 196,936 64,412 9,235 1,196,881
SL 1,952,822 206,593 2,014,470 268,432 215,326 99,306 19,407 1,411,999
SM 1.129,339 89,812 1,285,238 '259,442 143,562 76,636 4,380 801,218
SN 1,746,214 106,576 1,718,245 613,757 113,798 24,688 6,794 959,208
so 1,790,761 258,553 1,777,598 100,654 307,502 61,918 30,960 1,276,564
SP 1,859,105 274,613 1,933,665 255,688 306,516 64,064 15,931 1,291,466 ----- -- ------------· -- ------------- -----
* Revised Total Costs - nne..: the removal of purchased service contracts and the inclusion of the estimated rural imaging, laboratory nod therapy costs where applicable.

5
To!Jll lmpul£d Revised To!Jll Excluded Direct Allocl!l£d
Recoveries Inpatient
Hospi!Jll Code Cost Costs Costs• Costs
Outpatient Outpatient Adjustments
Care Costs Overhe.ad Costs
SQ 1,585,324 286,834 1,572,852 38,349 305,743 64,032 0 1,164,728
SR 2,143,071 490,404 2,276,972 82,274 441,812 79,892 20,340 I ,652,654
ss 1,019,426 70,037 I ,006,014 78,402 89,870 21,156 6,191 810,394
ST 2,323,283 241,352 2,225,352 87,032 287,888 95,676 12,338 1,742,417
su 1,457,936 74,990 1,477,670 322,986 89,798 26,609 5,138 845,867 I
sv 3,289,510 228,806 3,264,057 1,027,913 293,848 91,380 27,109 I ,823,807
sw 1,149,499 125,489 1,132,065 26,596 156,649 64,479 4,292 880,049
sx 1,791,050 256,879 I ,772,288 123,321 298,017 92,366 0 I ,258,585 !
SY I, 133,689 149,805 I ,096,259 64,052 168,373 45,858 16,788 801,188
sz 2,206,061 322,809 2,298,151 93,287 346,506 90,321 6,678 1,761,359
SAA 1,374,334 154,326 1,326,926 89,637 188,392 66,218 5,690 976,988
SBB 1,328,078 149,833 1,307,951 35,939 158,660 38,582 7,716 1,067,054
sec 1,568,991 262,622 1,633,473 52,152 380,029 134,804 20,098 1,046,390
SDD 1,156,655 152,731 1,142,151 134,508 233,968 107,471 7,964 658,239
SEE 2,070,628 189,055 2,110,291 335,307 305,428 122,633 3,831 I ,343,091
SFF 1,252,191 123,862 1,292,003 407,656 258,926 108,306 11,921 505,194
SGG 957,242 67,578 978,070 93,096 118,882 34,673 9,228 722,191 -·-- ' -------- -
* Revised Total Costs - once the removal of purchased service contracts and the inclusion of the estimated rural imaging, laboratory and therapy costs where applicable.

6
-----------
Total Imputed Revised Total Excluded Direct Allocated
Recoveries lnpatieot
Hospital Code Cost Costs Costs• Costs
Outpatieot Outpatieot Adjustments Care
•
Costs Overhead Costs
' SHH 1,339,717 142,975 I ,345,231 73,412 133,826 16,581 7,423 1,113,989 I
Sll I ,007,636 128,613 1,015,168 89,052 150,950 37,783 6,090 731,293 !
i
SJJ 821,853 87,022 838,324 12,752 109,622 35,014 3,867 677,069 ' !
SKK 2,446,220 6,908 2,329,030 164,453 145,911 149,982 0 1,868,684 '
Small Rural 55,377,161 6,108,701 55,887,732 6,293,759 7,696,764 2,540,395 328,540 38,841,001 '
Subwtal I
I
MUA 686,991 21,611 664,082 205,896 50,021 23,839 12,212 372,114
MUB 830,701 96,661 876,315 149,922 123,166 23,400 9,884 569,943
MUC 546,508 27,841 535,129 55,009 32,184 17,969 7,265 422,702
MUD I ,006,500 72,715 1,007,238 106,535 105,480 30,891 6,211 758,121
MUE 700,182 67,353 723,649 110,443 108,147 6!,637 3,266 440,157
MUF 829,027 54,556 823,034 261,283 37,131 7,224 6,763 510,633
Multi-Use Suhlntal 4,599,909 340,736 4,629,447 889,088 456,128 164,960 45,601 3,073,670
NIA 974,339 55,271 976,455 381,811 83,205 28,867 0 482,572
NIB 1.677,853 151,103 1,676,412 275,710 164,231 116,069 1,708 1,118,694
NIC 1.467,268 121,904 I ,387,801 13,728 118,861 90,538 10,443 1,154,231
NID 9!8,906 86,183 936,510 43,425 167,440 56,550 2,979 666,116
* Revised Total Costs- once the removal of purchased service contracts and the inclusion of the estimated rural imaging, laboratory and therapy costs where applicable.

7
Total Imputed Revised Total Excluded Dirt'Ct Allocated Recoveries
Inpatient Hospital Cude
Cost Costs Costs• Costs Outpatient Outpatient
Adjustments Care
Costs Overhead Costs
I NIE I 2,632,814 0 2,646,037 0 360,687 244,450 0 2,040,900
Northern Isolated 7,671,180 414,462 7,623,216 714,674 894,424 536,474 15,130 5,462,514
Subtotal
I GRAND TOTAL] 913,636,053 19,598,660 918,018,012 152,885,800 110,051,174 64,613,374 8,194,195 582,273,469 -- ·_
* Revised Total Costs - once the removal of purchased service contracts and the inclusion of the estimated rural imaging, laboratory and therapy casts where npplicable.

Appendix Table A-2 gives the case cost parameters involved in the calculation of the cost per weighted case, by each hospital and each hospital type.
1. Total Cases - the total number of cases (both typical and atypical) including an adjustment for those cases in hospital during the 1991/92 fiscal year but not discharged from hospital by March 31, 1993.
2. Average RCW for Typicals only- average RCWs for typical patients only. Typical cases were assigned an RCW according to their RDRG category, regardless
8
of where the case occurred (e.g., teaching or rural hospital) or how long their length of stay was. The RCWs for all typical cases were summed for each hospital and divided by the total number of typical cases. Case weight development is discussed in Section III-1 of the paper and in Appendix A.
3. Percent Typical Cases - the percentage of typical cases at each of the hospitals.
4. Average Relative Weight per Case for Typicals and Atypicals - the average relative weight per case with both typical and atypical cases included. Weighting formulas for the atypical cases are discussed in Section III-3 of the paper and in Appendices C, D and E.
5. Actual cost per case - represents the allocated inpatient costs divided by the total number of cases. The allocation methodology is discussed in Section III-2 of the paper and in Appendix G.
6. Average Cost per Weighted Case (CWC) for each hospital - calculated by taking the actual cost per case (column 5) and dividing it by the average relative weight per case for both typical and atypical cases (column 4). 1 Section III-4 and Appendix A provide more detail on the calculation of the ewe.
7. Hospital Average Cost per Weighted Case- Average CWC for all hospitals combined. Calculated by adding the CWC for each hospital and dividing by the number of hospitals.
8. Index Ratio of hospital CWC to the Provincial Average CWC- calculated by dividing column 7 by column 8. This indexed CWC represents the efficiency indicator and allows each hospital to be compared to others as well as to the provincial average of 1.00. 9. Rank - Using the indexed CWCs from column 8 we ranked the hospitals from most to least expensive, and the rankings are found in the final column of this table.
1 The values that appear in this table have been rounded.
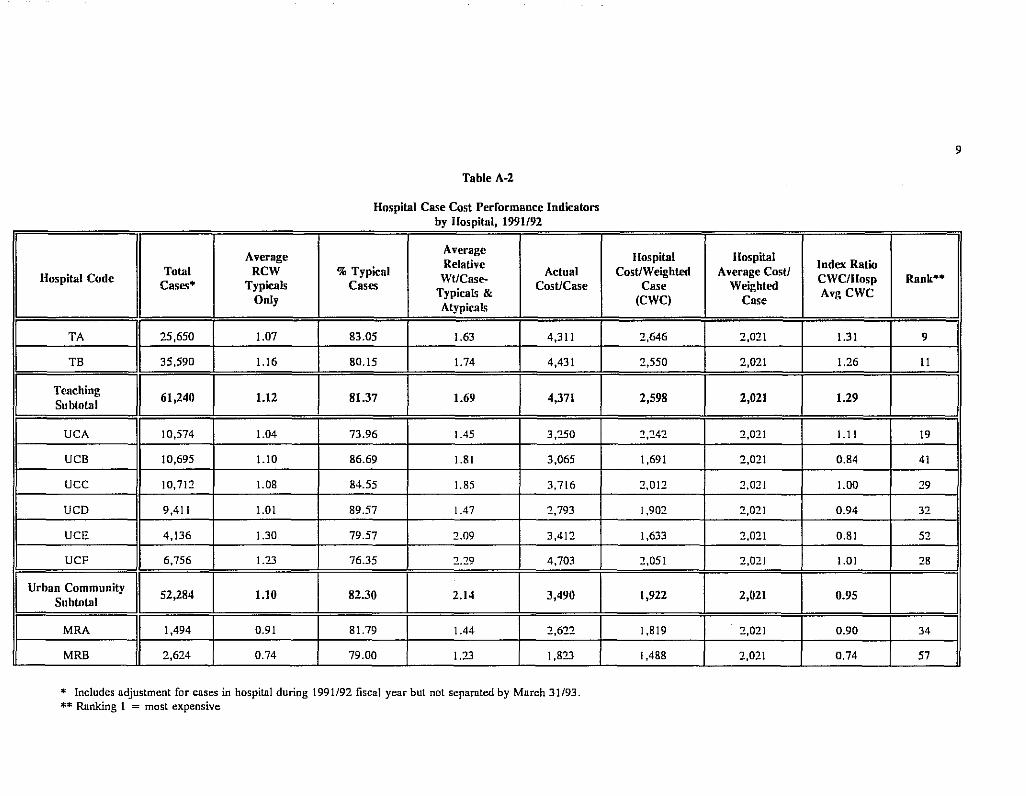
I --------- ----
Average
Hospital Code Total RCW
' Cases• Typicals I
I
Only
~I TA
I 25,650 1.07
TB 35,590 1.16
I
Teaching 61,240 1.12
Subtotal
UCA 10,574 1.04
UCB 10,695 1.10
ucc 10,71::1 1.08
UCD 9,411 1.01
UCE 4,136 1.30
UCF 6,756 1.23
Urban Community 52,284 1.10
!I Subtotal
Table A-2
Hospital Case Cost Performance Indicators by Hospital, 1991/92
Average Relative
%Typical WUCase-
Actual Cases CosUCase
Typicals & Atypical<
83.05 1.63 4,311
80.15 1.74 4,431
81.37 1.69 4,371
73.96 1.45 3,250
86.69 1.81 3,065
84.55 1.85 3,716
89.57 1.47 ::1,793
79.57 ::1.09 3,41::1
76.35 2.29 4,703
82.30 2.14 3,490
I_ MRA
I 1,494 0.91 81.79 1.44 2,622
MRB 2,624 0.74 79.00 1.23 1,823
* Includes adjustment for cases in hospital during 1991/92 fiscal year but not separated by March 31/93. ** Ranking 1 = most expensive
9
Hospital Hospital Index Ratio
CosUWeighted Average CosU CWC/IIosp Rank••
Case Weighted Avg ewe
(CWC) Case
2,646 2,021 1.31 9
2,550 2,021 1.26 II
2,598 2,021 1.29
2,242 2,021 !.II 19
I ,691 2,021 0.84 41
2,012 2,021 1.00 ::19
1,90::1 2,021 0.94 32
1,633 2,021 0.81 5::1
::1,051 2,021 1.01 28
1,922 2,021 0.95
I ,819 2,021 0.90 34
I ,488 2,021 0.74 57

Average Average Relative
Hospital Code Total RCW %Typical
WtiCase-Actual
Cases• Typicals Cases Typicals & CostJCase
Only Atypicals
MRC 3,141 0.89 80.93 1.45 2,960
MRD 2,849 0.72 87.43 1.15 2,780
MRE 1,910 0.79 74.08 1.27 2,640
MRF 4,366 0.81 82.62 1.20 1,792
MRG 3,281 0.73 88.39 0.87 2,202
MRH 2,248 0.92 81.41 1.31 2,563
MRI 3,179 0.77 83.42 1.18 1,783
MRJ 4,817 0.73 90.47 0.80 2,035
Major Rural 29,909 0.79 83.89 1.15 2,320
Sublotal
lA 663 0.85 76.02 1.59 2,:!59
18 918 0.89 75.38 !.52 1,941
IC 976 0.89 81.45 1.36 1,996
lD 1,101 0.65 72.57 0.81 2,246
IE 969 0.80 83.18 1.23 1,763
IF 998 0.87 76.25 1.26 2,026
* Includes adjustment for cases in hospital during 1991/92 fiscal year but not sepamted by March 31/93. ** Ranking I = most expensive
10
~ ~ ---------
Hospillll Hospital Index Ratio ·
CostJW eighted Average Costl CWC/Hosp Rank••
Case Weighted AvgCWC
(CWC) Case
2,045 2,021 1.01 27
2,410 2,021 1.19 17
2,076 2,021 1.03 24
1,498 2,021 0.74 54
2,518 2,021 1.25 13
1,952 2,021 0.97 30
1,515 2,021 0.75 53
2,534 2,021 1.25 12
1,985 2,021 0.98
1,424 2,021 0.70 64
1,281 2,021 0.63 71
1,471 2,021 0.73 59
2,776 2,021 1.37 7
I ,433 2,021 0.71 62
1,607 2,021 0.80 46 - -------- -----

!
L_ .
Average Average Relative
Hospital Code Total RCW %Typical
Wt/Case-Actual
Cases* Typicals Cases Typicals &
CosUCase Only
Atypicals
IG 1,395 0.86 80.22 1.16 1,504
IH 1,305 0.73 83.37 1.58 2,560
II 938 0.82 81.98 1.48 1,842
lJ 894 0.82 80.76 1.20 1,887
Intermediate 10,157 0.81 79.30 1.30 2,002
Subtotal
SA 447 0.83 82.33 1.15 2,014
SB 216 0.80 81.48 !.59 3,092
sc 383 0.92 79.37 1.34 2,294
SD 511 0.73 83.76 1.34 2,008
SE 452 0.79 76.11 1.24 2,066
SF 704 0.77 82.39 0.98 1,401
SG 461 0.77 78.31 1.33 1,841
SH 415 0.80 80.24 1.20 I ,850
51 339 0.82 73.45 !.55 2,096
SJ 214 0.83 76.64 1.36 3,425 -·-
* Includes adjustment for cases in hospital during 1991/92 fiscal year but not sepnrntcd by March 31/93. ** Ranking 1 = most expensive
11
Hospital Hospital Index Ratio
Cost/Weighted Average Cost! CWC/Hosp Rank••
Case Weighted Avg ewe
(CWC) Case
1,299 2,021 0.64 69
1,622 2,021 0.80 44
1,244 2,021 0.62 74 .
1,576 2,021 0.78 49
1,573 2,021 0.78
1,750 2,021 0.87 35
1,948 2,021 0.96 31
1,717 2,021 0.85 38 i
1,494 2,021 0.74 55
1,669 2,021 0.83 42
I ,427 2,021 0.71 63
I ,382 2,021 0.68 67 I
1,548 2,021 0.77 51
1,352 2,021 0.67 68
2,509 2,021 1.24 14

Average Average Relative
Hospital Code Total RCW %Typical
Wt/Case-Actual
Cases• Typicals Cases Cost/Case Only
Typicals & Atypicals
SK 275 0.86 72.73 2.06 4,352
SL 375 0.86 76.53 1.64 3,765
SM 383 0.84 86.16 1.04 2,136
SN 462 0.76 78.35 1.21 2,076
so 559 0.88 67.62 1.56 2,284
SP 626 0.78 82.43 1.38 2,063
SQ 935 0.76 90.48 0.88 1,246
SR 779 0.77 78.82 1.32 2.122
ss 155 1.00 68.39 2.54 5,228
ST 701 0.72 82.17 1.37 2,486
su 275 0.76 72.73 1.19 3,076
sv 1,230 0.72 86.34 0.87 1,483
SW 512 0.78 85.55 1.16 I ,719
sx 675 0.87 81.04 1.46 I ,865
SY 338 0.78 78.40 1.83 2,370
sz 1,355 0.76 87.31 0.94 1,300
* Includes udjustmcnt for cases in hospital during 1991/92 fiscal year but not separated by March 31/93. ** Ranking 1 = most expensive
12
Hospital Hospital Index Ratio
Cost/Weighl<d Average Cost/ CWC/Hosp Rank••
Case Weighl<d (CWC) Case
AvgCWC
2,110 2,021 1.04 23
2,298 2,021 1.14 18
2,057 2,021 1.02 26
I ,713 2,021 0.85 39
1,463 2,021 0.72 60
1,490 2,021 0.74 56
1,408 2,021 0.70 65
I ,611 2,021 0.80 45
2,061 2,021 1.02 25
1,821 2,021 0.90 33
2,594 2,021 1.28 10
1,698 2,021 0.84 40
1,487 2,021 0.74 58
1,276 2,021 0.63 72
1,298 2,021 0.64 70
1,389 2,021 0.69 66

-- -- ---·--
Average Average
Toll!! RCW %Typical Relative Actual Hospill!l Code Wt/Case-Cases• Typicals Cases
Typicals & Cost/Case
Only Atypicals
SAA 675 0.71 83.11 0.93 1,447
SBB 398 0.88 78.14 !.53 2,681
sec 564 0.86 80.50 1.49 1,855
SDD 564 0.69 83.16 0.94 1,167
SEE 785 0.90 83.82 1.19 1,711
SFF 368 !.OJ 75.54 1.58 1,373
SGG 163 0.86 82.21 1.62 4,431
SHH 272 0.75 65.81 2.47 4,096
Sll 257 0.79 74.32 1.34 2,845
SJJ 225 0.74 74.22 1.35 3,009
SKK 1,074 0.68 91.99 0.70 1,740
Smnll Rural 19,122 0.79 81.62 1.24 2,379
Subtotal
MUA 138 0.92 75.36 1.71 2,696
MUB 169 0.78 82.25 1.10 3,372
MUC 92 0.73 59.78 1.87 4,595
* Includes adjustment for cases in hospital during 1991/92 fiscal year but not separated by March 31/93. ** Ranking 1 = most expensive
13
Hospital Hospiwl Cost/Weightro Average Cost/
Index Ratio CWC/Hosp Rank**
Case Weightro Avg ewe
(CWC) Case
1,549 2,021 0.77 50
1,750 2,021 0.87 36
1,244 2,021 0.62 73
1,241 2,021 0.61 75
1,440 2,021 0.71 61
871 2,021 0.43 76
2,727 2,021 1.35 8
1,659 2,021 0.82 43
2,129 2,021 1.05 22
2,235 2,021 !.II 20
2,472 2,021 1.22 15
1,727 2,021 0.85
1,579 2,021 0.78 48
3,076 2,021 1.52 6
2,453 2,021 1.21 16

I
Average Average Relative
Hos pi!Jll Code To!Jll RCW %Typical
Wt/Case-Actual
Cases• Typicals cas .. Typicals & Cost/Case
Only Atypicals
MUD 207 0.80 62.32 2.09 3,662
MUE 254 0.81 81.89 1.08 1,733
MUF 176 0.92 83.52 1.31 2,901
Multi-Use I 1,036 I 0.83 I 75.48 I 1.48 I 3,160 Subto!Jll
NIA 105 0.85 81.90 0.70 4,596
NIB 209 0.72 79.43 0.90 5,353
NIC 237 0.75 75.11 1.26 4,870
NID 158 0.74 86.08 0.93 4,216
N1E 747 0.67 86.75 0.72 .. 2,732
Northt'rn lsoluh.>d 1,456 0.71 - 83.38 1.02 4,353
Subtotal
GRANil TOTAL I 175,204 1 82 !.54 3,039
* Includes adjustment ror cases in hospital during 1991/92 fiscal year but not separated by March 31/93. ** Ranking l = most expensive
14
Hospi!Jll Hospi!Jll Index Ratio
Cost/Weighl<!d Average Cost/ CWC/Hosp Rank••
Case Weighl<!d Avg ewe
(CWC) Case
1,749 2,021 0.87 37
1,599 2,021 0.79 47
2,218 2,021 1.10 21
I 2,112 I 2,021 I 1.05 I I 6,577 2,021 3.25 I
5,953 2,021 2.95 4
3,871 2,021 1.92 3
4,511 2,021 2.23 5
3,820 2,021 1.89 2
4,946 2,021 2.45
2,021 2,021 3,154 ----·-

Appendix Table A-3 provides a summary of the breakdown of case cost parameters by RDRG class for all hospitals combined. This table is a summary of Appendix Table A-9.
15
1. Number of Cases -cases that had days in 1991/92 but had not separated by March 31, 1993 are not included here.
2. Average Relative Weight per Case (including Atypical cases) - the average weights for all typical and atypical cases in each of the RDRG classes.
3. Provincial Average Cost per Weighted Case - this summary value of average cost per weighted case (CWC) differs from that in Table A-2 because here the average is taken for all cases, rather than by hospital.
4. Cost per Case - calculated by multiplying the average relative weight per case (column 2) by the provincial average ewe (column 3).
5. Total Manitoba Costs -calculated by multiplying the costs per case by the number of cases.
6. Percentage of Total Manitoba Costs - the percentage of the total Manitoba costs that each of the categories comprise.
The costs in this table are expected costs based on calculated case weights and the partitioning of actual costs.

16
Table A-3
Table 9 Summary Breakdown of Manilnba Weighted Cases and Costs by RDRG
Number Avg. Relative
Prov. Avg. Expeeted Expeeted
WtiCase %of RDRG Class of (incl. Cost! WI Cost/Case Total MB
Total Cases Atypicals) Case* Costs
Mil Costs
Surgical Obstetrics 4,570 1.!3 2,136 2,413 11,018,074 1.892
Medical Obstetrics 21,439 0.66 2,136 1,407 30,162,694 5.180
Surgical 41,874 2.35 2,136 5,024 210,395,361 36.132
Medical 81,872 1.53 2,136 3,271 267,822,854 45.995
Other 25,307 1.!6 2,136 2,485 62,891,276 10.801
GRAND TOTAL 175,062 1.56 2,136 3,326 582,290,259 100

17
Appendix Table A-4a gives the numbers and percentages of death and transfer cases for each of the hospitals.
1. Total cases - these are the total cases for all the data (not including cases hospitalized in 1991/92 but not yet separated by March 31, 1993).
2. 1991/92 Total Days - days for cases in column 1.
3. Number of cases - number of cases categorized as deaths - does not include medical deaths occurring within 48 hours (see footnote 35 in the paper).
4. 1991/92 days - days for cases in column 3.
5. Percent cases - the percentage of all cases that were categorized as deaths.
6. Percent Days - days for cases in column 5.
7. Percent Total Hospital Case Weight- this represents the percentage of the total hospital case weight that is attributable to deaths.
8. Number of cases - number of cases categorized as transfers, not including cases that were also categorized as death.
9. 1991/92 Days- days for cases in column 8.
10. Percent Cases - the percentage of all cases that were categorized as transfers (not including those also categorized as deaths).
11. Percent Days- the days for cases in column 10.
12. Percent Weights - this represents the percentage of the total hospital case weight that is attributable to transfers.

18
Table A-4 a
Atypical Cases by Hospital - Deatbs, Transfers, 1991/92 ---- --- --- -
I I I Atypical Cases
All Data• Deaths Transfers (excluding deaths)
Hospital Total 1991/92 No. or 1991/92 % % %Total
No. of 1991/92 % Number Cases Total Days Cases Days Cases Days
Hospital Cases Days Cases %Days % Wts
Case Wt !
I TA
I 25,631 242,197 796 23,839 3.1 9.8 7.9 1,631 26,877 6.4 11.1 1!.8 i
TB 35,590 324,503 888 21,415 2.5 6.6 7.1 3,315 54,419 9.3 16.8 16.4 .
Teaching I 61,221 1 566.700 1 1,684 45,254 2.8 8.0 7.4 4,946 81,296 8.1 14.3 14.5 Subtotal
UCA 10,574 98,078 305 7,402 2.9 7.5 5.8 1,390 15,830 13.1 16.1 16.5
UCB 10,675 104,250 395 10,294 3.7 9.9 10.9 429 8,919 4.0 8.6 8.0
ucc 10,712 114.403 392 10,915 3.7 9.5 10.7 299 6,999 2.8 6.1 6.1
UCD 9,401 74.396 277 6.847 2.9 9.2 9.3 299 5,723 3.2 7.7 7.3
UCE 4,129 48,540 242 6,820 5.9 14.1 13.6 231 6,953 5.6 14.3 12.9
UCF 6.737 103.239 374 13,381 5.6 13.0 13.5 268 6,660 4.0 6.5 5.7
Urlmn Community 52,22H 542,906 1,9H5 55,659 3.8 10.3 10.5 2,916 51,084 5.6 9.4 9.0
Suhtotul
I MRA
I 1.494 12,814 48 1,335 3.2 10.4 10.6 143 2,007 9.6 15.7 16.1
MRB 2,623 21.732 60 2,054 2.3 9.5 10.6 222 3,757 8.5 17.3 12.0
* Dues nnt include cases which were hospitalized in 1991/92 and have not yet separated by March 31/93.

19
----
I I I Atypical Cases
All Data• Deaths Transfers (excluding deaths)
Hospital Total 1991192 No. or 1991192 % % % Total
No. or 1991192 % Hospital %Days % Wts Number Cases Total Days Cases Days Cases Days
Case Wt Cases Days Cases
MRC 3,139 29,257 126 3,231 4.0 11.0 11.3 225 2,423 7.2 8.3 7.9
MRD 2,836 20,035 45 2,764 1.6 13.8 14.0 81 983 2.9 4.9 4.6
MRE 1,908 16,714 54 1,189 2.8 7.1 9.2 148 2,871 7.8 17.2 10.8
MRF 4,364 32,660 109 2,709 2.5 8.3 8.3 324 2,643 7.4 8.1 7.5
MRG 3,281 15,437 27 292 0.8 1.9 2.1 194 1,200 5.9 7.8 6.6 '
MRH 2,248 18,002 108 2,212 4.8 12.3 14.0 146 1,585 6.5 8.8 8.5
MRl 3,177 24,714 74 2,020 2.3 8.2 9.3 152 2,978 4.8 12.0 8.6
MRJ 4,816 21,626 23 444 0.5 2.1 2.1 233 1,789 4.8 8.3 7.9
Major Rural 29,886 212,991 674 18,250 2.3 8.6 9.0 1,868 22,236 6.3 10.4 8.6 Subtotal
!A 661 6,012 37 588 5.6 9.8 11.8 87 1,253 13.2 20.8 18.5 i
!8 918 8,886 37 976 4.0 11.0 13.1 131 2,209 14.3 24.9 21.4
IC 976 7,905 35 849 3.6 10.7 11.9 66 716 6.8 9.1 9.3
lD 1,098 4,828 4 767 0.4 15.9 13.8 264 1 '101 24.0 22.8 20.7
IE 969 7,204 35 892 3.6 12.4 15.2 92 1,239 9.5 17.2 15.7
IF 998 7,306 40 733 4.0 10.0 10.6 146 1 '135 14.6 15.5 14.4
*Does not include cases which were hospitnlized in 1991/92 and have not yet separated by March 31/93.

20
- -----
I Atypical Cases
All Data• Deaths Transfers (excluding deaths)
Hospital Total 1991/92 No. of 1991/92 % % %Total No. or 1991/92 % Hospital %Days % Wts
Number Cases Total Days Cases Days Cases Days Case Wt
Cases Days Cases
IG 1,395 9,!53 41 899 2.9 9.8 9.0 149 1,375 10.7 15.0 14.0
!H 1,298 11,492 33 2,464 2.5 21.4 21.6 95 893 7.3 7.8 7.5
II 938 8,!75 38 1,045 4.1 12.8 14.6 67 1,396 7.1 17.1 15.2
u 894 6,184 35 927 3.9 15.0 14.0 103 1,170 11.5 18.9 15.6
Intermediate I 10,1451 77,1451 335 10,140 3.3 13.1 13.8 1,200 12,487 ll.8 16.2 14.6 Subtotal
SA 446 3,128 26 411 5.8 13.1 16.3 39 346 8.7 11.1 9.6
SB 215 2,321 8 189 3.7 8.1 9.9 12 189 5.6 8.1 8.5
sc 383 2.909 16 491 4.2 16.9 16.8 48 451 12.5 15.5 13.5
SD 51! 4,919 8 280 1.6 5.7 7.4 15 !51 2.9 3.1 3.3
SE 452 3,707 11 181 2.4 4.9 6.7 68 1,146 !5.0 30.9 23.6
SF 704 3,978 29 351 4.1 8.8 10.3 67 733 9.5 18.4 !5.5
SG 461 4,282 12 191 2.6 4.5 5.9 39 770 8.5 18.0 16.7
SH 406 3,083 10 277 2.5 9.0 9.7 34 468 8.4 15.2 14.6
Sl 339 3,627 16 406 4.7 11.2 11.4 48 685 14.2 18.9 !8.6
*Docs not include cases which were hospitalized in 1991/92 and have not yet separated by March 31/93.

21
I ---·----l
I -
Atypical Cases
All Data• Deaths Transfers (excluding deaths)
Hospital Total 1991/92 No. of 1991/92 % % % Total
No. of 1991192 % Hospital %Days % Wts
Number Cases Total Days Cases Days Cases Days Case Wt
Cases Days Cases .
SJ 214 2,122 4 53 1.9 2.5 3.4 37 1,097 17.3 51.7 45.6 !
SK 273 3,657 19 573 7.0 15.7 17.7 33 498 12.1 13.6 13.1
SL 375 4,327 19 789 5.1 18.2 16.2 54 682 14.4 15.8 14.7
SM 383 2,199 6 28 1.6 1.3 3.0 34 308 8.9 14.0 10.9
SN 462 3,772 27 677 5.8 17.9 !9.1 62 857 13.4 22.7 19.1
so 559 5,990 23 5!5 4.1 8.6 I !.I 88 1,050 !5.7 17.5 18.8
SP 626 5,038 !6 559 2.6 I !.I 12.1 55 740 8.8 14.7 13.4
SQ 935 5,197 18 290 1.9 5.6 6.9 36 272 3.9 5.2 4.8
SR 779 6,85! 28 913 3.6 13.3 14.7 100 1,645 12.8 24.0 21.7
ss !54 2,706 8 429 5.2 !5.9 16.8 24 571 15.6 21.1 20.4
ST 699 6,022 !6 497 2.3 8.3 9.4 53 266 7.6 4.4 4.5
su 275 2,169 II !89 4.0 8.7 10.0 42 268 15.3 12.4 12.6
sv 1,230 6,276 15 !97 1.2 3.1 3.7 91 644 7.4 10.3 9.5
sw 511 3,066 17 317 3.3 10.3 10.1 41 802 8.0 26.2 20.9
sx 674 6,403 32 528 4.7 8.2 9.9 46 420 6.8 6.6 6.3
*Does not include cases which were hospitalized in 1991/92 and have not yet separated by March 31193.

22
I I I Atypical Cases
All Data• Deaths Transfers (excluding deaths)
Hospital Total 1991/92 No. of 1991/92 % % %Total
No. of 1991192 % Hospital %Days % Wts
Number Cases Total Days Cases Days Cases Days Case Wt
Cases Days Cases
SY 335 4,161 8 491 2.4 11.8 14.5 37 700 11.0 16.8 15.8
sz 1,355 8,265 31 575 2.3 7.0 8.4 60 393 4.4 4.8 4.9
SAA 674 3,920 11 430 1.6 11.0 11.5 74 664 11.0 16.9 14.7
SBB 398 3,977 19 226 4.8 5.7 7.7 49 1A21 12.3 35.7 27.4
sec 564 5,443 26 559 4.6 10.3 11.3 43 739 7.6 13.6 12.0
SOD 564 2,987 16 381 2.8 12.8 12.3 66 385 11.7 12.9 10.2
SEE 785 6,075 27 367 3.4 6.0 8.3 56 754 7.1 12.4 12.7
SFF 362 3,392 15 218 4.1 6.4 8.3 42 620 11.6 18.3 17.7
SGG 163 1,857 9 172 5.5 9.3 12.0 11 240 6.7 12.9 10.6
SHH 272 4,907 19 635 7.0 12.9 17.0 32 709 11.8 14.4 15.5
Sl! 256 2,606 8 75 3.1 2.9 3.9 39 904 15.2 34.7 33.0
SJJ 225 2,072 8 169 3.6 8.2 10.6 28 327 12.4 15.8 15.4
SKK 1,074 3,245 13 109 1.2 3.4 3.9 65 250 6.1 7.7 5.2
Small Rural 19,093 150,656 605 13,738 3.2 9.1 10.4 1,768 23,165 9.3 15.4 13.8
Subtotal
MUA 138 1,349 7 94 5.1 7.0 9.4 15 324 10.9 24.0 22.4 -- -- - ...
*Does not include cases which were hospitnlizcd in 1991/92 and have not yet separated by March 31/93.

23
I Atypical Cases
All Darn• Deaths Transfers (excluding deaths)
Hospi!Jll Total 1991/92 No. of 1991/92 % % %To!Jll
No. of 1991/92 % llospi!Jll %Days % Wts
Number Cases Total Dnys Cases Days Cases Days Case Wt
Cases Dnys Cases
MUB 169 1,239 8 115 4.7 9.3 9.1 7 109 4.1 8.8 7.2
MUC 92 1,133 10 236 10.9 20.8 24.5 8 143 8.7 12.6 10.1
MUD 206 3,472 9 482 4.4 13.9 16.9 37 944 18.0 27.2 27.6
MUE 254 !,621 7 68 2.8 4.2 4.8 26 244 10.2 15.1 11.6
MUF 176 1,467 9 191 5.1 !3.0 16.5 5 34 2.8 2.3 2.3
Multi-Use 1,035 10,281 50 1,186 4.8 11.5 13.4 98 1,798 9.5 17.5 16.2 Subtotal
NIA 105 369 I 3 1.0 0.8 0.7 14 100 13.3 27.1 16.3
NIB 209 1,083 2 34 1.0 3.! 4.3 20 612 9.6 56.5 29.9
NIC 236 2,142 3 8 1.3 0.4 0.5 !5 529 6.4 24.7 23.4
NID !57 819 2 3!9 1.3 38.9 19.3 14 21 8.9 2.6 2.9
N!E 747 2,336 12 69 1.6 3.0 3.3 80 254 10.7 !0.9 8.2
Northern Isolated 1,454 6,749 20 433 1.4 6.4 4.3 143 1,516 9.9 22.5 15.3
Subtotal I
I GRAND TOTAL 11175,062 1 1,567,428 1 5,353 144,660 3.1 9.2 9.3 12,939 193,582 7.4 12.4 \_11.9 1
* Does not include cases which were hospitalized in 1991/92 and have not yet separated by March 31/93.

Appendix Table A-4b is a continuation of Table A-4a and gives the numbers and percentages of outlier cases and days for each of the hospitals.
1. Total Cases - as in A -4a
2. 1991/92 Total Days - as in A-4a
3. Number of cases - the number of cases that were categorized as outliers, not including cases that were also categorized as deaths and/or transfers.
4. 1991/92 days - days for cases in column 3.
5. Percent cases - the percentage of all cases that were categorized as outliers (not including those also categorized as deaths and/or transfers).
6. Percent days - days for cases in column 5.
7. Percent Days greater than the Trim- the percent of the outlier days that were beyond the trim point. Differs from column 6 which includes all days for cases categorized as outliers.
8. Percent Total Hospital Case Weights - this represents the percentage of the total hospital case weight that is attributable to outliers.
24

25
Table A-4 b
Atypical Cases by Hospital - Outliers, 1991/92
[I II I Atypical Cases
' All Data• Outliers (excluding deatbs & transfers)
Hospital Total 1991!92 No. of 1991/92 % % %Days > %Total Hospital
Number Cases Total Days Cases Days Cases Days Trim CaseWts
'I
TA
I 25,631 242,197 1.666 79,125 6.5 32.7 20.5 24.3
TB 35,590 324,503 2,201 86,569 6.2 26.7 14.7 21.3
I Teaching
II 61,221 1 566,700 11 3,8671 165,6941 6.31 29.21 17.21 22.5 SubtDtal
UCA 10,574 98,078 657 30,089 6.2 30.7 20.9 22.4 :
UCB 10,675 104,250 641 32,677 6.0 31.3 18.1 26.3
ucc 10,712 114,403 1,039 45,022 9.7 39.4 23.8 34.o 1
UCD 9,401 74,396 453 19,942 4.8 26.8 16.4 "0 6 I - . '
UCE 4,129 48,540 265 13,316 6.4 27.4 15.9 22.8
UCF 6,737 103,239 749 47,485 11.1 46.0 31.4 37.4 I
Urban Community
I 52,2281 542,90611 3,8041 188,531 1 7.31 34,71 21.91 I
I SubtDtal 28.0 i
I ' MRA 1,494 12,814 89 3,457 6.0 27.0 18.6 21.7
MRB 2,623 21,732 220 6,961 8.4 32.0 20.5 27.8 1
*Does not include cases which were hospitalized in 1991/92 nnd have not yet separated by Mnrch 31/93.

26
--
I Atypical Cases I All Data• Outliers (excluding deaths & transfers)
llospitBI TotBI 1991/92 No. of 1991/92 % % %Days> %TotBI Hospital
NumiJ<,r Casei TotBI Days Cases Days Cases Days Trim CaseWts
MRC 3,I39 29,257 223 II ,547 7.I 39.5 25.8 29.5
MRD 2,836 20,035 230 6,398 8.I 31.9 I9.4 29.2
MRE I,908 I6,7I4 I6I 4,880 8.4 29.2 14.0 26.0
MRF 4,364 32,660 237 11,8I4 5.4 36.2 24.5 25.3
MRG 3,281 I5,437 175 2,988 5.3 19.4 10.2 17.7
MRH 2,248 18,002 177 4,580 7.9 25.4 12.5 23.6
MRI 3,177 24,7I4 237 7,522 7.5 30.4 I8.3 25.2
MRJ 4.8I6 21,626 214 2,637 4.4 12.2 5.I Il.2
Major Rural
I 29,HH61 212,991 11 1,963 1 62,7841 6.61 29.51 17.91 23.81 SubtotBI
lA 66I 6,012 46 1,812 7.0 30.I 14.5 26.8
18 918 8,886 64 2.Il7 7.0 23.8 I4.5 21.7
IC 976 7,905 86 2,349 8.8 29.7 16.8 27.7
lD 1,098 4,828 32 335 2.9 6.9 1.9 6.3
IE 969 7,204 43 I,416 4.4 19.7 I2.9 15.2
*Docs not include cases which were hospitalized in 1991/92 and have not yet separated by March 31/93.

27
I I I Atypical Cases
AU Data• Outliers (excluding deaths & transrers)
Hospital Total 1991/92 No. or 1991/92 % % %Days > % Total Hospital
Number Cases Total Days Cases Days Cases Days Trim Case Wts
IF 998 7,306 55 2,003 5.5 27.4 16.5 22.9
IG 1,395 9,153 95 1,759 6.8 !9.2 7.6 17.8
IH 1,298 1!,492 84 3,766 6.5 32.8 20.6 29.5
11 938 8,175 71 2,441 7.6 29.9 17.2 24.7
u 894 6,184 41 1,130 4.6 18.3 8.1 !5.7
Intermediate
I 10,1451 77,14511 6171 19,1281 6.1 I 24.81 13.91 21.7 Subtotal
SA 446 3,128 23 538 5.2 17.2 7.4 !5.0
SB 215 2,321 20 !,Q42 9.3 44.9 35.5 40.4
sc 383 2,909 19 650 5.0 22.3 11.6 !9.1
so 51! 4,919 61 2,321 11.9 47.2 32.3 44.1
SE 452 3,707 29 866 6.4 23.4 12.5 21.1
SF 704 3,978 37 675 5.3 17.0 7.0 14.8
' SG 461 4,282 49 1,446 10.6 33.8 19.5 32.2 I
' SH 406 3,083 30 969 7.4 31.4 18.7 27.0 ~--- - - -
*Does not include cases which were hospitalized in 1991/92 and have not yet separated by March 31/93.

28
~
I I I Atypical Cases
All Data• Outliers (excluding deaths & tramfers)
Hospital Total 1991/92 No. of 1991192 % % %Days > % Total Hospital
Number Cases Total Days Cases Days Cases Days Trim Case Wts
Sl 339 3,627 26 1,293 7.7 35.6 24.4 31.2
SJ 214 2,122 10 287 4.7 13.5 4.2 12.2
SK 273 3,657 28 1,518 10.3 41.5 27.1 41.1
SL 375 4,327 21 1,772 5.6 41.0 32.6 29.5
SM 383 2,199 16 441 4.2 20.1 9.5 16.8
SN 462 3,772 18 791 3.9 21.0 14.2 19.2
so 559 5,990 65 1.993 11.6 33.3 19.5 31.5
SP 626 5,038 41 1,566 6.5 31.1 20.4 28.2
SQ 935 5,197 43 841 4.6 16.2 8.2 15.7
SR 779 6,851 40 1,667 5.1 24.3 15.8 21.9
ss 154 2,706 18 I ,165 11.7 43.1 30.3 39.4
ST 699 6,022 59 3,149 8.4 52.3 32.9 46.1
su 275 2,169 24 735 8.7 33.9 14.8 33.9
SV 1,230 6,276 66 1.051 5.4 16.7 6.3 16.0
sw 511 3,066 20 542 3.9 17.7 9.3 13.7 ------- --
* Docs not include cases which were hospitalized in 1991/92 and have not yet separated by March 31193.

29
- --
I I I Atypical Cases
All Data• Outliers (excluding deaths & transfers)
Hospital Total 1991192 No. of 1991/92 % % %Days> %Total Hospital
Number Cases Total Days Cases Days Cases Days Trim Case Wts
sx 674 6,403 47 2,769 7.0 43.2 29.6 39.9
SY 335 4,161 29 1,757 8.7 42.2 29.9 39.5
sz 1,355 8,265 76 1,684 5.6 20.4 9.4 20.2
SAA 674 3,920 26 558 3.9 14.2 7.1 12.6 !
SBB 398 3,977 23 903 5.8 22.7 13.4 20.3
sec 564 5,443 41 2,310 7.3 42.4 28.1 35.9 I
SDD 564 2,987 19 814 3.4 27.3 16.9 21.6
SEE 785 6,075 48 1,296 6.1 21.3 8.9 19.9
SFF 362 3,392 29 979 8.0 28.9 13.5 24.2
SGG 163 1.857 9 624 5.5 33.6 26.1 33.6 !
SHH 272 4,907 45 2,486 16.5 50.7 37.8 47.8
Sll 256 2,606 19 620 7.4 23.8 13.2 24.8
SJJ 225 2,072 23 784 10.2 37.8 21.1 36.2
SKK 1,074 3,245 14 337 1.3 10.4 5.0 6.8
Small Rural 19,093 150,656 1,211 45,239 6.3 30.0 18.5 26.6
Subtotal
*Does not include cnses which were hospitalized in 1991/92 and have not yet separated by March 31/93.

30
I I I Atypical Cases
All Dalll• Outliers (excluding deaths & transfers)
llospill!l Toll! I 1991/92 No. of 1991/92 % % %Days> %Toll!! Hospillll
Number Cases Toll!! Days Cases Days Cases Days Trim CaseWts
MUA 138 1,349 14 497 10.1 36.8 16.8 28.1
MUB 169 1,239 15 390 8.9 31.5 19.4 25.4
MUC 92 1,133 17 483 18.5 42.6 24.2 41.4
MUD 206 3,472 31 1,231 15.0 35.5 21.1 35.5
MUE 254 1,621 13 582 5.1 35.9 23.6 29.2
MUF 176 1,467 15 323 8.5 22.0 7.6 22.7
Multi-Use 1,035 10,281 105 3,506 10.1 34.1 19.2 31.0
Suhlolnl
NIA 105 369 4 39 3.8 10.6 3.8 7.3
NIB 209 I ,083 I 21 0.5 1.9 0.1 1.5
NJC 236 2,142 24 688 10.2 32.1 18.0 29.8
NID 157 819 5 55 3.2 6.7 1.3 6.4
N1E 747 2,336 14 291 1.9 12.5 5.4 7.9
Northern lsol.uted 1,454 6,749 48 1,094 3.3 16.2 8.2 12.4
Suhlola1
I GRAND TOTAL II 175,062 1 1 ,567,428 11 11,615 1 485,976 1 6.61 31.0 1 18.9 1 24.9
*Ones not include cases which were hospitalized in 1991/92 and have nol yet separated by March 31/93.

Appendix Table A-5 gives the numbers and percentages of non-acute cases and days for each of the hospitals.
1. Cases - total cases, as in column 1 of Table A-4a
2. 1991/92 Days - as in column 2 of Table A-4a
31
3. Number of Cases - number of cases that were categorized as non-acute - reported for the "good coding" hospitals only.
4. 1991/92 Non-Acute Days - days for cases categorized as non-acute using subservice codes for the "good coding" hospitals and using information reported to Manitoba health for the "poor coding" hospitals.
5. Percent Non-Acute Days - the percentage of all days that were categorized as nonacute.
6. Poor Coding Hospital - indicates whether the hospital used specific service and subservice codes to identify non-acute cases and days.
7. Percent Non-Acute Case Weights - this represents the percentage of the total hospital case weight that is attributable to non-acute cases. It captures the whole nonacute case weight. - available only for "good coding" hospitals.
8. Percent Only Non-Acute Day Weights - this represents the percentage of the total hospital case weight that is attributable to non-acute days. It is attached only to the non-acute days, rather than the entire stay for the non-acute case.

32
Table A-5
Atypical Cases - Non-Aeute
All Data• Non-Acute
No. of 1991/92
%Non- Poor %Non- %Only
Hospital Cases 1991192 Cases
Non-Acute Coding Acute Non-Acute
Number Days •• Acute Days Hospital Case Day
Days"'*"' Wts•• Wts"'"'"'
TA 25,631 242,197 1238 70,536 29.1 no 18.19 13.38
TB 35,590 324,503 1603 53,951 16.6 no 11.48 6.52
Teaching 61,221 566,700 I I 124,487 I 22.0 I I I 9.29
Subtotal
UCA 10,574 98,078 1031 35,842 36.5 no 23.09 17.93
UCB 10,675 104,250 123 7,275 7.0 no 7.23 3.04
ucc 10,712 114,403 164 12,975 11.3 no 13.64 5.35
UCD 9,401 74,396 117 10,273 13.8 no 10.44 6.29
UCE 4,129 48,540 213 8,059 16.6 no 15.28 7.42
UCF 6,737 103,239 620 38,412 37.2 no 28.54 19.93
Urban
I I I I I I Community 52,228 542,906 112,836 20.8 9.73
Subtotal
MRA 1,494 12,814 25 1,816 14.2 no 10.81 6.95
MRB 2,623 21,732 182 7,231 33.3 no 23.50 17.29
MRC 3,139 29,257 208 10,527 36.0 no 29.07 18.66
MRD 2,836 20,035 6,670 33.3 yes 17.25
MRE 1,908 16,714 298 6,759 40.4 no 32.07 20.00
MRF 4,364 32,660 297 11,428 35.0 no :>.6.46 17.37
MRG 3,281 15,437 0 0 0.0 no 0.00 0.00
MRH 2,248 18,002 538 3.0 yes !.55
MRI 3,177 24,714 !50 7,154 28.9 no 18.18 15.33
MRI 4,816 21,626 700 3.2 yes 1.54
Mlljor Rural 29,886 212,991 I I 52,823 I 24.8 I I I 12.23
Subtotal
lA 661 6,012 6 331 5.5 no 8.49 2.68
* Does not include cases which were hospit.alized in 1991/92 and have not yet separated by March 31/93. ** Cases only reported for "good coding hospitals". ***These nrc days classified as non-acute either using the subscrvicc codes (good coding hospitals) or non
acute days as reported to Manitoba Health (poor coding hospitals).
I
I
I

33
All Data• Non~ Acute
No, of 1991/92
%Non- Poor %Non- %Only
Hospital Cases
1991192 Cases
Non-Acute Coding
Acute Non-Acute Number Days •• Acute
Dnys Hospital Case Day
Days••• Wts•• Wts•••
lB 918 8,886 IS 1,170 13.2 no 16.83 6.96
IC 976 7,905 690 8.7 yes 4.43
ID 1,098 4,828 1,216 25.2 yes 11.6
IE 969 7,204 23 840 11.7 no 14.65 5.96
IF 998 7,306 15 520 7.1 no 13.15 3.40
IG 1,395 9,153 10 366 4.0 no 5.02 1.88
lH 1,298 11.492 5,819 50.6 yes 24.01
11 938 8,175 15 486 5.9 no 13.53 2.97
ll 894 6,184 15 623 10.1 no 7.41 4.90
Intermediate 10,145 77,145 I I 12,061 I 15.61 I I 7.70
Subtotal
SA 446 3,128 6 138 4.4 no 10.02 2.28
SB 215 2,321 4 364 15.7 no 19.27 9.03
sc 383 2,909 196 6.7 yes 3.26
SD 511 4,919 4 933 19.0 no 17.99 7.87
SE 452 3,707 12 787 21.2 no 14.49 11.58
SF 704 3,978 187 4.7 yes 2.30
SG 461 4,282 13 833 19.5 no 21.57 11.23
SH 406 3,083 689 22.3 yes 11.81
Sl 339 3,627 11 754 20.8 no 20.48 12.18
Sl 214 2,122 695 32.8 yes 20.23
SK 273 3,657 1,069 29.2 yes 16.02
SL 375 4,327 14 2,122 49.0 no 33.52 29.20
SM 383 2,199 2 61 2.8 no 7.11 1.30
SN 462 3,772 886 23.5 yes 13.45
so 559 5,990 15 541 9.0 no 5.44 4.91
SP 626 5,038 7 0 0.0 no 16.45 0.00
SQ 935 5,197 56 1.1 yes .58
* Does not include cases which were hospitalized in 1991/92 and have not yet separated by March 31/93. ** Cases only reported for "good coding hospitals". ***These are days classified as non-acute either using the subservice codes (good coding hospitals) or non
acute days as reported to Manitoba Health (poor coding hospitals).
I

34
All Data• Non~Acute
No. of 1991/92
%Non- Poor %Non- %Only
Hospital Cases
1991/92 Cases
Non~ Acute Coding
Acute Non-Acute Number Days •• Acute
Days Hospital Case Day
Days••• Wts•• Wts•••
SR 779 6,851 982 14.3 yes 8.14
ss 154 2,706 1,142 42.2 yes 24.69
ST 699 6,022 1,449 24.1 yes 12.87
su 275 2,169 96 4.4 yes 2.5
sv 1,230 6,276 2 234 3.7 no 1.89 1.85
sw 511 3,066 412 13.4 yes 5.92
sx 674 6,403 1,576 24.6 yes 13.58
SY 335 4,161 1,351 32.5 yes 18.61
sz 1,355 8,265 461 5.6 yes 3.09
SAA 674 3,920 463 11.8 yes 6.24
SBB 398 3,977 9 946 23.8 no 20.03 13.02
sec 564 5,443 1,:!03 22.1 yes 12.16
SDD 564 2,987 322 10.8 yes 5.16 ---:
SEE 785 6,075 197 3.2 yes 1.79
SFF 362 3,392 6 292 8.6 no 5.61 4.28
SGG 163 1,857 4 386 20.8 no 14.44 12.14
SHH 272 4,907 5 998 20.3 no 12.74 12.64
Sll 256 2,606 1,154 44.3 yes 28.55
SJJ 225 2,072 123 5.9 yes 1.14
SKK 1,074 3,245 0 0.0 yes 0.00
SmaU Rural 19,093 150,656 I I 24,098 I 16
I I I 5.44
Subtotal
MUA 138 1,349 5 133 9.9 no 14.77 4.73
MUB 169 1,239 5 269 21.7 no 17.04 11.88
MUC 92 1,133 7 128 11.3 no 8.85 6.10
MUD 206 3,472 1,390 40.0 yes 27.26
MUE 254 1,621 422 26.0 yes 13.03
MUF 176 1,467 0 0 0.0 no 0.00 0.00
* Does not include cases which were hospitalized in 1991/92 uml havt: not ycl separated by March 31193. :a* Cases only reported for "good coding hospitals". ***These arc days classified as non-acute either using the subscrvic:c codes (good coding hospitals) or non
acute days as reported to Manitoba Hcallh (poor coding hospilnis).
I

35
All Data• Non-Acute
No. of 1991/92
%Non- Poor % Noo- %Only
Hospital Cases
1991/92 Cases
Non-Acute Coding
Acute Non-Acute Number Days •• Acute
Days Hospital Case Day
Days••• Wts•• Wts•••
Multi-Use 1,035 10,281 I I 2,342 I 228 I I I 12.90
Subtotal
NIA 105 369 19 5.1 yes 2.2
NIB 209 1,083 24 605 55.9 no 27.78 27.49
NIC 236 2,142 922 43.0 yes 26.28
NID 157 819 2 319 38.9 no 18.47 18.36
NIE 747 2,336 0 0 0.0 no 0.00 0.00
Northern
I I I I I I Isolated 1,454 6,749 1,865 27.6 12.79 Subtotal
GRAND 175,062 1,567,428 I I 330,512 I 21.1 I I I 9.25
TOTAL
* Does not include cases which were hospitalized in 1991/92 and have not yet separated by March 31/93. ** Cases only reported for "good coding hospitals". ***These are days classified as non-acute either using the subservice codes (good coding hospitals) or non
acute days as reported to Manitoba Health (poor coding hospitals).
I
I I

36
Appendix Table A-6 gives the breakdown of case types (by RDRG class) for each of the hospitals.
1. Total Cases - the total cases not including those hospitalized in 1991/92 but not yet separated by March 31, 1993.
2. Surgical Obstetrics - percentage of cases that were categorized in surgical obstetric RDRGs.
3. Medical Obstetrics -percentage of cases that were categorized in medical obstetric RDRGs.
4. Surgical - percentage of cases categorized in surgical RDRGs.
5. Medical - percentage of cases categorized in medical RDRGs.
6. Other - percentage of cases that were categorized in RDRGs not falling into any of the above categories.

37
Table A-6
Percent Type of Case by Hospital, 1991/92
-----·-··- - -
I I Case Type (in Percent)
Hospital Number Total Cases• Surg Obstetrics Med Obstetrics Surgical Medical Other
I TA
I 25,631 4.3 22.7 26.0 26.8 20.2
TB 35,590 3.7 12.6 31.0 35.4 17.3
I Teaching
II 61,221 I 3.9 I 16.9 I 28.9 I 31.8 I 18.5 Subtotal
UCA 10,574 3.1 11.9 29.0 42.1 13.9
UCB 10,675 2.8 14.4 27.7 36.6 18.6
ucc 10,712 2.1 9.8 44.7 31.9 11.4
UCD 9,401 2.7 17.4 29.9 30.3 19.6
UCE 4,129 0.5 0.2 44.2 54.0 1.1
UCF 6,737 0.3 0.4 41.2 50.5 7.7
Urban Community
I 52,228 I 2.2 I 10.6 I 34.9 I 38.8 I 13.56 Subtotal
MRA 1,494 4.6 10.4 28.5 42.0 14.4
MRB 2,623 1.3 10.9 14.4 61.3 12.1
MRC 3,139 3.4 8.2 17.8 59.4 11.1 ---- -- ------ ---- ------ - ---------------- ------ -- -- ---- - - - ---- L___ --- ------
*Does not include cases which were hospitalized in 1991/92 and have not yet separated by March 31/93.

38
I I Case Type (in Percent) I Hospillll Number Total Cases• Surg Obstetrics Med Obstetrics Surgical Medical Other
MRD 2,836 3.5 10.7 15.1 57.0 13.8
MRE 1,908 3.4 11.3 17.3 51.6 16.4
MRF 4,364 3.1 11.1 13.8 60.0 12.0
MRG 3,281 3.0 14.2 10.8 58.5 13.6
MRH 2,248 1.5 8.9 19.5 60.5 9.7
MRI 3,177 2.3 9.4 6.6 71.4 10.3
MRJ 4,816 3.3 20.6 13.1 44.6 18.4
Major Rural 29,886 2.9 12.2 14.6 56.9 13.3 Subtotal
lA 661 0.0 9.8 10.3 67.5 12.4
IB 918 0.5 3.1 8.0 81.5 7.0
IC 976 2.5 8.2 28.7 50.1 10.6
ID 1,098 1.0 18.8 5.3 59.7 15.2
IE 969 0.1 6.3 1.8 82.0 9.8
IF 998 1.7 5.7 12.0 69.1 11.4
IG 1,395 1.0 6.7 15.5 66.5 10.4
IH 1,298 0.1 5.9 1.0 83.7 9.3
11 938 1.5 5.1 17.5 67.2 8.7 ----- --
*Docs not include cases which were hospitalized in 1991/92 and have not yet separated by March 31193.

39
I I Case Type (in Percent)
Hospital Num~r Total Cases• Surg Obstetrics Med Obstetrics Surgical Medical Other
I 11 II 894 I 1.2 I 8.5 I 11.0 I 70.6 I 8.7
Intermediate Rural I 10,145 I 1.0 I 7.8 I 10.9 I 70.0 I 10.4 Subtotal
SA 446 0.9 10.8 0.2 76.9 11.2
SB 215 0.0 0.0 0.9 93.5 5.6
sc 383 0.0 0.3 0.8 95.3 3.7
SD 511 0.0 1.0 0.6 96.1 2.3
SE 452 0.2 4.0 1.3 85.2 9.3
SF 704 0.9 3.3 10.4 78.1 7.4
SG 461 0.2 2.2 1.1 89.2 7.4
SH 406 0.0 2.0 0.2 91.1 6.7
Sl 339 0.0 1.2 2.7 92.0 4.1
Sl 214 0.0 1.9 0.0 86.9 11.2
SK 273 0.7 6.6 6.2 70.0 16.5
SL 375 0.0 1.6 0.5 92.5 5.3
SM 383 0.0 3.1 0.3 88.8 7.8
SN 462 0.0 3.7 0.0 85.7 10.6
*Does not include cases which were hospitalized in 1991192and have not yet separated by March 31/93.

40
I I Case Type (in Percent)
Hospital Number Total Cases• Surg Obstetrics Med Obstetrics Surgical Medical Other
so 559 0.0 6.1 2.9 76.9 14.1
SP 626 0.0 4.6 1.6 85.8 8.0
SQ 935 0.4 7.5 2.6 78.7 10.8
SR 779 0.5 8.3 3.5 79.2 8.5
ss 154 0.0 0.6 0.6 90.3 8.4
ST 699 0.0 5.3 0.0 81.1 13.6
su 275 0.0 17.1 0.0 66.9 16.0
SV 1,230 0.1 8.1 3.5 81.8 6.5
SW 511 0.4 5.5 3.5 83.6 7.0
sx 674 0.0 0.9 0.3 95.3 3.6
SY 335 0.0 2.7 0.0 91.6 5.7
sz 1,355 0.0 3.8 0.2 89.9 6.1
SAA 674 0.0 3.3 0.0 91.8 4.9
SBB 398 0.0 0.0 0.0 93.5 6.5
sec 564 0.7 2.7 14.0 75.2 7.4
SOD 564 0.0 11.9 0.0 74.6 13.5
SEE 785 1.4 14.5 12.9 55.8 15.4 L -------- ------------ ---------
* Docs not include cases which were hospitalized in 1991/92 and have not yet separated by March 31/93.

41
I I Case Type (in Percent)
Hospital Number Total Cases• Surg Obstetrics Med Obstetrics Surgical Medical Other
SFF 362 0.0 0.6 0.0 94.5 5.0
SGG 163 0.0 5.5 0.0 85.9 8.6
SHH 272 1.1 7.0 4.4 75.4 12.1
Sll 256 0.0 8.2 3.9 77.3 10.5
SJJ 225 0.4 4.4 4.0 80.9 10.2
SKK 1,074 0.0 7.4 0.0 84.0 8.7
Small Rural I 19,093 I 0.2 I 5.3 I 2.5 I 83.5 I 8.5 Subtotal
MUA 138 0.0 0.0 0.7 89.1 !0.1
MUB 169 0.0 1.8 0.0 92.9 5.3 !
MUC 90 0.0 0.0 0.0 95.7 4.3
MUD 206 0.0 4.9 1.5 87.9 5.8
MUE 254 0.0 7.1 0.8 78.7 13.4
MUF 176 0.0 0.6 0.6 98.3 0.6
Multi Use
I 1,035 I 0.0 I 3.1 I 0.7 I 84.1 I 7.1 I Subtotal
NIA 105 0.0 2.9 0.0 89.5 7.6
NIB 209 0.0 4.3 1.0 90.4 4.3 - -
*Does not include cases which were hospitalized in 1991/92 and have not yet separated by March 31/93.

42
I I Case Type (in Percent) I Hospital Number Total Cases• Surg Obstetrics Med Obstetrics Surgical Medical Other
NIC 236 0.8 9.3 2.1 71.2 16.5
NID !57 0.0 3.8 0.0 84.7 11.5
NIE 747 0.0 9.5 0.5 78.6 11.4
Northern Isolated
I 1,454 I 0.1 I 7.6 I 0.8 I 80.5 I 10.9 I Subtotal
I GRAND
II 175,062 I 2.6 I 12.2 I 23.9 I 46.8 I 14.5 I TOTAL
* Docs not include cases which were hospitalized in 1991/92 and have not yet separated by March 31/93.

MANITOBA CENTRE FOR HEALTH POLICY AND EVALUATION
Report List: May 1995 Manitoba Health Care Studies and 17wir Policy Implications, by Evelyn Shapiro (April 1991)
Hospital Funding within the Health Care System: Moving Towards Effectiveness, by Charlyn Black, MD, SeD and Norman Frohlich, PhD (May 1991)
Matemal Demographic Risk Factors and the Incidence of Low Birthweight, Manitoba 1979-1989, by Cam Mustard, SeD (November 1991)
An Assessmem of How E.fficiemly Manitoba's Major Hospitals Discharge Their Patients, by Marni Brownell, PhD and Noralou Roos, PhD (October 1992)
111e Utilization of Prenatal Care and Relationship to Bir1hweigh1 Owcome in Winnipeg, 1987-88, by Cam Mustard, SeD (January 1993)
Utilization qf Personal Care Home Resources, Volumes I and Jl, 1991192, by Carolyn DeCoster, RN, MBA, Noralou Roos, PhD and Bogdan Bogdanovic, B Comm, BA (October 1993)
Assessing Quality of Care in Manitoba Personal Care Homes by Using Administrative Data to Monitor Outcomes, by Evelyn Shapiro, MA and Robert B. Tate, MSc (November 1993)
Utilization of Hospital Resources, Volumes I and ll, 1991/92, by Charlyn Black, MD, SeD, Noralou Roos, PhD and Charles Burchill, BSc, MSc (December 1993)
Population Health: Health Status Indicators, 1991/92, Volumes I and II, by Marsha Cohen, MD, FRCPC and Leonard MacWilliam, MSc, MNRM (January 1994)
Socio-Economic Characteristics, 1991/92 (1986 Census Version) by Norman Frohlich, PhD and Cam Mustard, SeD (January 1994)
Estimating Per Diem Costs for Manitoba Hospitals: A First Step, by Ronald Wall, MASc, MBA, PEng, Carolyn DeCoster, RN, MBA and Noralou Roos PhD (February 1994)
Utilization of Physician Resources, Volumes I and Jl, 1991/92, by Douglas Tataryn, PhD, Noralou Roos, PhD and Charlyn Black, MD, SeD (March 1994)
Redirecting Care from Winnipeg Hospitals to Ten Large Rural Facilities: Estimated Number of Cases, Feasibility and Implications, by Charlyn Black, MD, SeD and Charles A. Burchill, BSc, MSc (June 1994)

Monitoring the Winnipeg Hospital System: The First Repon, 1990-1992, by Noralou P. Roos, PhD and Evelyn Shapiro, MA (July 1994)
A Report on the Health Status, Socio-Economic Risk and Health Care Use of the Manitoba Population1992/93 and Oven1iew of the 1990191 to 1992/93 Findings, by Norman Frohlich, Trevor Markesteyn, Noralou Roos, K.C. Carriere, Charlyn Black, Carolyn DeCoster, Charles Burchill and Leonard MacWilliam (November 1994)
Hospital Case Mix Costing Project, 1991/92, by Marian Shanahan, RN, MA, Michael Loyd, MA, Noralou P. Roos, PhD and Marni Brownell, PhD (December 1994)
For copies of these reports, please call or write:
Manitoba Centre for Health Policy and Evaluation Department of Community Health Sciences, University of Manitoba Tl54-770 Bannatyne Avenue Winnipeg, Manitoba, Canada, R3E OW3 Tel: 204-789-3805 Fax: 204-774-4290