® fss update rosa fulton executive director, fss mtac may 20, 2010
TRANSCRIPT

®
FSS UpdateFSS Update
Rosa Fulton
Executive Director, FSS
MTAC
May 20, 2010

2FSS Update
Flat Volume Update
Respond to Industry Questions
● Program Status
FSS Redirection – Phase 1B
Agenda

3FSS Update
20
25
30
35
40
45
50
55
60
2001 2002 2003 2004 2005 2006 2007 2008 2009Vol (Bil) 58.2 57.8 51.7 52.4 53.9 53.8 52.4 45.9 39.6
Flat Volume Trend – 2001 Through 2009Flat Volume Trend – 2001 Through 2009RPW
Flat volume decline FY 2009 -13.8%Flat volume decline FY 2009 -13.8%
FY 2005 – FY 2009Flat volume decline 26%
14.3 billion fewer flats annually
FY 2005 – FY 2009Flat volume decline 26%
14.3 billion fewer flats annually

4FSS Update
First Class Periodicals Standard Total Flats
2009 787,424 2,096,118 9,129,878 12,013,420
2010 663,624 1,863,566 7,697,093 10,224,284
0
2,000,000
4,000,000
6,000,000
8,000,000
10,000,000
12,000,000
14,000,000
Pie
ces
(000
)
Class
FY 2010 YTD Flat Volume Compared SPLYQuarter 1 (Oct - December)
-15.7%
-15.7%
-11.1%
-14.9%
Flat Volume Trend – QTR 1, FY 2010Flat Volume Trend – QTR 1, FY 2010RPW
QTR 1, 2010Flat volume decline -14.9%
QTR 1, 2010Flat volume decline -14.9%

5FSS Update
First Class Periodicals Standard Total Flats
2009 1,529,852 4,056,619 15,768,163 21,354,634
2010 1,313,878 3,679,314 14,066,470 19,059,662
0
5,000,000
10,000,000
15,000,000
20,000,000
25,000,000
Volu
me
-Pie
ces (
000)
Class
Flat Volume Comparison - FY 2010 YTD vs. SPLYOctober - March
-14.1%
-9.3%
-10.8%
-10.7%
Flat Volume Trend – FY 2010 YTDFlat Volume Trend – FY 2010 YTDRPW
FY 2010 YTDFlat volume decline -10.7%
FY 2010 YTDFlat volume decline -10.7%

6FSS Update
First Class Periodicals Standard Total Flats
Series1 259,455 681,395 2,382,083 3,322,933
Series2 241,666 659,409 2,368,746 3,269,821
0
500,000
1,000,000
1,500,000
2,000,000
2,500,000
3,000,000
3,500,000
Volu
me
-Pie
ces (
000)
Class
Flat Volume ComparisonMarch 2010 Compared to March 2009
-6.9%
-3.2%
-0.6%
-1.6%
Flat Volume March 2010 Compared to SPLYFlat Volume March 2010 Compared to SPLYRPW

7FSS Update
FSS QuestionsFSS Questions
1. What exactly is happening with the machines?
Program Status
Redirection – Revised Deployment

8FSS Update
Sequencing Operations Dulles – 4 FSS
Columbus – 2 FSS
Kansas City – 2 FSS
Phoenix – 3 FSS
South Florida – 1 FSS
FSS OperationsFSS Operations
FSS Site# FSSOn-line
# Delivery Units
On-line
# ZonesOn-line
Dulles P&DC 4 49 85
Columbus FSS Annex 2 24 30
Kansas City P&DC 2 18 44
Phoenix L&DC 3 11 37
South Florida 1 5 15
Totals 12 107 211
9FSS Update
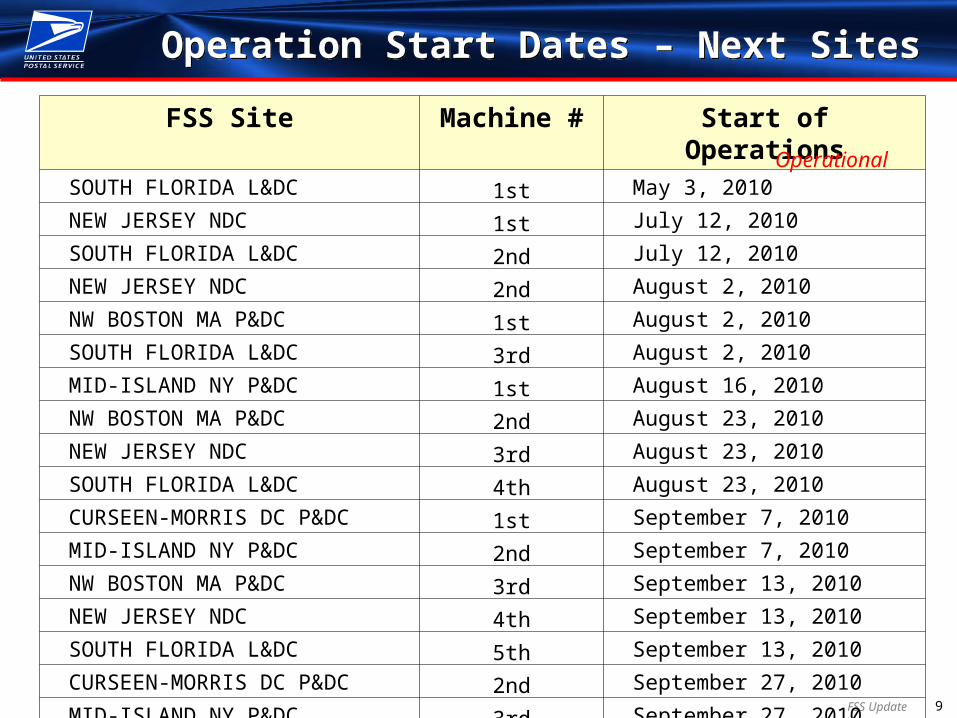
FSS Site Machine # Start of Operations
SOUTH FLORIDA L&DC 1st May 3, 2010
NEW JERSEY NDC 1st July 12, 2010
SOUTH FLORIDA L&DC 2nd July 12, 2010
NEW JERSEY NDC 2nd August 2, 2010
NW BOSTON MA P&DC 1st August 2, 2010
SOUTH FLORIDA L&DC 3rd August 2, 2010
MID-ISLAND NY P&DC 1st August 16, 2010
NW BOSTON MA P&DC 2nd August 23, 2010
NEW JERSEY NDC 3rd August 23, 2010
SOUTH FLORIDA L&DC 4th August 23, 2010
CURSEEN-MORRIS DC P&DC 1st September 7, 2010
MID-ISLAND NY P&DC 2nd September 7, 2010
NW BOSTON MA P&DC 3rd September 13, 2010
NEW JERSEY NDC 4th September 13, 2010
SOUTH FLORIDA L&DC 5th September 13, 2010
CURSEEN-MORRIS DC P&DC 2nd September 27, 2010
MID-ISLAND NY P&DC 3rd September 27, 2010
Operation Start Dates – Next SitesOperation Start Dates – Next Sites
Operational

10FSS Update
Installation & Operations ProgressionInstallation & Operations Progression
October 2010 – 29 FSS operational in 9 locations
April 2011 – all machines installed
June 2011 – all machines operational

11FSS Update
FSS Redirection – New Deployment PlanFSS Redirection – New Deployment Plan
Original deployment plan 100 FSS in 32 sites
Phase 1A - 19 FSS identified for redirection
Deploy fewer FSS in 10 sites
Phase 1B – 5 FSS identified for redirection
Deploy fewer FSS in 5 sites
May 2010 – 47 FSS sites

12FSS Update
Phase 1B Recommended RedirectionsPhase 1B Recommended Redirections
5 additional FSS machines planned for redirection
New FSS sites # FSS
Brooklyn NY P&DC 1
San Francisco P&DC 1
Dallas P&DC 1
Pittsburgh PA L&DC 1
Cleveland OH FSS Annex 1
Total 5
Sites receiving fewer FSS # FSS
Indianapolis IN 1
Denver CO 1
Middlesex-Essex MA 1
Providence RI 1
Sacramento CA 1
Total 5
Total of 47 FSS locations

13FSS Update
FSS QuestionsFSS Questions
2. What is the current ROI and has it affected the old DAR thus they cannot reorder more machines or have other impacts besides money issues?
● Declining volume does impact the savings potential Program expectation of 280,500 pieces per day
● Increasing the number of runs decreases number of pieces that can be processed daily
Lower throughput at lower run volumes / fixed changeover times - closer to 255,000 pieces per day
● Phase 1 technology designed for larger volumes● Technology solutions to gain back efficiencies are in
review● Achieving savings today beyond sequencing flats—
capturing space & redeploying vehicles ● Limited capital funds available for new technology

14FSS Update
FSS QuestionsFSS Questions
3. Is there money allocated for future machines? If so, what does Phase II deployment look like in terms of facilities to be placed at (type of facility in terms of volume) and timeline?
● Phase 1 FSS satisfies only 1/4 1/3 of national flats sequencing opportunity
● Additional savings opportunity exists for expanding beyond Phase 1
● Delivery point sequencing (100%) is a fundamental strategy of the “Delivery of the Future” vision
● Maximum effectiveness / efficiency achieved when sequencing process housed in same facility as upstream bundle and flats sorting operations

15FSS Update
FSS QuestionsFSS Questions
4. What is the future strategy of the USPS in terms of FLAT mail overall, which includes all FLAT machines and deployments?
● Optimize savings potential for Phase 1● Extend flats sequencing beyond Phase 1● Bypass bundle distribution● Automate flat mail preparation● Create critical mass● Improve utilization & efficiencies of AFSM 100s

16FSS Update
FSS Redirection – New Deployment PlanFSS Redirection – New Deployment Plan
Site # Area FSS Location - 47 Sites # FSS Site # Area FSS Location - 47 Sites # FSS
1 CM CHARLOTTE NC L & DC 1 25 NE NW BOSTON MA P&DC 32 CM CURSEEN-MORRIS DC P&DC 2 26 NE PROVIDENCE RI P&DC 23 CM DULLES VA P&DC 4 27 NE SPRINGFIELD MA NDC 44 CM GREENSBORO NC P&DC 1 28 NE STAMFORD CT P&DC 15 CM LINTHICUM MD IMF 1 29 NE WESTCHESTER NY P&DC 16 CM RALEIGH NC P&DC 1 30 PA ANAHEIM CA P&DF 27 CM RICHMOND VA P&DC 3 31 PA HERB PECK ANNEX (LOS ANGELES) 28 EA CLEVELAND FSS ANNEX (new site) 1 32 PA MORENO VALLEY CA DDC 29 EA COLUMBUS OH FSS ANNEX 2 33 PA SACRAMENTO CA P&DC 110 EA PHILADELPHIA PA NDC 1 34 PA SAN DIEGO MLS CA P&DC 211 EA PHILADELPHIA PA P&DC 2 35 PA SAN FRANCISCO CA P&DC (new site) 112 EA PITTSBURGH PA L&DC (new site) 1 36 PA SAN JOSE CA P&DC 413 EA ROCHESTER NY L&DC 2 37 PA VAN NUYS CA FSS ANNEX 314 EA TRENTON NJ P&DC 3 38 SE ATLANTA GA L&DC 215 GL CAROL STREAM IL P&DC 1 39 SE NORTH METRO GA P&DC 216 GL FOX VALLEY IL P&DC 2 40 SE ORLANDO FL L&DC 217 GL INDIANAPOLIS IN MPA 1 41 SE SOUTH FLORIDA L&DC 518 GL PALATINE IL P&DC 4 42 SW DALLAS TX P&DC (new site) 119 GL SE MI METROPLEX P&DC 2 43 SW NORTH HOUSTON TX P&DC 120 GL SOUTH SUBURBAN IL P&DC 2 44 WE DENVER CO P&DC 321 NE BROOKLYN NY P&DC (new site) 1 45 WE KANSAS CITY MO P&DC 222 NE MIDDLESEX-ESSEX MA P&DC 3 46 WE ST PAUL / EAGAN MN P&DC 223 NE MID-ISLAND NY P&DC 4 47 WE WEST VALLEY (PHOENIX) AZ L&DC 3
24 NE NEW JERSEY NDC 4

17FSS Update
FSS Deployment – 100 FSS, 47 FSS SitesFSS Deployment – 100 FSS, 47 FSS Sites
Van Nuys, 3Los Angeles, 2Moreno Valley, 2Anaheim, 2San Diego, 2
Miami, 5
Sacramento, 1
San Jose, 4
Phoenix, 3
Denver, 3
Orlando, 2
Houston, 1
MinnSt Paul, 2
Greensboro, 1Raleigh, 1
Charlotte, 1
SE Mich, 2
Atlanta, 2North Metro, 2
Palatine, 4Fox Valley, 2Carol Stream, 1South Suburban, 2
Indy, 1
Columbus, 2
Kansas City2
Linthicum MD, 1Dulles VA, 4Washington DC, 2
Philadelphia & NDC, 3
Providence, 2
Newark NJ, 4 Trenton NJ , 3
NW Boston, 3Middlesex, 3Springfield, 4
Richmond, 3
Rochester, 2
Brooklyn , 1Mid Island, 4Westchester, 1
Stamford, 1
Dallas, 1
SanFrancisco, 1
Pittsburgh, 1Cleveland, 1

18FSS Update
Conclusion