-.. florida coastal …ufdcimages.uflib.ufl.edu/uf/00/09/92/83/00002/flcoastsed...florida coastal...
TRANSCRIPT

.- "I'> i).,' J ..yt.. ~
/1
."-..
FLORIDA COASTAL SEDIMENT CONTAMINANTSATLAS
TECHNICAL VOLUME
JlUCVMEmDlPOStt'OIY
APR 1fl 2001FIIidI sa. UIMIIity utery
TaIIatIS!lIliBe, Florida
Florida Department of Environmental Protection3900 Commonwealth Boulevard
Mall Station 46Tallahassee, Florida 32399-3000
1994

INTRODUCTION
ThiS technical volume supplements the Florida Coastal sediment Contaminants Atlas byprovIding additional Information on chemical data and Interpretive methods presented Inthe Atlas.
The majority of Information In the Atlas Is based on nearly ten years of work by the FloridaDepartment Of Environmental Protection (FDEP), through the Coastal ContaminantsSurvey. This work was undertaken to remedy a critical gap In the state's ability to Identifyand Interpret contaminants In coastal areas. The coastal contaminants survey Includeschemical Information on approximately 700 sltes/ocated throughout the state, In a varietyof pristine to Impacted coastal areas. The survey sampling dates and areas are listed InSection One.
Section Two of thIs volume explains sample collection procedures, chemical analysis, andInterpretation of sediment trace metal and organic contaminant data. Laboratory andfield measurements In the FDEP database are summarized In Section Three. Sections Fourand Five discuss metals and organic contaminants and their possible sources.
Further Information regarding specific analytical methods and the statistical rationalebehind the metal-to-alumlnum normalization method can be found In the following FDEPdocuments: Deepwater Ports MaIntenance Dredging and DIsposal Manual (1984), andA Guide to the InterpretatIon of Metal ConcentratIons In Estuarine SedIments (1988),

TABLE OF CONTENTS
INTRODUCTION . . . . . . . . . . . . . . . . . . . . . . . . . . . . . . . . . . . . . . . . . . . .
TABLE OF CONTENTS III
SECTION 1.
1.01.1
SECTION 2.
2.0
2.2
2.32.4
SECTION 3.3.03.13.2
SECTION 4.
SECTION 5.
FLORIDA DEPARTMENT OF ENVIRONMENTAL PROTECTION COASTALSEDIMENT SAMPUNG PROJECTSIntroduction. . . . . . . . . . . . . . . . . . . . . . . . . . . . . . . . . . . . . . 1Selected Sediment Chemistry Research Projects . . . . . . . . . . . . . . . . 2
FLORIDA DEPARTMENT OF ENVIRONMENTAL PROTECTION SAMPLECOLLECTION, LABORATORY ANALYSIS, AND DATA INTERPRETATIONIntroduction. . . . . . . . . . . . . . . . . . . . . . . . . . . . . . . . . . . . . . 42.1 FDEP Sample Collection Methods. . . . . . . . . . . . . . . . . . . . . 42.1.1 Background................................. 42.1.2 Rationale for sampling design . . . . . . . . . . . . . . . . . . . . . . . 42.1.3 Field Methods . . . . . . . . . . . . . . . . . . . . . . . . . . . . . . . . 5
2.1.3.1 Current Procedures 6Laboratory Analysis of Sediment Samples . . . . . . . . . . . . . . . . . . . . 62.2.1 Metals analyses . . . . . . . . . . . . . . . . . . . . . . . . . . . . . . . 62.2.2 Organics analyses. . . . . . . . . . . . . . . . . . . . . . . . . . . . . . 7Sediment Trace Metal Data Interpretation. . . . . . . . . . . . . . . . . . . . 7Interpretation of Sediment Toxic Organic Contaminant Data 10
SEDIMENT AND WATER COLUMN MEASUREMENTS IN THE FDEP DATABASEIntroduction. . . . . . . . . . . . . . . . . . . . . . . . . . . . . . . . . . . . . 11Metals and Nutrients. . . . . . . . . . . . . . . . . . . . . . . . . . . . . . . . 11Organic Compounds . . . . . . . . . . . . . . . . . . . . . . . . . . . . . . . 123.2.1 Chlorinated Pesticides 123.2.2 Polynuclear Aromatic Hydrocarbons. . . . . . . . . . . . . . . . . . 123.2.3 Polychlorinated Biphenyl Compounds 123.2.4 Phenolic Compounds. . . . . . . . . . . . . . . . . . . . . . . . . . . 123.2.5 Aliphatic Petroleum Hydrocarbons . . . . . . . . . . . . . . . . . . . 12
SOURCES AND USES OF METALS AND SEMI-METALS EXAMINED IN THE ATLAS. 14
SOURCES AND USES OF TOXIC ORGANIC COMPOUND CLASSES EXAMINEDIN THE ATLAS 16
REFERENCES. . . . . . . . . . . . . . . . . . . . . . . . . . . . . . . . . . . . . . . . . . . . . 18
Ii

LIST OF FIGURES
Figure 1 .
Graphical example of the covariance between aluminum and leadconcentrations In the FlorIda "clean" coastal sediment database.
....... 9
Figure 2 9
Graphical example of the covariance between aluminum and lead with the 95%prediction limits Included. An example of the metal enrichment factorcalculatlon Is shown.
LIST OF TABLES
Table 1 11
Umlts of detection for metals and nutrients analyzed by different laboratorIes.
Table 2 .
Organic Compounds In major categories.
iii
. 13

SECTION 1. FLORIDA DEPARTMENT OF ENVIRONMENTAL PROTECTION COASTAL SEDIMENTSAMPLING PROJECTS.
1.0 Introduction
The Atlas Includes data from many surveys conducted to address a variety of objectives.The followIng list depicts major projects. areas. and year(s) that sediment samples werecollected.
prolect/Area
Deep Water ports prolect
Port of Jacksonville/St. Johns RiverPort CanaveralPort Ft. PiercePort of Palm BeachPort of MiamI/Miami River/Biscayne BayPort ManateePort of St. PetersburgPort of TampaPort St. JoePort of Panama CityPort of Pensacola
StatewIde Survey of Clean ReferenceSites to Establish Metals EDdchmentInterpretive Tool
Estuarine Surveys
Biscayne BayHillsborough BayPensacola BayLower St. Johns RiverCharlotte HarborLake WorthPerdido RIver and Perdido BayWest Central Florida
1
1983 - 1984
1986 - 1991
1985. 19891985. 198919851988198919891988 - 19911991
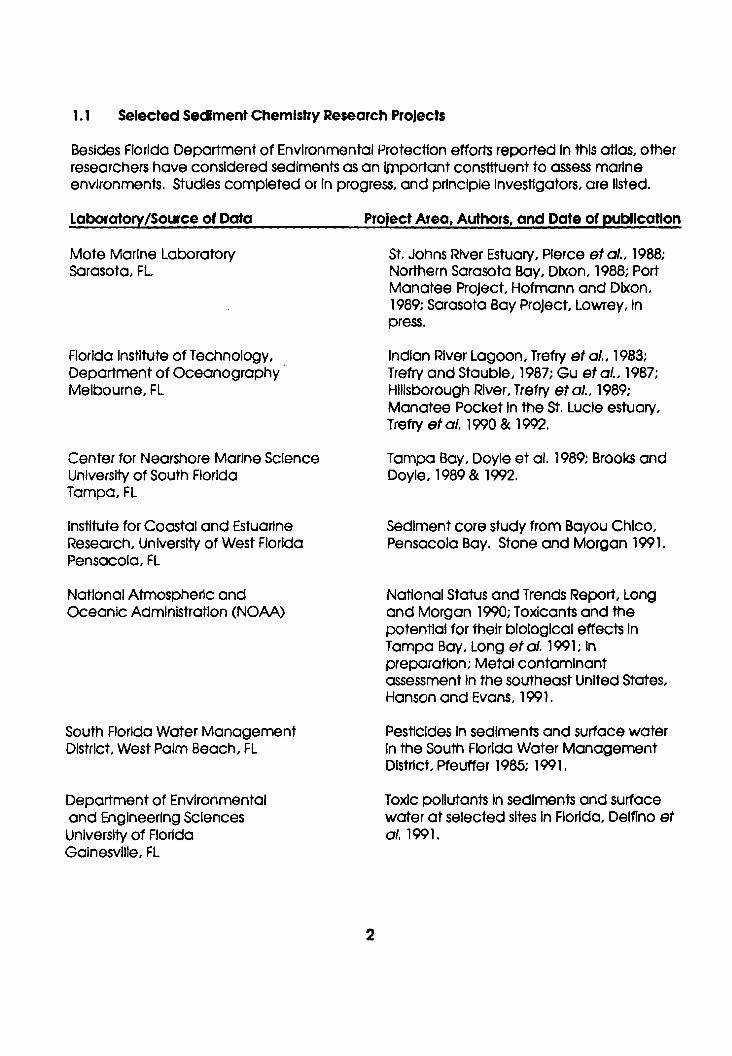
1.1 Selected Sediment Chemistry Research Projects
Besides Florida Department of Environmental Protection efforts reported In this atlas, otherresearchers have considered sediments as an Important constituent to assess marineenvironments. Studies completed or In progress, and principle Investigators, are listed.
Laboratory/Source of Data
Mote Marine LaboratorySarasota, FL.
Florida Institute ofTechnology,Department of Oceanography·Melbourne, FL
Center for Nearshore Marine ScienceUniversity of South FloridaTampa, FL
Institute for Coastal and EstuarineResearch, University of West FloridaPensacola, FL
National Atmospheric andOceanic Administration (NOAA)
South Florida Water ManagementDistrict, West Palm Beach, FL
Department of Environmentaland Engineering SciencesUniversity of FloridaGainesville, FL
Project Area, Authors, and Date of publication
St. Johns River Estuary, Pierce st of., 1988;Northern Sarasota Bay, Dixon, 1988; PortManatee Project, Hofmann and Dixon,1989; Sarasota Bay Project, Lowrey, Inpress.
Indian River Lagoon, Trefry et of., 1983;Trefry and Stauble, 1987; Gu et of., 1987;Hillsborough River, Trefry et 01., 1989;Manatee Pocket In the St. Lucie estuary,Trefry st 01. 1990 & 1992.
Tampa Bay, Doyle et 01. 1989; Brooks andDoyle, 1989 & 1992.
Sediment core study from Bayou Chico,Pensacola Bay. Stone and Morgan 1991.
National Status and Trends Report, Longand Morgan 1990; Toxicants and thepotential for their biological effects InTampa Bay, Long etal. 1991; Inpreparation; Metal contaminantassessment In the southeast United States,Hanson and Evans, 1991.
Pesticides In sediments and surface waterIn the South Florida Water ManagementDistrict, Pfeuffer 1985; 1991.
Toxic pollutants In sediments and surfacewater at selected sites In Florida, Delfino et01. 1991.
2

United States Fish and Wildlife Service
Collier CountyPollutlon Control Department
Florida Department of EnvIronmentalProtection, Tallahassee, FL
3
Sediment studies In St. Andrew and St.Joseph Bay Systems, Brim et 01 (Inpreparation); Perdido Bay sediment study,1993; Contaminants In the Crystal Riverestuary, Facemire 1991.
Estuarine and freshwater sediment studies,Grabe, 19910 & 1991b; Blshof, 1991.
Sediment trace metals documents,Sch"ropp and Windom, 1988; Schropp et01" 1990; Windom et 01. 1989; Perdido Baystudy, Schropp et 01. 1991; LaboratoryInter-comparison study, Schropp, 1992;Metal contamination assessment, Seal et01.1993.

SECTION 2. FLORIDA DEPARTMENT OF ENVIRONMENTAL PROTECTION SAMPLECOLLECTION, LABORATORY ANALYSIS, AND DATA INTERPRETATION.
2.0 Introduction
This section explains sample collection, chemical analysis, and Interpretation of sedimenttrace metal and organic contaminant data. More Information, Including the statisticalrationale behind the metal-te-alumlnum normalization method, can be found In the FDEP1988 document A Guide to the Interpretation ofMetal Concentrations In EstuarineSediments (Schropp and Windom 1988).
2.1 FDEP Sample Collection Methods
2.1.1 Background
Most contaminants discharged Into coastal waters via municipal and Industrial dischargesand runoff rapidly attaches to particulate matter and become Incorporated In bottomsediments. Although this pathway has been known for many years, only recently has thethreat of contaminated sediments to marine resources and human health receivedwidespread public attention.
Good quality sediments are critical to ecosystem health for several reasons. Sedimentsare reservoirs for contaminants, and the accumulation of pollutants occurs even thoughthe overlying water column otten contains only traces of contaminants. sedimentsIntegrate metals and organic compounds over time from dIscharges, and can act aslong-term sources of contaminants and nutrients Into the system otter the original pollutantdischarges have ceased. Ultimately, sedIment contamination can affect the health ofbottom-dwelling organisms by direct contact and Ingestion, and through their effects onbenthic animals, contaminants can be transferred elsewhere In the food web.
2.1.2 Rationale for sampling design
Sediment sampling sites were selected In coastal systems to test for contamination from avariety of sources. Most sites were located near point or nonpolnt discharges, which wereconsIdered potentially Impacted areas. This bias In the sampling design was deliberate toenable FDEP to gain an Initial understanding of the severity and extent of contamination.This approach does not provide a statistically valid estimate of the aerial extent ofcontamination. Additionally, a number of sampling sites (clean reference sites) wereselected In areas removed trom potential pollution sources to develop an approach fordistinguishIng natural from anthropogenlcally enriched sediments.
Prior to field sampling, station locations were Identified atter study of local drainagefeatures, land uses, water depth, potential depositional areas, navigation charts and,typically, meetings with local government staff. Station selection fell Into two categories:areas where a clean reference site might be best located, or areas where contamination
4

was suspected. Selected stations were plotted on navigation charts, and latitude andlongitude calculated for each station.
2. 1.3 Field Methods
In the field, stations were located using LORAN-C by latitude and longitude, compassbearings and cross referenced to navigation charts. LORAN-C was compensated toknown local reference points on most the recent edition of navigation charts.
Upon arrival at the station, the boat was anchored and engines shut off. The location,time, date, weather conditions, and compass bearings were recorded In a station lognotebook. Water column physical parameters were taken at the surface, mid-depth andbottom using a calibrated YSI modelS? Dissolved oxygen meter, and YSI model 59Salinity, Conductivity and Temperature meter. These measurements were recorded In thestation log notebook. Written descriptions of the sediment sample characteristics werealso recorded.
Sediments were collected from the boat, using a stainless 9X9" PONAR grab. The grabwas suspended from a holst mounted on the port side of the boat. The grab was acidwashed and rinsed with deionized water before use, and thoroughly rinsed with ambientwater between grabs. A 10% HCI solution (prepared In the DEP Biology Lab) was used toacid rinse all utensils, the sampling device, and spatulas used to transfer samples Intosampling Jars.
Once the sampler was retrieved, It was swung aboard, and the sampler carefully emptiedInto a clean, acid washed and rinsed tUb. The top two centimeters of sediment werescooped from the top of the grab. Repeated grabs were made at the same site, whilethe boat was at anchor, until enough material was collected for all analyses.
Samples were transferred to glass Jars supplied by the laboratory, or purchased (I-chem#220 - 0250, or whlrl-paks™) which have been precleaned by the manufacturer to meetEPA specifications for organic and Inorganic materials. Sample containers were labeledwith pertinent Information, Including time, station number and date. When filled with thesample, containers were Immediately placed on Ice. The time of collection, samplenumber, replicate number and location were recorded on field log sheets, and on chainof custody sheets for shipment to the lab.
Samples were sometimes collected by using sediment coring tubes. this option wasreserved for waters too shallow to allow entry by the boat, or when sensitive habitats (I.e.,grass beds, corals) precluded use of a large bottom sampling device. Three acid washedand rinsed clear cellulose-acetate-butyrate core tubes, 2" diameter x 12" long, with capswere used for each replicate. Three replicates were collected for each station.
Core tubes were plunged Into the sediment, and the top capped. The core tube wasretrieved by carefully displacing the sediment around the core to place the bottom capon the core tube, and lifted from the sediment. These cores were taken by the diver to
5

the boat, where they were transferred Into containers using an acid washed and rinsedextruding tool. The top 3-5 centimeters of the cores were placed In the collecting Jar orwhlrlpak, and the remainder discarded. Each replicate sample was a composite of thethree cores. Logging and chain of custody procedures were the same as describedabove.
2. 1.3. 1. Current Procedures
Since 1991, several changes have been made to the FDEP standard field protocol thatmay be of Interest to those conducting field operations. Stations are now located using aGlobal Positioning System (GPS) In addition to traditional methods. A 12"X12" Kynarcoated stainless steel "Young" grab Is used to collect sediment, and Is deployed In a similarfashion as the PONAR. In addition to acid washing, full strength acetone Is used to rinse allgear prior to sampling and between all stations. This volatilizes any organic contaminantsthat might be resident on the sampler. The top two centimeters of sediment are scoopedfrom the top of the sampler with an acetone rinsed sterile scoop. The sediment Is thentransferred to a stainless container, and homogenized using an acid washed, acetonerinsed, long handled stainless scoop. All other procedures remain as stated above.
2.2 Laboratory Analysis of Sediment Samples
From 1982 to 1990, all samples were analyzed by Savannah Laboratories andEnvironmental SeNlces, Inc. In Savannah, Georgia. From 1990 to 1991, the SkldawayInstitute of Oceanography In Savannah, Georgia analyzed sediments. Analyses done byboth laboratories can be found In Section Three.
2.2.1 Metals analyses
All metals, except mercury, were analyzed by Savannah Laboratories and EnvIronmentalSeNlces, Inc (SLES) using graphite-furnace or flame atomic absorption spectrometry aftertotal digestion (dissolution) of the sediment with hydrofluoric (HF), nitric (HNO~, andperchlorlc (HCIOJ acids. Mercury was analyzed by the cold vapor atomic absorptiontechnIque after a milder dIgestion.
From 1990 to 1991, the Skidaway Institute of Oceanography In Savannah, Georgiaanalyzed metals by ICP (Inductively-coupled plasma) mass spectrometry or by atomicabsorption spectrometry after performing the HF-HN03-HCI04 acid digestion sequence.Mercury was analyzed by a method that combines the principle of Isotope dilution withICP mass spectrometry (Windom and Smith 1992). Strict laboratory proceduresconcerning both accuracy and precision were followed by both the SLES facility andSkldaway Institute of Oceanography. A National Institute of Standards and Technologyestuarine sediment standard (NIST SRM 1646) was employed as a quality control check byboth SLES and Skldaway laboratories.
Total digestion of the sediment sample Is necessary to employ the normalization method(discussed In section 2.3) to estimate metal contamination. Total digestion Is also strongly
6

encouraged to produce comparable data In trend monitoring of contaminants. Use ofhydrofluoric acid ensures dissolution of silicate minerals In the sediment, some of whichmay contain trace metals. Liberation of trace metals bound to organic moleculesrequires a strong oxidizing dissolution stage, which Is accomplished through use of highquality nitric, perchlorlc and hydrochloric acid (FDEP, Deepwater Ports MaintenanceDredging and Disposal Manual, 1994) or aqua regia, a mixture of HN03 and Hel acid(NOAA method by Hanson and Evans 1991). Other acid digestion techniques, commonlyreferred to as "weak" or "preferential" digestion, employ various dissolution times,temperatures, and types of acidic solutIons to dissolve sediments. The FDEP discouragesuse of techniques other than total digestion for general enVironmental monitoring whencomparing data sets.
The FDEP conducted a laboratory Intercalibration exercise that Illustrated the variability Ofsediment data from different analytical laboratories (Schropp 1992). Four laboratoriesparticipated In the exercise, which assessed accuracy and precision of reported metalsdata from coastal sediments and sediment reference materials (standards). Thelaboratories represent facilities that typically report environmental data to state, regional,and local agencies. Results of the exercise showed that sediment trace metal data fromdifferent laboratories may not be comparable If different sample digestion techniques areused. This conclusion of the FDEP study Is supported by the results of an InternationalIntercalibration exercise for trace metals analysis In marine sediments (Loring and Rantala1988).
2.2.2. Organics analyses
Organic compounds were analyzed at Savannah Laboratories In Savannah, Georgia, bygas chromatographic techniques. No organic compounds were analyzed at theSkldaway Laboratories In 1990 or 1991. Standard EPA quality assurance procedures werefollowed by Savannah Labs.
2.3 Sediment Trace Metal Data Interpretation
Metals occur naturally In sediments and must be distinguished from metals concentrationscontributed by human activities In order to Identify contamination. To distinguishanthropogenic enrichment from natural metals concentrations In sediments, amathematical method known as normalization was used In the Atlas. Normalization IsSimply defined as a method where constant natural chemical relationships are detected,and used as a basis for comparison.
The normalization method has been used In other parts of the country with favorableresults (Goldberg etal. 1979; Trefry etal. 1985; Loring 1991). Hanson and Evans (1991)published a trace metal enrichment aluminum normalization model based on a NOAAcoastal sediment database of sites In the Atlantic and Gulf of Mexico coastal areas.Similar approaches using Iron as a normalizing element were developed by Trefry andPresley (1976) to evaluate metal concentrations In sediments from the Gulf of Mexico and
7

by ZdanowIcz (1991) to evaluate anthropogenic metal enrichment by offshore dumpingof contaminated dredged sediment and sewage sludge In the Atlantic Ocean.
The metal-to-alumlnum normalization method developed In the 1988 FDEP publication. AGuide to the Interpretation of Metal Concentrations In Estuarine Sediments. was based ona 'clean' sediment database. Over 100 sites were selected throughout the state forInclusion In the 'clean' database. based upon their remoteness from known or suspectedanthropogenic metal sources. At these sites. sediment metal concentrations aregenerally expected to express natural relationships with alumInum (Figure 1).
The alumInum concentration of the sediment was chosen as a normaliZIng factor because1) aluminum has a high crustal abundance; 2) aluminum exhibits a highly refractorychemical behavior (e.g .. aluminum Is not easily separated from other metals duringweathering); and 3) the relatively small amounts of aluminum produced fromanthropogenic sources are overwhelmed by the abundance of naturally-occurringaluminum In coastal sediments.
Eight metals (As. Cd. Cr. Cu. Hg. Pb. NI. and Zn) were tested to determine their relationshipto aluminum. Based on the relationships between seven of the eight metals (excludIngmercury) and aluminum In clean sites. the FDEP developed a set of graphical tools toassess trace metal contamination In a sediment sample. For example. Figure 1 shows thatas aluminum concentrations In 'clean' sediments Increase. metals concentrations. In thiscase lead. also Increase.
Least squares regression analysis. using aluminum concentration as the Independentvariable and the concentration of the other metal as the dependent variable. wasemployed to fit regression lines to the data. UsIng results of the regression analysis. 95percent prediction limits were calculated. which can be seen In Figure 1. The width of thepredIction limits varies depending on the magnitude of the correlation coefficIentsbetween the metal In question and aluminum (Schropp and Windom 1988).
If a trace metal concentration falls above the upper 95 percent limit. the sample Isdesignated as 'enriched' In that metal. The enrichment factor Is the ratio of the measuredmetal concentration to Its maximum expected concentration In natural sediments (Figure2). At a given concentration of aluminum. the enrichment factor Is determined using thefollowing equation:
Metal Enrichment Factor =ObseNed Metal Concentration (J.,Jgog·l)
Maximum Expected Natural (J,Jgog-l)
Metal Concentration
8
(1)

/""'-10
-IOl
Ol::J.........,
0
L5~
0.1 -r----r-,-......,..""T"'""1r-r-,---..,....--.---.---r-.-T""T"T"T---..--r---r--.-..,....-,-,1000 10000
ALUMINUM (ug g-1)
Figure 1. Lead/aluminum relationship from statewide 'clean' sediments.
oL5--'
10
Lead - 40 ug 9-'Enrichment Ratio = 20
Above Natural Range- Lead Enrichmenf -
Below Natural Range - Possible Analytical Error
0.1 +---.-----r....,......"...,.,-----.----,--r--.......-r-r-T"'T"r---..,....--r--r-.....--.........,,....,1000 10000
ALUMINUM (ug g-1)
Figure 2. Interpretation of Lead data using lead/aluminum relationship.
9

Mercury does not significantly covary with aluminum concentrations In the "clean" dataset. To graphically express mercury data In the Atlos, the maxImum concentration ofmercury observed In the clean data set (0.21 J.l9.g-1 (21 ppb» was selected to representthe background value for natural mercury concentrations. The mercury enrichmentfactor used In the Atlas was calculated by dividing the mercury concentration at a site bythe value 0.21j.JQ·g·1 (21 ppb).
2.4 Interpretation of Sediment Toxic Organic Contaminant Data
Toxic organic contaminants In a sediment sample are typically reported In the ng.g.l(ppb) range on a dry weight basIs. ~ discussed In the Atias, normalization of organiccontaminants to total organic carbon Is used to account for the Influence of organiccarbon on bioavallabillty, and therefore the potential for toxicity.
For plotting purposes In the Atlos, the concentrations of all compounds In a class oforganic contaminants were summed. Then the total sum of each class was normalized tothe total organic carbon (TOC) concentration of the sample. This calculation Is outlined Inthe following equatIon.
I: Organic Compound (ng.g.l) (1 1J9.1(XX) ng.l)Organic Compound Class (flOITTlOIlzed) = • 1r:1 (2)
Total Organic Carbon (lJ9.g.1)
The concentration of the organic compound Is converted Into micrograms per gram(ppm), and multiplied by 106 to convert the number to a positive exponent for plottingpurposes. The normalized organic concentration Is Indicated using barcharts that have alogarithmic scale.
10
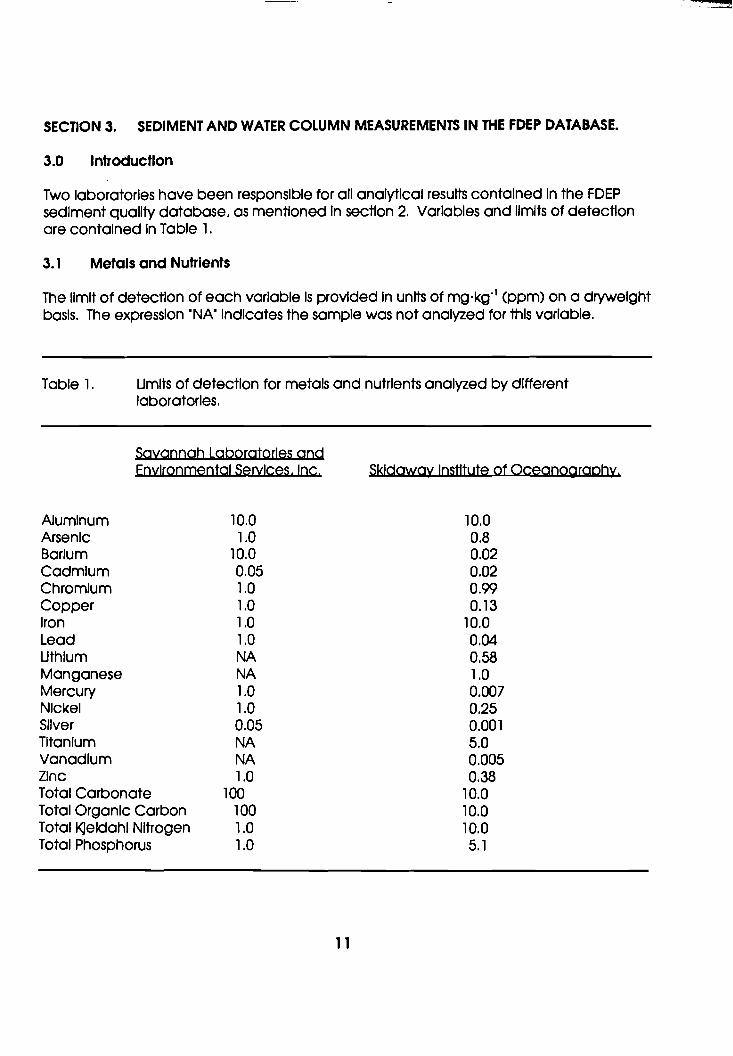
SECTION 3. SEDIMENT AND WATER COLUMN MEASUREMENTS IN THE FDEP DATABASE.
3.0 Introduction
Two laboratories have been responsible for all analytical results contained In the FDEPsediment quality database, as mentioned In section 2. Variables and limits of detectionare contained In Table 1.
3.1 Metals and Nutrients
The limit of detectIon of each variable Is provided In units of mg'kg-1 (ppm) on a drywelghtbasis. The expression "NA" Indicates the sample was not analyzed for this variable.
-_._--5
Table 1. Umlts of detection for metals and.nutrients analyzed by differentlaboratories.
Savannah Laboratories andEnylronmental Services, Inc, SkidaWaY Institute of Oceanography.
AluminumArsenicBariumCadmiumChromiumCopperIronLeadUthlumManganeseMercuryNickelSliverTitaniumVanadiumZincTotal CarbonateTotal Organic CarbonTotal Kjeldahl NitrogenTotal Phosphorus
10.01.0
10.00.051.01.01.01.0NANA1.01.00,05NANA1.0
1001001.01.0
11
10.00.80.020.020.990.13
10.00.040.581.00.0070.250,0015.00.0050.38
10.010.010.05.1
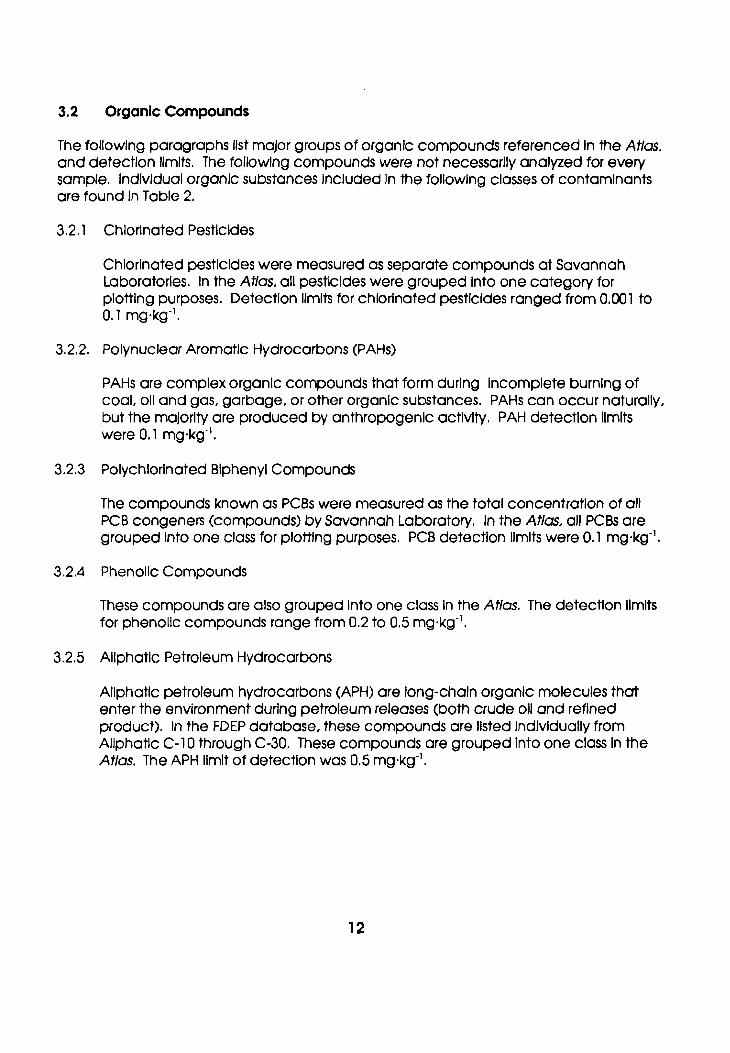
3.2 Organic Compounds
The following paragraphs list major groups of organIc compounds referenced In the Atlas,and detection limits. The following compounds were not necessarily analyzed for everysample. Individual organic sUbstances Included In the following classes of contaminantsare found In Table 2.
3.2,1 Chlorinated Pesticides
Chlorinated pesticides were measured as separate compounds at SavannahLaboratories. In the Atlos, all pesticides were grouped Into one category forplotting purposes. Detection limits for chlorinated pesticides ranged from 0.001 to0.1 mg·kg-1
•
3.2.2. Polynuclear Aromatic Hydrocarbons (PAHs)
PAHs are complex organic compounds that form during Incomplete burning ofcoal, 011 and gas, garbage, or other organic substances. PAHs can occur naturally,but the majority are produced by anthropogenic activity. PAH detection limitswere 0.1 mg·kg-1
•
3.2.3 Polychlorinated Biphenyl Compounds
The compounds known as PCBs were measured as the total concentration of allPCB congeners (compounds) by Savannah Laboratory. In the Atlos, all PCBs aregrouped Into one class for plottIng purposes, PCB detection limits were 0.1 mg·kg-1
•
3.2,4 Phenolic Compounds
These compounds are also grouped Into one class In the Atlos. The detection limitsfor phenolic compounds range from 0.2 to 0.5 mg·kg- I
•
3.2,5 Aliphatic Petroleum Hydrocarbons
Aliphatic petroleum hydrocarbons (APH) are long-chain organic molecules thatenter the environment during petroleum releases (both crude 011 and refinedproduct). In the FDEP database, these compounds are listed Individually fromAliphatIc C-10 through C-30. These compounds are grouped Into one class In theAtlos. The APH limit of detection was 0.5 mg·kg-1
•
12

Table 2. Organic Compounds In major categories.
Chlorinated pesticides
AldrinMirexpp-DDT4A'-DDD4A'-DDE4A'-DDTEndrinChlordaneAlpha-BHC(Toxaphene)Beta-BHCDelta-BHCGamma-BHC(Lindane)DieldrinEndosulfan IEndosulfan IIEndosulfan sulfateEndrin AldehydeHeptachlorHeptachlor epoxideKeponeMethoxychlor
Polychlorinated BiDhenyls
Aroe/or-1016Aroclor- 1221Aroclor- 1232Aroe/or- 1242Aroclor- 1248Aroclor-1254Aroclor- 1260
Measured as a sum of allPCB congeners
polynuclear AromaticHydrocarbons
AcenaphtheneAcenaphthyleneAnthraceneCrysene
+Benzo(a)anthraceneBenzo(a)pyreneBenzo(ghi)peryleneBenzo(bk)fluorantheneFluoreneIndeno(1,2,3-cd)pyreneNaphthalenePhenanthrene+AnthraceneBenzo(a)anthraceneBenzo(b)fluoranthreneDibenzo(a,h)anthracenePhenanthrene1-methylnaphthaleneBenzonitrlleQuinolineQuinaldine8-methylquinaline7,8-Benzoquinoline2,4-DimethylquinolineAcridinefndeno(l,2,3)pyrene
13
phenolic Compounds
2-Chlorophenol2A-Dichlorophenol2A-Dimethyl phenol4,6-Dinitro-o-cresol2-Nitrophenol4-NitrophenolP-Chloro-m-cresolPenta-ChlorophenolPhenol2,4,6 Trichlorophenol4-chloro-m-cresol2,4 Dinitrophenol
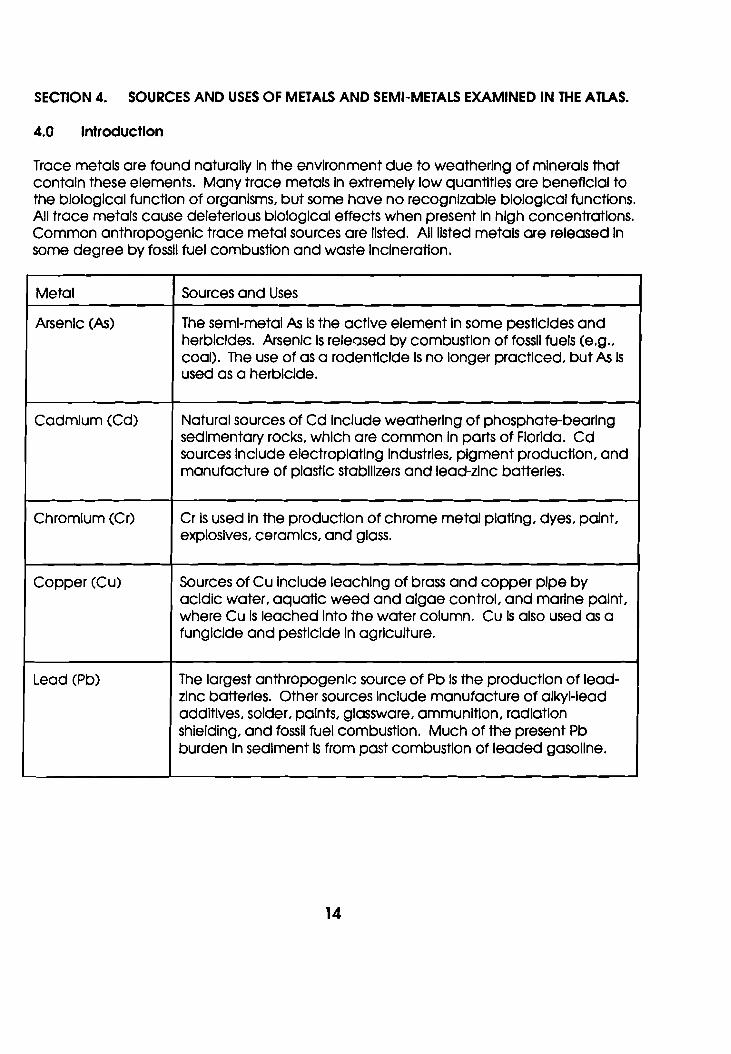
SECTION 4. SOURCES AND USES OF METALS AND SEMI-METALS EXAMINED IN THE ATLAS.
4.0 Introduction
Trace metals are found naturally In the environment due to weatherIng of minerals thatcontain these elements. Many trace metals In extremely low quantities are beneficial tothe bIological function of organisms, but some have no recognizable biological functions.All trace metals cause deleterious biological effects when present In hIgh concentrations.Common anthropogenic trace metal sources are listed. All listed metals are released Insome degree by fossil fuel combustion and waste Incineration.
Metal Sources and Uses
Arsenic (As) The semi-metal As Is the active element In some pesticIdes andherbicIdes. Arsenic Is releosed by combustion of fossil fuels (e.g.,coal). The use of as a rodenticide Is no longer practiced, but As Isused as a herbicIde.
Cadmium (Cd) Natural sources of Cd Include weathering of phosphate-bearingsedimentary rocks, which are common In parts of Florida. Cdsources Include electroplating Industries, pigment production, andmanufacture of plastic stabilizers and lead-zinc batterIes.
Chromium (Cr) Cr Is used In the production of chrome metal plating, dyes, paint,explosives, ceramics, and glass.
Copper (Cu) Sources of Cu Include leaching of brass and copper pipe byacidic water, aquatic weed and algae control, and marine paint,where Cu Is leached Into the water column. Cu Is also used as afungicide and pesticide In agricUlture.
Lead (Pb) The largest anthropogenic source of Pb Is the production of lead-zinc batteries. Other sources Include manufacture of alkyl-leadadditives. solder, paints, glassware, ammunition, radiationshielding. and fossil fuel combustion. Much of the present Pbburden In sediment Is from past combustion of leaded gasoline.
14

Mercury (Hg) The major sources of mer~ury In Florida Include: soli degassing,municipal solid waste combustion, medIcal waste Incineration,paint application and the electric utility Industry. Other sources ofHg Include dental preparations, anti-mildew agents In paint andsheetrock mud, manufacture of electrical equipment. openburning, transportation (fuel) and other fuel burning (FDER 1992).Significant quantities of Hg may be bound to organic particles Insediment and solis. Upon exposure of these materials to air (e.g.by agricultural conversIon of wetlands), Hg can becomebloavallable.
Nickel (NI) Nils used primarily In the production of stainless steel. NI Is used asa catalyst In Industrial processes, and In 011 refining. SourcesInclude electroplating Industries.
Zinc (Zn) zn Is used In the production of brass, batteries, galvanized coatingsto protect Iron and steel, and marine paints. Submerged"sacrificial" Zn plates are used on ships to reduce oxidation(rusting) of metallic parts exposed to saltwater, leading to high Znlevels In some marina sediments.
15

SECTION 5. SOURCES AND USES OF TOXIC ORGANIC COMPOUND CLASSES EXAMINED INTHE ATLAS
5.0 Introduction
Natural and anthropogenic sources of major organic compound classes are listed.Except for a few aliphatic hydrocarbons and polynuclear aromatic hydrocarbons, thesecompounds are manmade.
Organic Compound Sources and UsesClass
Chlorinated Pesticides Chlorinated pesticides are complex organic compounds towhich chlorine has been added. They are used to(partially) control Insects. Some common pesticidesInclude dieldrin, chlordane, lindane, and mlrex. DDT and Itsbreakdown products (DOD and ODE) have been detectedas recently as 1991 In Florida sediments, although use ofDDT has been halted In the U.S. However, U.S. chemicalcompanies stili manufacture DDT for use In other countries.
Polynuclear Aromatic PAHs are complex organic compounds that form duringHydrocarbons Incomplete burning of coal, 011 and gas, garbage, or other
organIc substances. The term PAHs Is applied tocompounds that have two or more benzene rings. PAHscan occur naturally, but the majority are produced byanthropogenic activity. 011 and fuel spills are a source ofPAHs In estuarine systems. Some PAHs are used Inproduction of pharmaceutical products, dyes, pesticides,and plastics.
Polychlorinated The term PCBs Is applied to organic molecules that containBiphenyls chlorine substituted Into a biphenyl ring. PCBs were used In
closed electric systems (transformers), and In otherapplications, all of whIch were discontInued In 1971.Introduction Into the environment stili occurs, for examplefrom waste Incineration. These molecules are extremelypersistent stable compounds In the environment.
Phenolic Hydrocarbons Organic solvents used In the manufacture of resins, paint,and plastics. Some are used as a disinfectant. Somephenolic compounds occur naturally In wood, petroleum,and tar, and are constituents of human and animal wastes.
16
I>
t ]1

Aliphatic PetroleumHydrocarbons
OrganIc molecules formed by chains (polymers) of carbonatoms released In aquatic environments by petroleum spillsduring loadlng/offloadlng, transport and productIonactivities. Most petroleum hydrocarbons are released Intothe environment during transport activity, and not byoffshore petroleum or natural gas exploration and/orproduction.
17

Florida Coastal Sediment Contaminants Atlas Technical Volume References
Blshot D.E., 1991. Umnologlcal monitoring and Investigations program: Sediment qualitymonitorIng semiannual report. Collier County Pollution Control Department.
Brim, M., 1993. Toxlcs characterizatIon report for Perdido Bay, Alabama and Florida.United States Fish and Wildlife Service, publication no. PCFO~EC-93-04. Panama City, FL.
Brim, M., (In preparation). Sediment chemistry of St. Andrew Bay, United Sates Fish andWildlife Service. Panama City, FL.
Brooks, G.R. and Doyle, L.J., 1989. Recent geological history of mud-dominated sedimentsIn Hillsborough Bay, Florida: Final report to City ofTampa.
Brooks, G.R. and Doyle, L.J., 1992. A characterization ofTampa Bay sediments, phase III:distribution of sediments and sedimentary contaminants. Report SUbmitted to theSouthwest Florida Water Management District by the Center for Nearshore MarineScience of the University of South Florida.
Broward County Department of Resource Protection, 1993. New River Study: Final Report.
Delfino, J.J., Coates, J.A., Davis, W.M., Garcia, K.L., Jacobs, M.W., Marlnclc, K.J., andSignorella, L.L., 1991. Toxic pollutants In discharges, ambient waters, and bottomsediments. Report to the Department of Environmental Regulation, 405 pp.
Dixon, L.K., 1988. Non-point water quality Impacts In northern west coast InlandNavigation District waters. Final report submitted to Manatee County Public WorksDepartment. TechnIcal Report No. 126, Mote Marine Laboratory, Sarasota, Florida.
Doyle, L.J., Brooks, G.R., Fanning, K.A., Van Vleet. E.S" Byrne, R.H., and Blake, N.J" 1989. Acharacterization of Tampa Bay sediments. A report submitted to the Southwest FloridaWater Management District by the Center for Nearshore Marine Science of the Universityof South Florida.
Facemire, C.F., 1991. Copper and other contaminants In King's Bay and Crystal RIver(Florida) Sediments: Implications for Impact on the West Indian manatee. Report to theU.S. FIsh and Wildlife Service.
Florida Department of EnvIronmental Regulation, 1984. Deepwater ports maintenancedredging and disposal manual: a guide to planning, estuarine chemical data collection,analysis, and Interpretation. Fourth Revision. Florida Department of EnVironmentalRegulation. 94 pp. and 1appendix.
Florida Department of Environmental RegulatIon, 1992. Mercury emissions to theatmosphere In Florida. Report prepared by KBN Engineering and Applied Sciences,GaInesville, FL.
18

GOldberg, ED., Griffin, J.J., Hodge, V., Kolde, M., and Windom, H., 1979. Pollution history ofthe Savannah River estuary, Environmental Science and Technology, v. 13, p. 588-594.
Grabe, S., 19910, Sediment quality In estuarine waters of Collier County: April and August1991. Collier County Pollution Control Department.
Grabe, S., 1991b. Inland sediment quality annual report, 1991. Collier County PollutionControl Department.
Gu, D., Irlcanln, N., and Trefry, J.H., 1987. The geochemistry of Interstitial water for asediment core from the Indian River Lagoon, Florida. Florida SCientist. v. 50,99-110.
Hanson, P.J. and Evans, D.W., 1991. Metal contaminant assessment for the SoutheastAtlantic and Gulf of Mexico Coasts: Results of the National Benthic Surveillance Projectover the first four years 1984-1987. National Oceanic and Atmospheric Administration(NOAA) Technical Memorandum NMFS-SEFSC-284, 77 pp.
Haunert, D.E., 1988. Sediment characteristics and toxic SUbstances In the St. Lucie Estuary,Florida. Technical Publication 88-10, South Florida Water Management District.
Hofmann, S. and Dixon, L.K., 1989. Metals characterization of sediments at Port Manatee.Final report submitted to Manatee Port Authority. Technical Report No. 135, Mote MarineLaboratory, Sarasota, Florida.
Long, E.R. and Morgan, L.G" 1990. The potential for biological effects of sediment-sorbedcontaminants tested In the National Status and Trends Program. National Oceanic andAtmospheric Administration (NOM) Technical Memorandum NOS OMA 52, 223 pp.
Long, E.R., MacDonald, D. and Calrncross, C., 1991. Status and trends In toxicants and thepotential for their biological effects In Tampa Bay, Florida. National Oceanic andAtmospheric Administration (NOM) Technical Memorandum NOS OMA 58. 77 pp.
Long, E.R. et 01., In preparation. MagnitUde and extent of sediment toxlclty In Tampa Bay.Florida. National Status and Trends Program, Bloeffects Assessment Program.
Loring, DoH., 1991. Normalization of heavy-metal data from estuarine and coastalsediments. ICES (International Council for the Exploration of the Sea) Journal of MarineSCience, v. 48, 101-115.
Loring, D.H. and Rantala, R.ll, 1988. An Intercalibration exercise for trace metals Inmarine sedIments. Marine Chemistry, v. 24, 13-28.
Lowrey, S., Dixon, L.K., and Sherbloom. P., In press. Water quality trends and baywldemonitoring results for Sarasota Bay. Final report submitted to Sarasota Bay NatIonalEstuary Program. Technical Report No. 253, Mote Marine Laboratory, Sarasota, Florida.
19

Pierce, R.H., Dixon, LX, Brown, L.C., and Rodrick, G., 1988. Characterization of baselineconditions of the physical, chemical, and mIcrobiological environments In the St. JohnsRiver Estuary. Final report submitted to the Florida Department of EnvironmentalRegulation. Technical Report No. 128, Mote Marine Laboratory, Sarasota, Florida.
Pfeuffer. R.J .. 1985. Pesticide residue monitoring In sediment and surface water within theSouth Florida Water Management District, volume 1. Technical Publication 91-01. SouthFlorida Water Management District.
Pfeuffer, R.J., 1991. Pesticide residue monitoring In sediment and surface water within theSouth Florida Water Management District, volume 2. Technical Publication 91-01. SouthFlorida Water Management District.
Seal, T.L., Calder, F.D., Sloane. G.M., Schropp, S.J., and Windom, H.L, 1992. Assessment oftrace metal contamInation of estuarine and marine sedIments from Florida. GeologicalSociety of America Abstracts with Programs, Volume 25, p.68.
Schropp, S.J., 1992. An laboratory Intercomparlson exercise for sediment metal analyses.Florida Department of Environmental Regulation Open-file Report.
Schropp. S.J. and Windom, H.L., 1988. A guide to the Interpretation of metalconcentration In estuarine sediments. Coastal Zone Management Section, FloridaDepartment of Environmental Regulation, 44 pp.
Schropp, S. J., Calder, F.D.• Sloane. G.M. and Windom, H.l.. 1990. Interpretation of metalconcentration In estuarine sediments of Florida using aluminum as a reference element.Estuaries, v. 13,227-235.
Schropp, S.J., Calder, F.D., Sloane, G.M., Swanson. K.O., Carlton, J.C., Halcomb. G.l.,Windom. H.L., Huan, F., Taylor, R.B., and Hull, T., 1991. A report on physical and chemicalprocesses affecting the management of Perdido Bay: Results of the Perdido Bay InterstateProject. Florida Department of Environmental Regulation, Tallahassee, FL
Stone, G.W. and Morgan, J.P., 1991. Heavy metal Concentrations In subsurface sediments,Bayou Chico, Pensacola, Florida. Report prepared for the Florida Department ofEnvironmental Regulation by the Institute for Coastal and Estuarine Research, TheUniversity of West Florida, Pensacola.
Trefry, J.H., Metz, SOl and Troclne, R.P., 1985. The decline In lead transport by the MIssissippiRiver. Science, v. 230, 439-441.
Trefry, J.H. and Presley, B.J., 1976. Heavy metals In sediments from the Son Antonio Bayand the northwest Gulf of Mexico. Environmental Geology, v. 1, p. 283-294.
Trefry, J.H. and Stauble, D.K., 1987. Origin, composition and fate of organic-rich sedimentsIn coastal estuaries. Report to The Florida Sea Grant College and the Florida Departmentof Environmental Regulation.
20

Trefry, J.H., Troclne, R.P. and Men, S., 1989. Quantifying sedimentation and pollution In theLower Hillsborough River. Report to the City of Tampa.
Trefry, J.H., Sadhoughl, M., Sullivan, M.D., Steward, J.S., and Barber, S., 1983. Trace metalsIn the Indian RIver Lagoon, Florida: The copper story. Florida Scientist, v. 46, 41~428.
Trefry, J.H., Chen, N., Troclne, R. and Men, S., 1990. Manatee Pocket sediment analysis.Report to the South FlorIda Water Management District. 43 pp. and two appendices.
Trefry, J.H., Chen, N., Troclne, R. and Men, S.. 1992. Impingement of organic-rich,contaminated sediments on Manatee Pocket. FlorIda. Florida Sclenttst. v. 55.
Windom, H.L., Schropp, S.J., Calder, F.D., Ryan, J.D., Smith, R.G., Jr., Bumey, L.C., Lewis,F.G., and Rawlinson, C.H., 1989. Natural trace metal concentrations In estuarine andcoastal marine sedIments of the southeastern United States. Environmental Science andTechnology, v. 23, 314-320.
Windom, H.L. and Smith, R.G., 1992. Analysis of mercury species In groundwater usingInductively coupled plasma-mass spectrometry and gas chromatography. Reportsubmitted to the State of New Jersey, Department of Environmental Protection andEnergy.
Zdanowicz, V.S., 1991. Determining the fates of contaminated wastes dumped In the NewYork Apex by use of metal enrichment factors. Environmental Science and Technology,v. 25, 1760-1766.
21