© crown copyright met office climate projections for west africa andrew hartley, met office: parcc...
TRANSCRIPT
© Crown copyright Met Office
Climate Projections for West AfricaAndrew Hartley, Met Office: PARCC national workshop on climate information and species vulnerability to Climate Change, April 3-5, 2013
© Crown copyright Met Office
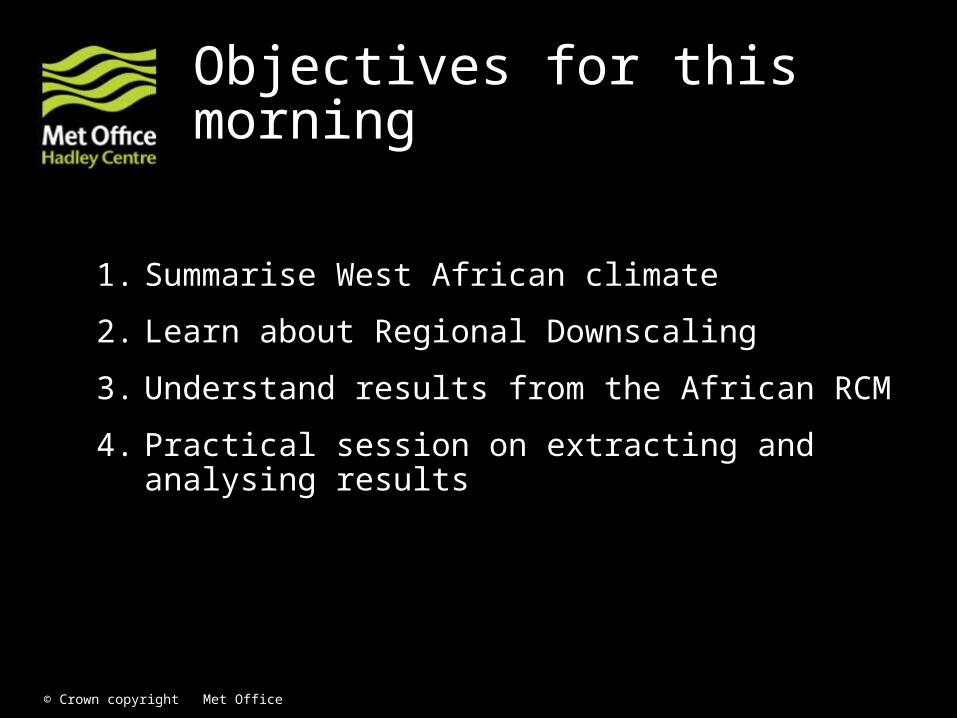
Objectives for this morning
1. Summarise West African climate
2. Learn about Regional Downscaling
3. Understand results from the African RCM
4. Practical session on extracting and analysing results

© Crown copyright Met Office
The West African Climate

© Crown copyright Met Office
Main drivers of the West African Climate
• Seasonal shift in the Inter-Tropical Convergence Zone
• Sea Surface Temperatures in Gulf of Guinea• Connected to Asian monsoon and pacific warm
pool• El Nino• Land use
© Crown copyright Met Office
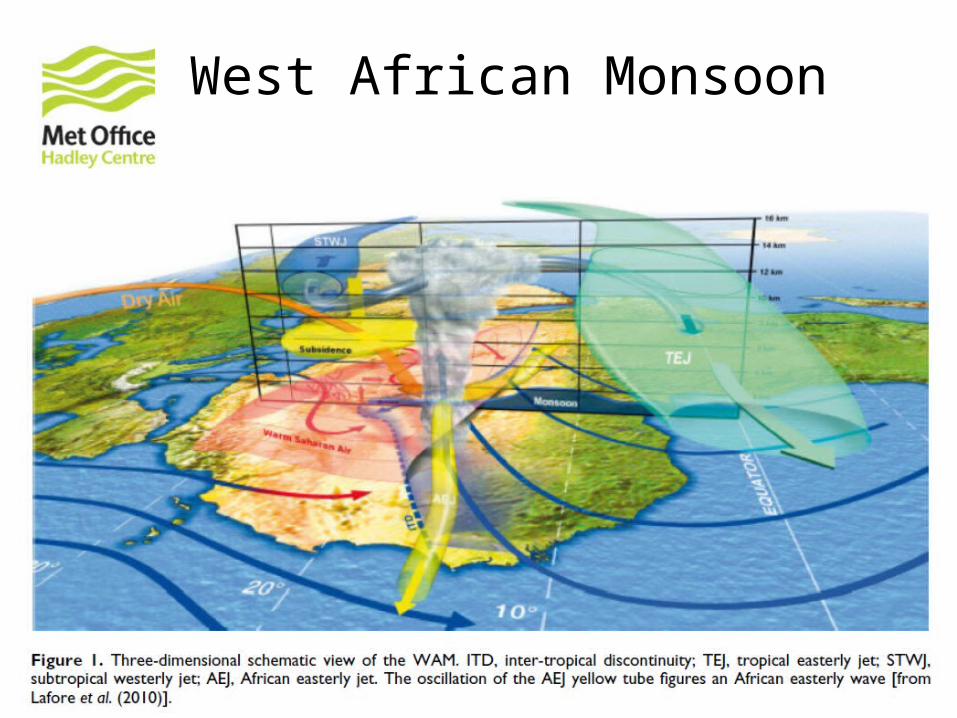
West African Monsoon

© Crown copyright Met Office
West African Monsoon
© Crown copyright Met Office
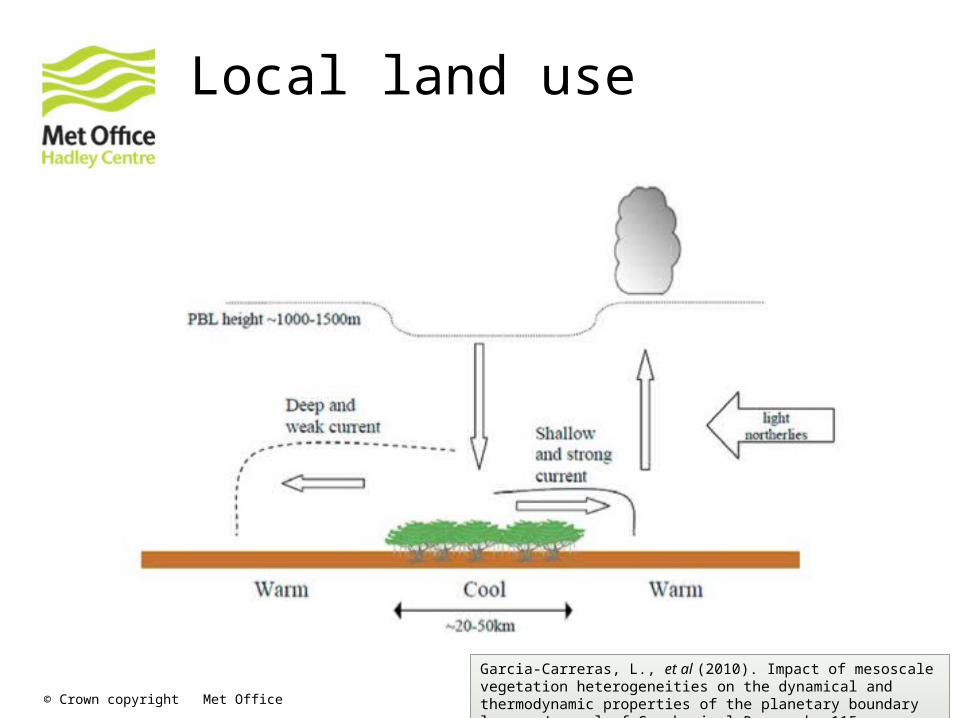
Local land use
Garcia-Carreras, L., et al (2010). Impact of mesoscale vegetation heterogeneities on the dynamical and thermodynamic properties of the planetary boundary layer. Journal of Geophysical Research, 115
Garcia-Carreras, L., et al (2010). Impact of mesoscale vegetation heterogeneities on the dynamical and thermodynamic properties of the planetary boundary layer. Journal of Geophysical Research, 115

© Crown copyright Met Office
Regional Downscaling
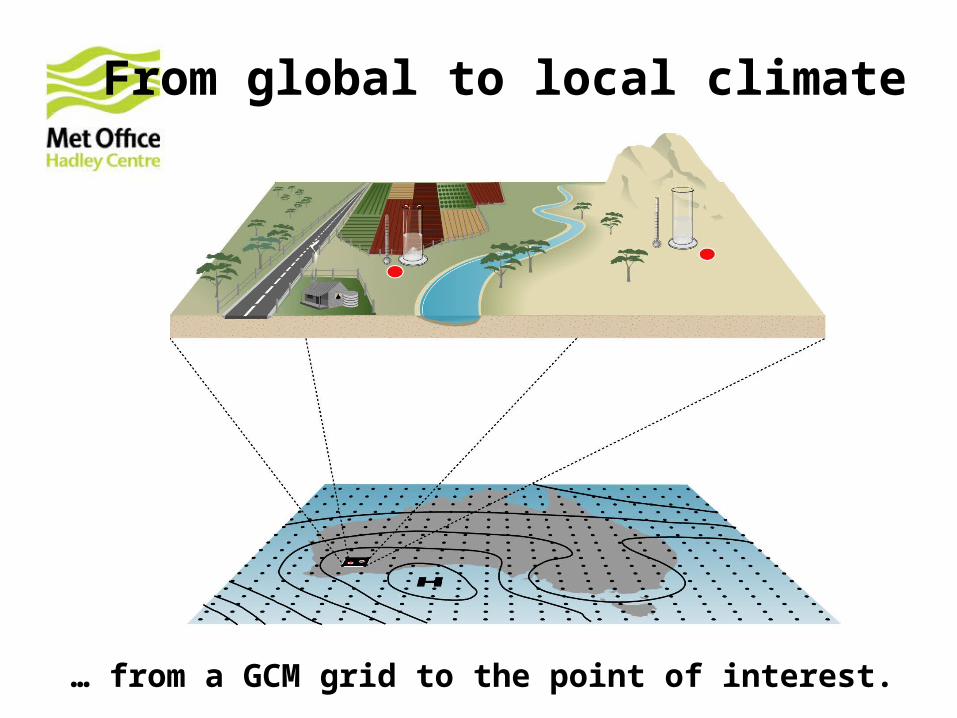
From global to local climate ….
… from a GCM grid to the point of interest.

© Crown copyright Met Office
Main reason: GCM lack regional details due to coarse resolution for many climate studies -> needs fine scale information to be derived from GCM output.
• Smaller scale climate results from an interaction between global climate and local physiographic details
• There is an increasing need to better understand the processes that determine regional climate
• Impact assessors need regional detail to assess vulnerability and possible adaptation strategies
Why downscaling?
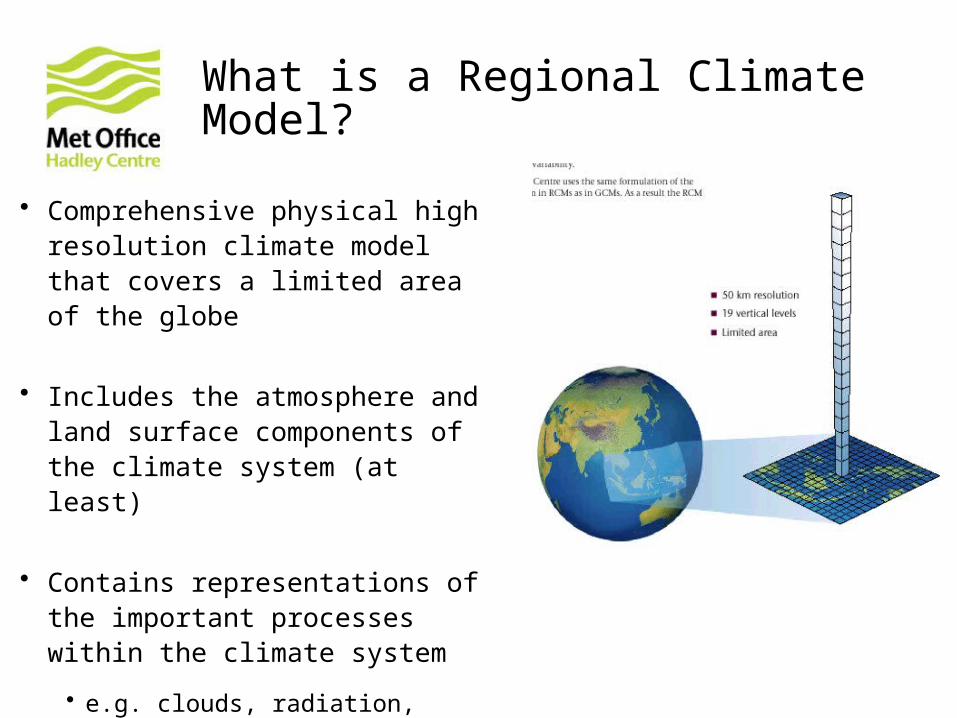
What is a Regional Climate Model?
• Comprehensive physical high resolution climate model that covers a limited area of the globe
• Includes the atmosphere and land surface components of the climate system (at least)
• Contains representations of the important processes within the climate system
• e.g. clouds, radiation, precipitation

© Crown copyright Met Office
Lateral boundary conditions
• LBCs = Meteorological boundary conditions at the lateral (side) boundaries of the RCM domain
• They constrain the RCM throughout its simulation
• Provide the information the RCM needs from outside its domain
• Data come from a GCM or observations
• Lateral boundary condition variables• Wind
• Temperature
• Water
• Pressure
• Aerosols
LBC
variables
LBC variables
LBC variablesLB
C v
aria
bles
© Crown copyright Met Office
Added value of RCMs

© Crown copyright Met Office
RCMs simulate current climate more realistically
Patterns of present-day winter precipitation over Great Britain

© Crown copyright Met Office
Represent smaller islands
Projected changes in summer surface air temperature between present day and the end of the 21st century.
© Crown copyright Met Office
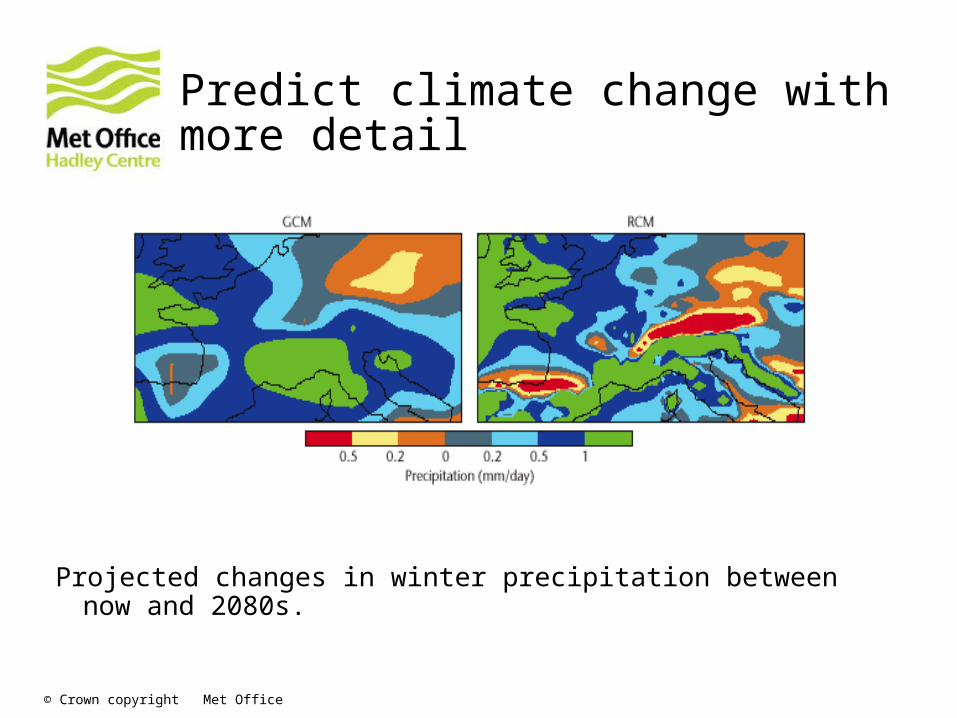
Predict climate change with more detail
Projected changes in winter precipitation between now and 2080s.
© Crown copyright Met Office
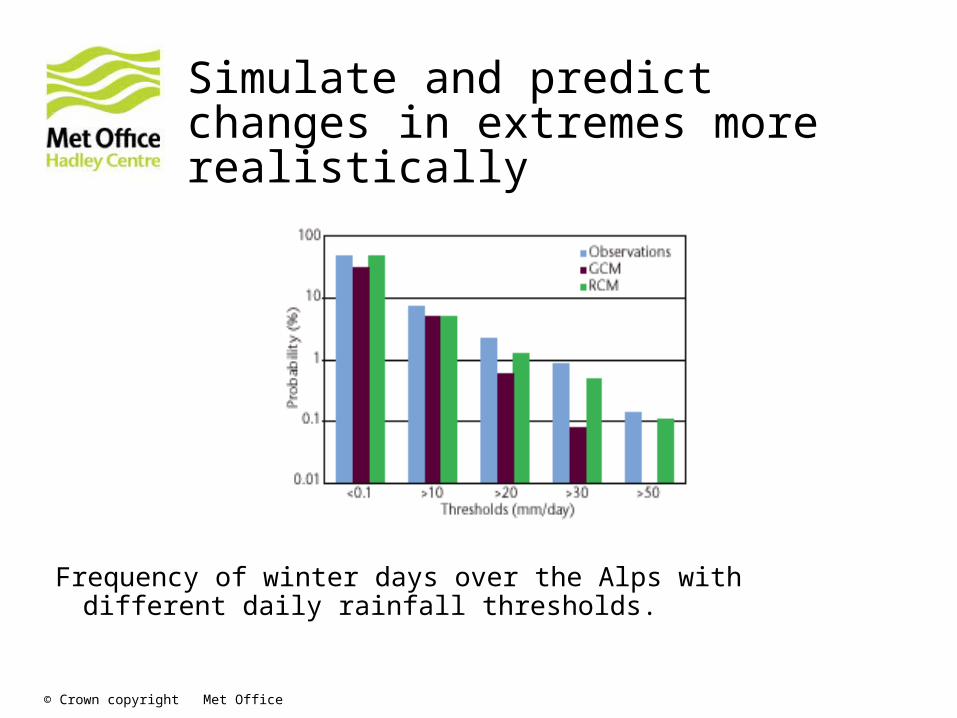
Simulate and predict changes in extremes more realistically
Frequency of winter days over the Alps with different daily rainfall thresholds.
© Crown copyright Met Office
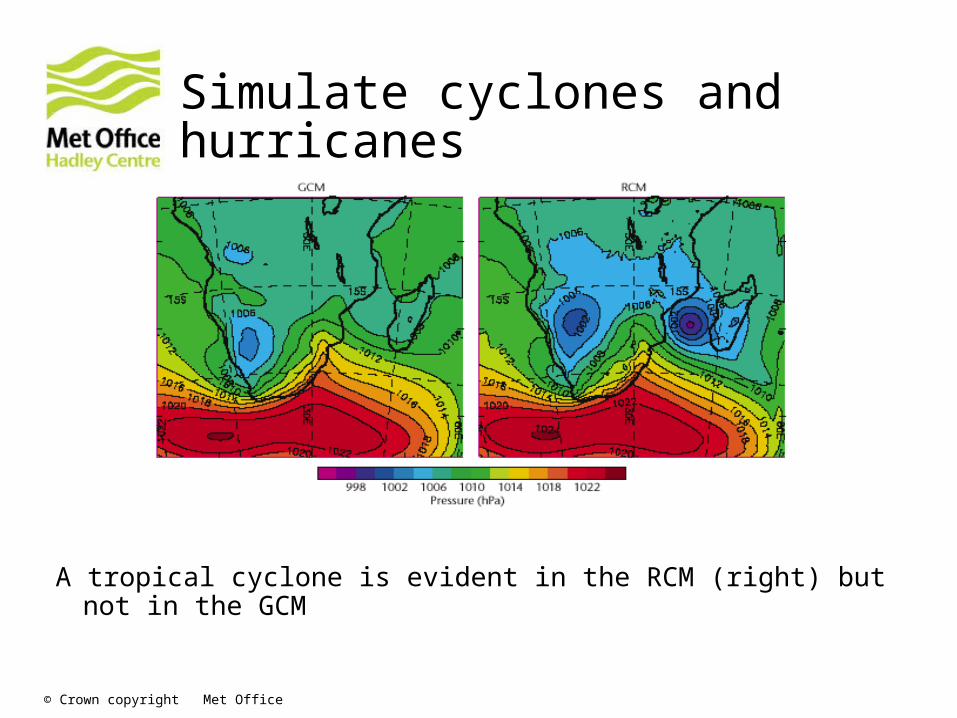
Simulate cyclones and hurricanes
A tropical cyclone is evident in the RCM (right) but not in the GCM
© Crown copyright Met Office
Africa RCMThe modeling process
© Crown copyright Met Office
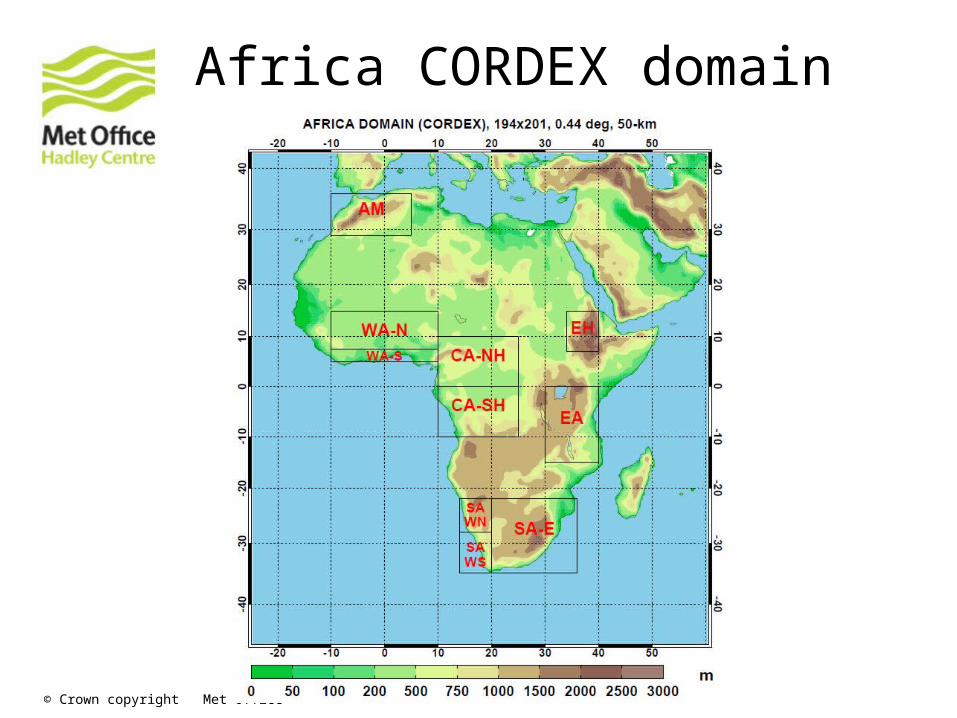
Africa CORDEX domain

© Crown copyright Met Office
Model Setup
• December 1949 to December 2099• 50km spatial resolution• PRECIS RCM with MOSES 2.2 land
surface• A1B scenario• African Great Lakes included

© Crown copyright Met Office
Ensemble approachAim: Quantify uncertainty deriving from GCMs in regional
climate projections• QUMP: Quantification of Uncertainty of Model Projections• 17 GCM ensemble members, each with different model
setup• Sub-selected 5 GCMs to provide LBCs for 5 different
RCMs.• Model selection based on regional analysis of GCMs for
Africa. • spread in outcomes produced by the full ensemble• excluding any members that do not realistically represent the
African climate.

© Crown copyright Met Office© Crown copyright Met Office
Boundary condition selection

© Crown copyright Met Office
Validation using observations
Dataset Variables used Resolution Source Reference
CRU 3.0 1.5m Temperature 0.5° monthly, 1900-2006 land only Gridded station data Mitchell and Jones 2005
ERA40 850hPa Winds 2.5° monthly 1979-1993 Reanalysis Uppala et al, 2005
CMAP Precipitation 2.5° monthly 1979-2002 Gridded station data merged with satellite data Xie and Arkin, 1997

© Crown copyright Met Office
GCM Validation
• No clear ‘better’ or ‘worse’ models across all sub-regions
• Models generally capture timing and location of rainfall well, but magnitudes vary
• Sensitivity of models and their biases are not independent
• E.g. Q1-5 are coolest, and driest
• Stages 1 and 2 not independent!
• But, wanted to ‘avoid’ model Q1,3,4 and 16 as did not capture seasonal cycles well for one or more sub-regions.
© Crown copyright Met Office
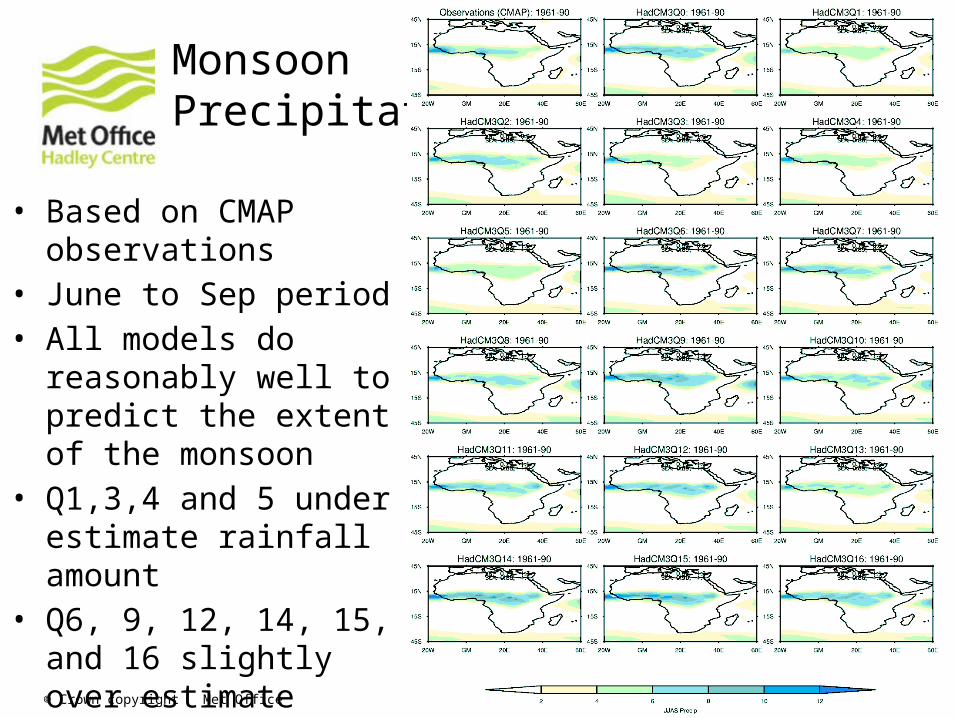
Monsoon Precipitation
• Based on CMAP observations
• June to Sep period• All models do reasonably
well to predict the extent of the monsoon
• Q1,3,4 and 5 under estimate rainfall amount
• Q6, 9, 12, 14, 15, and 16 slightly over estimate rainfall

© Crown copyright Met Office
Winds and surface pressure
• Based on ERA40 reanalysis
© Crown copyright Met Office
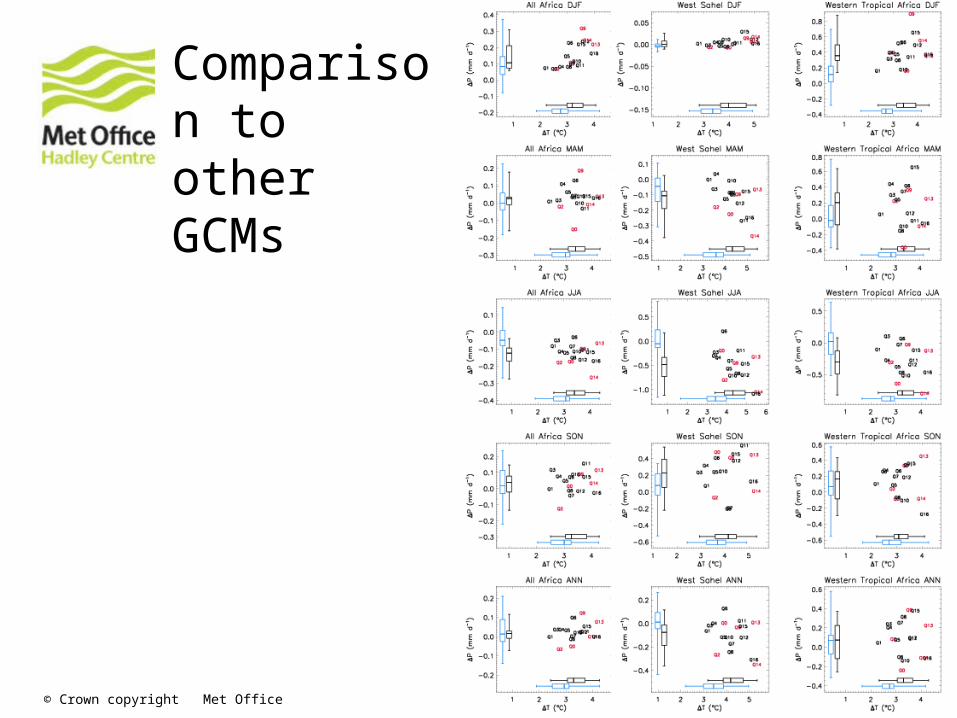
Comparison to other GCMs

© Crown copyright Met Office
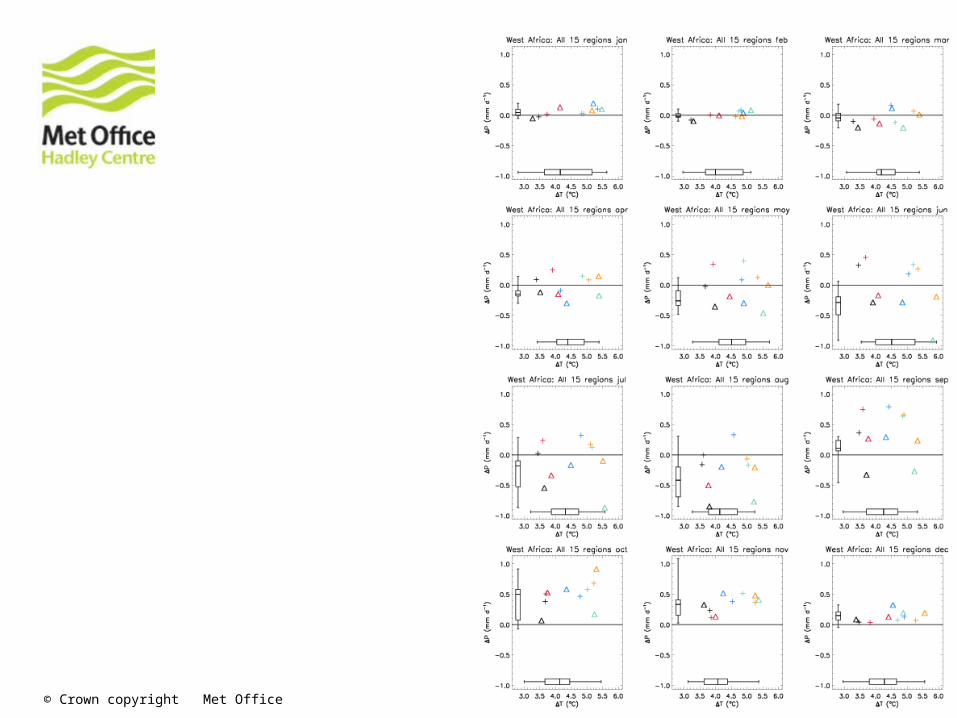
Comparison to other RCMs

© Crown copyright Met Office
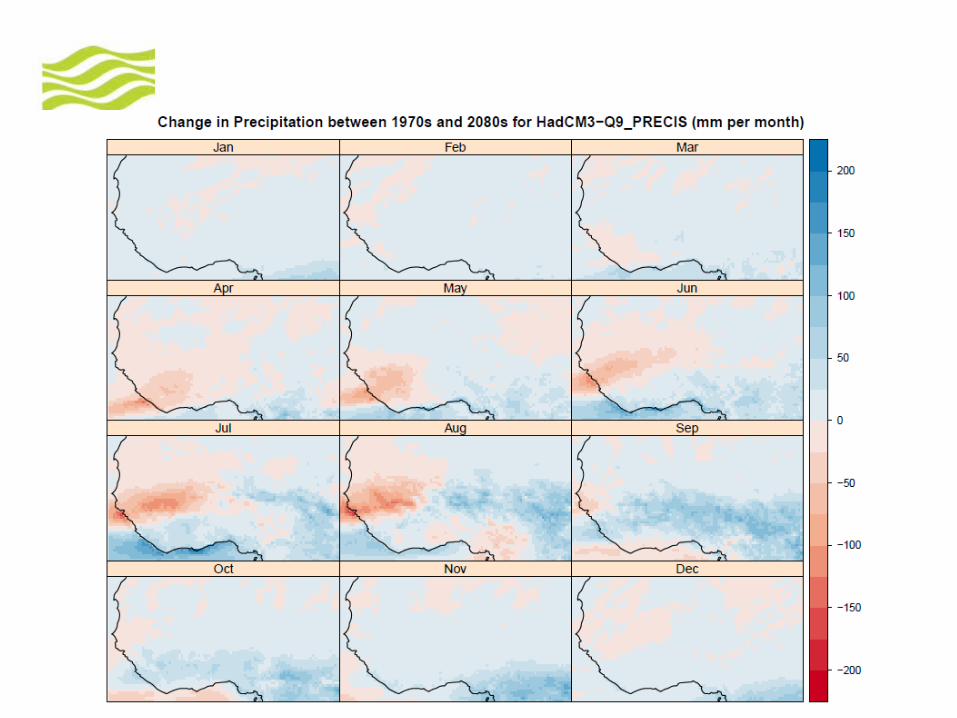
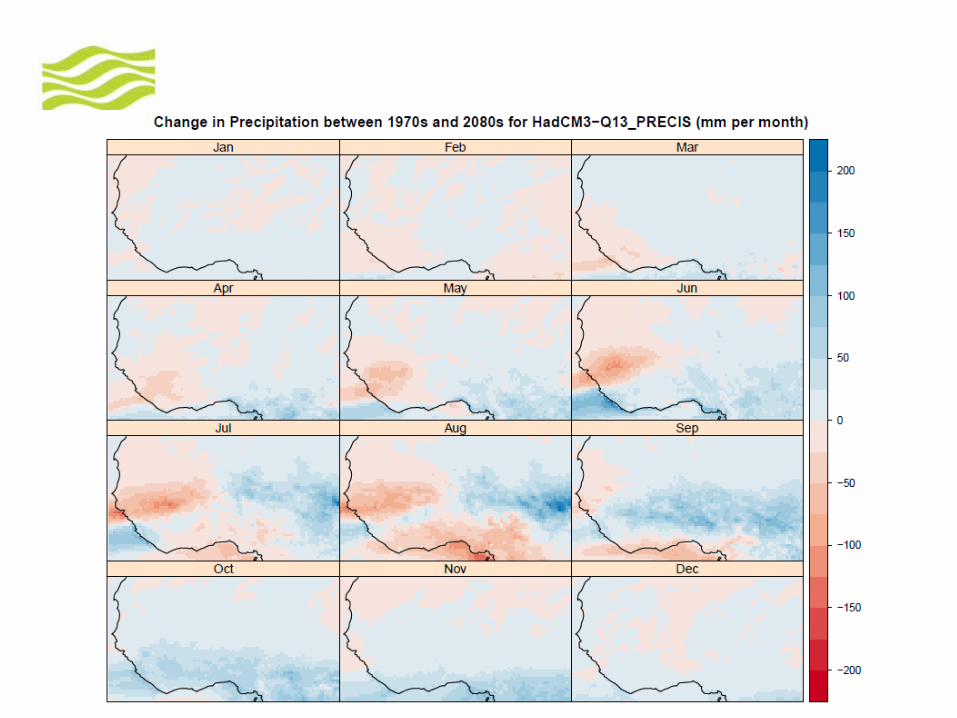
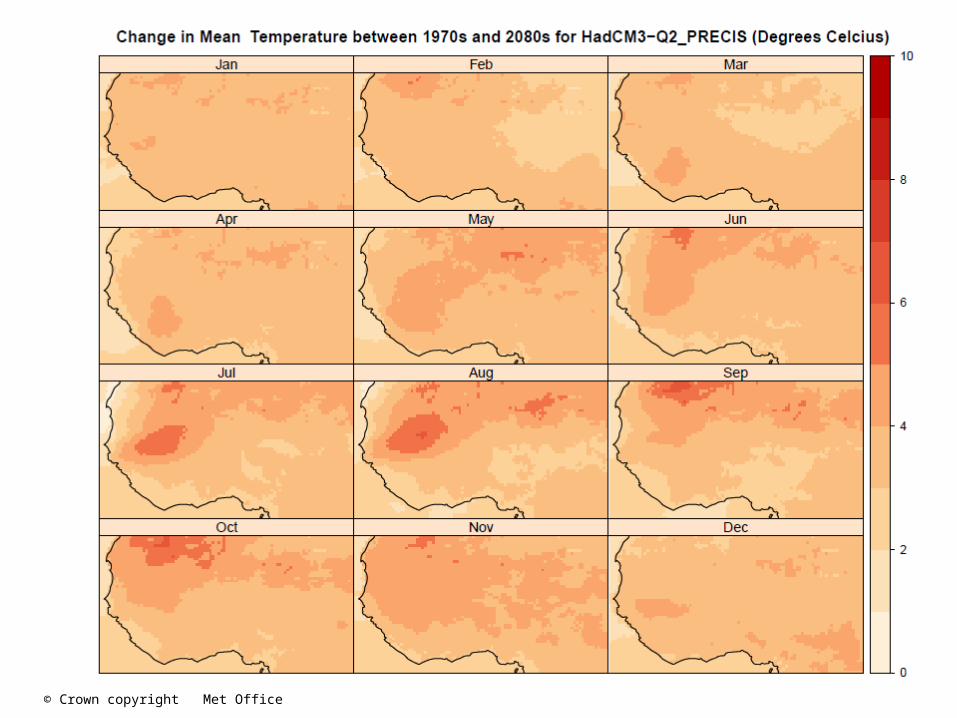
Sub-selection
• Q0, Q2, Q9, Q13, Q14• Q0 – unperturbed model• Q2 and Q0 represent cooler end of range of
responses• Q13 and 14 represent warmer range of
responses• Q9 and 14 represent wetter end of range of
responses• Q0 and 2 represent drier end of responses
(although this varies seasonally)

© Crown copyright Met Office
Main points
• Large scale geographical distribution of the temperature and precipitation of the African climate are captured
• The sample captures full range of outcomes produced by the QUMP ensemble and the annual variation for as many of the sub-regions as possible.
• Q0 and Q2 represent the cooler end of the range of future projections and Q13 and Q14 represent the warmer end of the range to provide the spread in temperature.
• No particular model consistently shows the largest change in precipitation for both regions throughout the year.
• Q14 represents the wetter end of the range in future projections for Western Tropical Africa during December, January and February (DJF) but not during June, July, August (JJA) and annually in West Sahel it is actually the driest model.
• Overall, the analysis suggests that Q0 captures the drier end of the range of future projections and Q9 captures the wetter end of the range.

© Crown copyright Met Office
Key results for West Africa
© Crown copyright Met Office
© Crown copyright Met Office
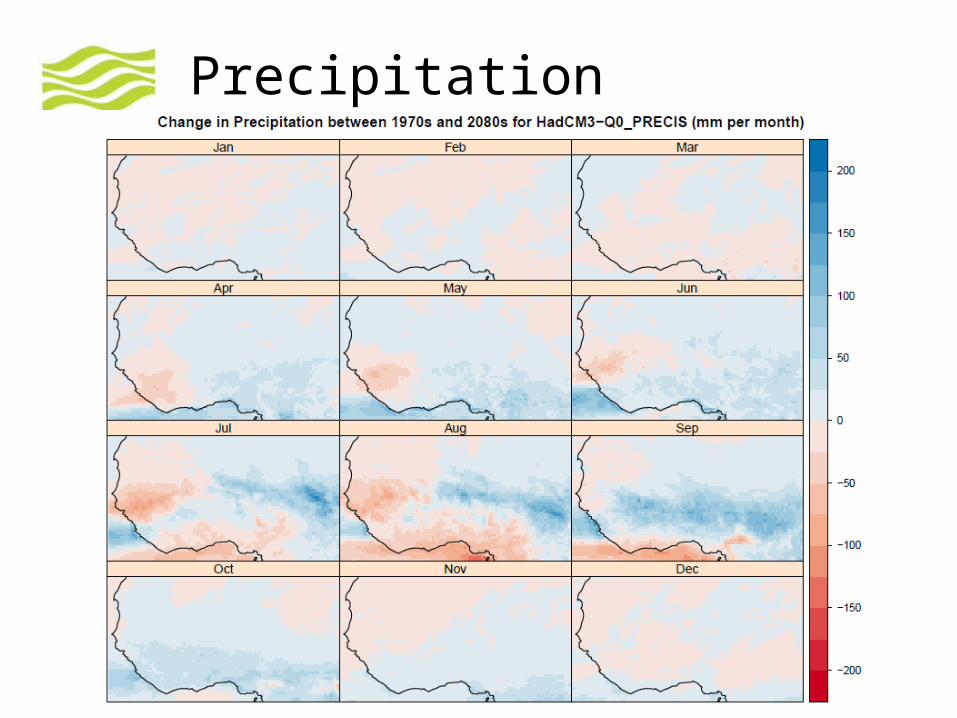
Precipitation

© Crown copyright Met Office
© Crown copyright Met Office

© Crown copyright Met Office
© Crown copyright Met Office

© Crown copyright Met Office
© Crown copyright Met Office

© Crown copyright Met Office

© Crown copyright Met Office

© Crown copyright Met Office

© Crown copyright Met Office
Practical Session