α blockade reduces immune suppression in the …
TRANSCRIPT

The Texas Medical Center Library The Texas Medical Center Library
DigitalCommons@TMC DigitalCommons@TMC
The University of Texas MD Anderson Cancer Center UTHealth Graduate School of Biomedical Sciences Dissertations and Theses (Open Access)
The University of Texas MD Anderson Cancer Center UTHealth Graduate School of
Biomedical Sciences
12-2018
IL-1α BLOCKADE REDUCES IMMUNE SUPPRESSION IN THE IL-1 BLOCKADE REDUCES IMMUNE SUPPRESSION IN THE
EARLY TUMOR MICRO-ENVIRONMENT EARLY TUMOR MICRO-ENVIRONMENT
Brenda Melendez
Follow this and additional works at: https://digitalcommons.library.tmc.edu/utgsbs_dissertations
Part of the Immunopathology Commons, and the Medicine and Health Sciences Commons
Recommended Citation Recommended Citation Melendez, Brenda, "IL-1α BLOCKADE REDUCES IMMUNE SUPPRESSION IN THE EARLY TUMOR MICRO-ENVIRONMENT" (2018). The University of Texas MD Anderson Cancer Center UTHealth Graduate School of Biomedical Sciences Dissertations and Theses (Open Access). 919. https://digitalcommons.library.tmc.edu/utgsbs_dissertations/919
This Dissertation (PhD) is brought to you for free and open access by the The University of Texas MD Anderson Cancer Center UTHealth Graduate School of Biomedical Sciences at DigitalCommons@TMC. It has been accepted for inclusion in The University of Texas MD Anderson Cancer Center UTHealth Graduate School of Biomedical Sciences Dissertations and Theses (Open Access) by an authorized administrator of DigitalCommons@TMC. For more information, please contact [email protected].

i
IL-1α BLOCKADE REDUCES IMMUNE SUPPRESSION IN THE EARLY TUMOR
MICROENVIRONMENT
By Brenda Melendez, B.S.
Approved:
_____________________________
Gregory Lizee, PhD.
Advisory Professor
_____________________________
Jagannadha Sastry, PhD.
_____________________________
Michael Curran, PhD.
_____________________________
Kwong Wong, PhD.
_____________________________
Chantale Bernatchez, PhD.
APPROVED
_____________________________
Dean, The University of Texas
MD Anderson Cancer Center UTHealth Graduate School of Biomedical Sciences

ii
IL-1α BLOCKADE REDUCES IMMUNE SUPPRESSION IN THE EARLY TUMOR MICRO-
ENVIRONMENT
A Dissertation
Presented to the faculty of
The University of Texas
MD Anderson Cancer Center UTHealth
Graduate School of Biomedical Sciences
in Partial Fulfillment
of the Requirements
for the Degree of
DOCTOR OF PHILOSOPHY
By
Brenda Melendez, B.S.
Houston, Texas
December 2018

iii
Acknowledgements
First, I would like to thank my mentor, Dr. Lizee, for his support and mentorship. It
has been a long process and his help was invaluable to get to this point. Thank you for your
advice in and outside the lab.
I would also like to thank my present and past committee members: Dr. Jagannadha
Sastry, Dr. Michael Curran, Dr. Kwong Wong, Dr. Willem Overwijk, Dr. Stephen Ullrich, and
my newest member Dr. Chantale Bernatchez. Presentations have always been extremely
stressful for me. Thank for your feedback, which helped move my project forward and
helped improve my presentations skills.
In the lab, I worked with great members inside my group. In my early lab days, my
labmate, Dr. Amjad Talukder and Sherille Bradely, were fundamental in improving my
microbiology skills. Amjad and Sherille taught me the basics in bacterial work and fancier
techniques like site mutagenesis. This knowledge allowed me to design and make my own
vectors to study any type of gene. Dr. Lizee, helped me improve my cell culture technique
and also taught me about viral work. I would also like to thank Kyle Jackson, who helped me
throughout the years in viral work and other experiments.
Outside my lab I would like to thank Dr. Weiyi Peng, Dr. Yared Hailemichael, Rina
Mbofung, and Hiep Khong. Their mentorship in animal studies and immune populations was
invaluable to my project. Rina and Hiep taught me animal techniques and were patient
enough with me in the beginning when I couldn’t hold a black mouse properly. I still say they
are more aggressive than white mice. Weiyi and Yared helped me analyze data and plan
animal experiments.
iv
Leila Williams shared her human T cell knowledge with me and helped me with the
trickier experiments that she and her lab spent years optimizing. She is also an amazing
friend!
Finally, I would like to thank my friends who kept me happy, even in the most
stressful times. A huge thank you to Leila, Rene, Mayra, Rina, OJ, Shawne, Esteban, Ben,
Arehly, Brittany, and Nicolle.
v
IL-1α Blockade Reduces Immune Suppression in the Early Tumor Micro-Environment
Brenda Melendez, B.S.
Advisory Professor: Gregory Lizee, PhD.
Immunotherapy against melanoma has shown great promise in the clinic for treating
advanced-stage patients. However, a major barrier against effective T cell mediated
cytotoxicity is immunosuppression in the tumor micro-environment. It has been described
that tumors secrete pro-inflammatory cytokines capable of modulating immune responses
that favors the growth of tumor cells. Specifically, IL-1 plays a critical role in myeloid cell
recruitment and activation, which can in turn inhibit T cell activity in vivo. Moreover, IL-1 is
also known to up-regulate immune inhibitory molecules in the tumor micro-environment. To
further investigate the effects of IL-1 in melanoma progression, IL-1α was blocked in a highly
aggressive pre-clinical B16 melanoma tumor model in three different treatment settings: as a
monotherapy, in combination with checkpoint blockade, and in combination with adoptive T
cell therapy. In all three settings, IL-1α blockade resulted in tumor reduction and increase in
murine survival. This was accompanied by a decrease in myeloid cell tumor infiltration. At
early time points following IL-1 α blockade, these myeloid cells also demonstrated partial
loss of their immunosuppressive abilities, as supported by a decrease in arginase
production and inhibitory molecule expression. Moreover, monocytes demonstrated an
increase in co-stimulatory molecules following IL-1 α blockade. In vitro, the myeloid cells’
ability to inhibit T cell cytotoxicity was significantly compromised. These results collectively
provide evidence in support of IL-1 α contributing to melanoma immune suppression.
Antibody-mediated blockade of IL-1 α improved antitumor responses, suggesting that this
modality may improve outcomes of patients undergoing treatment with T-cell based
immunotherapies.
vi
Table of Contents
Approvals ............................................................................................................................. i
Title page ............................................................................................................................. ii
Acknowledgements ............................................................................................................ iii
Abstract ............................................................................................................................... v
Table of Contents ............................................................................................................... vi
List of Figures .................................................................................................................... ix
List of Tables ..................................................................................................................... xii
Chapter 1: Introduction and Background .......................................................................... 1
I. Immune Response ............................................................................................. 2
a. Neutrophils ............................................................................................. 2
b. Macrophages .......................................................................................... 3
c. Myeloid-derived suppressor cells ......................................................... 4
d. Adaptive Immune Response .................................................................. 5
e. T cells ...................................................................................................... 6
f. T cell activation ...................................................................................... 7
II. Melanoma ......................................................................................................... 10
a. Melanoma treatments ........................................................................... 11

vii
b. Checkpoint blockade ........................................................................... 11
c. Peptide vaccines .................................................................................. 13
III. Interleukin-1 .................................................................................................... 13
a. IL-1α biogenesis ................................................................................... 14
b. IL-1β biogenesis ................................................................................... 15
c. IL-1 signaling ........................................................................................ 19
d. IL-1α function........................................................................................ 20
e. IL-1β function........................................................................................ 21
f. IL-1 in cancer ........................................................................................ 21
Chapter 2: Specific Aims ................................................................................................. 24
Chapter 3: IL-1α blockade ................................................................................................. 27
I. Rationale .......................................................................................................... 28
II. Results .............................................................................................................. 28
III. Discussion ........................................................................................................ 65
IV. Material and Methods ...................................................................................... 67
Chapter 4: Anti-IL-1α in combination with checkpoint blockade and peptide vaccine
............................................................................................................................................ 70
I. Rationale .......................................................................................................... 71
viii
II. Results .............................................................................................................. 72
III. Discussion ........................................................................................................ 98
IV. Material and Methods .................................................................................... 100
Chapter 5: Discussion .................................................................................................... 104
References ....................................................................................................................... 113
Vita ................................................................................................................................... 121

ix
List of Figures
Figure 1: Activation of naïve CD8 T cells requires three signals ........................................... 9
Figure 2: IL-1β activation .................................................................................................... 17
Figure 3: Anti-IL-1α reduces tumor growth in B16-F10 murine model .................................. 30
Figure 4: Flow cytometric analysis of the immune component of the tumor micro-
environment after one week of IL-1α blockade .................................................................... 33
Figure 5: cyTOF analysis of the tumor micro-environment after IL-1α inhibition on day 7 .... 37
Figure 6: Pseudocolor density map of monocyte subsets .................................................... 40
Figure 7: Percentage of monocyte subsets in melanoma tumors on day 7 ......................... 41
Figure 8: Marker expression intensity heat map of monocyte subsets ................................ 42
Figure 9: Histogram of the expression profile of monocyte subsets .................................... 44
Figure 10: Macrophage subsets in melanoma tumors on day 7 ........................................... 46
Figure 11: Marker expression intensity heat map of macrophage subsets .......................... 47
Figure 12: Histograms of the phenotypic profile of macrophage subsets ............................ 49
Figure 13: IL-1α blockade decreases CD8+ T cell infiltrates in melanoma tumors on day 7 53
Figure 14: Neutralization of IL-1α modulates B cell subset composition on day 7 ............... 56
Figure 15: IL-1α inhibition decreases Arg-1 and NO in myeloid cells. ................................ 58
Figure 16: Gating strategy for isolating myeloid cells in the tumor ...................................... 59
Figure 17: Tumor killing assay experimental procedure ...................................................... 60

x
Figure 18: Tumor killing assay shows myeloid cells isolated from tumor treated with anti-IL-
1α have less effect on tumor killing ..................................................................................... 61
Figure 19: Percentage of monocytes and granulocytes out of total myeloid cells at day 7 and
termination day ................................................................................................................... 63
Figure 20: Percentage of macrophages out of total myeloid cells on day 7 ........................ 64
Figure 21: Arg-1 and NO production are similar at termination day in IgG and anti-IL-1α ... 65
Figure 22: Anti-IL-1α and anti-PD-1 delay tumor growth ..................................................... 75
Figure 23: Anti-IL-1α and anti-PD1 treatment modulates immune infiltration on day 7 ........ 76
Figure 24: Anti-IL-1α and anti-PD-1 modulate macrophage function on day 7 ..................... 79
Figure 25: Pseudocolor map of macrophage subsets on day 7 ........................................... 80
Figure 26: Macrophage subset percentages in anti-IL-1α and anti-PD-1 treated tumors .... 81
Figure 27: Marker expression intensity heat map of macrophage subsets .......................... 82
Figure 28: Marker expression histograms of macrophage subsets found in anti-IL-1α and
anti-PD-1 group .................................................................................................................. 83
Figure 29: IL-1α and PD-1 blockade decreases non-activated monocytes on day 7 ........... 87
Figure 30: IL-1α and PD-1 blockade promotes CD8+LY6C- T cells on day 7 ..................... 90
Figure 31: Anti-IL-1α and anti-PD-1 reduce CD4+ TIGIT+ T cells on day 7. ........................ 93
Figure 32: IL-1α blockade and peptide vaccine with naïve CD8+ T cells extends mice
survival to over 3 months .................................................................................................... 96
Figure 33: Flow cytometric analysis of the tumor micro-environment showing reduced
myeloid infiltration .............................................................................................................. 97

xi
Figure 34: Immune response of anti-IL-1α and peptide vaccine consists of predominantly
TNF-α producing CD8+ T cells ........................................................................................... 98
Figure 35: Myeloid cells infiltrate the tumor after two weeks of anti-IL-1α and vaccine
treatment. ........................................................................................................................... 99

xii
List of Tables
Table 1: cyTOF markers ..................................................................................................... 35

1
CHAPTER 1:
INTRODUCTION AND BACKGROUND

2
I. Immune response
The study of evolution in a variety of organisms has taught us that several biological
mechanisms are conserved and improved through the passage of time. The most basic
mechanism of defense is the innate immune system. The innate immune system represents
the pinnacle of evolutionary biology, in which generation after generation, we selected the
genes and machinery necessary to protect us from pathogens. This response is so versatile
and effective that it is conserved across plants, invertebrates, and mammals (1). The innate
immune system detects foreign bodies by using receptors encoded in our germline. These
receptors activate cell-dependent responses, soluble factors, complement factors, alarmins,
cytokines and chemokines, and other molecules responsible for instigating inflammation (2).
The innate immune response is triggered by the activation of pattern recognition receptors
(PRRs). A subtype of PRRs, toll-like receptors (TLRs), expressed on the surface of resident
epithelial cells and recruited hematopoietic cells, sense pathogen-associated molecular
patters (PAMPs) or microbe-associated molecular patterns (MAMPs) (3). Other important
PRRs are NOD-like receptors, complement receptors and scavenger receptors (4). Once
any of these receptors are activated, they start a downstream signal that leads to the
secretion of cytokines and chemokines involved in the recruitment of immune cells. Innate
immune cells, then, travel to the area of infection (5). Innate cells encompass an array of
myeloid and lymphoid cells. They tend to originate from hematopoiesis without antigen
receptors. The majority of cells do not develop memory (6). Although, new studies in natural
killer cells (NK cells) have introduced the concept of trained immunity based on memory
responses by NK cells (7).
a. Neutrophils
Neutrophils are the first cells recruited (2). They were considered as short-lived and
terminally differentiated phagocytic cells, without any role in the regulation of adaptive
3
immunity. However, these notions were challenged with newer studies. Observation of
circulatory neutrophils in healthy patients showed the average span of neutrophils to be
almost a week, more than 10 fold longer than previous estimates (8). Neutrophils were
found to be somewhat fluid, acting as myeloid derived suppressor cells (MDSCs) by
suppressing T cell expansion and cytokine production (9) ; therefore, having a role in
adaptive immunity.
The main role of neutrophils is as phagocytes. Phagocytosis is the process in which
small bacteria are engulfed by neutrophils. It usually occurs within minutes of infection.
Large organisms cannot be phagocytosed. Instead, neutrophils release granules that induce
death by degrading bacterial and fungal proteins (10). After prolonged exposure to
pathogens, neutrophils undergo cell death by apoptosis, necrosis or neutrophil extracellular
trap (NET) formation (10). Their death continues the inflammatory response by releasing
inflammatory cytokines.
b. Macrophages
Elie Metchnikoff, categorized macrophages as “the phagocytic component of the
immune system”. Since the discovery of macrophages, their function has expanded to the
phagocytosis of foreign bodies, the clearance of dead cells, production of inflammatory
cytokines and participation in homeostasis. Macrophages express an extensive variety of
PRRs capable of sensing microorganisms, danger signals, and changes in pH and oxygen
concentration (11). After activation, macrophages use several mechanisms to fight infection
and eventually stop the immune response. Macrophages have the ability to cross-talk with
other neighboring cells by releasing cytokines, chemokines and growth factors. Directly,
macrophages can have cell-to-cell interactions via their receptors and gap junctions (12). It
has been estimated that humans have approximately 200 billion macrophages (13). Tissue-
resident macrophages have a slow turn-over rate under homeostasis. They are established
4
during embryonic development. They are capable of self-renewal. Blood-circulating
monocytes can also differentiate into tissue-resident macrophages (14). Their self-renewal
abilities are not shared across all macrophage subtypes. Macrophages derived from the
intestine, pancreas, dermis, and heart tend to be replaced by circulating monocytes (Ly6CHi)
in a CCR2-dependent way (15). Macrophages have been classically separated into 2 unique
categories. M1 (classically activated macrophages) are activated by Th1 cytokines such as
IFNγ and bacterial factors. M2 (alternatively activated macrophages) are activated by Th2
cytokines like IL-4 and IL-13. M1 macrophages fight against bacterial function, while, M2
macrophages are part of anti-inflammatory, allergic and tissue repair processes (2). This
categorical separation does not hold in vivo due to the presence of both Th1 and Th2
priming factors. Therefore, the newest understanding is that macrophages exist across a
spectrum of phenotypes rather than as separate distinct subtypes (16). Macrophages can
easily go from one end to the other end of the spectrum with the appropriate stimulating
molecules. They also have an epigenetic plasticity (17). Macrophages exposed to
pathogens undergo epigenetic reprograming that establishes “innate immune memory” (18).
Their plasticity allows them to be an effective arm of the innate immune response.
c. Myeloid-derived suppressor cells (MDSCs)
As their name states, MDSCs are of myeloid origin. Their main function is to
suppress T cell responses. They can be categorized into polymorphonuclear (PMN-MDSC)
and monocytic MDSCs. In mice, they can be identified by their Ly6C (monocytic MDSCs)
and Ly6G (PMN-MDSCs) expression. In humans, the Ly6C and Ly6G markers do not
translate and, thus, the identification of these populations is more complicated. PMN-
MDSCs and monocytic MDSCs express CD11b and CD33. Monocytic MDSCs, also,
express CD14 and have low levels of MHC-II. PMN-MDSCs, on the other hand, have low
CD14, express CD15 and CD66b (19). Since their markers are found in other immune cells,

5
functional assays are necessary to ascertain their suppressive function. Moreover,
neutrophils tend to have similar markers as PMN-MDSCs, so their closeness has been
debated.
MDSCs have been heavily studied in mice due to their T cell suppression
capabilities. Several mechanism of suppression have been discovered. Bronte and Yang
described the ability of MDSCs to modulate angiogenesis and tumor cell motility by the
production of metalloproteinases (MMP) and vascular endothelial growth factor (VEGF) (20).
Corzo, found that this process is regulated by the transcription factor hypoxia inducible
factor (HIF)1α (21). Moreover, MDSCs polarize tissue macrophages into an M2 phenotype,
which promotes angiogenesis (22). MDSCs have also been found to suppress NK cell-
mediated lysis (23). There are several ways in which MDSCs inhibit T cells. They inhibit
antigen-dependent cytokine secretion in T cells (24), induce apoptosis in activated CD8+ T
cells via TNF and nitric oxide (NO) (25), secrete immunomodulatory molecules such as
TNF-α, H2O2, and TGF-β, and release enzymes involved in amino acid metabolism that are
used for T cell activation (arginine, tryptophan, and cysteine) (26-28). MDSCs can also
induce T regulatory cells (Tregs) (29). Hanson et al, showed how MDSCs disrupted T cell
homing to lymph nodes via L-selectin (30).
MDSCs stifle the activation of the adaptive and innate immune response.
d. Adaptive Immune Response
Even though the innate response is effective in eliminating a variety of organisms,
the number of molecular patterns it can recognize is limited (31). The ability of pathogens to
mutate and evolve forced the development of the adaptive immune response (32). The main
feature of the adaptive immune system is the wide receptor repertoire specificity created by
somatic recombination of gene segments (31). This mechanism evolved from gene

6
duplication in early vertebrates to generate highly specific and flexible responses (31).
Another key feature, is the ability to gain memory. Cells with antigen-specific receptors can
persist for life. T cells and B cells are the two main types of cells in the adaptive immune
response.
e. T cells
T cells develop in the thymus from common lymphoid progenitor cells (33). Common
lymphoid progenitor cells travel from the bone marrow or fetal liver to the thymus. In the
thymus, they begin to expand via IL-7 induction. Mutations in the IL-7 receptor, lead to
deficiency in T cells. Expansion of common lymphoid progenitor cells activate Notch-1 and
other transcription factors involved in T-cell lineage commitment and up-regulation of the
expression of genes responsible for T-cell receptor (TCR) assembly (34). T cells undergo an
antigen-independent differentiation process, in which genetic rearrangements create
functional genes that encode the α/β chains or the γ/δ chains of the TCR. The TCR loci has
arrays of V (variable), D (diversity), and J (joining) segments. β and δ TCR loci contain V, D,
and J segments. The rest only have V and J segments. In a serial process, one V, one D
(for β, δ), and one J segment are randomly spliced. The spliced recombination is mediated
by the V(D)J recombinase, which consists of 2 proteins encoded by the recombinase-
activating genes 1 and 2 (RAG1 and RAG2). RAG1 and RAG2 bind to the recombinase
signal sequences flanking the edges of V-D-J segments. The structure of chromatin
regulates the accessibility of the signal sequence (35). The V(D)J recombinase cuts the
DNA at the signal sequences to get hairpin structures. Artemis then cleaves these
structures. The DNA breaks are repaired in a process called nonhomologous end-joining,
creating a variety of V(D)J combinations. The resulting V(D)J cassette dictates the amino
acid sequence and binding specificity of the TCR (35). This is called combinatorial diversity.
Junctional diversity, is obtained when bases are added or removed during the repair of

7
DNA. Created junctional areas encode the region of the antigen-binding pocket of the TCR
(35).TCR rearrangements are successful when no stop codons are introduced and a TCR
protein can be translated. This turns a pre-T cell to a double-positive T cell. Double positive
T cells express both CD4 and CD8. Transition from a double positive T cell to a single
positive T cells requires positive and negative selection. Positive selection happens when
the TCR binds with low avidity to self-MHC-Peptide complex. Cells that do not bind to self-
MHC are eliminated. In negative selection, cells that bind with high avidity to self-MHC are
eliminated. Cells that pass either selection differentiate to CD8+ or CD4+ T cells depending
on their interaction with MHC class I (CD8) or MHC class II (CD4). Single positive cells exit
the thymus and enter into circulation as naïve T cells.
f. T cell activation
T cells are activated after successful TCR-peptide-MHC engagement. CD8+ T cells
can recognize peptides between 9-11 amino acids in length bound to MHC class I (HLA-A,
HLA-B, and HLA-C). MHC-class I peptides are produced from endogenous protein encoded
by either the host or pathogen. CD4+ T cells recognize MHC-II restricted peptides (HLA-DR,
HLA-DQ, and HLA-DP). MHC class II molecules are expressed on the surface of antigen
presenting cells (APCs). APCs roam in the host sampling environmental antigens and
danger signals (35). They phagocytose or endocytose exogenous proteins and then present
them on their surface via MHC class II molecules. After APC activation, these cells travel to
regional lymph nodes, where they present antigen to T cells. An immunological synapse is
formed when the TCR associates with the peptide-MHC complex. Several TCR-associated
molecules start clustering at the boundary between T cell and APC (immunological synapse)
(36). The CD4/CD8 molecules stabilize the CD3-TCR-MHC complex by binding it to
nonpolymorphic regions of MHC. Integrins stabilize the immune synapse.

8
T cell activation is a three-signal process. Signal one consists of the recognition of
the peptide-MHC complex on APCs by the TCR (37). This is an antigen-dependent process
that starts the tyrosine phosphorylation of ITAMS located on the cytoplasmic tails of the
TCR-CD3 complex, which leads to the initiation of a signaling cascade that activates NFAT
and NF-κB pathways, involved in T cell effector function (38). Signal one, alone, may cause
T cells to become anergic and apoptotic (39). Signal two is co-stimulation. The most studied
co-stimulatory axis is between CD80/CD86 on APCs with CD28 receptor on T cells (40).
CD80/CD86-CD28 interactions modulate the scale of T cell response, triggering clonal
expansion, differentiation and up-regulation of anti-apoptotic genes (BCL-2 and Bcl-XL) (41).
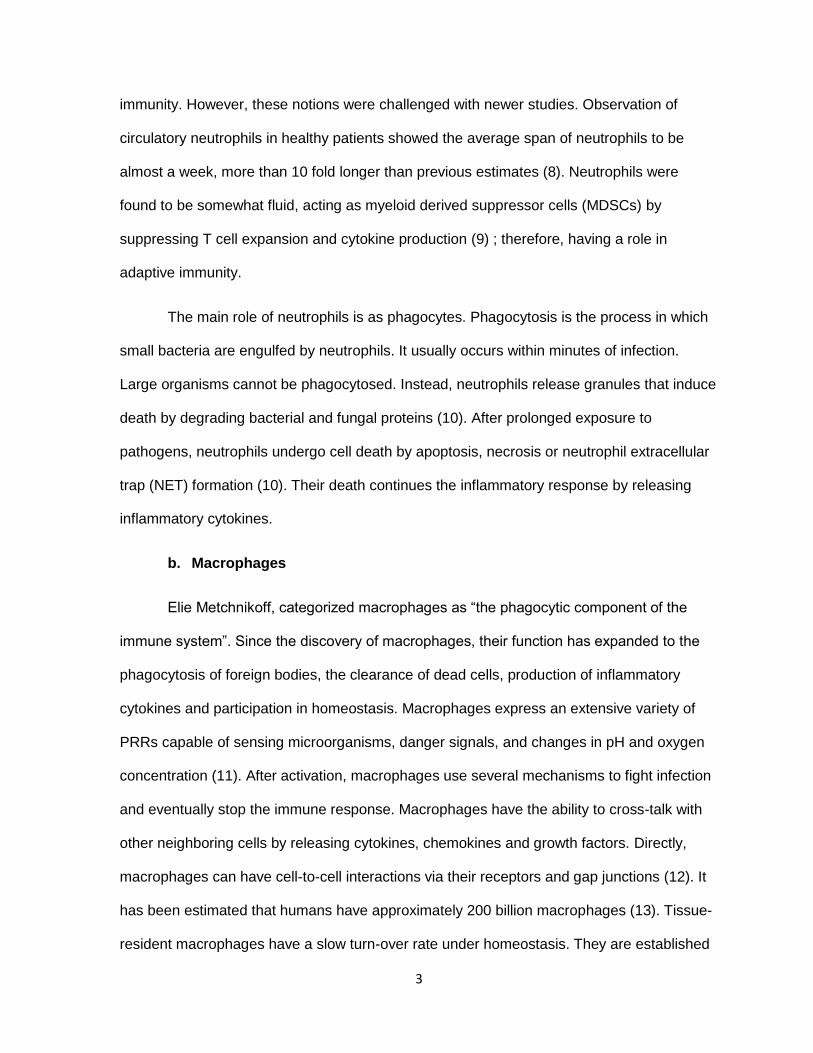
Finally, signal three is cytokine dependent. In 2010, Curtsinger and Mescher, suggested that
signals 1 and 2 were not sufficient to sustain clonal expansion, effector function and the
creation of memory populations (Figure 1) (42). Cytokines such as IL-12 and Type I IFN,
sustain the transcription of factors and regulation of genes involved in differentiation and
function. Altogether, all three signals are necessary for optimal T cell response.
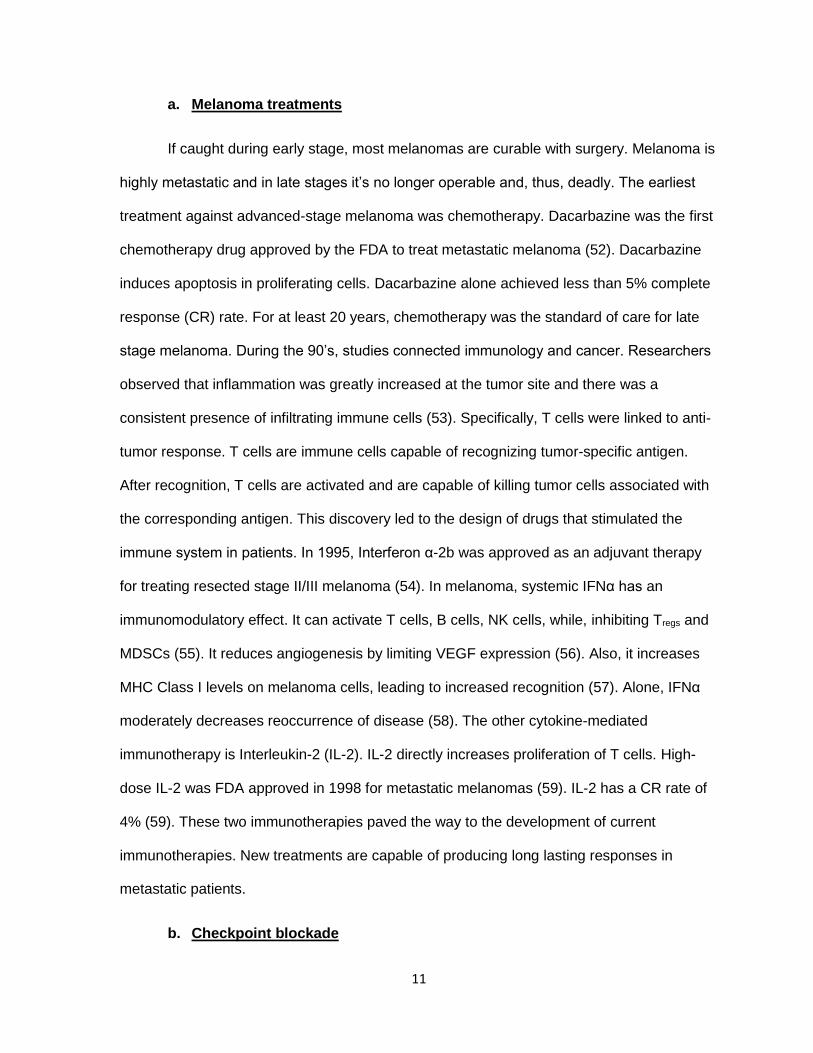
9
Figure 1: Activation of naïve CD8 T cells requires three signals. Ag, co-stimulation, and
either IL-12 or IFNα/β. Stimulation with Ag and B7-1 results in extensive proliferation, but
survival is compromised and development of effector functions is suboptimal. The small
numbers of cells that survive long term are anergic. When either IL-12 or IFNα/β is present,
proliferation is comparable but survival is increased, the cells develop strong effector
functions, and a protective memory population is formed. Reused by permission from
Elsevier Publisher Ltd. Curtsinger, J.M. and M.F. Mescher, Inflammatory cytokines as a third
signal for T cell activation. Curr Opin Immunol. Ref 23. Copyright © 2010.
10
II. Melanoma
Cutaneous melanoma is the deadliest type of skin cancer. It accounts for only 1% of
all cases observed. In the United States, it has been estimated that almost 100,000 patients
will be diagnosed with melanoma, and 10,000 will succumb to the disease (43). Melanoma
occurrence differs greatly among countries, but certain risk factors have been linked to the
disease. Racial skin features, sun exposure, gender and age are the most common linking
factors in patients. Patients with low levels of melanin in their skin are more sensitive to UV
rays, which cause inflammation in the skin. Excessive UV exposure can lead to DNA
damage and genetic mutations. The most affected pathways are cell proliferation (BRAF,
NRAS, and NF1), growth and metabolism (PTEN, and KIT), and apoptotic resistance (TP53,
CDKN2A, and TERT) in melanocytes (44). Current statistics show that incidence rate
increases in younger patients (median age of 57 years) compared to other cancers (44).
These patients are associated with intermittent sun exposure, BRAF mutation and a low
mutation load. Chronical sun exposure is most commonly associated with older patients.
These melanomas are driven by BRAF, NF1 and NRAS mutations and have a high
mutational load (45). Gender also plays a role, female patients comprise the majority of
cases seen in the younger age group. Meanwhile, male patients are more prominent in the
older than 55 group (46). Other lesser factors associated with melanoma are pre-existing
nevi (commonly known as moles) and family history. Bevona et al showed that 26% of
melanoma cases appeared on a pre-existing nevi (47). Only 5-12% of melanomas are
inherited (48). The two genes related to inherited melanoma are cyclin-dependent kinase
inhibitor 2A (CDKN2A) and cyclin-dependent kinase 4 (CDK4). CDKN2A is a tumor
suppressor gene that is involved in the production of p16 and p14 (49). P16 and p14 are
both involved in cell cycle regulation (50). CDK4 mutation inhibits cell cycle regulation by
p16 (51).
11
a. Melanoma treatments
If caught during early stage, most melanomas are curable with surgery. Melanoma is
highly metastatic and in late stages it’s no longer operable and, thus, deadly. The earliest
treatment against advanced-stage melanoma was chemotherapy. Dacarbazine was the first
chemotherapy drug approved by the FDA to treat metastatic melanoma (52). Dacarbazine
induces apoptosis in proliferating cells. Dacarbazine alone achieved less than 5% complete
response (CR) rate. For at least 20 years, chemotherapy was the standard of care for late
stage melanoma. During the 90’s, studies connected immunology and cancer. Researchers
observed that inflammation was greatly increased at the tumor site and there was a
consistent presence of infiltrating immune cells (53). Specifically, T cells were linked to anti-
tumor response. T cells are immune cells capable of recognizing tumor-specific antigen.
After recognition, T cells are activated and are capable of killing tumor cells associated with
the corresponding antigen. This discovery led to the design of drugs that stimulated the
immune system in patients. In 1995, Interferon α-2b was approved as an adjuvant therapy
for treating resected stage II/III melanoma (54). In melanoma, systemic IFNα has an
immunomodulatory effect. It can activate T cells, B cells, NK cells, while, inhibiting Tregs and
MDSCs (55). It reduces angiogenesis by limiting VEGF expression (56). Also, it increases
MHC Class I levels on melanoma cells, leading to increased recognition (57). Alone, IFNα
moderately decreases reoccurrence of disease (58). The other cytokine-mediated
immunotherapy is Interleukin-2 (IL-2). IL-2 directly increases proliferation of T cells. High-
dose IL-2 was FDA approved in 1998 for metastatic melanomas (59). IL-2 has a CR rate of
4% (59). These two immunotherapies paved the way to the development of current
immunotherapies. New treatments are capable of producing long lasting responses in
metastatic patients.
b. Checkpoint blockade
12
Checkpoint blockade is based on the concept of improving immune response against
tumor cells by inhibiting the mechanism responsible for inhibiting T cell activation. Prolonged
T cell activation is tightly regulated by several factors most importantly, CTLA-4 and PD-1.
Rampant and unchecked T cell activation can cause autoimmunity.
During the 80s, Brunet et al, identified a molecule currently known as CTLA-4. It took
almost a decade for its function to be described by Allison’s group in 1995. CTLA-4 is a
member of the immunoglobulin superfamily and is solely expressed on T cells (60). CTLA-4
expression is induced upon TCR engagement. Initially, CTLA-4 is expressed intracellularly.
After TCR activation and co-stimulation by CD28, CTLA-4 translocates to the surface of T
cells, where it competes with its homologous receptor, CD28, for binding against CD80 and
CD86 on the surface of APCs (61). CTLA-4 has a higher avidity and affinity with CD80 or
CD86 than CD28 leading CTLA-4 to outcompete CD28 (62). Attenuation of downstream
CD28 signaling decreases T cell activation and proliferation (63). Mechanistically, CTLA-4
ligation reduces IL-2 production and arrests cell cycle progression (64).
Tregs constitutively express CTLA-4. Loss of CTLA-4 in Tregs, leads to an abnormal
activation of conventional T cells, stressing the role of CTLA-4 in Treg-mediated tolerance.
The other prominent T cell inhibitor is programmed cell death protein 1 (PD-1). PD-1
is homologous to CD28 and is involved in inhibiting immune signaling (65) T cells
constitutively express PD-1, except naïve T cells. B cells, myeloid dendritic cells, mast cells
and Langerhans cells also express PD-1. PD-1 has 2 ligands, PD-L1 and PD-L2. PD-1
ligands are often found on the surface of APCs (66). IFNγ is the main inducer of PD-L1 and
PD-L2 (67). PD-1 has an immunoreceptor tyrosine-based inhibition motif (ITIM) and in
imunoreceptor tyrosine-based switch motif (ITSM) on its cytoplasmic tail (68). Upon PD-1
activation, ITSM becomes phosphorylated and induces the recruitment of the Src homoly
region 2 domain-containing phosphatase 2 (SHP-2). The PD-1-SHP-2 complex can
13
dephosphorylate CD28, thus inhibiting CD28-CD80/CD86 signaling, resulting in reduced T
cell proliferation and cytokine production. PD-1 activity is only relevant during simultaneous
T cell activation (68). PD-1 works in maintaining tolerance.
Both anti-CTLA-4 and anti-PD-1 have shown increased patient survival in a variety of
cancers. A phase III clinical study showed that anti-PD-1 resulted in better response (44%)
compared to CTLA-4 (19%) in melanoma patients. Combination of anti-CTLA-4 and anti-PD-
1 has a response of 58% (69).
c. Peptide vaccines
Vaccination has proven effective in fighting pathogens (70). Vaccines consists of
injecting inactivated forms of microbes to induce an antigen-specific response to protect
against future infections. These types of vaccines contain hundreds of proteins; however,
only a few offer immunity. Peptide vaccines are a specialized form of vaccine, in which
known antigenic-peptides are used to trigger an immune response. To date several peptide
vaccines have been designed to stimulate CD8+ T cell cytotoxicity against pathogens.
Peptides alone are not sufficient to trigger a robust immune response so adjuvants were
developed to improve the immune response to peptide vaccines. The most common
adjuvant in the clinic is Freunds complete adjuvant (CFA). CFA contains inactivated and
dried mycobacteria. In this manner we can increase humoral and cellular immunity.
Melanoma’s high mutation load makes it easier to find potential candidates to use as a
peptide vaccine. For instance, gp100 is a peptide found on a majority of melanoma cells and
is currently being used as a peptide vaccine.
III. Interleukin-1
The discovery of the first interleukin started from studies trying to isolate endogenous
factors responsible for causing fever in patients. Elisha Atkins reported that a protein

14
appeared in circulation during endotoxin fever and coined the term “endogenous pyrogen”
(71). Atkins, Murphy and Wood, went on to study the molecular properties of pyrogen
isolated from rabbit neutrophils (72). Eventually, Atkins and Bodel moved to human PBMCs
and reported that unlike in rabbit peritoneal cells, pyrogens in human PBMCs were
synthesized de novo, and therefore were not present during homeostasis (73). Bodel also
showed that pyrogen could also be secreted by monocytic leukemia cells and Hodgkin’s and
lymphoma cells (74). In parallel, Dinarello, was, also, trying to isolate the soluble pyrogen. In
1977, his lab isolated pyrogen and named it, human leukocytic pyrogen (LP) (75).
Endogenous pyrogen and human leukocytic pyrogen are different labels to describe the
properties of what we now call Interleukin-1. Later findings demonstrated the potent ability of
IL-1 to induce a fever with levels as low as 1-10ng/kg (76).
Klampschmidt et al, were the first to propose that individual factors in the
supernatant of leukocytes had more than one function (77). Dinarello, showed that human
IL-1 could stimulate the production of serum amyloid A (78). Thus, IL-1 became a pleotropic
molecule and started cytokine biology.
With the invention of cDNA cloning, scientists were able to identify two distinct
molecules with pyrogenic properties. They both had similar molecular weights, but had
different isoelectric points. One of the molecules had a pI of 7, which was the recorded pI of
IL-1 (79). The other had a pI of 5 (79). We now call pI5 IL-1α and pI7 IL-1β.
a. IL-1α biogenesis
ProIL-1α is the 31Kda precursor to IL-1α. ProIL-1α is customarily found intracellularly
and has been described to be active. The precursor is synthesized in association with
microtubules (80). ProIL-1α is released when cells undergo necrosis and can then be
cleaved by extracellular proteases. In the absence of necrosis, calpain, a calcium-
15
dependent cysteine protease is also capable of cleaving ProIL-1α into its 17kDa mature
form (81).
b. IL-1β biogenesis
Contrary to IL-1α, the precursor of IL-1β is not active and requires further processing
for optimal function. ProIL-1β is cleaved by caspase-1. Since both IL-1 precursors lack a
signaling peptide, they cannot go through the endoplasmic reticulum-golgi pathway for
secretion. During infection or cellular stress, the inflammasome, a 700kDa multi-protein
complex is formed to help mediate the cleavage of ProIL-1β. Several types of
inflammasomes have been discovered. They all have a distinctive NOD-like receptor (NLR).
These are soluble intracellular proteins that survey for foreign bodies. NLRs are multidomain
proteins with a tripartite architecture which have a C-terminal region containing a series of
leucine-rich repeats, a central region known as the NACHT domain, and an N-terminal
effector domain (82). The N-terminal effector domain is responsible for transmitting the
signal downstream which prompts caspase activation. NLRs are categorized into several
subfamilies. NALP1, NALP2, and NALP3 are known to be the part of caspase-1-related
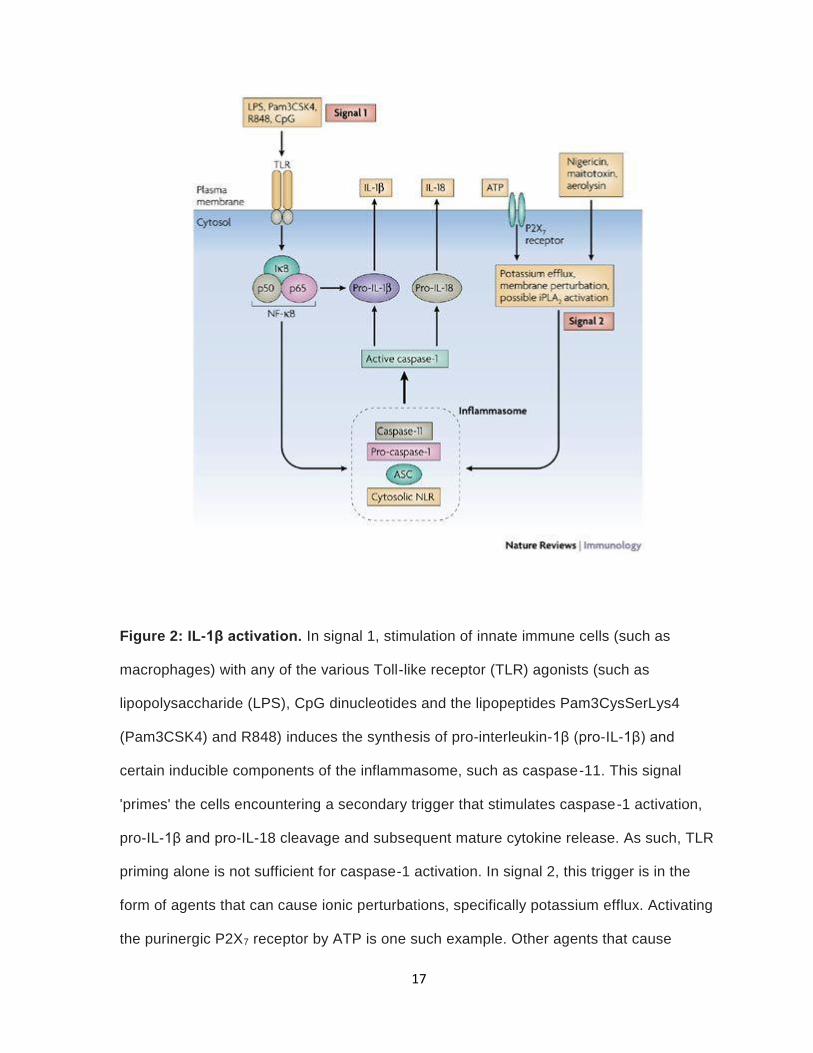
inflammasomes (83). Inflammasomes are triggered by danger signals. IL-1β synthesis and
processing requires two signals. The first signal can be initiated by Toll-like receptor (TLR)
activation, which results in the production of ProIL-1β. Common activators are LPS, CpG,
and resiquimod (84). The second signal can be obtained by the activation of P2X7 receptor
by ATP (85). P2X7 activation leads to potassium efflux, plasma-membrane depolarization,
cell swelling and disaggregation of the cytoskeletal network (84). Studies have shown that
loss of potassium is necessary to trigger caspase-1 (86). Reduction in potassium levels
activates calcium-independent phospholipase A2 (iPLA2) (figure 2) (87). Walev, noted that
inhibiting iPLA2 stopped IL-1β processing (87). The two signal requirement for IL-1β
16
synthesis guarantees that inflammation is only induced during infection or tissue injury (84).
Dysregulation of this process leads to autoimmune diseases.
Mature IL-1β is released by two separate mechanisms. Andrei et al, illustrates how
IL-1β is loaded into secretory lysosomes and eventually released in a phospholipase-
dependent way (88). Otherwise, IL-1β is externalized by the budding of microvesicles (89).
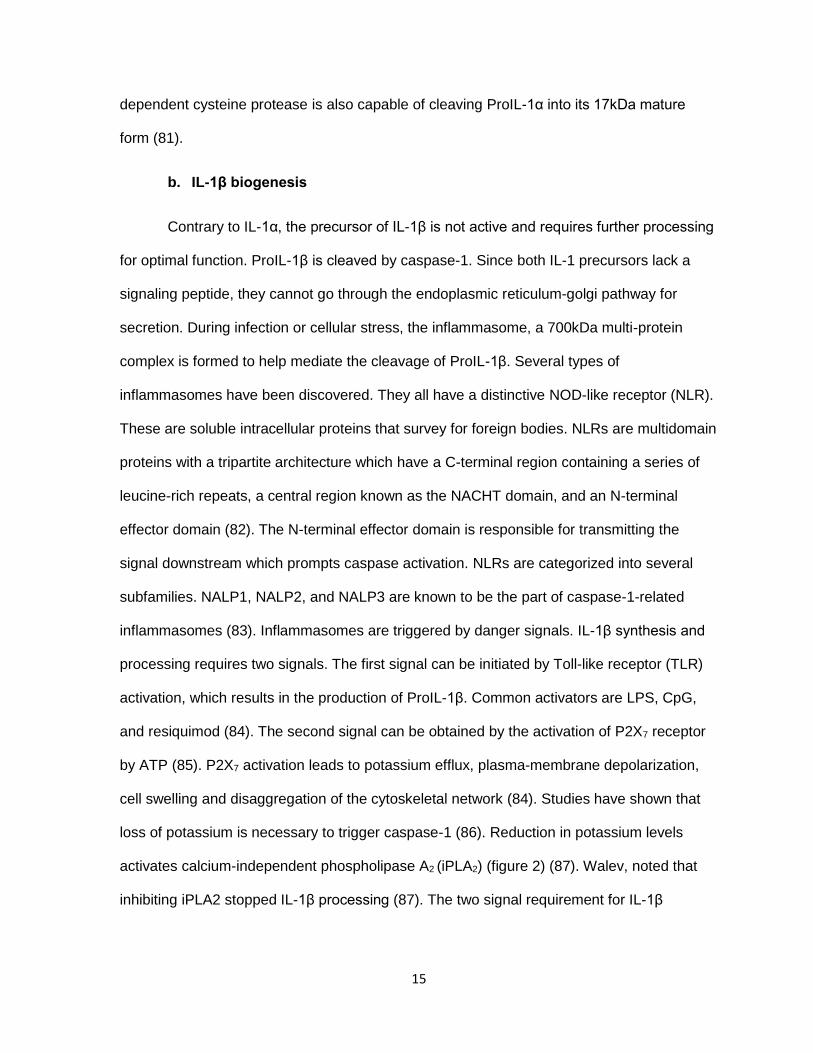
17
Figure 2: IL-1β activation. In signal 1, stimulation of innate immune cells (such as
macrophages) with any of the various Toll-like receptor (TLR) agonists (such as
lipopolysaccharide (LPS), CpG dinucleotides and the lipopeptides Pam3CysSerLys4
(Pam3CSK4) and R848) induces the synthesis of pro-interleukin-1β (pro-IL-1β) and
certain inducible components of the inflammasome, such as caspase-11. This signal
'primes' the cells encountering a secondary trigger that stimulates caspase-1 activation,
pro-IL-1β and pro-IL-18 cleavage and subsequent mature cytokine release. As such, TLR
priming alone is not sufficient for caspase-1 activation. In signal 2, this trigger is in the
form of agents that can cause ionic perturbations, specifically potassium efflux. Activating
the purinergic P2X7 receptor by ATP is one such example. Other agents that cause

18
membrane blebbing and pore formation similar to those elicited by P2X7 receptor
stimulation include nigericin (a potassium ionophore), maitotoxin (a potent marine toxin
that is derived from dinoflagellates) and aerolysin (a pore-forming toxin from Aeromonas
hydrophila). Potassium depletion mediates IL-1β processing through the activation of
calcium-independent phospholipase A2 (iPLA2). TLR priming (for example, by LPS pre-
stimulation) of macrophages 'accelerates' caspase-1 processing. In addition, LPS priming
results in IL-1β release, which is due to de novo synthesis of pro-IL-1β. However, ASC
(apoptosis-associated speck-like protein containing a CARD), pro-caspase-1 and pro-IL-
18 are constitutively present in large quantities in macrophages and do not require LPS-
mediated upregulation. IκB, inhibitor of NF-κB; NF-κB, nuclear factor-κB; NLR, NOD-like
receptor. Reused by permission from Springer Nature. Mariathasan, S. and D.M. Monack,
Inflammasome adaptors and sensors: intracellular regulators of infection and inflammation.
Nat Rev Immunol, 2007. 7(1): p. 31-40. Copyright © 2007.
19
c. IL-1 signaling
Due to the potent nature of IL-1, there are three main regulatory checkpoints. The
first is the control of synthesis and secretion of IL-1 covered in the earlier section (82). The
second is the expression levels of the IL-1 family receptors on the surface of cells (90). The
last checkpoint, involves the regulation of the downstream signaling after receptor activation
(90). Both IL-1α and IL-1β bind to the same receptor, type I IL-1 receptor (IL-1R1).
Successful IL-1 signaling, requires the IL-1/IL-1R1 complex to bind to a second receptor, IL-
1 receptor accessory protein (IL-1RAcP). At the receptor level, there exists two inhibitory
molecules. IL-1 receptor antagonist (IL-1RA) is a ligand of IL-1R1 and has a similar affinity
to IL-1. Binding of IL-1RA to IL-1R1 does not trigger the activation of the receptor. The other
is the type II IL-1 receptor (IL-1R2). IL-1R2 lacks the cytoplasmic signaling machinery, so
binding of IL-1 with IL-1R2, does not induce the activation of the IL-1 pathway (90).
When IL-1 binds to IL-1R1, IL-1R1 undergoes a conformational change in the first
extracellular domain to recruit IL-1RAcP (91). The IL-1R1/IL-1RAcP complex contains
conserved cytosolic regions called Toll- and IL-1R1-Like (TIR) domains (92). After activation,
myeloid differentiation primary response gene 88 (MYD88) and interleukin-1 receptor-
activated protein kinase (IRAK) 4 bind to the TIR domains on the complex (93). IRAK4, then,
auto phosphorylates leading to the phosphorylation of IRAK1 and IRAK2 (94). Tumor
necrosis factor-associated factor (TRAF) 6 is recruited and oligomerizes with the complex
(95). IRAK1, IRAK2 and TRAF6 detach from the receptor complex and are released in the
cytoplasm. TRAF6 mediates the attachment of K-63 linked polyubiquitin chains to several
IL-1 signaling factors, including IRAK1, transforming growth factor-β (TGF-β)-activated
protein kinase-binding protein (TAB2), TAB3 and TGF-β-activated protein kinase (TAK1)
(96) (97, 98). Ubiquitination of TAK1 helps it associate with TRAF6 and MEKK3 (99). Pellino
homolog (PELI) 1-3 are ubiquitin E3 ligases that bind to IRAK1, 4 and are then
20
phosphorylated by the IRAKs. The combination of these proteins activate the NF-κB, c-Jun
N-terminal kinase (JNK), and p38 MAPK pathways (100, 101). The order of events is still not
well understood. NF-κB binds to a conserved motif in several IL-1 responsive genes such as
IL-6 (102), IL-8, monocyte chemoattractant protein 1 (MCP1) (103), and cyclooxygenase-2
(COX-2) (104).
The IL-1 signaling pathway is short-lived. IL-1R binds to the adaptor toll-interacting
protein (TOLLIP). TOLLIP, then, stops IRAK1 and facilitates the internalization of IL-1R1 to
endosomes (105). There are also negative feedback loops in IL-1 signaling. For instance,
phosphorylation of TAB1 inhibits TAK1 (106), synthesis of IκBα turns off the NFκB pathway
(107), MAPK phosphatase I (MKP1) dephosphorylates MAPKs.
d. IL-1α function
As established earlier, ProIL-1α is biologically functional in the cytosol. During
necrosis it acts as an alarmin triggering an immune response. This response can be
modulated by the sequestration of ProIL-1α by IL-1R2 (108). This is important in order to
differentiate between necrosis and apoptosis. Under normal apoptotic conditions, ProIL-1α
is sequestered, to avoid inflammation (109).
IL-1α can start an inflammation loop, wherein IL-1α can start the production of more
IL-1α and IL-1β. Membrane-bound IL-1α can induce IL-1 signaling pathway in nearby
immune cells (110). IL-1α can induce the expression of other cytokines needed for the
recruitment of immune cells to the inflammation site. The cells, in turn, make more IL-1. The
IL-1 signaling continues until it’s inhibited (110). The paracrine signaling does not only affect
immune cells. It has been demonstrated that in systemic sclerosis, fibroblasts produce high
levels of IL-1α, which in turn upregulates the expression of IL-6, PDGF-α, IL1R1, and
collagen (111).

21
IL-1α is known to induce other pro-inflammatory cytokines such as COX-2, inducible
nitric oxide synthase (iNOS), IL-6, IL-8, and MMPs. Moreover, IL-1α can increase the
expression of adhesion molecules on endothelial cells, stromal cells and leukocytes, in order
to facilitate cell migration (112).
e. IL-1β function
IL-1β has similar effects as IL-1α in the proliferation and differentiation of innate
immune cells. However, studies in the past decade have been able to elucidate different
functions between the two molecules. Paul et al, has shown that IL-1β can induce the
proliferation of naïve and memory CD4+ T cells after antigen recognition (113). For the
expansion to take place, T cells must express IL-1R1 on their surface. Members of the IL-1
family can interact with individual STATs to promote a specific phenotype (114). IL-1β in
association with STAT3 induces Th17 cells. IL-33 and STAT5 can start a Th2 response,
while, IL-18 and STAT4 a Th1 response. Ben-Sasson et al, published the effects of IL-1 in
the activation of antigen-specific CD8+ T cells, demonstrating its function as an adjuvant
(115).
IL-1β, also, plays a role in hematopoiesis. IL-1β can up-regulate the expression of
receptors for colony-stimulating factors (CSFs) on precursor cells (116). In this manner, IL-
1β can promote the differentiation and expansion of myeloid-derived suppressor cells
(MDSCs), during inflammation (117). MDSCs differentiate into a variety of cells including,
macrophages, granulocytes (112).
f. IL-1 in cancer
In cancer, IL-1α has several functions. It can induce fever, fenestrations in the
vasculature, prostaglandins, pituitary hormones, and collagenases (118). IL-1 can also
boost the immune system by increasing the infiltration of leukocytes to the tumor. Due to the

22
varied functions of IL-1, IL-1 can be either beneficial or disadvantageous in a cancer setting.
The ability to increase inflammation can be used by tumor cells to promote malignancy.
Cancer cells can produce IL-1 (autocrine) and can also induce IL-1 in other cells in a
paracrine fashion. IL-1β has been found in a variety of cancers such as breast, head and
neck, colon, melanoma, etc (119). Patients with IL-1β+ tumors have a decreased survival
rate. The exact mechanism of how IL-1 promotes malignancy has still not been fully
elucidated, although, the consensus is that IL-1 acts indirectly. For example, IL-1 can
promote metastases by up-regulating MMPs, VEGF, IL-8, IL-6, TNF-α and TGF-β. In IL-1
knockout mice, melanoma tumors tend to not establish subcutaneously after inoculation. If
tumors grow, survival is increased due to less lung metastasis. These studies highlight the
importance of IL-1 in angiogenesis, and the extravasation of tumor cells. Saijo et al,
demonstrated that Lewis lung carcinoma cells transduced with IL-1β had no significant
increase in proliferation in vitro (120). Nevertheless, in vivo, these cells, had a higher tumor
growth rate. IHC staining proved that these tumors had more microvessels compared to the
control. The increase in angiogenesis was explained by the elevated expression of VEGF,
and macrophage-inflammatory protein-2 (MIP-2) (120). In other studies, supernatants from
melanoma cell lines (high vs low IL-1) were used to study the effect of IL-1 in endothelial cell
permeability (121). Supernatant from the high IL-1 expression cell line, could increase cell
permeability and the effect was reversed when using IL-1Ra, the IL-1 agonist. IL-1Ra has
also been used to inhibit VEGF production in a colon carcinoma animal model. Another
point to note is the importance of tumor-derived IL-1 in the effectivity of IL-1Ra. SMEL (High
IL-1) and PMEL (low IL-1) melanoma cells were transduced with IL-1Ra and injected into
mice. Only SMEL tumors had a significant reduction in the tumor growth rate. Another
animal study, evaluated systemic administration of IL-1Ra to mice injected with human
cancer xenografts (122). Similar to the previous study, only tumors that had significant levels
of IL-1 responded to the IL-1Ra treatment. These studies suggest the indirect role IL-1 plays
23
in tumorigenesis and the importance of cross-talk between the tumor and the
microenvironment. Lizee et al, described how oncogenes can up-regulate the expression of
IL-1 in melanocytes. Our lab showed that mutant B-RAF significantly increased pro-
inflammatory cytokines including IL-1α/β, IL-6, and IL-8 (123). Co-culture of recombinant IL-
1 with human fibroblasts demonstrated the ability of IL-1 to induce inhibitory molecules on
stromal cells, such as PD-L1, PD-L2 and COX-2. Thus, revealing another function of IL-1 on
the tumor micro-environment.
In some cancers IL-1α, has anti-tumor properties. Fibrosarcoma cells transduced
with IL-1α rarely grow in immune-competent mice. Tumors that grow regress in a mostly
CD8+ T cell-mediated fashion. In this scenario, IL-1α acts as an adjuvant for CD8+ T cells
(124). Furthermore, increase of adhesion molecules, allows for better cell to cell interactions,
improving cytotoxicity.
The dual ability of IL-1 to induce pro- and anti-tumor effects makes it an interesting
target to study and modulate. Proper regulation of the expression of IL-1 could tilt the tumor-
microenvironment.

24
CHAPTER 2:
SPECIFIC AIMS
25
Rationale
Research from our lab demonstrated that melanoma cells up-regulate IL-1
expression via the aberrant activation of the MAPK pathway by mutated B-raf. Culturing IL-1
with tumor-associated fibroblasts resulted in an increase in inhibitory molecules, PD-L1, PD-
L2, and COX-2. Therefore, we suggested a potential mechanism on how tumor cells can
modulate immunosuppressive factors on neighboring cells via IL-1 induction. Moreover,
research has shown that IL-1 is one of the main drivers of innate response, recruiting
neutrophils and other immune cells into sites of inflammation. Therefore, we were interested
in understanding how IL-1α affected melanoma tumor development. We hypothesized that
IL-1α increases immunosuppression in the tumor by promoting the presence of suppressive
cells and factors. We tested our hypothesis by answering the following aims:
Aim 1: Investigate the effect of IL-1α in the melanoma tumor micro-environment during early
tumor development.
Aim 2: Evaluate the clinical potential of anti-IL-1α treatment in combination with other
immunotherapies in melanoma.
We used an anti-IL-1α antibody to demonstrate that blocking IL-1α delays tumor
growth. Moreover, we used mass cytometry to illustrate that IL-1α inhibition decreases anti-
inflammatory myeloid cells during early tumor progression. Analysis of these cells ex-vivo
showed that they had a decreased capacity to inhibit T cell activity via Arg-1 and NO.
Furthermore, we showed that anti-IL-1α effect is not sustained and eventually the tumor
activates alternates pathways to increase myeloid-derived suppressor cells. Results from
our first aim indicated that anti-IL-1α could potentially synergize with T-cell-mediated
immunotherapies. We hypothesized that the decrease of anti-inflammatory cells in the tumor
micro-environment would improve the function of CD8+ T cells in conjunction with checkpoint

26
blockade or peptide vaccine and T cell therapy. Furthermore, we demonstrated that the
combination of anti-IL-1α and anti-PD-1 slowed down tumor growth. Similarly as in anti-IL-1α
monotherapy, in the combination group the major changes observed in the tumor micro-
environment were in the myeloid cells. Our most promising anti-tumor response, was
obtained from combining anti-IL-1α and peptide vaccine with T cell therapy. This
combination increased survival of mice by over 3 months. The effect was obtained due to
the high CD8+ T cell infiltrate and reduced myeloid cell density during the first week after
vaccine treatment.

27
CHAPTER 3:
IL-1α BLOCKADE
28
I. Rationale
To evaluate the effects of IL-1α during tumor progression, we contacted the
company, XBIOTECH, to use the murine equivalent, Flo1-2a, of their human IL-1α
neutralizing antibody. MABp1, is the first true human antibody that targets IL-1α. In a phase
1 clinical trial, MABp1, was found to be well tolerated by patients with no significant side
effects. The trial resulted in metastatic cancer patients having stable disease and some
partial response after treatment (125).
We treated C57BL/6 mice that had been inoculated with B1- F10 melanoma cells
and tracked the changes in the tumor micro-environment, specifically in immune cells. We
hypothesized, that in the B16 melanoma mouse model, IL-1α contributed to
immunosuppression and inhibition of IL-1α would lead to an increase in the immune
response by restructuring the tumor-microenvironment. Understanding how IL-1α
orchestrates the infiltration of immune cells into the tumor will help us understand how
tumors use IL-1α to evade immune responses. Moreover, the insight gained will help us
develop improved therapies for cancer.
II. Results
a. Anti-IL-1α reduces tumor growth in the B16-F10 murine model
As mentioned in the introduction, Weinreich et al, published studies where they
determined that inhibition of IL-1 in vivo was only effective against tumors that expressed IL-
1. We, determined that our B16 F10 (melanoma) cell line expressed significant levels of IL-
1α by western blot (Figure 3A). Based on previous animal studies by Overwijk et al (126),
we optimized the number of cells and day of treatment to model a significant tumor growth
response. We compared treatment regimens targeting other cytokines such as TNF-α and
IFN-γ, and tailored ours as follows: Day 0: tumor inoculation day, Day 3: Start of anti-IL-1α
29
treatment (100 μg intraperitoneally), mice received treatment every three days until the end
of the experiment (Figure 3B). Mice treated at day 3 after tumor inoculation showed signs of
tumor delay compared to the control (Figure 3C). Since the B16 model is quite aggressive,
we euthanized the mice when the tumor burden reached 200 mm2. The spider plots show
that in the control, tumors reached the maximum tumor size limit by day 12 (Figure 3C). The
majority of mice were euthanized on day 15 and only 20% of the mice survived until day 17
(Figure 3D, E). The treated group, reached its maximum tumor burden by day 15. The
majority of mice were sacrificed after day 21. Only 20% of the mice reached day 27. None of
the mice were disease free by the end of the experiment.

30
Figure 3: Anti-IL-1α reduces tumor growth in B16-F10 murine model. (A) Western blot
showing Pro-IL-1α and IL-1α expression in METR, MC38, BJAB, and B16 cells. (B) Anti IL-
1α (Flo1-2a) treatment schedule (C) Spider plots of tumor measurements per treatment
group. (D) Tumor growth curve during the first two weeks of treatment. Data represents
mean ± SEM, N=10 (E) Kaplan-Meier tumor survival curve. Data represents at least 3
independent experiments with 8-10 mice per group.

31
b. Inhibition of IL-1α decreased the myeloid cell infiltrates after one week of
treatment
Even though IL-1α blockade did not result in disease free mice, we were encouraged
by the moderate anti-tumor response. We believed that studying the tumor micro-
environment would give us an insight into how to improve anti-IL-1α therapy in melanoma.
Analysis of our growth curves showed tumor size separation after day 6 (Figure 3D). We
hypothesized that the most significant changes in immune response occurred in that time
frame. We isolated tumors at day 7, after mice received 2 anti-IL-1α treatments (Figure 4A).
Immune cells were enriched by gradient density centrifugation and then analyzed by flow
cytometry. Our analysis focused on the following immune subsets, T cells (CD45+, CD3+), B
cells (CD45+, CD19+), myeloid cells (CD45+, CD11b+), macrophages (CD11b+, F4/80+),
monocytes (CD11b+, Ly6CHi), and granulocytes (CD11b+, Ly6CLo, Ly6GHi) (Figure 4C).
Tumors on day 7, exhibited a weight difference that we took into consideration for our
absolute number calculations (Figure 4B). Compared to the control, IgG, anti-IL-1α tumors
consistently had less immune cell infiltrates with an average drop of 30% (Figure 4D). The
immune cell decrease was mostly due to significantly less monocyte infiltrates in the first
week of tumor development (Figure 4D). T cells increased by at least an average of 35%.
Analysis of CD8/CD4 ratios, showed that the spike in numbers was due to increased CD4+ T
cells (Figure 4E). Macrophages decreased by an average of 20%. B cells were not
significantly affected by loss of IL-1α. Our findings show that blocking IL-α alters immune cell
infiltration in the tumor, as early as the first week of treatment. The main effect was observed
in myeloid subtypes congruent with published data on the effects of IL-1α.

32
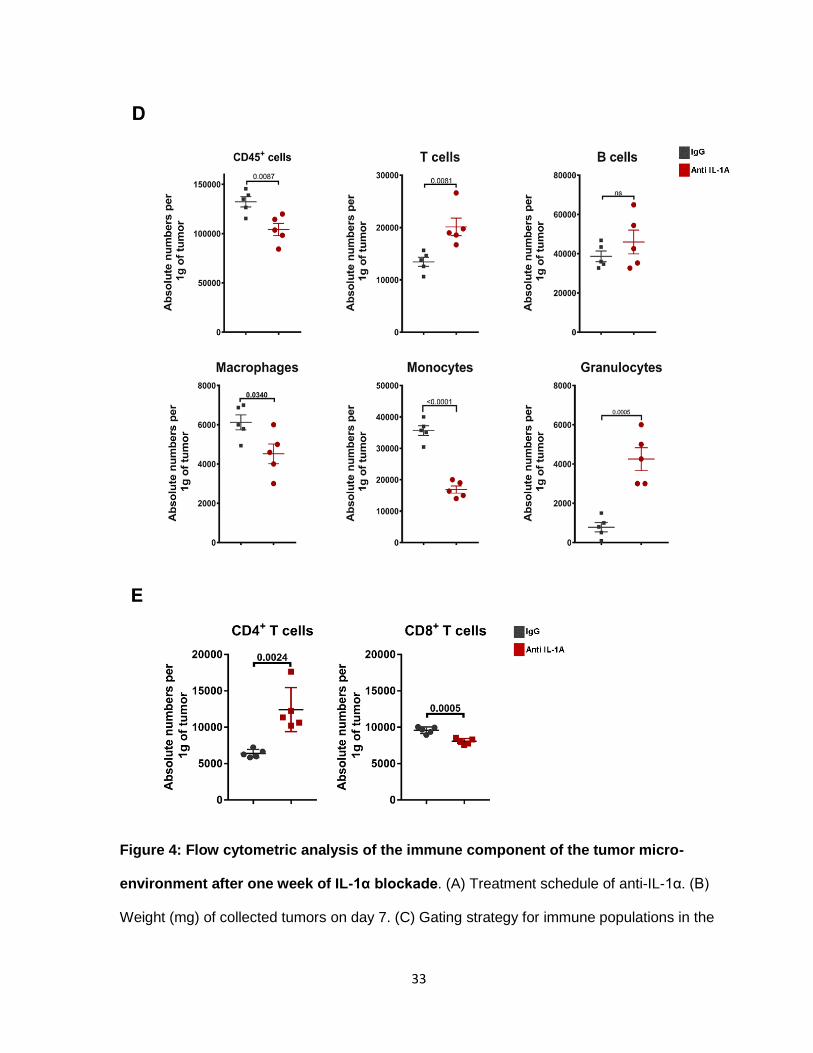
33
Figure 4: Flow cytometric analysis of the immune component of the tumor micro-
environment after one week of IL-1α blockade. (A) Treatment schedule of anti-IL-1α. (B)
Weight (mg) of collected tumors on day 7. (C) Gating strategy for immune populations in the

34
tumor micro-environment. (D) Absolute number of immune infiltrates normalized to tumor
weight. (E) Absolute number of CD8+ T cells and CD4+ T cells normalized to tumor weight.
N=5. Unpaired T-test. Data represents at least 2 independent studies.

35
c. Inhibition of IL-α promotes pro-inflammatory features in myeloid cells
The first round of animal experiments showed the ability and potential of anti-IL-1α in
reconstructing the tumor-microenvironment. To further show the immunosuppressive effects
of IL-1α on immune cells, we used mass spectrometry to categorize the immune infiltrates.
Enriched immune cells, from day 7, were stained with 30 markers (Table 1) and analyzed
using the viSNE algorithm. viSNE allow us to visualize all the immune cell infiltrates in one
graph (Figure 5A). cyTOF analysis was performed in FlowJo using the tSNE pluggin.
Individual group data was concatenated into a single file to create a visual representation of
immune cells across all groups. Additionally, using the concatenated file, we can compare
individual groups since the algorithm creates the same map for all conditions. To identify
changes in immune subsets, we used the density tool to create density heat maps to
highlight clustered populations. viSNE clusters cells according to their similarity in their
marker expression profile, thus cells that have similar markers will be clustered together in
sub-populations. The further the clusters are from each other, the less they have in
common. After the clusters were determined by the algorithm, we manually analyzed each
cluster to confirm they were in fact a different subset. We set the cluster threshold at 70
events, meaning clusters that contained 70 cells or less were considered an artifact.
At first glance, we observed that the three main cell types were monocytes,
macrophages, and B cells. Percentage comparison of the main populations did not show a
major difference between the groups (Figure 5C). However, density plots of each group
showed a significant change in subsets of these populations (Figure 5B), specifically in
macrophages and monocytes.

36
Table 1: cyTOF markers.
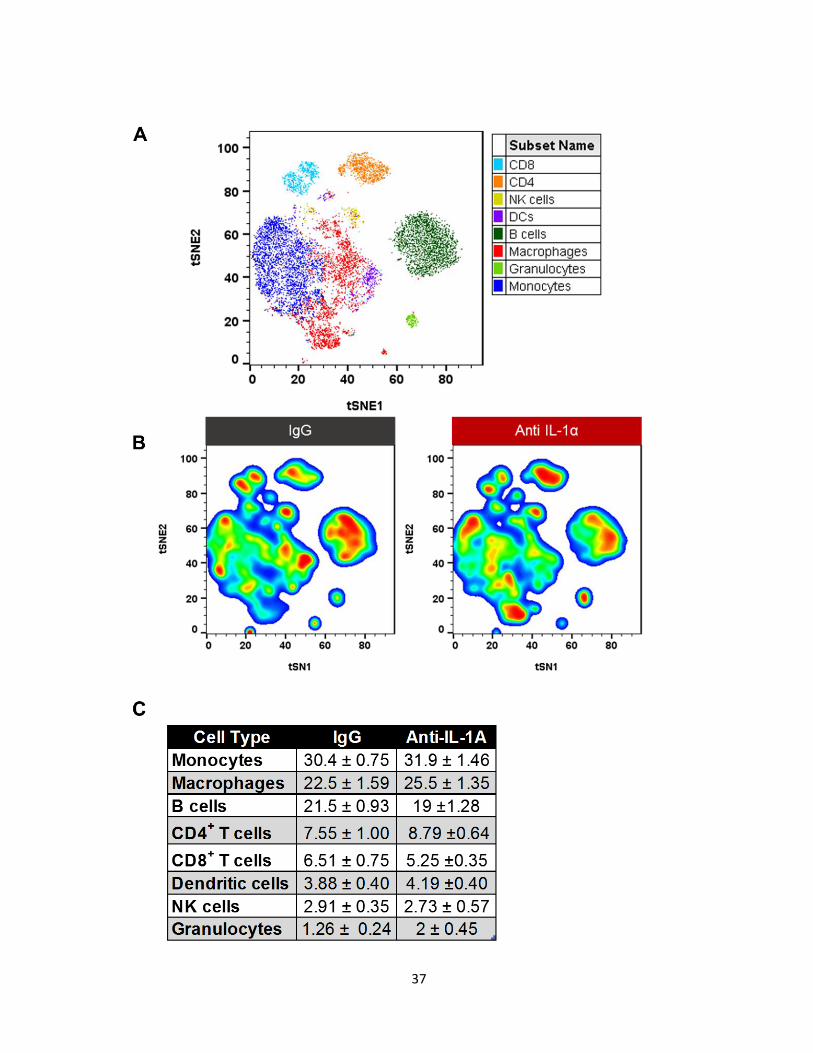
37

38
Figure 5: cyTOF analysis of the tumor micro-environment after IL-1α inhibition on day
7. (A) Color coded composite graph of IgG and anti-IL-1α showing major populations
identified by viSNE algorithm and manual gating. (B) Pseudocolor density maps of IgG and
anti-IL-1α showing differences in subsets of main populations (C) Table showing percent
averages ± SEM. Data represents at least 2 independent experiments.
39
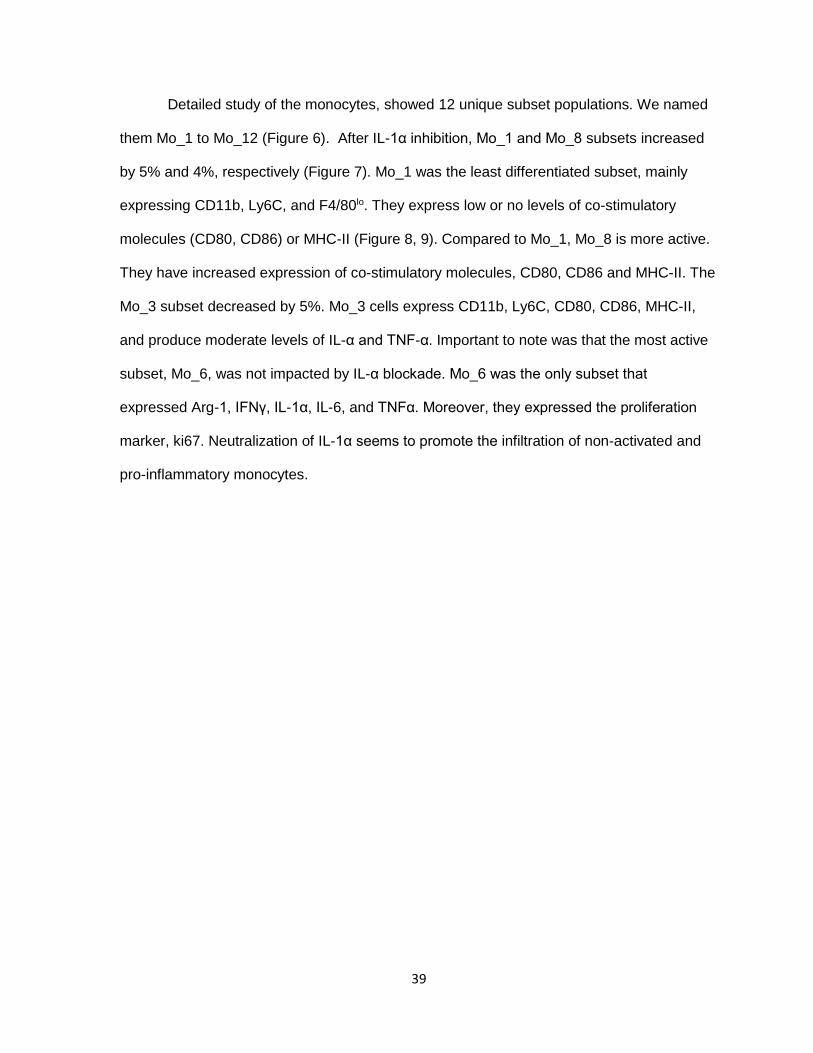
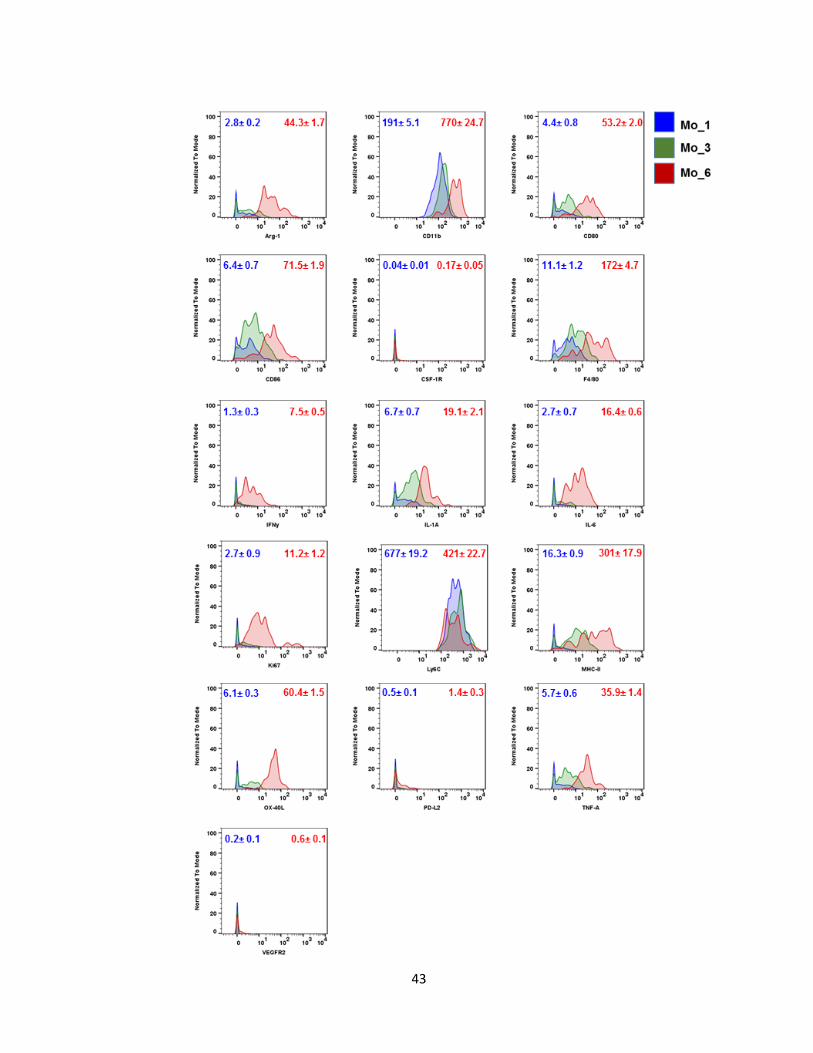
Detailed study of the monocytes, showed 12 unique subset populations. We named
them Mo_1 to Mo_12 (Figure 6). After IL-1α inhibition, Mo_1 and Mo_8 subsets increased
by 5% and 4%, respectively (Figure 7). Mo_1 was the least differentiated subset, mainly
expressing CD11b, Ly6C, and F4/80lo. They express low or no levels of co-stimulatory
molecules (CD80, CD86) or MHC-II (Figure 8, 9). Compared to Mo_1, Mo_8 is more active.
They have increased expression of co-stimulatory molecules, CD80, CD86 and MHC-II. The
Mo_3 subset decreased by 5%. Mo_3 cells express CD11b, Ly6C, CD80, CD86, MHC-II,
and produce moderate levels of IL-α and TNF-α. Important to note was that the most active
subset, Mo_6, was not impacted by IL-α blockade. Mo_6 was the only subset that
expressed Arg-1, IFNγ, IL-1α, IL-6, and TNFα. Moreover, they expressed the proliferation
marker, ki67. Neutralization of IL-1α seems to promote the infiltration of non-activated and
pro-inflammatory monocytes.

40
Figure 6: Pseudocolor density map of monocyte subsets in melanoma tumors on day
7. Mo-1 to Mo-12 represent 12 unique monocyte subpopulations identified by viSNE
analysis on day 7.

41
Figure 7: Percentage of monocyte subsets in melanoma tumors on day 7. Percent of
individual subset out of CD11b, Ly6CHi cells (monocytes). N=3. Data represents at least 2
independent experiments. Unpaired T-test.

42
Figure 8: Marker expression intensity heat map of monocyte subsets. Marker
expression levels of monocyte subsets in IgG (grey column) and anti-IL-1α (red column)
groups. Expression is normalized to the min and max expression per marker. Blue
represents the subset with the lowest expression level and red represents the subset with
the highest expression per row.
43

44
Figure 9: Histogram of the expression profile of monocyte subsets. Marker profile
of Mo_1 (least differentiated), Mo_3 (intermediate differentiation), and Mo_6 (highly
differentiated). Values represent the min and max MFI per marker ± SEM. Data
represents at least 2 independent experiments.

45
Evaluation of the macrophage compartment led to the identification of 7 subsets
(Figure 10A). Three subsets responded to IL-1α inhibition. The Mac_3 subset decreased by
an average of 10% compared to the IgG group (Figure 10B). The Mac_3 subset expressed
moderate levels of CD11b and F4/80. The Mac_4 subset was reduced by 5%. The Mac_4
cells had the lowest F4/80 expression of all the subsets. They more closely resembled the
“M2” phenotype by expressing known M2 markers, CSF-1R, and PD-L2 (Figure 11). The
most significant change observed was in the Mac_7 subset, which increased by 15% in the
anti-IL-1α group (Figure 10B). Mac_7 cells resemble both M1 and M2 macrophages,
signifying that these cells are in the middle of the macrophage differentiation spectrum. They
are the most activated cells expressing high levels of M1 markers: CD11b, F4/80, CD11c,
CD80, CD86, IFNα, MHC-II, OX-40L, and TNF-α. Moreover, they also express canonical M2
markers such as CD206, Arg-1, and IL-6. It is the only macrophage subset that is actively
proliferating at the tumor site.
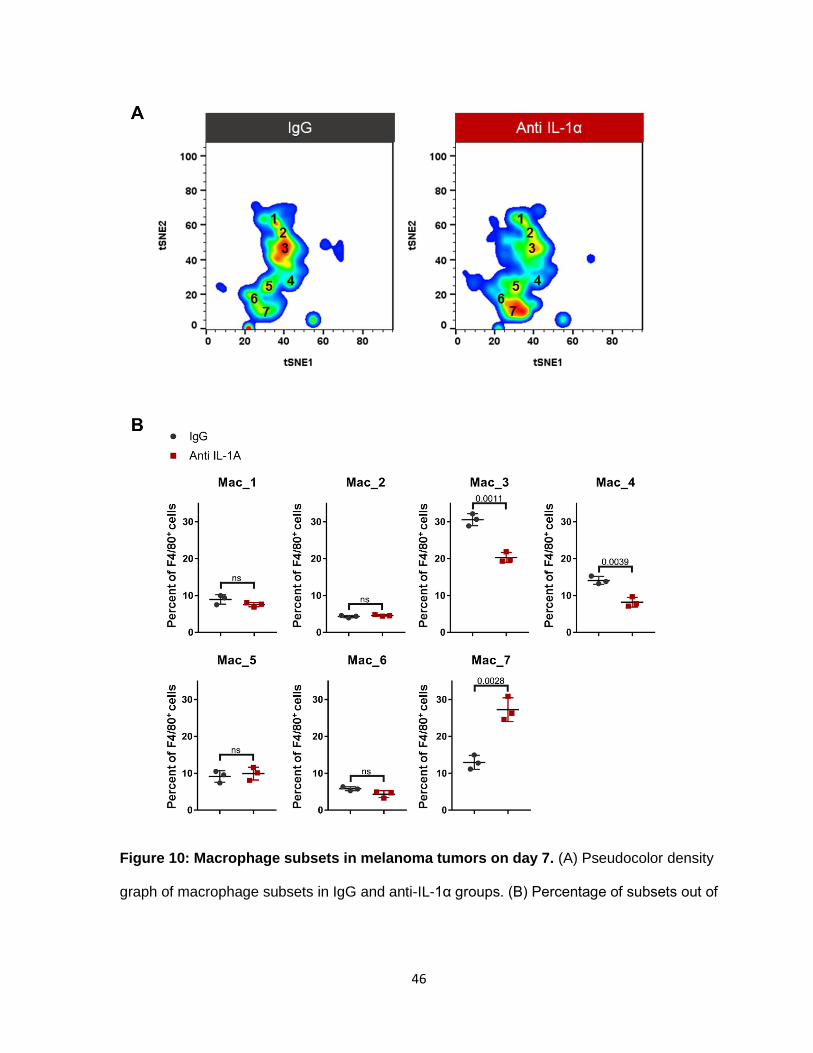
46
Figure 10: Macrophage subsets in melanoma tumors on day 7. (A) Pseudocolor density
graph of macrophage subsets in IgG and anti-IL-1α groups. (B) Percentage of subsets out of
47
total macrophages (CD11b, F4/80). N=3, Unpaired T-test. Data represents at least 2
independent experiments.
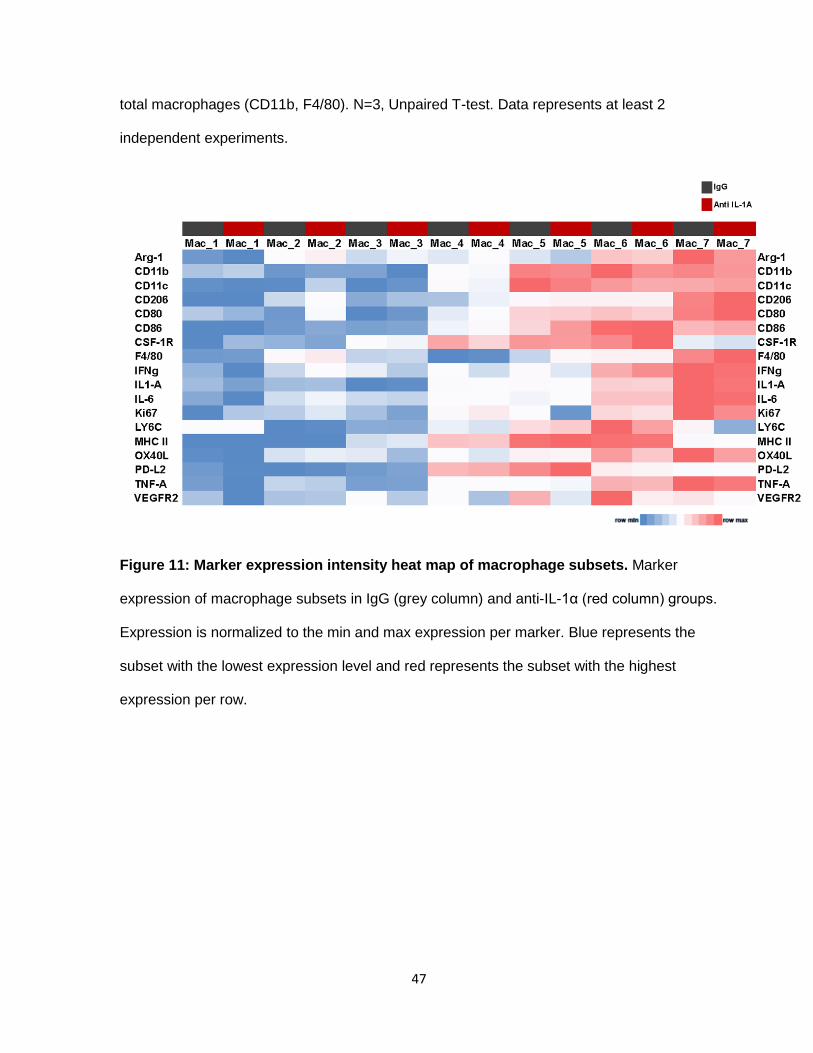
Figure 11: Marker expression intensity heat map of macrophage subsets. Marker
expression of macrophage subsets in IgG (grey column) and anti-IL-1α (red column) groups.
Expression is normalized to the min and max expression per marker. Blue represents the
subset with the lowest expression level and red represents the subset with the highest
expression per row.

48
49

50
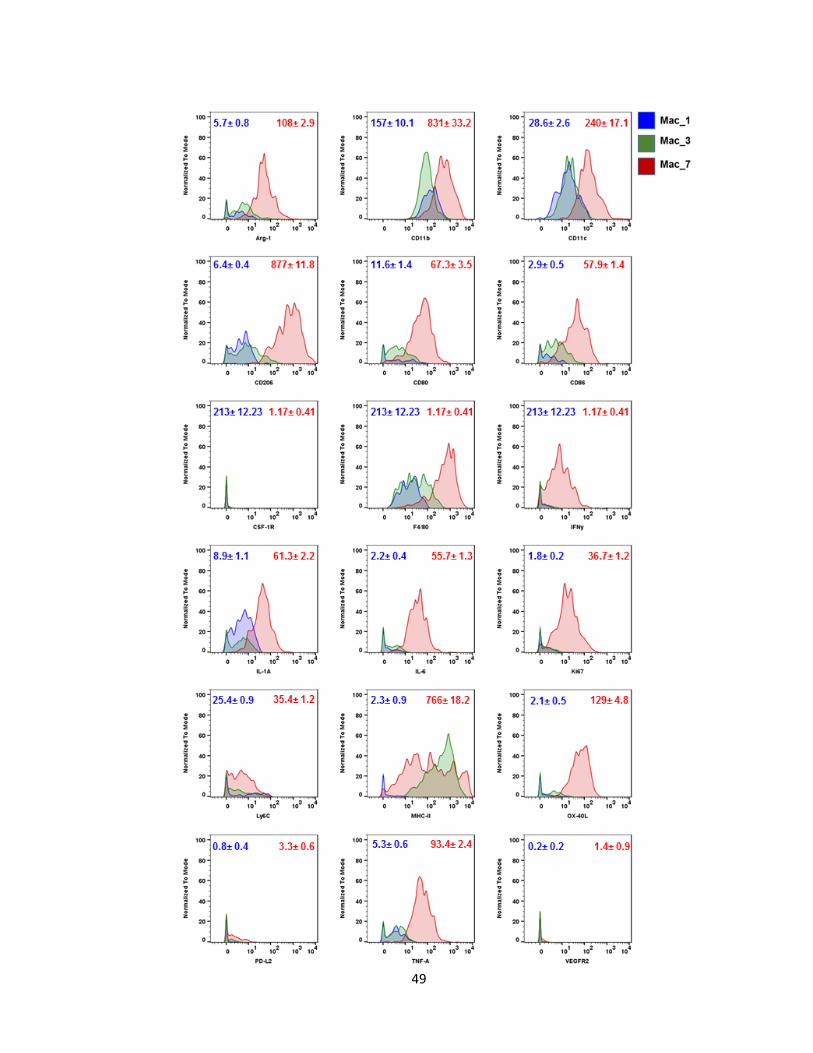
Figure 12: Histograms of the phenotypic profile of macrophage subsets. Marker profile
of Mac_1 (least differentiated), Mac_3 (int. differentiation), and Mac_7 (highly differentiated).
Values represent the min and max MFI per marker ± SEM. Data represents at least 2
independent experiments.
51
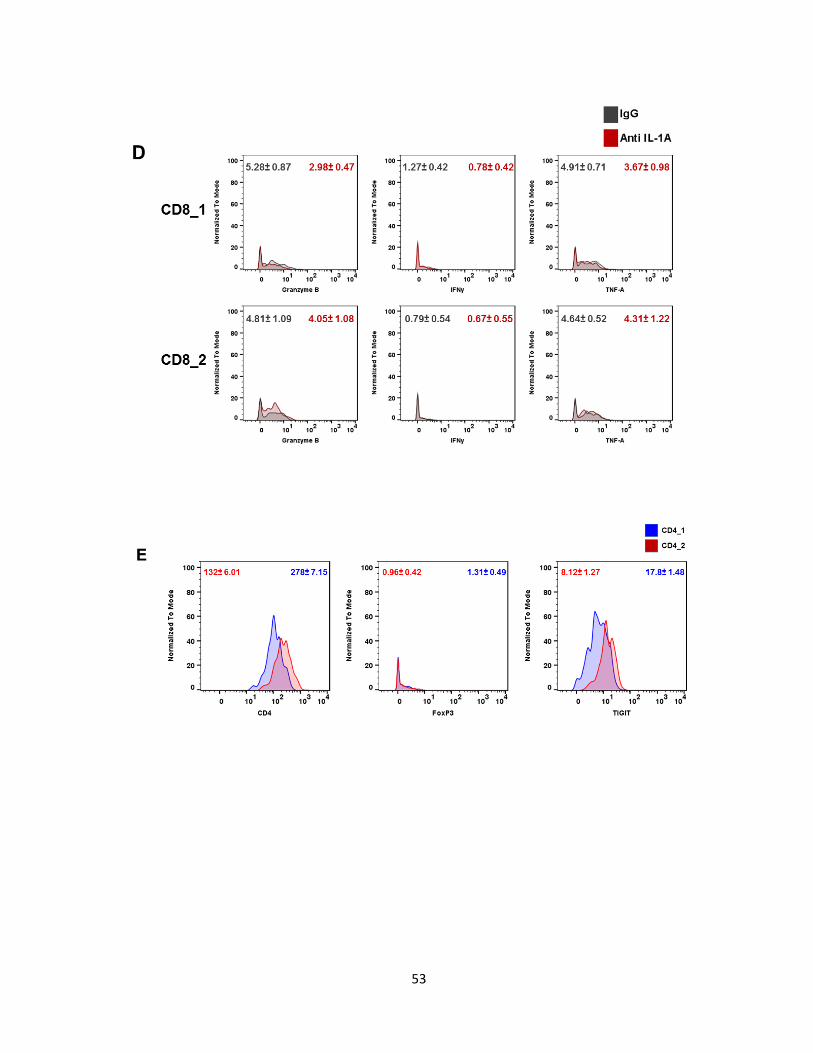
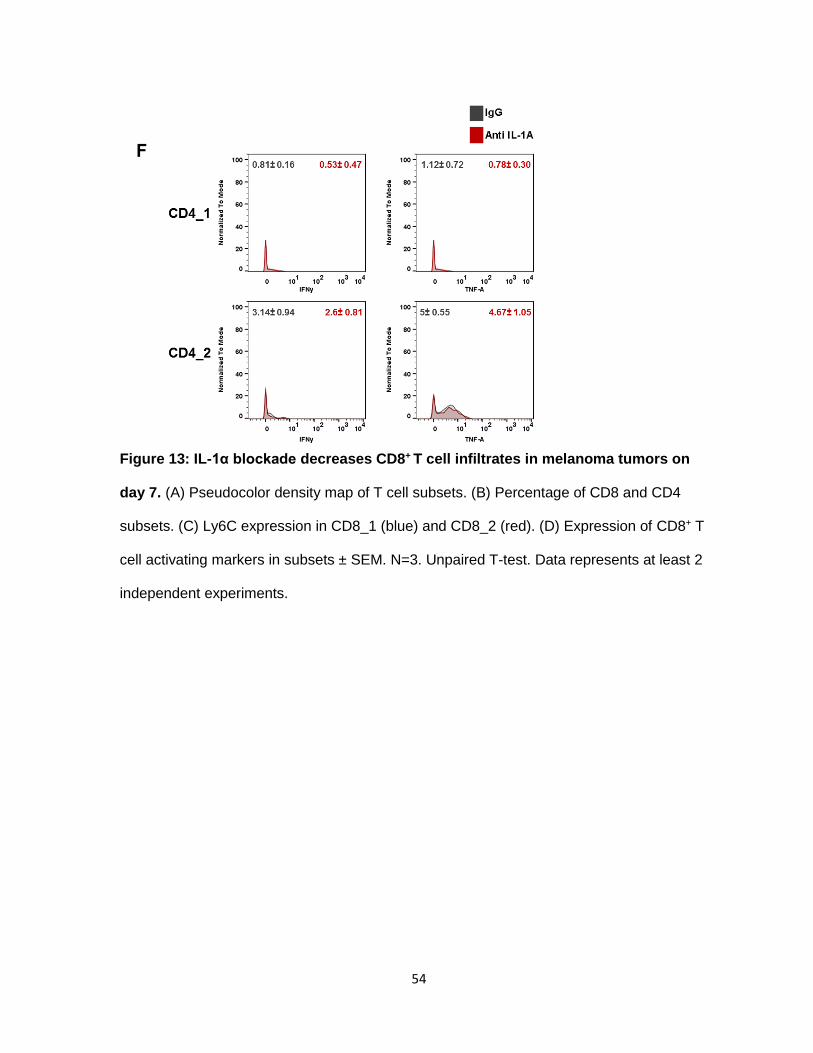
d. IL-1α blockade decreases CD8+T cell infiltrates
Tumors treated with anti-IL-α had reduced CD8+ T cell infiltrates. cyTOF analysis
identified 2 CD8+ sub-populations (Figure 13A) differentiated by their Ly6C expression
(Figure 13C). We did not see an increase in TH1 response by IL-1α neutralization based on
the CD8+ infiltrates’ lack of IFNγ, TNF-α, and Granzyme B (Figure 13D). Contrary to CD8+ T
cells, CD4+ T cells increased with lack of IL-1α. Similarly to CD8+ T cells, CD4+ T cells were
separated into 2 subtypes, CD4_1 and CD4_2. CD4_2 cells have a slight increase in CD4
and TIGIT expression compared to CD4_1 (Figure 13E). TIGIT has been shown to act an
inhibitory molecule in CD4 effector T cells. Neither subset had intracellular FoxP3. Blocking
IL-1α does not induce IFN-γ and TNF-α production in CD4_1 and CD4_2 cells (Figure 13F).
Overall, the total T cell infiltrate increases with IL-1α inhibition, compromised by a majority of
CD4+ T cells.

52
53
54
Figure 13: IL-1α blockade decreases CD8+ T cell infiltrates in melanoma tumors on
day 7. (A) Pseudocolor density map of T cell subsets. (B) Percentage of CD8 and CD4
subsets. (C) Ly6C expression in CD8_1 (blue) and CD8_2 (red). (D) Expression of CD8+ T
cell activating markers in subsets ± SEM. N=3. Unpaired T-test. Data represents at least 2
independent experiments.
55
e. Neutralization of IL-1α modulates B cell subsets
Analysis of the B cell subsets showed that 5 distinct populations were present at the
tumor site (Figure 14A). These subsets were differentiated by their level of CD19, B220 and,
MHC-II. Subset B_1, increased by at least 10% in tumors treated with anti-IL-1α. B_1, is the
least activated B cell, having the lowest expression of CD19, B220 and MHC-II. It has no co-
stimulatory molecules, and production of cytokines such as TNF-α, IFNγ and IL-α. The most
activated B cell subtype was the one of two subpopulations that decreased in the treated
group. B_5 has the highest expression of CD19, B220, and MHC-II, and shows signs of
slight up-regulation of OX-40L, TNF-α, and IL-α. Likewise, the other reduced population was
B_3, which has a similar expression profile as B_5. More markers are needed to elucidate
the function of B cells in the tumor micro-environment after IL-1α inhibition.
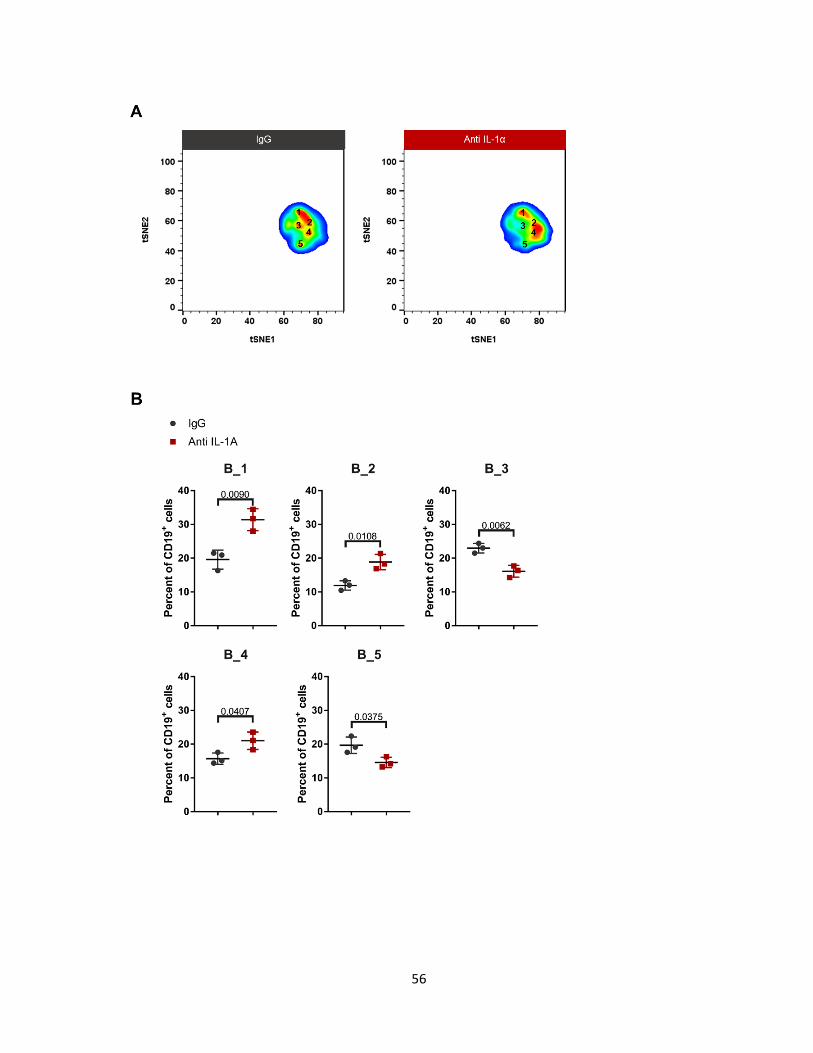
56
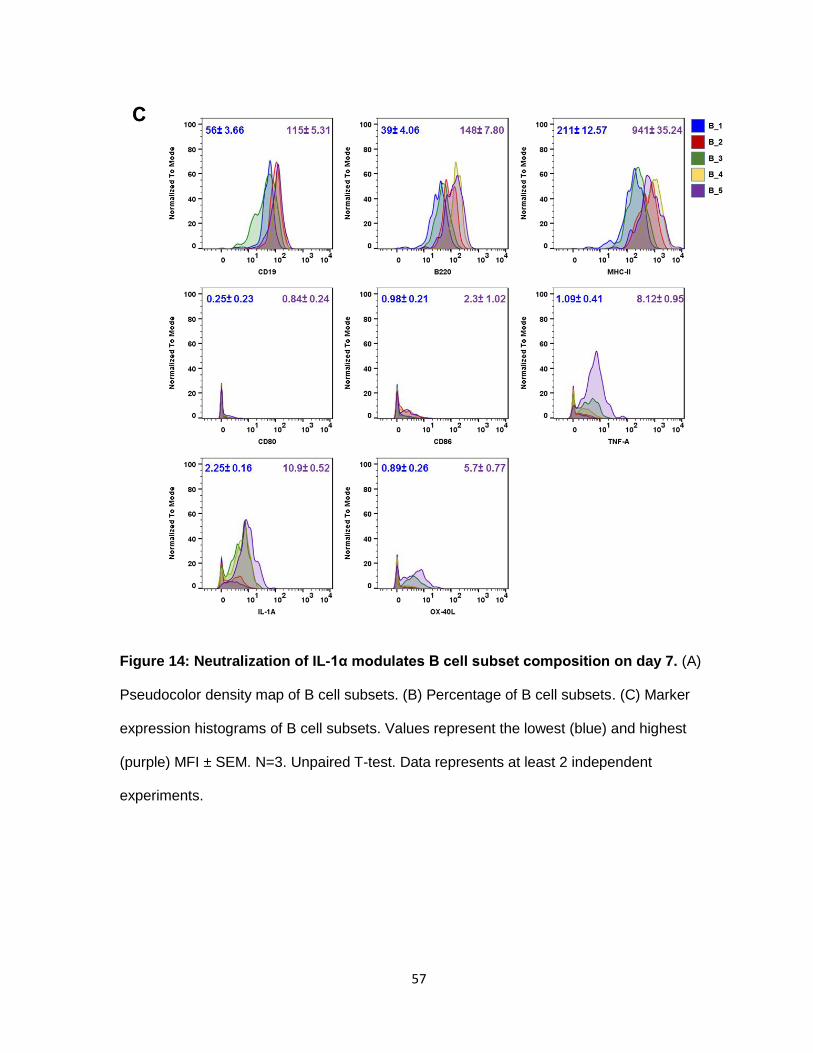
57
Figure 14: Neutralization of IL-1α modulates B cell subset composition on day 7. (A)
Pseudocolor density map of B cell subsets. (B) Percentage of B cell subsets. (C) Marker
expression histograms of B cell subsets. Values represent the lowest (blue) and highest
(purple) MFI ± SEM. N=3. Unpaired T-test. Data represents at least 2 independent
experiments.

58
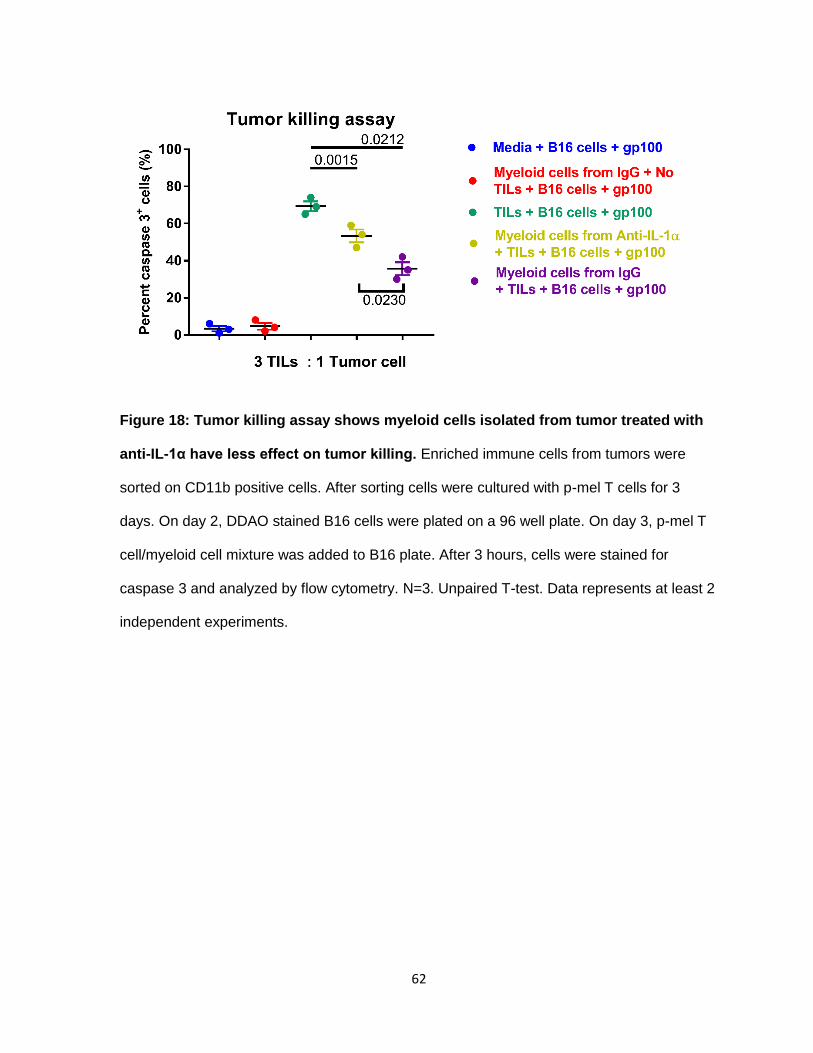
f. Myeloid cells isolated from tumors treated with anti-IL-1α are inefficient in
suppressing T cells
Flow cytometry and cyTOF analysis showed that lack of IL-1α predominantly affects
myeloid cells. Specifically, IL-1α blockade increased non- or low-differentiated myeloid cells
and decreased M2-like macrophages. M2 macrophages and MDSCs inhibit T cell function.
Therefore we wanted to asses if myeloid cells (CD11b+) treated with anti-IL-1α were less
capable in reducing T cell activation. Since we cannot measure their ability to suppress T
cells in vivo, we isolated myeloid cells from both control and treated groups and measured
their arginase and NO activity, by using an arginase colorimetric assay and the griess assay,
respectively. Inhibition of IL-1α significantly decreased the production of both arginase and
NO in isolated myeloid cells (Figure 15). To further prove their decreased T cell inhibiting
ability, we co-cultured isolated myeloid cells with p-mel T cells for three days and then used
those T cells in a tumor cell killing assay (Figure 17). The tumor cell killing assay measures
caspase 3 expression. Caspase 3 cleavage is activated during cell apoptosis, so increase in
caspase 3 is directly proportional to increase in tumor cell apoptosis. The assay
demonstrated that myeloid cells isolated from tumors treated with anti-IL-1α affected T cell
activity to a lesser degree which led to an increase in tumor killing. Thus, from our data we
can infer that IL-1α increases immunosuppression in B16 tumors by restructuring the tumor-
microenvironment, specifically myeloid cells.
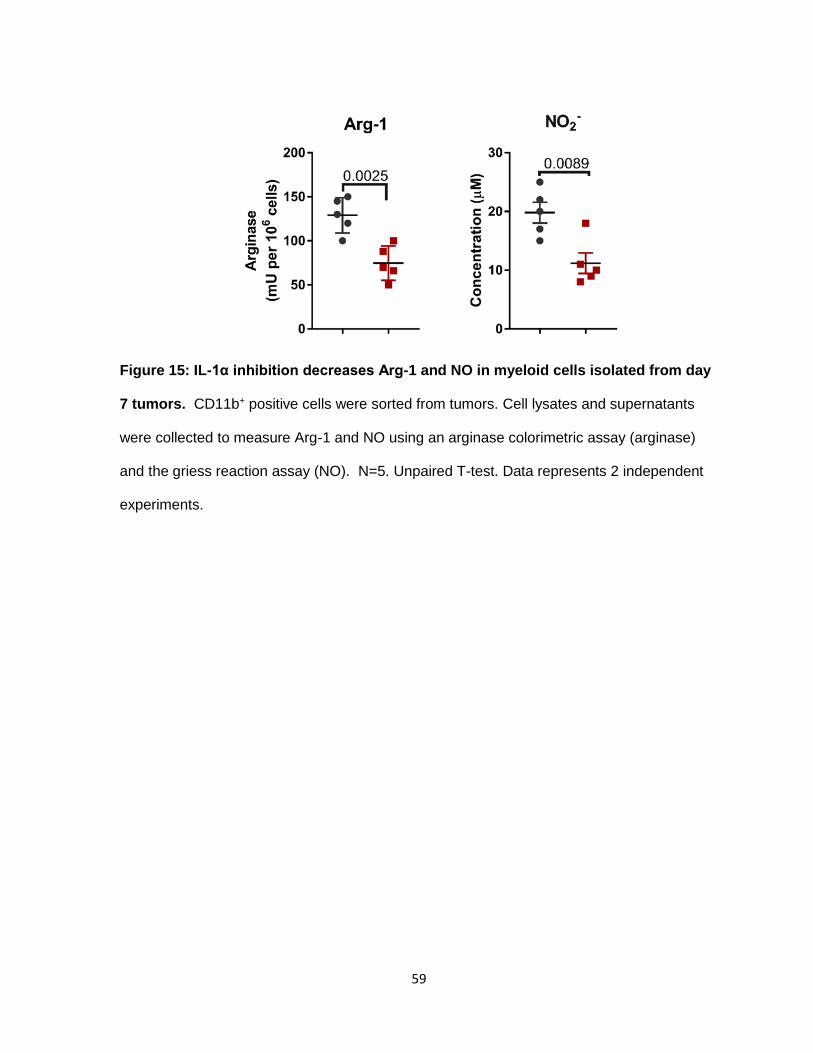
59
Figure 15: IL-1α inhibition decreases Arg-1 and NO in myeloid cells isolated from day
7 tumors. CD11b+ positive cells were sorted from tumors. Cell lysates and supernatants
were collected to measure Arg-1 and NO using an arginase colorimetric assay (arginase)
and the griess reaction assay (NO). N=5. Unpaired T-test. Data represents 2 independent
experiments.
60
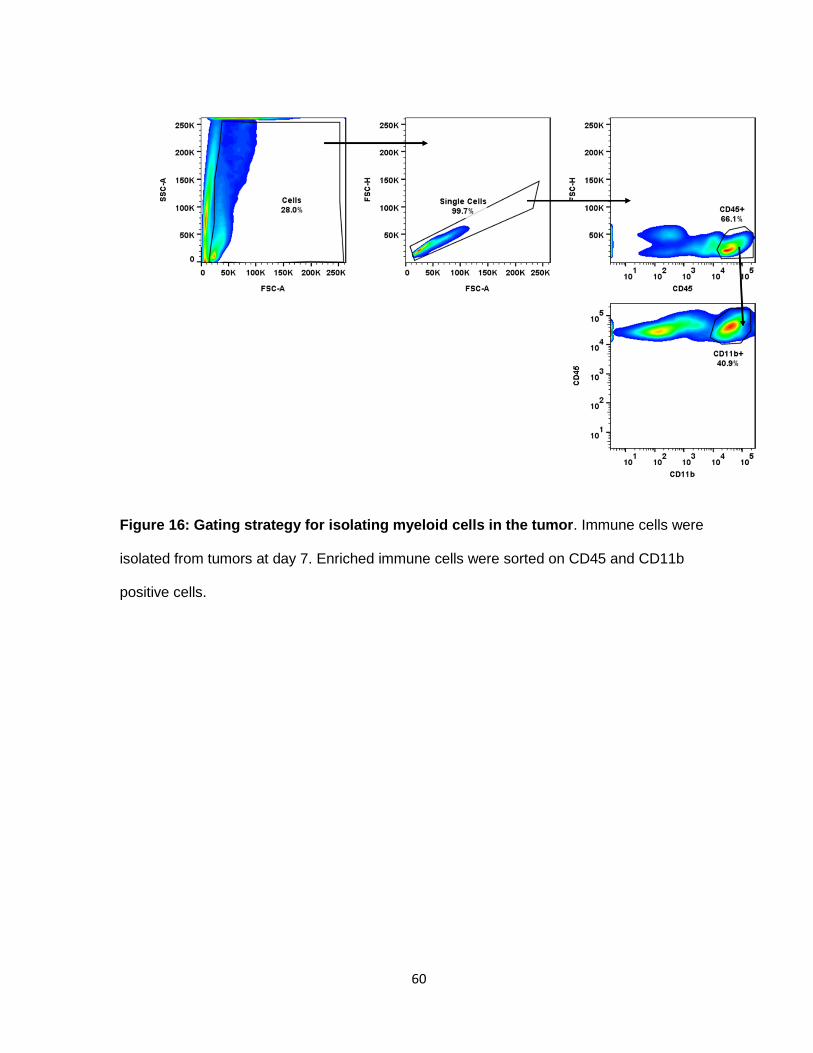
Figure 16: Gating strategy for isolating myeloid cells in the tumor. Immune cells were
isolated from tumors at day 7. Enriched immune cells were sorted on CD45 and CD11b
positive cells.

61
Figure 17: Tumor killing assay experimental procedure. Enriched immune cells from
tumors were sorted on CD11b positive cells. After sorting cells were cultured with p-mel T
cells for 3 days. On day 2, DDAO stained B16 cells were plated on a 96 well plate. On day
3, p-mel T cell/myeloid cell mixture was added to B16 plate. After 3 hours, cells were stained
for caspase 3 and analyzed by flow cytometry.
62
Figure 18: Tumor killing assay shows myeloid cells isolated from tumor treated with
anti-IL-1α have less effect on tumor killing. Enriched immune cells from tumors were
sorted on CD11b positive cells. After sorting cells were cultured with p-mel T cells for 3
days. On day 2, DDAO stained B16 cells were plated on a 96 well plate. On day 3, p-mel T
cell/myeloid cell mixture was added to B16 plate. After 3 hours, cells were stained for
caspase 3 and analyzed by flow cytometry. N=3. Unpaired T-test. Data represents at least 2
independent experiments.

63
e. Anti-IL-1α effect is not sustainable
Our animal experiments show that inhibition of IL-1α modulates anti-tumor response
by decreasing the infiltration of monocytes into the tumor micro-environment during the first
week of treatment. Since, we did not see any disease free mice, we inferred that IL-1α effect
was short-lived and, eventually, the tumor microenvironment reverts to an
immunosuppressive state, even though anti-IL-1α treatment is administered until the end.
We were able to show this by analyzing mice at the end stage of the experiment. When
comparing the myeloid population at day 7 and at termination day, we can see that the
positive effect seen at day 7 is gone (Figure 19). At termination, the myeloid composition
looks similar in both groups. There is no difference in monocytes and granulocytes.
Likewise, we see a similar effect in macrophages at termination day (Figure 20).
Furthermore, on termination day, Arg-1 and NO expression returns to similar levels seen in
the control during day 7 (Figure 21). At some point, tumors activate alternative pathways
that induce immunosuppression in the tumor micro-environment.

64
Figure 19: Percentage of monocytes and granulocytes out of total myeloid cells at
day 7 and termination day. Pseudocolor plot shows that at day 7 there’s a decrease in
monocytes and increase in granulocytes due to anti-IL-1α. The effect is eradicated at
termination day. Percent ± SEM. Data represents at least 2 independent experiments.
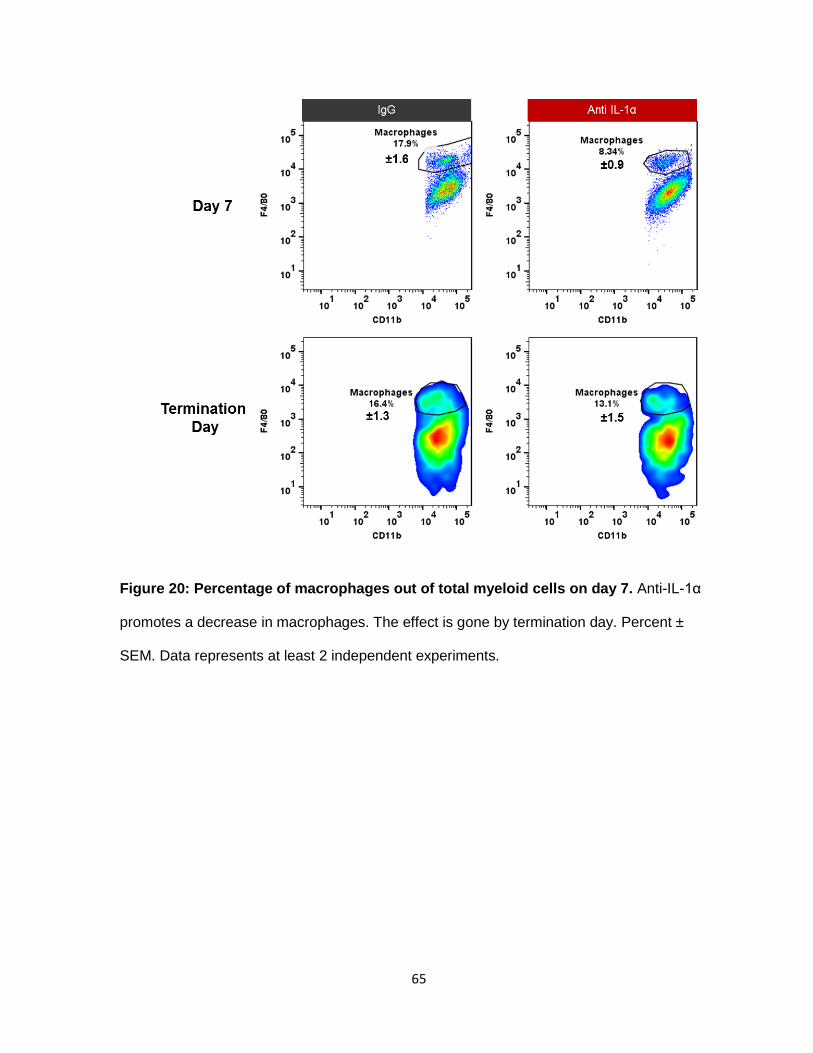
65
Figure 20: Percentage of macrophages out of total myeloid cells on day 7. Anti-IL-1α
promotes a decrease in macrophages. The effect is gone by termination day. Percent ±
SEM. Data represents at least 2 independent experiments.

66
Figure 21: Arg-1 and NO production are similar at termination day in IgG and anti-IL-
1α. Myeloid cells isolated from IgG and anti-IL-1α have similar production of Arg-1 and NO
at termination day. N=3. Unpaired t-test. Data represents at least 2 independent
experiments.
67
III. Discussion
Current FDA approved immunotherapies have been shown to have success in
metastatic melanoma patients. We know that tumor-mediated immunosuppression
decreases the effectivity of these treatments in patients. Studies have shown that melanoma
tumors express IL-1. We know that IL-1 coordinates a variety of pathways that leads to an
increase in immunosuppression in the tumor-microenvironment. Thus, we wanted to study
how IL-1α altered immune cells in the tumor. We used, Flo1-2a, the murine equivalent of
MapB1 to treat B16 tumors in C57BL/6 mice. Tumors were treated on day 3 and thereafter
every 3 days until the end of the experiment. As a monotherapy, anti-IL-1α, reduced tumor
growth rate and increased mice survival by 10 days compared to IgG. Tumor growth is
controlled by a variety of mechanism including, increased tumor cell proliferation,
angiogenesis, and reduced immune response. In this project we focus on the immune
response. Anti-IL-1α decreased immune infiltrates at the tumor site and changed immune
cell percentages. The most evident change was observed in monocytes. Monocyte infiltrates
decreased by half compared to IgG group. When we analyzed the different monocyte
subsets in the treated group, we observed an increase in non-activated monocytes, Mo_1.
Non-activated monocytes expressed CD11b and Ly6C. They had no antigen presentation
co-stimulatory molecules and did not produce pro-inflammatory cytokines. The most
differentiated monocyte subsets, Mo_5, Mo_6, and Mo_7 were not affected by anti-IL-1α.
Unlike monocytes, highly active macrophages were the most affected by lack of IL-1α.
Mac_7, expressed markers inducing both pro-inflammatory and anti-inflammatory
responses. We deduced that Mac_7 subset was in the middle of the macrophage
differentiation spectrum thus expressing markers from both extremes. Finally, we saw a
decrease in Mac_4. Based on the marker expression, we can classify Mac_4 as an “M2”
68
macrophage involved in anti-inflammatory responses. Mac_4 cells expressed PD-L2, which
is involved in the activation of PD-1 in T cells, resulting in T cell inhibition. Anti-IL-1α
increased T cell infiltrates at day 7 via increase of CD4+ T cells. These T cells did not exhibit
TH1-associated cytokines such as IFNγ, TNF-α, and Granzyme β production. Important to
note, was that CD8+ T cell percentage decreased. Their function was also not changed by
anti-IL-1α. The last immune population we analyzed was B cells. Anti-IL-1α did not alter the
number of B cells but did affect their composition. TNF-α producing B cells were reduced in
the treated group. At day 7, there were no B cell subsets producing co-stimulatory
molecules CD80, and CD86. Unfortunately, we needed more markers to explain the function
of B cells during early tumor progression.
Our data illustrates how blocking IL-1α induces an increase in non-activated cells
and decrease in anti-inflammatory cells. Thus, we can conclude that the tumor micro-
environment favors an anti-tumor response during the first week of tumor growth.
Furthermore, we wanted to show that blocking IL-1α in the tumor micro-environment
reduced the immunosuppressive function in myeloid cells. To do this, we isolated myeloid
cells from tumors and measured their production of Arg-1 and NO. Studies have shown that
Arg-1 inhibits T cell function by diminishing arginine, an amino acid necessary for T cell
activation. NO is involved in T cell apoptosis. Quantification of Arg-1 and NO showed that
myeloid cells isolated from IgG tumors, had higher levels of these molecules compared to
tumors treated with anti-IL-1α. We can infer that IgG myeloid cells have a higher capacity to
inhibit T cell activation. We tested this by using the tumor killing assay. We co-cultured
myeloid cells, isolated from both groups, and p-mel T cells for 3 days in the presence of
gp100 peptide, necessary for T cell activation. We, then, used this mixture to induce B16
killing, which was measured by the increase of caspase 3 cleavage in tumor cells. We noted
that myeloid cells isolated from tumors treated with anti-IL-1α, had a lesser ability to inhibit T

69
cell activation. Therefore, one possible mechanism of action of anti-IL-1α is the reduction of
immunosuppressive cells, allowing proper T cell activation and expansion.
The reduction of myeloid cells by inhibiting IL-α is temporary. When we analyzed
tumors at the termination day, we observed no differences in monocytes and macrophages,
even though we administered anti-IL-1α until the end of the experiment. This could be
attributed to tumors over-expressing IL-1α so the antibody dosage is not enough to
neutralize all available IL-1α. Also, cancer cells could be activating alternative pathways to
drive immunosuppression, which are IL-1α independent.
IV. Material and Methods
a. Mice and tumor cells
Animal experiments performed in this study were approved by the Institutional Animal
Care and Use Committee (IACUC) of the University of Texas MD Anderson Cancer Center.
6 to 12 wk old female C57BL/6 mice were purchased from Charles River Frederick research
model facility (Bethesda, MD). B16.F10 gp100+ is a spontaneous C57BL/6 melanoma
obtained from the National Cancer Institute tumor repository and maintained in RPMI 1640
with 10% FBS, 100 μg ml-1 streptomycin and 100 μg ml-1 penicillin (Invitrogen).
b. Animal Experiments
Antibody against the secreted form of IL-1 α, Flo1-2a, was provided by XBioTech. Rat
IgG2a, κ was purchased from BioXcell. C57BL/6 mice were inoculated with 3 x 10⁵ B16.F10
gp100+ cells s.c. on the belly. Three days later mice were treated with 100 μg of Flo1-2a
(i.p), or 100 μg IgG2a and, thereafter, 3x a week until end of experiment. Tumors were
measured using calipers and collected at determined time points for tumor micro-
environment analysis. For survival experiments, mice were sacrificed when tumors reached
200 mm2 or became too ulcerated.
c. Flow cytometry and CyTOF analysis

70
Single cell suspensions were prepared by carefully smashing tumors on a 70 μm strainer
using a plunger from a 3 ml syringe. Cells were kept at 4°C in PBS with 2% FBS until
needed. Intracellular staining was performed using the cytofix/cytoperm kit (BD Bioscience)
according to the manufacturer’s protocol. The following antibodies were used during flow
cytometry analysis, CD45, CD11b, CD3, CD19, CD11c, CD4, CD8, Ly6C, and Ly6G.
Alternatively, cells were stained for CyTOF analysis. Briefly, surface markers were stained in
0.5% BSA-PBS for 1 hr at RT. After washing, cells were stained with 25 μM cisplatin for 1
min. Cells were fixed, permeabilized and stained with intracellular markers for 1 hr at RT,
washed and then stained with 250nM IR-intercalator. Cells analyzed by Helios mass
cytometer.
d. Arginase and NO assays
CD11b+ cells were isolated from tumor and spleen. Arginase activity was measured
using the BioVision Arginase Activity Colorimetric assay kit. The kit indirectly measures
arginase by first reacting arginine with arginase producing an intermediate that reacts with
OxiRed probe. We measure the absorbance of the samples at 570nm and then use an
equation to calculate arginase activity. Sample arginase activity = H2O2 amount from
standard curve /(reaction time X sample volume added into the reaction well) X Dilution
factor. NO was measured using the Griess reagent system from promega. NO is measured
by quantifying one of its products, nitrate. The Griess Reagent system uses sulfanilamide
and N-1-napthylethylenediamine dihydrochloride (NED) under acidic conditions.
Sulfanilamide and NED compete for nitrite. Absorbance was measured at 520nm and
concentration was calculated using a nitrate standard curve.
e. Tumor killing assay
CD11b+ cells were isolated from tumors and spleen. CD11b+ cells were quickly co-
cultured with p-mel T cells isolated from P-Mel-1 TCR/Thy1.1 mice at a 1:1 ratio with 1ng/ml
71
of gp100 peptide to activate the T cells. After 2 days, B16 cells were stained with DDAO and
plated on a 96 well plate. On day 3, CD11b/Tcell co-culture was added to B16 cells for 3
hours and then cells were stained for caspase 3. Cells were analyzed by flow cytometry.
f. Statistical Analysis
All results are expressed as (mean ± SEM). Animal group size was (n=10) unless
otherwise indicated. All experiments were repeated at least twice with comparable results.
Data was analyzed using paired and non-paired t-test where appropriate and differences
were determined significant at (P<0.05). Difference in tumor size among several treatments
was evaluated using variance ANOVA. To compare survival, we used the Kaplan-Meier
method and log-rank test. Graphs were created using GraphPad Prism 6 software.

72
CHAPTER 4: ANTI-IL-1α IN COMBINATION WITH CHECKPOINT BLOCKADE AND
PEPTIDE VACCINE
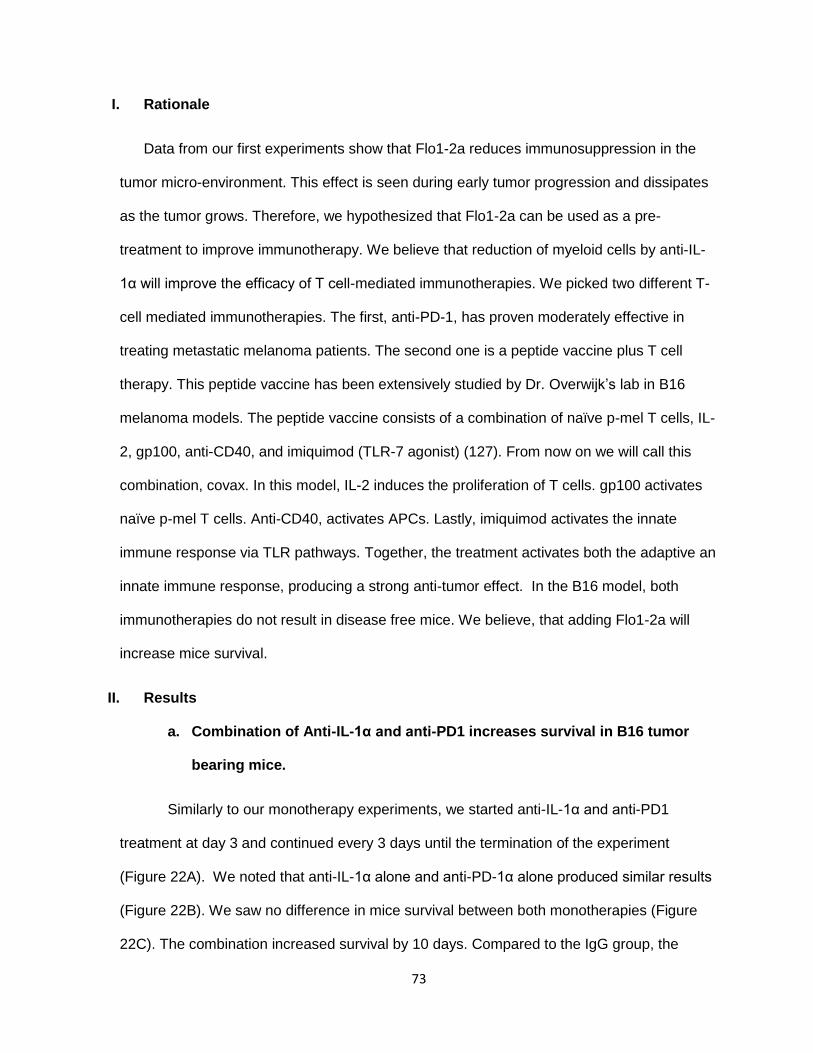
73
I. Rationale
Data from our first experiments show that Flo1-2a reduces immunosuppression in the
tumor micro-environment. This effect is seen during early tumor progression and dissipates
as the tumor grows. Therefore, we hypothesized that Flo1-2a can be used as a pre-
treatment to improve immunotherapy. We believe that reduction of myeloid cells by anti-IL-
1α will improve the efficacy of T cell-mediated immunotherapies. We picked two different T-
cell mediated immunotherapies. The first, anti-PD-1, has proven moderately effective in
treating metastatic melanoma patients. The second one is a peptide vaccine plus T cell
therapy. This peptide vaccine has been extensively studied by Dr. Overwijk’s lab in B16
melanoma models. The peptide vaccine consists of a combination of naïve p-mel T cells, IL-
2, gp100, anti-CD40, and imiquimod (TLR-7 agonist) (127). From now on we will call this
combination, covax. In this model, IL-2 induces the proliferation of T cells. gp100 activates
naïve p-mel T cells. Anti-CD40, activates APCs. Lastly, imiquimod activates the innate
immune response via TLR pathways. Together, the treatment activates both the adaptive an
innate immune response, producing a strong anti-tumor effect. In the B16 model, both
immunotherapies do not result in disease free mice. We believe, that adding Flo1-2a will
increase mice survival.
II. Results
a. Combination of Anti-IL-1α and anti-PD1 increases survival in B16 tumor
bearing mice.
Similarly to our monotherapy experiments, we started anti-IL-1α and anti-PD1
treatment at day 3 and continued every 3 days until the termination of the experiment
(Figure 22A). We noted that anti-IL-1α alone and anti-PD-1α alone produced similar results
(Figure 22B). We saw no difference in mice survival between both monotherapies (Figure
22C). The combination increased survival by 10 days. Compared to the IgG group, the

74
combination of anti-IL-1α and anti-PD-1 increased survival by 2 weeks. Moreover, 20% of
the mice survived over 1 month. Analysis of the tumor micro-environment, at day 7, in the
combination group showed similar infiltration pattern of myeloid cells as seen in the anti-IL-
1α monotherapy group. For instance, the absolute number of monocytes decreased by half
when we added anti-IL-1α to the anti-PD-1 group (Figure 23). We also noted an increase in
granulocytes in the combination group. On the other hand, we saw a decrease in total T
cells in the combination group. Our data shows that, as expected, Flo1-2a decreased
monocytes even in the presence of anti-PD-1.

75
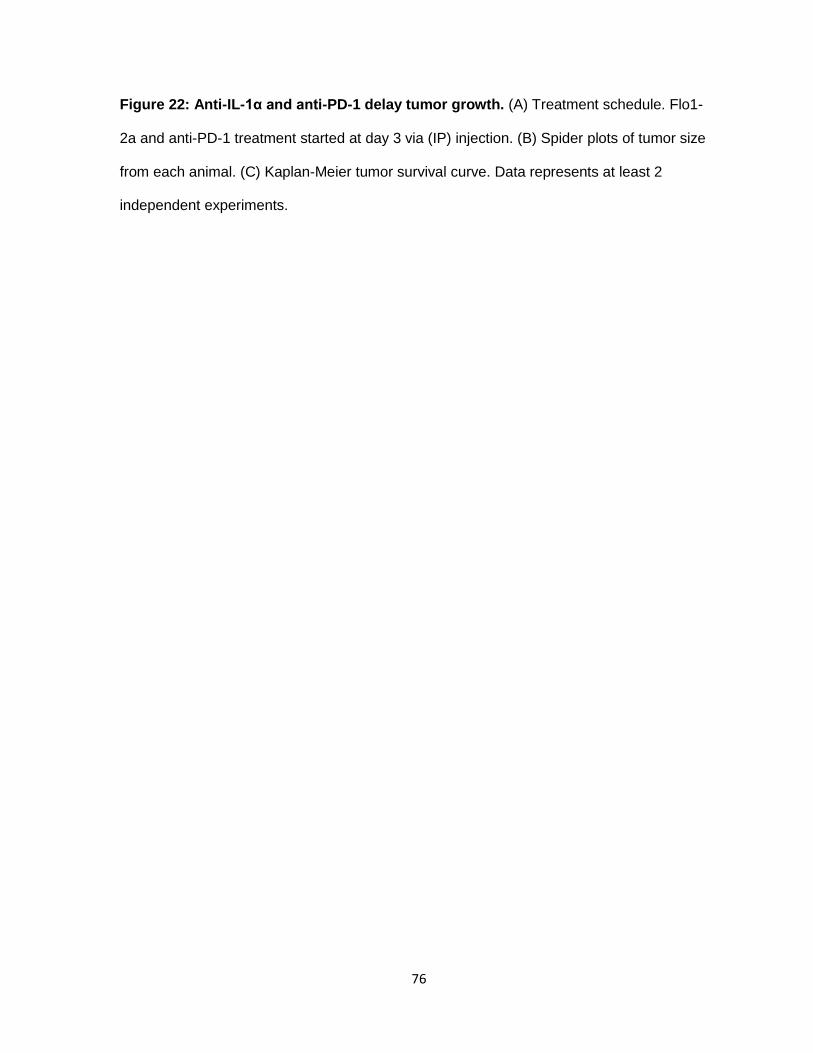
76
Figure 22: Anti-IL-1α and anti-PD-1 delay tumor growth. (A) Treatment schedule. Flo1-
2a and anti-PD-1 treatment started at day 3 via (IP) injection. (B) Spider plots of tumor size
from each animal. (C) Kaplan-Meier tumor survival curve. Data represents at least 2
independent experiments.
77
Figure 23: Anti-IL-1α and anti-PD1 treatment modulates immune infiltration on day 7.
Monocyte and granulocyte infiltration retains the same pattern seen as anti-IL-1α
monotherapy. N=3. Unpaired T-test. Data represents at least 2 independent experiments.

78
b. Combining anti-IL-1α and anti-PD-1 alters macrophage subsets.
Analysis of macrophages, show 11 distinct sub-populations (Figure 25). In the
combination group, we observe a decrease in non-activated macrophages represented by
Mac_2 (Figure 26). Moreover, there was a decrease in Mac_4, which are macrophages that
have high levels of MHC-II, but do not have co-stimulatory molecules on their surface
(Figure 27, 28). We also noted a decrease in Mac_10, which most closely resembles “M2”
macrophages by expressing PD-L2, CD206 and Arg-1. Mac_7 and Mac_11 represent
subsets that are in between “M1” and “M2” phenotypes. They, both express, varying levels
of antigen presentation-associated molecules and anti-inflammatory molecules. These two
subsets increase in the combination group. IL-1α and PD-1 blockade promotes the increase
in pro-inflammatory macrophages and decreases of anti-inflammatory macrophages.
79

80
Figure 24: Anti-IL-1α and anti-PD-1 modulate macrophage function on day 7. (A)
Composite viSNE map of IgG, anti-IL-1α, anti-PD1, and anti-IL-1α and anti-PD-1 groups
showing the distribution of immune cells in the tumor microenvironment.

81
Figure 25: Pseudocolor map of macrophage subsets on day 7. viSNE analysis identified
11 distinct macrophage populations.

82
Figure 26: Macrophage subset percentages in anti-IL-1α and anti-PD-1 treated tumors
on day 7. N=3. Unpaired T-test. Data represents at least 2 independent experiments.
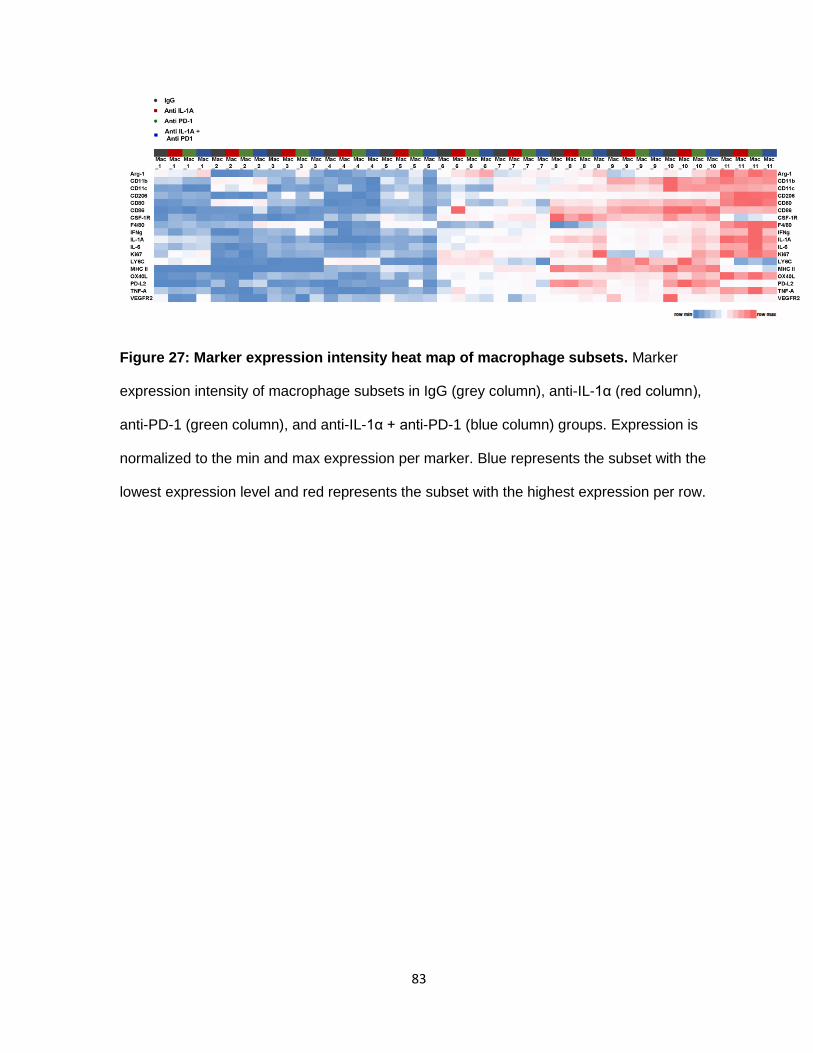
83
Figure 27: Marker expression intensity heat map of macrophage subsets. Marker
expression intensity of macrophage subsets in IgG (grey column), anti-IL-1α (red column),
anti-PD-1 (green column), and anti-IL-1α + anti-PD-1 (blue column) groups. Expression is
normalized to the min and max expression per marker. Blue represents the subset with the
lowest expression level and red represents the subset with the highest expression per row.

84
Figure 28: Marker expression histograms of macrophage subsets found in anti-IL-1α
and anti-PD-1 group. Blockade of IL-1α and PD-1 promotes pro-inflammatory

85
macrophages, while reducing anti-inflammatory macrophages. Values show min and max
values ± SEM. Data represents at least 2 independent experiments.
86
c. Combining anti-IL-1α and anti-PD-1 decreases non-activated monocytes.
In anti-IL-1α treated tumors, we observed the increase of non-activated monocytes.
However, in tumors treated with the anti-IL-1α and checkpoint blockade, we observe a
preference for activated monocytes instead of non-activated. viSNE analysis separated
monocytes into 7 subsets (Figure 29A). Mo_1 and Mo_6 were the two subsets that were
reduced in the combination group (Figure 29B). Mo_1 are non-activated monocytes, while
Mo_6 are monocytes with MHC-II expression, only. The Mo_3 subset increased in the
combination group. They are pro-inflammatory cells that produce TNF-α and IL-1α.

87
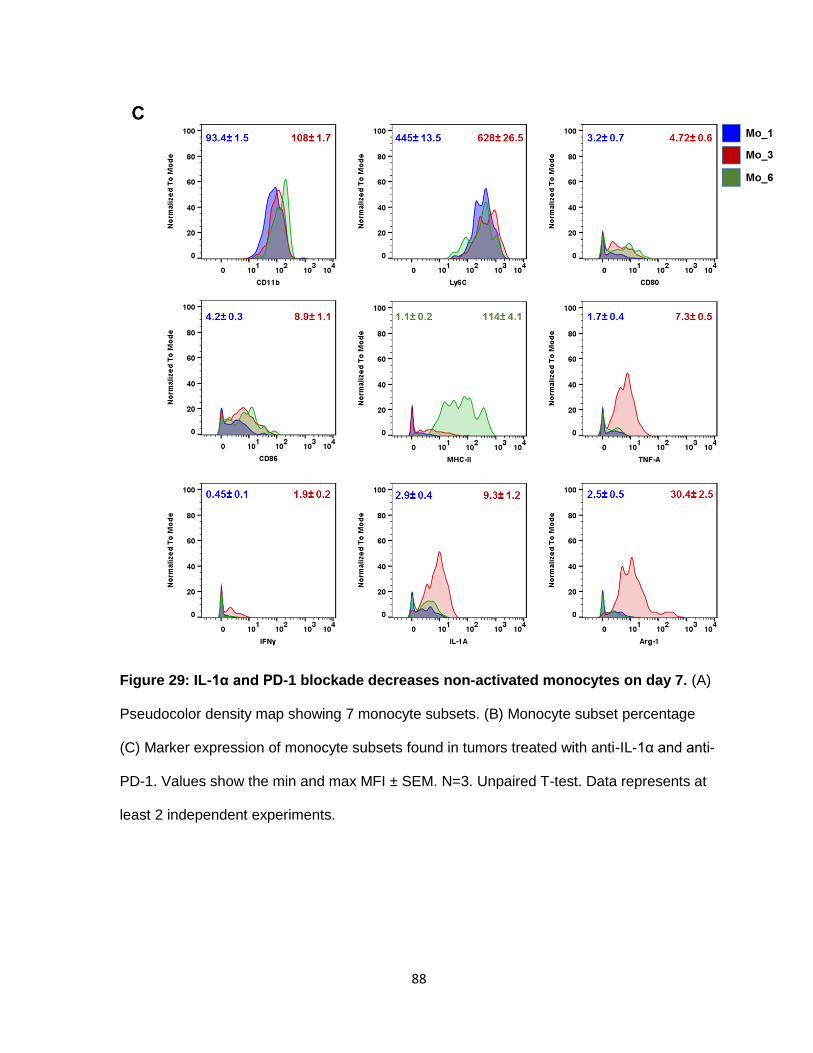
88
Figure 29: IL-1α and PD-1 blockade decreases non-activated monocytes on day 7. (A)
Pseudocolor density map showing 7 monocyte subsets. (B) Monocyte subset percentage
(C) Marker expression of monocyte subsets found in tumors treated with anti-IL-1α and anti-
PD-1. Values show the min and max MFI ± SEM. N=3. Unpaired T-test. Data represents at
least 2 independent experiments.

89
I. Combining anti-IL-1α and anti-PD-1 decreases CD8+ Ly6C+ T cells.
viSNE analysis segregated CD8+ T cells into 3 subtypes (Figure 30A). CD8_1 and
CD8_2 subsets expressed moderate levels of Ly6C (Figure 30C). These two subpopulations
were decreased in the combination group (Figure 30B). CD8_1 and CD8_2 are naïve T cells
that do not express IFNγ and TNF-α. Anti-IL-1α and anti-PD-1 increased the CD8_3 subset
in the tumor micro-environment. CD8_3 is the only subset that does not express Ly6C. The
function of Ly6C on T cells is still not completely clear. It has been associated with T cell
homing to the lymph nodes (128). Crosslinking of Ly6C, decreases IL-2 production by T
cells. Therefore, we can infer that reduction of Ly6C+ T cells increases IL-2 availability,
which in turn promotes proliferation in CD8+ T cells.
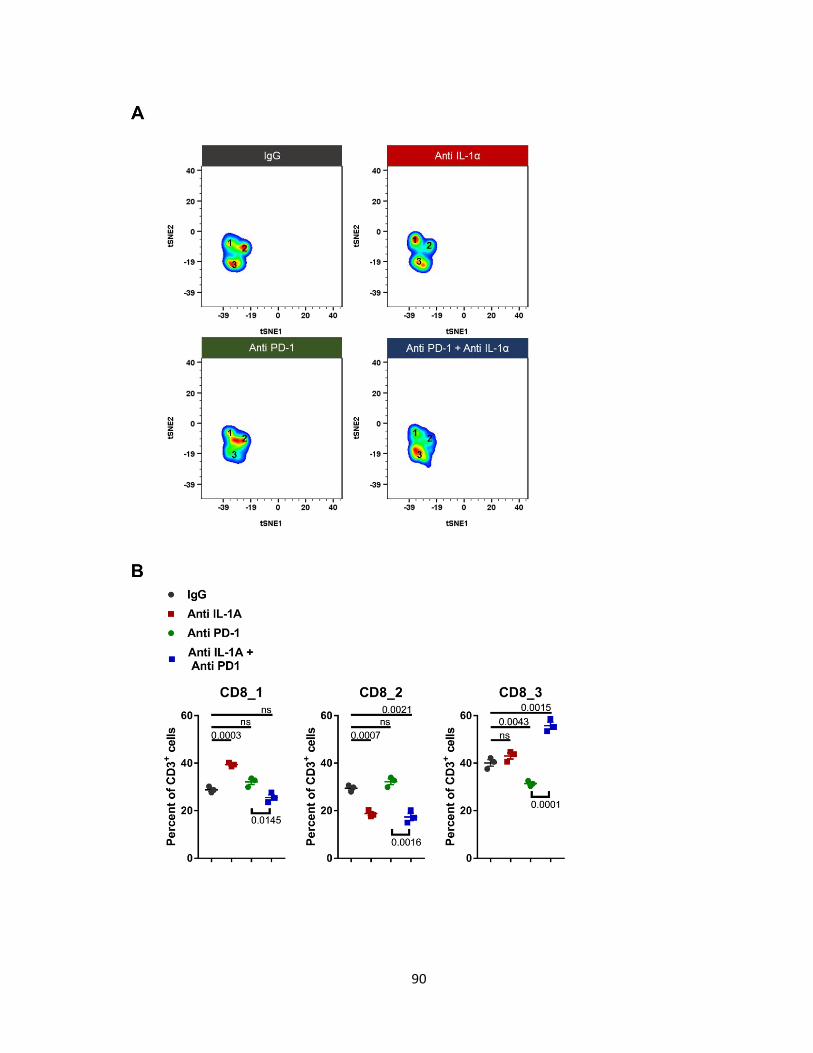
90

91
Figure 30: IL-1α and PD-1 blockade promotes CD8+LY6C- T cells on day 7. (A)
Pseudocolor density map showing 3 CD8+ T cell subsets. (B) CD8+ T cell subset
percentages. (C) Marker expression histograms of CD8+ T cell subsets. Values represent
the low (blue) and highest (red) value ± SEM. N=3. Unpaired T-test. Data represents at least
2 independent experiments.
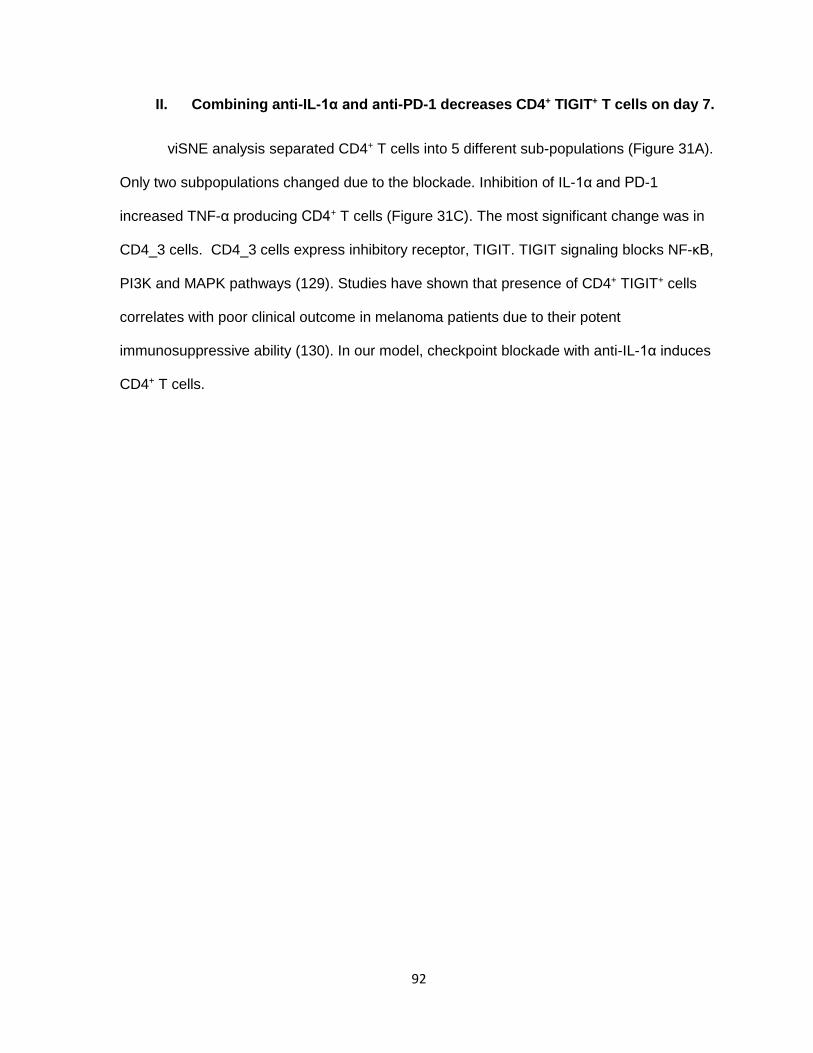
92
II. Combining anti-IL-1α and anti-PD-1 decreases CD4+ TIGIT+ T cells on day 7.
viSNE analysis separated CD4+ T cells into 5 different sub-populations (Figure 31A).
Only two subpopulations changed due to the blockade. Inhibition of IL-1α and PD-1
increased TNF-α producing CD4+ T cells (Figure 31C). The most significant change was in
CD4_3 cells. CD4_3 cells express inhibitory receptor, TIGIT. TIGIT signaling blocks NF-κB,
PI3K and MAPK pathways (129). Studies have shown that presence of CD4+ TIGIT+ cells
correlates with poor clinical outcome in melanoma patients due to their potent
immunosuppressive ability (130). In our model, checkpoint blockade with anti-IL-1α induces
CD4+ T cells.
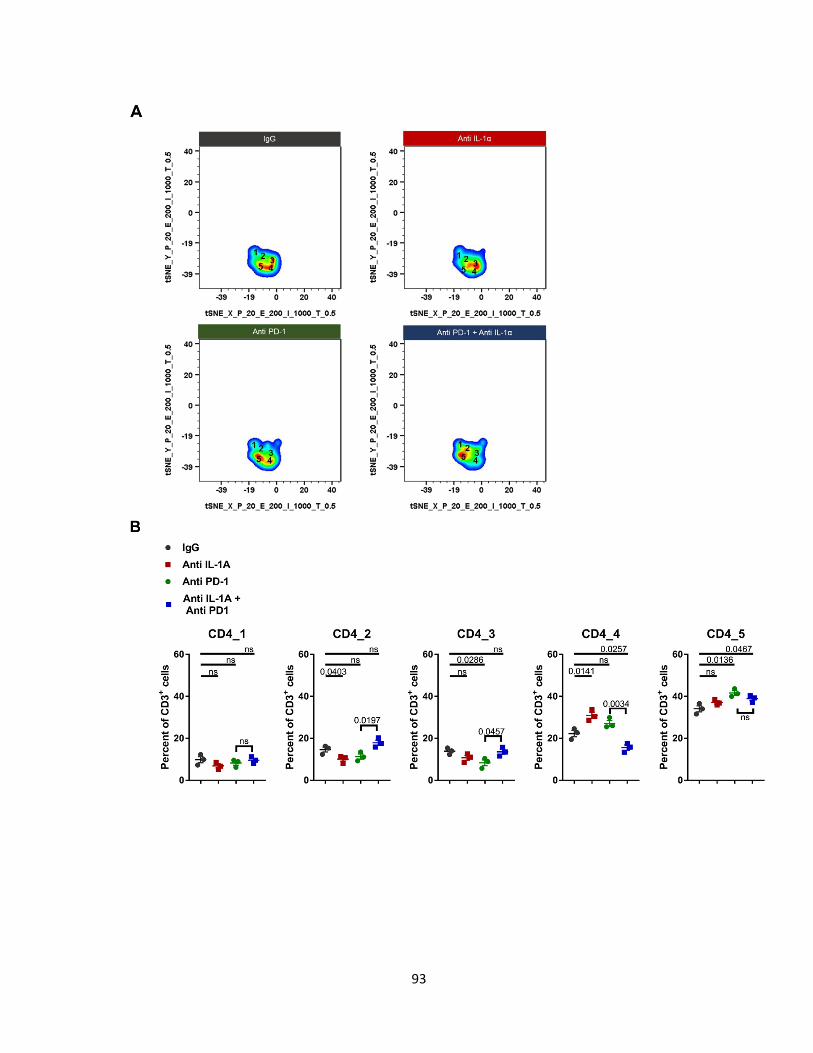
93

94
Figure 31: Anti-IL-1α and anti-PD-1 reduce CD4+ TIGIT+ T cells. (A) Pseudocolor density
map showing 5 CD4+ T cell subpopulations. (B) CD4 subtype percentage out of total T cells.
(C) Marker expression histograms. Values show low (blue) and max (red) MFI per marker ±
SEM. N=3. Unpaired T-test. Data represents at least 2 independent experiments.
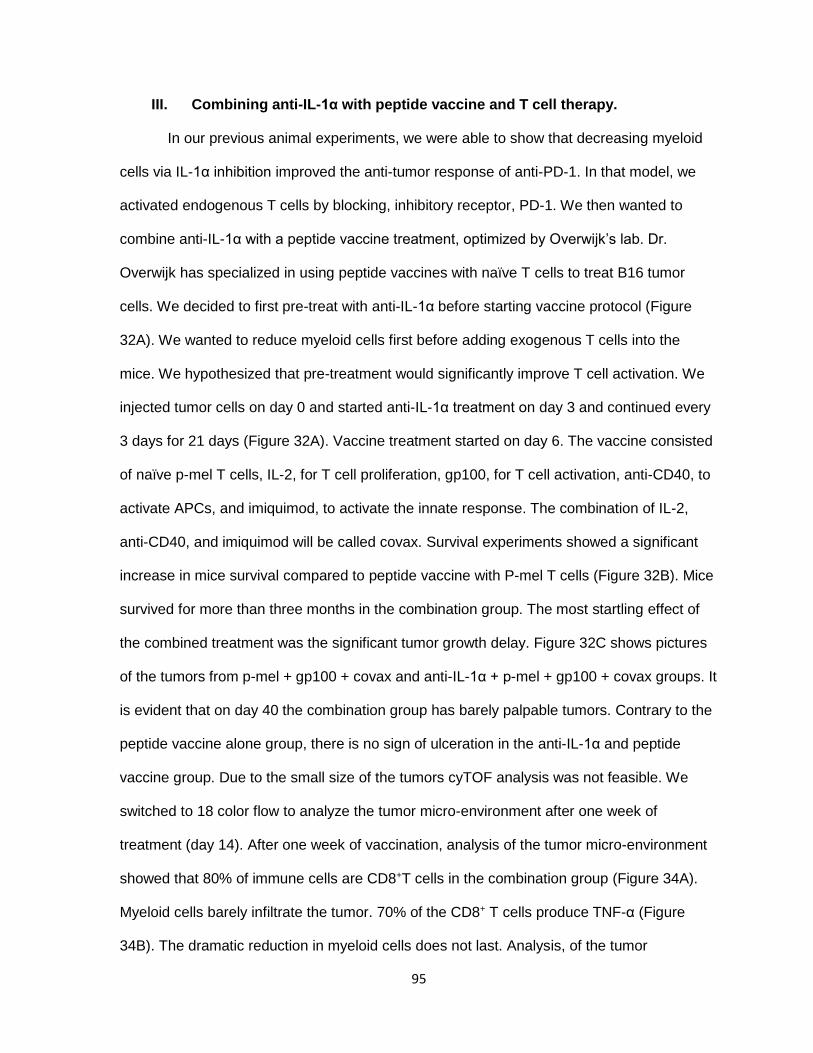
95
III. Combining anti-IL-1α with peptide vaccine and T cell therapy.
In our previous animal experiments, we were able to show that decreasing myeloid
cells via IL-1α inhibition improved the anti-tumor response of anti-PD-1. In that model, we
activated endogenous T cells by blocking, inhibitory receptor, PD-1. We then wanted to
combine anti-IL-1α with a peptide vaccine treatment, optimized by Overwijk’s lab. Dr.
Overwijk has specialized in using peptide vaccines with naïve T cells to treat B16 tumor
cells. We decided to first pre-treat with anti-IL-1α before starting vaccine protocol (Figure
32A). We wanted to reduce myeloid cells first before adding exogenous T cells into the
mice. We hypothesized that pre-treatment would significantly improve T cell activation. We
injected tumor cells on day 0 and started anti-IL-1α treatment on day 3 and continued every
3 days for 21 days (Figure 32A). Vaccine treatment started on day 6. The vaccine consisted
of naïve p-mel T cells, IL-2, for T cell proliferation, gp100, for T cell activation, anti-CD40, to
activate APCs, and imiquimod, to activate the innate response. The combination of IL-2,
anti-CD40, and imiquimod will be called covax. Survival experiments showed a significant
increase in mice survival compared to peptide vaccine with P-mel T cells (Figure 32B). Mice
survived for more than three months in the combination group. The most startling effect of
the combined treatment was the significant tumor growth delay. Figure 32C shows pictures
of the tumors from p-mel + gp100 + covax and anti-IL-1α + p-mel + gp100 + covax groups. It
is evident that on day 40 the combination group has barely palpable tumors. Contrary to the
peptide vaccine alone group, there is no sign of ulceration in the anti-IL-1α and peptide
vaccine group. Due to the small size of the tumors cyTOF analysis was not feasible. We
switched to 18 color flow to analyze the tumor micro-environment after one week of
treatment (day 14). After one week of vaccination, analysis of the tumor micro-environment
showed that 80% of immune cells are CD8+T cells in the combination group (Figure 34A).
Myeloid cells barely infiltrate the tumor. 70% of the CD8+ T cells produce TNF-α (Figure
34B). The dramatic reduction in myeloid cells does not last. Analysis, of the tumor

96
microenvironment on day 21 shows the re-population of myeloid cells (Figure 35). At this
stage, we do not observe large percentages of monocytes. But as we have seen in the
monotherapy, as the tumors become non-responsive to treatment they start increasing
myeloid infiltrates in the tumor, specifically monocytes.
97
Figure 32: IL-1α blockade and peptide vaccine with naïve CD8+ T cells extends mice
survival to over 3 months. (A) Treatment schedule (B) Kaplan-Meier curve showing
increased survival in the P-mel + covax + anti-IL-1α group compared to the P-mel + covax
group. (C) Pictures of tumors on day 40. Combination group shows no ulceration at this time
point.
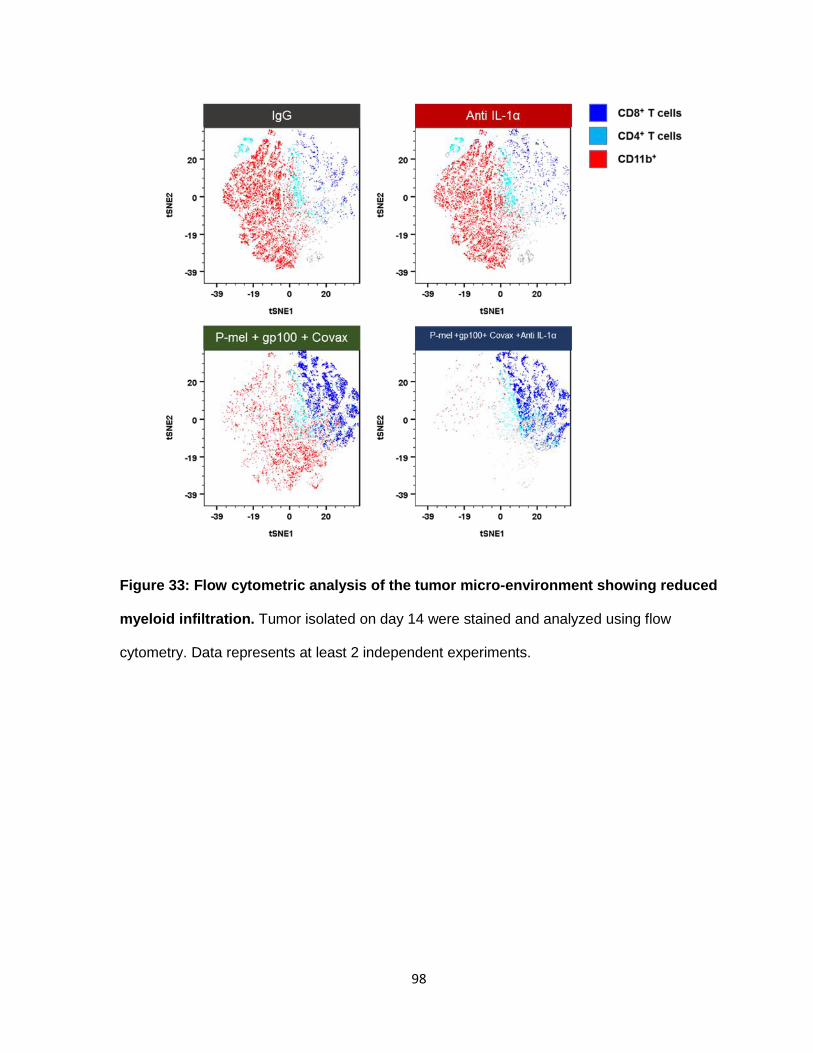
98
Figure 33: Flow cytometric analysis of the tumor micro-environment showing reduced
myeloid infiltration. Tumor isolated on day 14 were stained and analyzed using flow
cytometry. Data represents at least 2 independent experiments.

99
Figure 34: Immune response of anti-IL-1α and peptide vaccine consists of
predominantly TNF-α producing CD8+ T cells. (A) Percent of CD8+ T cells present in the
tumor on day 14 in each group (B) Plots showing TNF-α and Ly6C expression in CD8+ T

100
cells isolated from each group. Values show MFI ± SEM. Data represents at least 2
independent experiments.
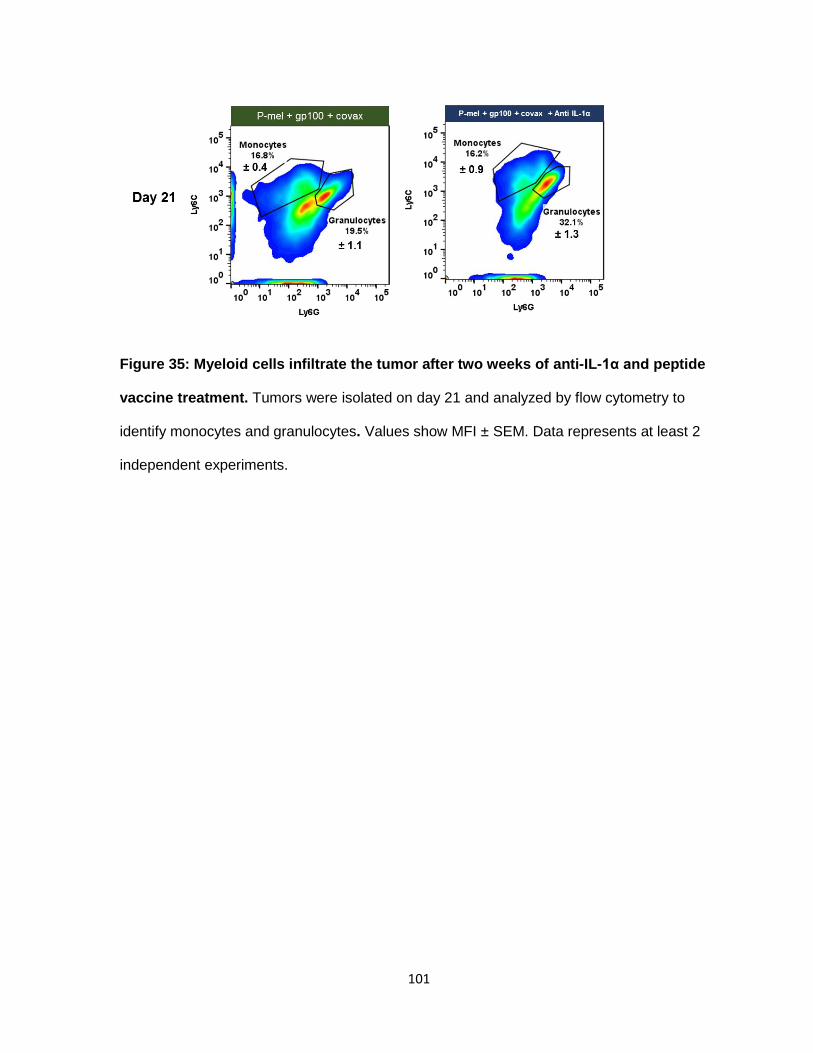
101
Figure 35: Myeloid cells infiltrate the tumor after two weeks of anti-IL-1α and peptide
vaccine treatment. Tumors were isolated on day 21 and analyzed by flow cytometry to
identify monocytes and granulocytes. Values show MFI ± SEM. Data represents at least 2
independent experiments.

102
III. Discussion
Chapter 3 of this dissertation, shows the potential of IL-1α blockade as a treatment in
metastatic melanoma. In chapter 4, we further prove the advantages of inhibiting IL-1α
before treating with T-cell mediated immunotherapies. Our studies with checkpoint blockade
and anti-IL-1α demonstrated the combined effect in increased survival of mice compared to
the control group. Analysis of the tumor micro-environment showed a decrease in non-
activated monocytes and an increase of pro-inflammatory monocytes. This is the opposite
effect seen in chapter 3. We believe this change is due to anti-PD-1-mediated responses.
Pro-inflammatory monocytes are major sources of TNF-α. TNF-α has dual roles in tumor
progression. TNF-α can activate the NFκB pathway leading to increased proliferation in
cells. Thus, TNF-α can increase the expansion of immune cells and tumor cells, equally. A
proper balance of TNF-α production is required to maintain an anti-tumor response.
Blockade of IL-1α and PD-1, also increases pro-inflammatory macrophages. These cell
secrete IFNγ, TNF-α, IL-1α and IL-6. These cytokines induce Th1 and Th2 responses in T
cells. Moreover, we were able to study macrophages in hybrid states. These macrophages
do not conform to the classical M1 vs M2 phenotype. They expressed both pro and anti-
inflammatory molecules. Inhibition of PD-1 and IL-1α decreased CD8+ T cell infiltration while
increasing CD4+ T cells. Specifically, CD8+, Ly6C+ subsets were reduced in the tumor micro-
environment. Furthermore, blockade promoted the expansion of CD4+ TNF-α+ T cells, while
decreasing an immunosuppressive subset identified by their TIGIT expression. Taken
together, we can see that inhibiting IL-α even in the presence of anti-PD1 skews the tumor
micro-environment to induce an anti-tumor response. In both models, we see a decrease in
monocytes cells. Our data suggests that monocytes are a key driver of immunosuppression
in our model.
Our last model, anti-IL-1α and peptide vaccine with naïve T cells, illustrates why we
studied the effects of IL-1α on the tumor micro-environment. Analysis of immune filtration
103
showed that in the combination group mostly CD8+T infiltrated the tumor. The effect was
temporary but enough to increase survival by a month.
IV. Material and Methods
Animal Experiments
Anti PD-1 antibody (clone 29F.1A12) and Rat IgG2a, κ were purchased from
BioXcell. The synthetic H-2Db restricted gp10025-33 peptide (KVPRNQDWL) was a gift from
Dr. Willem Overwijk’s lab. C57BL/6 mice were inoculated with 3 x 10⁵ B16.F10 gp100+ cells
s.c. on the belly. Three d later mice were treated with 100 μg of Flo1-2a (i.p), 200 μg Anti
PD-1 (i.p) or 100 μg IgG2a and, thereafter, 3x a week until end of experiment. For the
peptide vaccine experiment, on d 6 after tumor inoculation, mice were injected with 1000
naïve P-mel 1 T cells (i.v) and were vaccinated with one s.c injection in each flank of PBS
containing 100 μg of hgp100 and 50 μg of anti CD40. 5% Imiquimod cream was applied
topically on the vaccination site. 100,000 UI of hrIL-2 was injected (i.p) on d 0 and then 2x a
d for 2 d for a total of 500,000 UI. Tumors were measured using calipers and collected at
determined time points for tumor micro-environment analysis. For survival experiments,
mice were sacrificed when tumors reached 200 mm2 or became too ulcerated.
18 color flow cytometry
Single cell suspensions were prepared by carefully smashing tumors on a 70 μm
strainer using a plunger from a 3 ml syringe. Cells were kept at 4°C in PBS with 2% FBS
until needed. The following antibodies were used during flow cytometry analysis CD45,
CD3, CD8, CD11b, CD11c, CD19, CD25, CD49b, CD103, Arg-1, CD206, FoxP3, F4/80,
Ly6C, and Ly6G. Surface markers were stained in 2% FBS-PBS for 1 hr at RT. After
washing, cells were fixed and permeabilized using the cytofix/cytoperm kit (BD Bioscience)

104
according to the manufacturer’s protocol. Intracellular markers were stained for 1 hr at RT,
washed and then fixed with 1.6% paraformaldehyde. Cells were analyzed by X-20 fortessa.
Statistical Analysis
All results are expressed as (mean ± SEM). Animal group size was (n=10) unless
otherwise indicated. All experiments were repeated at least twice with comparable results.
Data was analyzed using non-paired t-test where appropriate and differences were
determined significant at (P<0.05). To compare survival, we used the Kaplan-Meier method
and log-rank test. Graphs were created using GraphPad Prism 6 software.
105
CHAPTER 5: DISCUSSION
Current advancements in technology and science have facilitated the design of
improved therapies to treat metastatic melanoma. Clinical trials have demonstrated the
effectiveness of immunotherapies in treating a wide range of cancer patients, especially
treatments that boost the activity of endogenous CD8+ T cells. Nevertheless, a major barrier
against effective T-cell mediated treatments is the rise of immunosuppressive cells and factors
in the tumor micro-environment mediated by the tumor. Our lab, published a tumor-dependent
mechanism in which abnormal activation of the MAPK pathway, via the induction of mutated
B-raf, led to the increase of NFκB, a modulator of IL-1 (123). The tumor-derived IL-1 can then
increase inhibitory molecules on neighboring cells in a paracrine fashion, potentially inhibiting
T cell cytotoxicity. The purpose of my project was to understand how IL-1α altered the
architecture of the tumor micro-environment. We hypothesized that blocking IL-1α would lead
to a decrease in immunosuppressive factors, improving T cell response. To gain insight into
IL-1α function in tumor development, we contacted XBioTech. They currently synthesize an
anti-human and anti-mouse IL-1α neutralizing antibody. Animal studies in aim 1,
demonstrated that blocking IL-1α led to a delay in tumor development. Due to the malignancy
of B16-F10, we did not expect to see any disease free mice. IL-1α blockade prolonged mouse
survival by ten days. The increase in survival and reduced growth rate can be attributed to
several functions of IL-1α in melanoma. First, IL-1α up-regulates VEGF, which promotes
tumor angiogenesis (131). Increase in vasculature leads to an increase in oxygen and
metabolic factors necessary for optimal cell growth and proliferation. Moreover, IL-1 directly
impacts the expression of adhesion molecules and metalloproteinases involved in the process
of tumor invasion (132). Increased expression of integrins on the surface of tumor cells, allow
cancer cells to more efficiently enter into circulation and seed in other areas. Lastly, IL-1α
increases other growth factors that can activate cell growth and proliferation pathways, such

106
as IL-8, IL-6, TNF-α and TGF-β (132). Thus reducing available IL-1α limits the tumor’s ability
to grow and expand, as demonstrated by our animal studies. However, due to an innate
redundancy in growth and proliferation pathways, tumors can activate other pathways to
overcome the effects of inhibiting IL-1α. Therefore, it is possible for some tumors to be more
sensitive to IL-1α blockade. Survival experiments showed that after six days of treatment,
tumor sizes started diverging in the anti-IL-α group. Certain tumors responded to anti-IL-1α
treatment and displayed a slower tumor growth rate, while others continued growing at a rapid
rate. The control group, which was injected with IgG, rarely survived past two weeks after
initial tumor inoculation. Aside from the effects of IL-1α on cancer growth and proliferation, we
were interested on the effects of IL-1α on infiltrating immune cells during early tumor
development. Of most interest were the changes in infiltrating myeloid cells, since IL-1
expression has been associated with the increase of MDSCs in the tumor (133). We used
flow cytometry and mass cytometry to phenotype all immune cells on day seven. As stated
earlier, size discrepancies were apparent after day 6, so we chose to analyze the tumor micro-
environment after one week of treatment to try to understand how immune cells respond to
lack of IL-1α, while the tumor is still developing. Mass cytometry or cyTOF allows the use of
35 surface and intracellular antibodies simultaneously. Contrary to flow cytometry, the use of
metal conjugates in lieu of fluorochromes, leads to a significant reduction in background. Our
findings demonstrated that IL-1α neutralization, results in a decrease in immune cell infiltrates,
identified by their expression of CD45. Further analysis, showed that mainly myeloid cell
trafficking was affected, consistent with published data. This effect on myeloid cells may be
explained by a decreased expression of known chemokines involved in myeloid cell
recruitment, such as, CXCL1 (neutrophils), CXCL14 (monocytes), and CXCL13
(macrophages) (134). Focusing on specific myeloid subsets, monocyte infiltration is drastically
reduced. The monocyte composition changed favoring non-activated monocytes and
monocytes expressing antigen presentation molecules: CD80, CD86 and MHC-II. This shift

107
may be due to a loss of anti-inflammatory cytokines needed for suppressive monocyte
polarization, like IL-6, CCL2, CXCL1, and CXCL10 (134). Moreover, we found an increase in
TNF-α expression across several cells when treated with anti-IL-1α. TNF-α induces the
differentiation of myeloid cells into pro-inflammatory cells (135). Thus, reduced IL-1α could
directly induce TNF-α production in immune cells which in turn can promote a pro-
inflammatory response. Similarly, macrophages displayed a propensity to express and
produce factors involved in a TH1 response. Specifically certain subsets had an increase
production of IL-1α and TNF-α, which are known cytokines linked to M1 macrophages.
Interestingly, there were macrophage subsets that exhibited both M1 and M2 markers. This
can be explained by the plasticity of macrophages. When encountering TH1 and TH2 signals,
macrophages can quickly move across the differentiation spectrum (16). On day 7, the Mac_7
subset expressed M2-associated molecules such as Arg-1, and CD206, while also,
expressing M1-associated markers MHC-II, CD80, CD86 and TNF-α. Finally, the last
observed changed in myeloid cells was the increase of granulocytes. Research has shown
that in most cancers, granulocyte presence correlates with a poor prognosis. Specifically, an
increase in the neutrophil to lymphocyte ratio is associated with worse outcomes in solid
tumors (136). Early decrease in neutrophil to lymphocyte ratio due to targeted treatment leads
to favorable outcomes. Thus, reduction in granulocytes would be an advantageous result.
However, our data shows the opposite result. Tumors treated with anti-IL-1α have an increase
in granulocytes. We observed no difference, in their surface marker profile, between
granulocytes in the control group versus the treated group. Anti-IL-1α granulocytes exhibited
higher TNF-α levels, hinting at the possibility of N1 neutrophils. Neutrophils and PMN-MDSCs
have similar phenotypes and can only be distinguished by extensive functional studies in vitro.
Analogous to macrophages, neutrophils can be commonly categorized into N1 and N2
neutrophils. N1 neutrophils express elevated levels of TNF-α and ICAM1a and have tumor
killing abilities (137). Alternatively, N2 neutrophils produce IL-6, CCL2, CXCL1 and CXCL10,

108
iNOS, and Arg-1. N2 neutrophils have been linked to help in tumor initiation, growth,
proliferating and metastatic spread (137). Based on the elevated levels of TNF-α in myeloid
cells treated with anti-IL-1α, we can speculate that the infiltrating granulocytes can be N1
neutrophils. Ex-vivo analysis of immunosuppressive factors in myeloid cells, identified by
CD11b, showed a decrease in arginase-1 and nitric oxide production, suggesting that the
majority of anti-IL-1α myeloid cells have reduced immunosuppressive abilities. Moreover, we
directly demonstrated that these cells have a decreased capacity in inhibiting T cell function
and activity, in vitro. T cell analysis shows that on day 7, IL-1α inhibition increases T cell
infiltration, specifically CD4+ T cells. Neither CD8+ nor CD4+ T cells expressed TH1-related
factors such as IFN-γ, Granzyme B, and TNF-α. Thus, on day 7, IL-1α blockade does not elicit
a TH1 response in T cells. It could be possible that at a later time point, we can observe the
induction of these factors, or that in our model T cell response is not TH1-dependent. Based
on our studies IL-1α blockade is not sufficient to mount a robust immune response. It is clear,
that suppressive myeloid cell reduction is not enough to obtain a lasting anti-tumor effect.
Finally, analysis of terminal day tumors, showed that the changes observed in the tumor
micro-environment by inhibiting IL-1α are not sustained. Termination day tumors in both
control and treated groups have similar myeloid cell compositions, even though anti-IL-1α is
administered until the end of the experiment. It’s possible that tumors over-express IL-1α so
the antibody dosage is not enough to neutralize all available IL-1α. In the future, testing
progressive escalating doses of anti-IL-1α could be beneficial in prolonging the anti-tumor
response. Cancer cells could be activating alternative pathways to drive immunosuppression,
which are IL-1α independent. This immune evasion mechanism is commonly seen in patients
that have undergone targeted therapy. For instance, patients treated with B-raf inhibitor exhibit
abnormal up-regulation of other genes in the MAPK pathway which leads to increased
proliferation and survival. Similarly, tumors could be up-regulating other cytokines including
IL-6, IL-8, and IL-10 which are also involved in the recruitment of myeloid cells into the tumor

109
(138). Taking into consideration all these factors, to induce long lasting anti-tumor effects, it
is necessary to combine IL-1α blockade with other therapies. In aim 2, we test the synergy of
IL-1α blockade with T-cell mediated immunotherapies.
The second animal model tested the joint effect of anti-IL-1α with anti-PD-1. The
decrease in myeloid cells, due to IL-1α inhibition combined with the improved T cell activity,
due to anti-PD-1, furthered delayed tumor growth, compared to anti-IL-1α monotherapy alone.
Twenty percent of mice survived for a month. Analysis of the tumor micro-environment painted
a similar picture as seen in the monotherapy setting. Overall myeloid cells decreased in the
combination group, as expected. This change was due to a decrease in the monocyte
population. The remaining monocytic cells presented pro-inflammatory molecules on their
surface. The combination of anti-IL-1α and anti-PD-1 increased the differentiation of
monocytes, based on their increased number of markers displayed. This could be partially
due to the unintended activation of monocytes by anti-PD-1. Studies have shown that certain
macrophages and monocytes express PD-1 on their surface (139). Ligation of the PD-1
receptor may have started an activation cascade that converted monocytes into activated pro-
inflammatory monocytes or macrophages. This could also explain the unexpected rise of
macrophages in the combination group. Joint activity of anti-IL-1α and anti-PD-1 produced an
environment that favored M1 macrophage activation and proliferation. Startlingly, there was
no strong TH1 T cell response in tumors treated with the combination. Anti-PD-1 works by
preventing T cell activity inhibition, so we were expecting the presence of activated TH1 T
cells. However, at this time point both CD8+ and CD4+ T cells lacked IFN-γ, and Granzyme B
production. Based on this and data from our previous model, it would be valuable to test T cell
activity at different time points to understand the kinetics of T cell activation in the absence of
IL-1α. From our findings, it is evident that additional factors are needed to prime and activate
T cells. Therefore, in our last model we combined anti-IL-1α with a peptide vaccine and naïve
110
CD8+ p-mel T cells. The peptide vaccine contained the peptide, gp100, which can prime p-
mel+ T cells, anti-CD40, increases T cell priming by activating APCs, IL-2, induces T cell
proliferation and imiquimod, a TLR agonist that increases APC activity. Contrary to our anti-
PD-1 and anti-IL-1α model, we started anti-IL-1α treatment three days before the vaccine day,
this resulted in a significant decrease of myeloid cell infiltration after one week of vaccine
treatment. With this combination, mice survival was extended for a month compared to the
peptide vaccine alone. Tumor growth was significantly delayed. Pictures of tumors on day 40
show barely palpable tumors with no ulceration. Analysis of the tumor micro-environment after
one week of vaccine, showed that almost 80% of immune cells were CD8+ T cells. Consistent
with a Th1 response, CD8+ T cells expressed high levels of TNF-α and IFN-γ. We saw no
significant difference in IFN-γ levels, but saw an increase in TNF-α, which was the most
common up-regulated molecule across all cells. As in the earlier models, TNF-α plays an
important role in the conversion of the tumor micro-environment into a less
immunosuppressive surrounding. Studies have shown that low levels of IL-1 can induce local
inflammation which leads to an immune response; however, high levels of IL-1 can instead
induce anti-inflammatory responses to attenuate the increased immune response (110). So,
low levels of IL-1α can directly increase TNF-α production in cells in a paracrine fashion
resulting in a favorable anti-tumor response. This point seems critical in patient care since
depending on the expression of IL-1 in tumors, the anti-IL-1 dosage might have to be
optimized in a patient to patient basis to obtain satisfactory results.
Our data suggests that anti-IL-1α has potential in delaying tumor growth when
combined with the appropriate therapy in patients. Nevertheless, there a few things to
consider. In our most promising model, we obtained almost complete inhibition of myeloid cell
trafficking into the tumor, which greatly increased T cell presence, but most importantly TNF-
α and other TH1 cytokines. Unregulated synthesis of these cytokines could induce
111
autoimmune diseases in patients. Therefore, in patients it would be appropriate to combine
anti-IL-1α with CAR T cell therapy, to avoid having to add the extra immune modulating
factors. In some cases, patients would have to be administered steroids to decrease the
cytokine storm. Moreover reduction of anti-inflammatory myeloid cells potentially reduce
factors involved in angiogenesis, tumor growth and survival. Due to this, IL-1α blockade is
more pertinent when tumors are just starting to grow to limit several pro-tumor mechanisms
simultaneously. Anti-IL-1α could be administered to patients that have just undergone tumor
resection, to avoid possible recurrence and further metastases. For advanced solid tumors,
IL-1α monotherapy is not sufficient and would have to be combined with other T cell-mediated
immunotherapies. Patients undergoing ACT could be administered with anti-IL-1α after whole-
body irradiation to prevent the trafficking of suppressive cells to the tumor site before T cell
infusion.
This project started by trying to understand how IL-1α modulates immune response
during tumor development. In this manuscript, we suggest that the anti-tumor effect is mostly
myeloid cell driven. Lack of IL-1α promoted the differentiation of pro-inflammatory monocytes
and macrophages, which are involved in T cell priming and direct cancer cell killing. The
reduction in suppressive myeloid cells led to an increase in anti-tumor response. Most
importantly, we were able to wield the capabilities of anti-IL-1α to limit immunosuppression to
improve checkpoint blockade and peptide vaccine immunotherapies in mice. Further studies
with other immunotherapies would give us a better insight into which treatments synergize
with anti-IL-1α blockade. For instance, we have only explored anti-PD-1, future studies could
focus on treating mice with anti-IL-1α and anti-CTLA-4. We would expect an even better anti-
tumor response since anti-CTLA-4 also blocks the activation of Tregs. Another possible
treatment route is targeted therapy. Melanoma cells over express oncogenic B-raf and MEK.
Combining anti-IL-1α with B-raf and MEK inhibitors could potentially increase the activity of T

112
cells due to the increase in available stimulating peptides. Finally, to improve our phenotypic
profile, we could combine genetic profiling based on single cell RNA-seq. In this manner, we
could identify which genes are up- or down- regulated with IL-1α blockade. This could give us
a hint into other possible targets to combine with anti-IL-1α.

113
References
1. Buchmann, K. 2014. Evolution of Innate Immunity: Clues from Invertebrates via Fish to Mammals. Front Immunol 5: 459.
2. Gasteiger, G., A. D'Osualdo, D. A. Schubert, A. Weber, E. M. Bruscia, and D. Hartl. 2017. Cellular Innate Immunity: An Old Game with New Players. J Innate Immun 9: 111-125.
3. Kawai, T., and S. Akira. 2010. The role of pattern-recognition receptors in innate immunity: update on Toll-like receptors. Nat Immunol 11: 373-384.
4. Pluddemann, A., S. Mukhopadhyay, and S. Gordon. 2011. Innate immunity to intracellular pathogens: macrophage receptors and responses to microbial entry. Immunol Rev 240: 11-24.
5. Griffith, J. W., C. L. Sokol, and A. D. Luster. 2014. Chemokines and chemokine receptors: positioning cells for host defense and immunity. Annu Rev Immunol 32: 659-702.
6. van der Meer, J. W., L. A. Joosten, N. Riksen, and M. G. Netea. 2015. Trained immunity: A smart way to enhance innate immune defence. Mol Immunol 68: 40-44.
7. Bedoui, S., T. Gebhardt, G. Gasteiger, and W. Kastenmuller. 2016. Parallels and differences between innate and adaptive lymphocytes. Nature Immunology 17: 490-494.
8. Pillay, J., I. den Braber, N. Vrisekoop, L. M. Kwast, R. J. de Boer, J. A. M. Borghans, K. Tesselaar, and L. Koenderman. 2010. In vivo labeling with (H2O)-H-2 reveals a human neutrophil lifespan of 5.4 days. Blood 116: 625-627.
9. Gabrilovich, D. I., and S. Nagaraj. 2009. Myeloid-derived suppressor cells as regulators of the immune system. Nature Reviews Immunology 9: 162-174.
10. Hager, M., J. B. Cowland, and N. Borregaard. 2010. Neutrophil granules in health and disease. J Intern Med 268: 25-34.
11. Murray, P. J., and T. A. Wynn. 2011. Protective and pathogenic functions of macrophage subsets. Nat Rev Immunol 11: 723-737.
12. Westphalen, K., G. A. Gusarova, M. N. Islam, M. Subramanian, T. S. Cohen, A. S. Prince, and J. Bhattacharya. 2014. Sessile alveolar macrophages communicate with alveolar epithelium to modulate immunity. Nature 506: 503-506.
13. Lee, G. R., and M. M. Wintrobe. 1993. Wintrobe's clinical hematology. Lea & Febiger, Philadelphia.
14. van de Laar, L., W. Saelens, S. De Prijck, L. Martens, C. L. Scott, G. Van Isterdael, E. Hoffmann, R. Beyaert, Y. Saeys, B. N. Lambrecht, and M. Guilliams. 2016. Yolk Sac Macrophages, Fetal Liver, and Adult Monocytes Can Colonize an Empty Niche and Develop into Functional Tissue-Resident Macrophages. Immunity 44: 755-768.
15. Perdiguero, E. G., and F. Geissmann. 2016. The development and maintenance of resident macrophages. Nat Immunol 17: 2-8.
16. Sica, A., and A. Mantovani. 2012. Macrophage plasticity and polarization: in vivo veritas. J Clin Invest 122: 787-795.
17. Xue, J., S. V. Schmidt, J. Sander, A. Draffehn, W. Krebs, I. Quester, D. De Nardo, T. D. Gohel, M. Emde, L. Schmidleithner, H. Ganesan, A. Nino-Castro, M. R. Mallmann, L. Labzin, H. Theis, M. Kraut, M. Beyer, E. Latz, T. C. Freeman, T. Ulas, and J. L. Schultze. 2014. Transcriptome-based network analysis reveals a spectrum model of human macrophage activation. Immunity 40: 274-288.
18. Netea, M. G., L. A. Joosten, E. Latz, K. H. Mills, G. Natoli, H. G. Stunnenberg, L. A. O'Neill, and R. J. Xavier. 2016. Trained immunity: A program of innate immune memory in health and disease. Science 352: aaf1098.

114
19. Bronte, V., S. Brandau, S. H. Chen, M. P. Colombo, A. B. Frey, T. F. Greten, S. Mandruzzato, P. J. Murray, A. Ochoa, S. Ostrand-Rosenberg, P. C. Rodriguez, A. Sica, V. Umansky, R. H. Vonderheide, and D. I. Gabrilovich. 2016. Recommendations for myeloid-derived suppressor cell nomenclature and characterization standards. Nature communications 7: 12150.
20. Sica, A., and V. Bronte. 2007. Altered macrophage differentiation and immune dysfunction in tumor development. J Clin Invest 117: 1155-1166.
21. Corzo, C. A., T. Condamine, L. Lu, M. J. Cotter, J. I. Youn, P. Cheng, H. I. Cho, E. Celis, D. G. Quiceno, T. Padhya, T. V. McCaffrey, J. C. McCaffrey, and D. I. Gabrilovich. 2010. HIF-1alpha regulates function and differentiation of myeloid-derived suppressor cells in the tumor microenvironment. J Exp Med 207: 2439-2453.
22. Sinha, P., V. K. Clements, S. K. Bunt, S. M. Albelda, and S. Ostrand-Rosenberg. 2007. Cross-talk between myeloid-derived suppressor cells and macrophages subverts tumor immunity toward a type 2 response. Journal of Immunology 179: 977-983.
23. Li, H. Q., Y. M. Han, Q. L. Guo, M. G. Zhang, and X. T. Cao. 2009. Cancer-Expanded Myeloid-Derived Suppressor Cells Induce Anergy of NK Cells through Membrane-Bound TGF-beta 1. Journal of Immunology 182: 240-249.
24. Gabrilovich, D. I., M. P. Velders, E. M. Sotomayor, and W. M. Kast. 2001. Mechanism of immune dysfunction in cancer mediated by immature Gr-1+ myeloid cells. J Immunol 166: 5398-5406.
25. Saio, M., S. Radoja, M. Marino, and A. B. Frey. 2001. Tumor-infiltrating macrophages induce apoptosis in activated CD8(+) T cells by a mechanism requiring cell contact and mediated by both the cell-associated form of TNF and nitric oxide. Journal of Immunology 167: 5583-5593.
26. Gabrilovich, D. 2004. Mechanisms and functional significance of tumour-induced dendritic-cell defects. Nat Rev Immunol 4: 941-952.
27. Munn, D. H., and A. L. Mellor. 2004. IDO and tolerance to tumors. Trends Mol Med 10: 15-18.
28. Srivastava, M. K., P. Sinha, V. K. Clements, P. Rodriguez, and S. Ostrand-Rosenberg. 2010. Myeloid-derived suppressor cells inhibit T-cell activation by depleting cystine and cysteine. Cancer Res 70: 68-77.
29. Huang, B., P. Y. Pan, Q. Li, A. I. Sato, D. E. Levy, J. Bromberg, C. M. Divino, and S. H. Chen. 2006. Gr-1+CD115+ immature myeloid suppressor cells mediate the development of tumor-induced T regulatory cells and T-cell anergy in tumor-bearing host. Cancer Res 66: 1123-1131.
30. Hanson, E. M., V. K. Clements, P. Sinha, D. Ilkovitch, and S. Ostrand-Rosenberg. 2009. Myeloid-derived suppressor cells down-regulate L-selectin expression on CD4+ and CD8+ T cells. J Immunol 183: 937-944.
31. Bonilla, F. A., and H. C. Oettgen. 2010. Adaptive immunity. J Allergy Clin Immunol 125: S33-40.
32. Cooper, M. D., and M. N. Alder. 2006. The evolution of adaptive immune systems. Cell 124: 815-822.
33. Hedrick, S. M. 2008. Thymus lineage commitment: a single switch. Immunity 28: 297-299. 34. Jenkinson, E. J., W. E. Jenkinson, S. W. Rossi, and G. Anderson. 2006. The thymus and T-cell
commitment: the right niche for Notch? Nat Rev Immunol 6: 551-555. 35. Oltz, E. M., and O. Osipovich. 2007. Targeting V(D)J recombinase: putting a PHD to work.
Immunity 27: 539-541. 36. Dustin, M. L. 2009. The cellular context of T cell signaling. Immunity 30: 482-492.

115
37. Malissen, B., and P. Bongrand. 2015. Early T cell activation: integrating biochemical, structural, and biophysical cues. Annu Rev Immunol 33: 539-561.
38. Ruland, J., and T. W. Mak. 2003. From antigen to activation: specific signal transduction pathways linking antigen receptors to NF-kappaB. Semin Immunol 15: 177-183.
39. Van Parijs, L., and A. K. Abbas. 1998. Homeostasis and self-tolerance in the immune system: turning lymphocytes off. Science 280: 243-248.
40. Bretscher, P. A. 1999. A two-step, two-signal model for the primary activation of precursor helper T cells. Proc Natl Acad Sci U S A 96: 185-190.
41. Boise, L. H., A. J. Minn, P. J. Noel, C. H. June, M. A. Accavitti, T. Lindsten, and C. B. Thompson. 1995. CD28 costimulation can promote T cell survival by enhancing the expression of Bcl-XL. Immunity 3: 87-98.
42. Curtsinger, J. M., and M. F. Mescher. 2010. Inflammatory cytokines as a third signal for T cell activation. Curr Opin Immunol 22: 333-340.
43. Society, A. C. 2018. Cancer Facts & Figures 2018. Atlanta: American Cancer Society. 44. Leonardi, G. C., L. Falzone, R. Salemi, A. Zanghi, D. A. Spandidos, J. A. McCubrey, S. Candido,
and M. Libra. 2018. Cutaneous melanoma: From pathogenesis to therapy (Review). Int J Oncol 52: 1071-1080.
45. Curtin, J. A., J. Fridlyand, T. Kageshita, H. N. Patel, K. J. Busam, H. Kutzner, K. H. Cho, S. Aiba, E. B. Brocker, P. E. LeBoit, D. Pinkel, and B. C. Bastian. 2005. Distinct sets of genetic alterations in melanoma. N Engl J Med 353: 2135-2147.
46. Rastrelli, M., S. Tropea, C. R. Rossi, and M. Alaibac. 2014. Melanoma: epidemiology, risk factors, pathogenesis, diagnosis and classification. In Vivo 28: 1005-1011.
47. Bevona, C., W. Goggins, T. Quinn, J. Fullerton, and H. Tsao. 2003. Cutaneous melanomas associated with nevi. Arch Dermatol 139: 1620-1624; discussion 1624.
48. Goldstein, A. M., and M. A. Tucker. 2001. Genetic epidemiology of cutaneous melanoma: a global perspective. Arch Dermatol 137: 1493-1496.
49. Kamb, A., N. A. Gruis, J. Weaver-Feldhaus, Q. Liu, K. Harshman, S. V. Tavtigian, E. Stockert, R. S. Day, 3rd, B. E. Johnson, and M. H. Skolnick. 1994. A cell cycle regulator potentially involved in genesis of many tumor types. Science 264: 436-440.
50. Serrano, M., G. J. Hannon, and D. Beach. 1993. A new regulatory motif in cell-cycle control causing specific inhibition of cyclin D/CDK4. Nature 366: 704-707.
51. Wolfel, T., M. Hauer, J. Schneider, M. Serrano, C. Wolfel, E. Klehmann-Hieb, E. De Plaen, T. Hankeln, K. H. Meyer zum Buschenfelde, and D. Beach. 1995. A p16INK4a-insensitive CDK4 mutant targeted by cytolytic T lymphocytes in a human melanoma. Science 269: 1281-1284.
52. Domingues, B., J. M. Lopes, P. Soares, and H. Populo. 2018. Melanoma treatment in review. Immunotargets Ther 7: 35-49.
53. Balkwill, F., and A. Mantovani. 2001. Inflammation and cancer: back to Virchow? Lancet 357: 539-545.
54. Rafique, I., J. M. Kirkwood, and A. A. Tarhini. 2015. Immune checkpoint blockade and interferon-alpha in melanoma. Semin Oncol 42: 436-447.
55. Sanlorenzo, M., I. Vujic, F. Carnevale-Schianca, P. Quaglino, L. Gammaitoni, M. T. Fierro, M. Aglietta, and D. Sangiolo. 2017. Role of interferon in melanoma: old hopes and new perspectives. Expert Opin Biol Ther 17: 475-483.
56. Raig, E. T., N. B. Jones, K. A. Varker, K. Benniger, M. R. Go, J. L. Biber, G. B. Lesinski, and W. E. Carson, 3rd. 2008. VEGF secretion is inhibited by interferon-alpha in several melanoma cell lines. J Interferon Cytokine Res 28: 553-561.
116
57. Mcmillan, T. J., J. Rao, C. A. Everett, and I. R. Hart. 1987. Interferon-Induced Alterations in Metastatic Capacity, Class-1 Antigen Expression and Natural-Killer-Cell Sensitivity of Melanoma-Cells. International Journal of Cancer 40: 659-663.
58. Bustelo, X. R. 2018. RHO GTPases in cancer: known facts, open questions, and therapeutic challenges. Biochem Soc T 46: 741-760.
59. Krieg, C., S. Letourneau, G. Pantaleo, and O. Boyman. 2010. Improved IL-2 immunotherapy by selective stimulation of IL-2 receptors on lymphocytes and endothelial cells. Proc Natl Acad Sci U S A 107: 11906-11911.
60. Brunet, J. F., F. Denizot, M. F. Luciani, M. Rouxdosseto, M. Suzan, M. G. Mattei, and P. Golstein. 1987. A New Member of the Immunoglobulin Superfamily - Ctla-4. Nature 328: 267-270.
61. Krummel, M. F., and J. P. Allison. 1995. CD28 and CTLA-4 have opposing effects on the response of T cells to stimulation. J Exp Med 182: 459-465.
62. Collins, A. V., D. W. Brodie, R. J. Gilbert, A. Iaboni, R. Manso-Sancho, B. Walse, D. I. Stuart, P. A. van der Merwe, and S. J. Davis. 2002. The interaction properties of costimulatory molecules revisited. Immunity 17: 201-210.
63. Allison, J. P., and M. F. Krummel. 1995. The Yin and Yang of T cell costimulation. Science 270: 932-933.
64. Brunner, M. C., C. A. Chambers, F. K. Chan, J. Hanke, A. Winoto, and J. P. Allison. 1999. CTLA-4-Mediated inhibition of early events of T cell proliferation. J Immunol 162: 5813-5820.
65. Nishimura, H., M. Nose, H. Hiai, N. Minato, and T. Honjo. 1999. Development of lupus-like autoimmune diseases by disruption of the PD-1 gene encoding an ITIM motif-carrying immunoreceptor. Immunity 11: 141-151.
66. Latchman, Y., C. Wood, T. Chemova, Y. Iwai, N. Malenkovich, A. Long, K. Bourque, V. Boussiotis, H. Nishimura, T. Honjo, A. Sharpe, and G. Freeman. 2001. PD-L2, a novel B7 homologue, is a second ligand for PD-1 and inhibits T cell activation. Faseb Journal 15: A345-A345.
67. Brown, J. A., D. M. Dorfman, F. R. Ma, E. L. Sullivan, O. Munoz, C. R. Wood, E. A. Greenfield, and G. J. Freeman. 2003. Blockade of programmed death-1 ligands on dendritic cells enhances T cell activation and cytokine production. J Immunol 170: 1257-1266.
68. Seidel, J. A., A. Otsuka, and K. Kabashima. 2018. Anti-PD-1 and Anti-CTLA-4 Therapies in Cancer: Mechanisms of Action, Efficacy, and Limitations. Front Oncol 8: 86.
69. Larkin, J., F. S. Hodi, and J. D. Wolchok. 2015. Combined Nivolumab and Ipilimumab or Monotherapy in Untreated Melanoma. N Engl J Med 373: 1270-1271.
70. Perrie, Y., D. Kirby, V. W. Bramwell, and A. R. Mohammed. 2007. Recent developments in particulate-based vaccines. Recent Pat Drug Deliv Formul 1: 117-129.
71. Atkins, E., and W. B. Wood, Jr. 1955. Studies on the pathogenesis of fever. II. Identification of an endogenous pyrogen in the blood stream following the injection of typhoid vaccine. J Exp Med 102: 499-516.
72. Murphy, P. A., P. J. Chesney, and W. B. Wood. 1974. Further Purification of Rabbit Leukocyte Pyrogen. Journal of Laboratory and Clinical Medicine 83: 310-322.
73. Bodel, P., and E. Atkins. 1967. Release of endogenous pyrogen by human monocytes. N Engl J Med 276: 1002-1008.
74. Bodel, P., P. Ralph, K. Wenc, and J. C. Long. 1980. Endogenous pyrogen production by Hodgkin's disease and human histiocytic lymphoma cell lines in vitro. J Clin Invest 65: 514-518.
75. Dinarello, C. A., L. Renfer, and S. M. Wolff. 1977. Human leukocytic pyrogen: purification and development of a radioimmunoassay. Proc Natl Acad Sci U S A 74: 4624-4627.

117
76. Tewari, A., W. C. Buhles, Jr., and H. F. Starnes, Jr. 1990. Preliminary report: effects of interleukin-1 on platelet counts. Lancet 336: 712-714.
77. Merriman, C. R., L. A. Pulliam, and R. F. Kampschmidt. 1977. Comparison of leukocytic pyrogen and leukocytic endogenous mediator. Proc Soc Exp Biol Med 154: 224-227.
78. Woo, P., J. Sipe, C. A. Dinarello, and H. R. Colten. 1987. Structure of a human serum amyloid A gene and modulation of its expression in transfected L cells. J Biol Chem 262: 15790-15795.
79. Dinarello, C. A., N. P. Goldin, and S. M. Wolff. 1974. Demonstration and characterization of two distinct human leukocytic pyrogens. J Exp Med 139: 1369-1381.
80. Stevenson, F. T., F. Torrano, R. M. Locksley, and D. H. Lovett. 1992. Interleukin 1: the patterns of translation and intracellular distribution support alternative secretory mechanisms. J Cell Physiol 152: 223-231.
81. Watanabe, N., and Y. Kobayashi. 1994. Selective release of a processed form of interleukin 1 alpha. Cytokine 6: 597-601.
82. Martinon, F., A. Mayor, and J. Tschopp. 2009. The Inflammasomes: Guardians of the Body. Annual Review of Immunology 27: 229-265.
83. Tschopp, J., F. Martinon, and K. Burns. 2003. NALPs: a novel protein family involved in inflammation. Nat Rev Mol Cell Biol 4: 95-104.
84. Mariathasan, S., and D. M. Monack. 2007. Inflammasome adaptors and sensors: intracellular regulators of infection and inflammation. Nat Rev Immunol 7: 31-40.
85. Hogquist, K. A., M. A. Nett, E. R. Unanue, and D. D. Chaplin. 1991. Interleukin-1 Is Processed and Released during Apoptosis. P Natl Acad Sci USA 88: 8485-8489.
86. Perregaux, D., and C. A. Gabel. 1994. Interleukin-1 beta maturation and release in response to ATP and nigericin. Evidence that potassium depletion mediated by these agents is a necessary and common feature of their activity. J Biol Chem 269: 15195-15203.
87. Walev, I., J. Klein, M. Husmann, A. Valeva, S. Strauch, H. Wirtz, O. Weichel, and S. Bhakdi. 2000. Potassium regulates IL-1 beta processing via calcium-independent phospholipase A2. J Immunol 164: 5120-5124.
88. Andrei, C., P. Margiocco, A. Poggi, L. V. Lotti, M. R. Torrisi, and A. Rubartelli. 2004. Phospholipases C and A2 control lysosome-mediated IL-1 beta secretion: Implications for inflammatory processes. Proc Natl Acad Sci U S A 101: 9745-9750.
89. MacKenzie, A., H. L. Wilson, E. Kiss-Toth, S. K. Dower, R. A. North, and A. Surprenant. 2001. Rapid secretion of interleukin-1beta by microvesicle shedding. Immunity 15: 825-835.
90. Dinarello, C. A. 2005. The many worlds of reducing interleukin-1. Arthritis Rheum 52: 1960-1967.
91. Weber, A., P. Wasiliew, and M. Kracht. 2010. Interleukin-1 (IL-1) pathway. Sci Signal 3: cm1. 92. Radons, J., S. Dove, D. Neumann, R. Altmann, A. Botzki, M. U. Martin, and W. Falk. 2003. The
interleukin 1 (IL-1) receptor accessory protein Toll/IL-1 receptor domain: analysis of putative interaction sites in vitro mutagenesis and molecular modeling. J Biol Chem 278: 49145-49153.
93. Brikos, C., R. Wait, S. Begum, L. A. O'Neill, and J. Saklatvala. 2007. Mass spectrometric analysis of the endogenous type I interleukin-1 (IL-1) receptor signaling complex formed after IL-1 binding identifies IL-1RAcP, MyD88, and IRAK-4 as the stable components. Mol Cell Proteomics 6: 1551-1559.
94. Li, S., A. Strelow, E. J. Fontana, and H. Wesche. 2002. IRAK-4: a novel member of the IRAK family with the properties of an IRAK-kinase. Proc Natl Acad Sci U S A 99: 5567-5572.
95. Cao, Z., J. Xiong, M. Takeuchi, T. Kurama, and D. V. Goeddel. 1996. TRAF6 is a signal transducer for interleukin-1. Nature 383: 443-446.

118
96. Toh, M. L., Y. Yang, M. Leech, L. Santos, and E. F. Morand. 2004. Expression of mitogen-activated protein kinase phosphatase 1, a negative regulator of the mitogen-activated protein kinases, in rheumatoid arthritis: up-regulation by interleukin-1beta and glucocorticoids. Arthritis Rheum 50: 3118-3128.
97. Walsh, M. C., G. K. Kim, P. L. Maurizio, E. E. Molnar, and Y. Choi. 2008. TRAF6 autoubiquitination-independent activation of the NFkappaB and MAPK pathways in response to IL-1 and RANKL. PLoS One 3: e4064.
98. Takaesu, G., S. Kishida, A. Hiyama, K. Yamaguchi, H. Shibuya, K. Irie, J. Ninomiya-Tsuji, and K. Matsumoto. 2000. TAB2, a novel adaptor protein, mediates activation of TAK1 MAPKKK by linking TAK1 to TRAF6 in the IL-1 signal transduction pathway. Mol Cell 5: 649-658.
99. Deng, L., C. Wang, E. Spencer, L. Yang, A. Braun, J. You, C. Slaughter, C. Pickart, and Z. J. Chen. 2000. Activation of the IkappaB kinase complex by TRAF6 requires a dimeric ubiquitin-conjugating enzyme complex and a unique polyubiquitin chain. Cell 103: 351-361.
100. Kanayama, A., R. B. Seth, L. Sun, C. K. Ea, M. Hong, A. Shaito, Y. H. Chiu, L. Deng, and Z. J. Chen. 2004. TAB2 and TAB3 activate the NF-kappaB pathway through binding to polyubiquitin chains. Mol Cell 15: 535-548.
101. Ninomiya-Tsuji, J., K. Kishimoto, A. Hiyama, J. Inoue, Z. D. Cao, and K. Matsumoto. 1999. The kinase TAK1 can activate the NIK-I kappa B as well as the MAP kinase cascade in the IL-1 signalling pathway. Nature 398: 252-256.
102. Buss, H., A. Dorrie, M. L. Schmitz, E. Hoffmann, K. Resch, and M. Kracht. 2004. Constitutive and interleukin-1-inducible phosphorylation of p65 NF-{kappa}B at serine 536 is mediated by multiple protein kinases including I{kappa}B kinase (IKK)-{alpha}, IKK{beta}, IKK{epsilon}, TRAF family member-associated (TANK)-binding kinase 1 (TBK1), and an unknown kinase and couples p65 to TATA-binding protein-associated factor II31-mediated interleukin-8 transcription. J Biol Chem 279: 55633-55643.
103. Wolter, S., A. Doerrie, A. Weber, H. Schneider, E. Hoffmann, J. von der Ohe, L. Bakiri, E. F. Wagner, K. Resch, and M. Kracht. 2008. c-Jun controls histone modifications, NF-kappaB recruitment, and RNA polymerase II function to activate the ccl2 gene. Mol Cell Biol 28: 4407-4423.
104. Nakao, S., Y. Ogata, E. Shimizu-Sasaki, M. Yamazaki, S. Furuyama, and H. Sugiya. 2000. Activation of NFkappaB is necessary for IL-1beta-induced cyclooxygenase-2 (COX-2) expression in human gingival fibroblasts. Mol Cell Biochem 209: 113-118.
105. Brissoni, B., L. Agostini, M. Kropf, F. Martinon, V. Swoboda, S. Lippens, H. Everett, N. Aebi, S. Janssens, E. Meylan, M. Felberbaum-Corti, H. Hirling, J. Gruenberg, J. Tschopp, and K. Burns. 2006. Intracellular trafficking of interleukin-1 receptor I requires Tollip. Curr Biol 16: 2265-2270.
106. Mendoza, H., D. G. Campbell, K. Burness, J. Hastie, N. Ronkina, J. H. Shim, J. S. Arthur, R. J. Davis, M. Gaestel, G. L. Johnson, S. Ghosh, and P. Cohen. 2008. Roles for TAB1 in regulating the IL-1-dependent phosphorylation of the TAB3 regulatory subunit and activity of the TAK1 complex. Biochem J 409: 711-722.
107. Sun, S. C., P. A. Ganchi, D. W. Ballard, and W. C. Greene. 1993. NF-kappa B controls expression of inhibitor I kappa B alpha: evidence for an inducible autoregulatory pathway. Science 259: 1912-1915.
108. Kawaguchi, Y., E. Nishimagi, A. Tochimoto, M. Kawamoto, Y. Katsumata, M. Soejima, T. Kanno, N. Kamatani, and M. Hara. 2006. Intracellular IL-1alpha-binding proteins contribute to biological functions of endogenous IL-1alpha in systemic sclerosis fibroblasts. Proc Natl Acad Sci U S A 103: 14501-14506.

119
109. Cohen, I., P. Rider, Y. Carmi, A. Braiman, S. Dotan, M. R. White, E. Voronov, M. U. Martin, C. A. Dinarello, and R. N. Apte. 2010. Differential release of chromatin-bound IL-1alpha discriminates between necrotic and apoptotic cell death by the ability to induce sterile inflammation. Proc Natl Acad Sci U S A 107: 2574-2579.
110. Di Paolo, N. C., and D. M. Shayakhmetov. 2016. Interleukin 1alpha and the inflammatory process. Nat Immunol 17: 906-913.
111. Kawaguchi, Y., M. Harigai, M. Hara, K. Suzuki, M. Kawakami, T. Ishizuka, T. Hidaka, A. Kitani, M. Kawagoe, and H. Nakamura. 1992. Increased interleukin 1 receptor, type I, at messenger RNA and protein level in skin fibroblasts from patients with systemic sclerosis. Biochem Biophys Res Commun 184: 1504-1510.
112. Voronov, E., S. Dotan, Y. Krelin, X. Song, M. Elkabets, Y. Carmi, P. Rider, C. Idan, M. Romzova, I. Kaplanov, and R. N. Apte. 2013. Unique Versus Redundant Functions of IL-1alpha and IL-1beta in the Tumor Microenvironment. Front Immunol 4: 177.
113. Ben-Sasson, S. Z., J. Hu-Li, J. Quiel, S. Cauchetaux, M. Ratner, I. Shapira, C. A. Dinarello, and W. E. Paul. 2009. IL-1 acts directly on CD4 T cells to enhance their antigen-driven expansion and differentiation. P Natl Acad Sci USA 106: 7119-7124.
114. Guo, L., G. Wei, J. Zhu, W. Liao, W. J. Leonard, K. Zhao, and W. Paul. 2009. IL-1 family members and STAT activators induce cytokine production by Th2, Th17, and Th1 cells. Proc Natl Acad Sci U S A 106: 13463-13468.
115. Ben-Sasson, S. Z., A. Hogg, J. Hu-Li, P. Wingfield, X. Chen, M. Crank, S. Caucheteux, M. Ratner-Hurevich, J. A. Berzofsky, R. Nir-Paz, and W. E. Paul. 2013. IL-1 enhances expansion, effector function, tissue localization, and memory response of antigen-specific CD8 T cells. J Exp Med 210: 491-502.
116. Mochizuki, D. Y., J. R. Eisenman, P. J. Conlon, A. D. Larsen, and R. J. Tushinski. 1987. Interleukin 1 regulates hematopoietic activity, a role previously ascribed to hemopoietin 1. Proc Natl Acad Sci U S A 84: 5267-5271.
117. Gabrilovich, D. I., S. Ostrand-Rosenberg, and V. Bronte. 2012. Coordinated regulation of myeloid cells by tumours. Nat Rev Immunol 12: 253-268.
118. Lewis, A. M., S. Varghese, H. Xu, and H. R. Alexander. 2006. Interleukin-1 and cancer progression: the emerging role of interleukin-1 receptor antagonist as a novel therapeutic agent in cancer treatment. J Transl Med 4: 48.
119. Portier, M., X. G. Zhang, E. Ursule, D. Lees, M. Jourdan, R. Bataille, and B. Klein. 1993. Cytokine gene expression in human multiple myeloma. Br J Haematol 85: 514-520.
120. Saijo, Y., M. Tanaka, M. Miki, K. Usui, T. Suzuki, M. Maemondo, X. Hong, R. Tazawa, T. Kikuchi, K. Matsushima, and T. Nukiwa. 2002. Proinflammatory cytokine IL-1 beta promotes tumor growth of Lewis lung carcinoma by induction of angiogenic factors: in vivo analysis of tumor-stromal interaction. J Immunol 169: 469-475.
121. Elaraj, D. M., D. M. Weinreich, S. Varghese, M. Puhlmann, S. M. Hewitt, N. M. Carroll, E. D. Feldman, E. M. Turner, and H. R. Alexander. 2006. The role of interleukin 1 in growth and metastasis of human cancer xenografts. Clin Cancer Res 12: 1088-1096.
122. Weinreich, D. M., D. M. Elaraj, M. Puhlmann, S. M. Hewitt, N. M. Carroll, E. D. Feldman, E. M. Turner, P. J. Spiess, and H. R. Alexander. 2003. Effect of interleukin 1 receptor antagonist gene transduction on human melanoma xenografts in nude mice. Cancer Research 63: 5957-5961.
123. Khalili, J. S., S. Liu, T. G. Rodriguez-Cruz, M. Whittington, S. Wardell, C. Liu, M. Zhang, Z. A. Cooper, D. T. Frederick, Y. Li, M. Zhang, R. W. Joseph, C. Bernatchez, S. Ekmekcioglu, E. Grimm, L. G. Radvanyi, R. E. Davis, M. A. Davies, J. A. Wargo, P. Hwu, and G. Lizee. 2012.
120
Oncogenic BRAF(V600E) promotes stromal cell-mediated immunosuppression via induction of interleukin-1 in melanoma. Clin Cancer Res 18: 5329-5340.
124. Dvorkin, T., X. Song, S. Argov, R. M. White, M. Zoller, S. Segal, C. A. Dinarello, E. Voronov, and R. N. Apte. 2006. Immune phenomena involved in the in vivo regression of fibrosarcoma cells expressing cell-associated IL-1alpha. J Leukoc Biol 80: 96-106.
125. Hong, D. S., D. Hui, E. Bruera, F. Janku, A. Naing, G. S. Falchook, S. Piha-Paul, J. J. Wheler, S. Fu, A. M. Tsimberidou, M. Stecher, P. Mohanty, J. Simard, and R. Kurzrock. 2014. MABp1, a first-in-class true human antibody targeting interleukin-1alpha in refractory cancers: an open-label, phase 1 dose-escalation and expansion study. Lancet Oncol 15: 656-666.
126. Hailemichael, Y., A. Woods, T. Fu, Q. He, M. C. Nielsen, F. Hasan, J. Roszik, Z. Xiao, C. Vianden, H. Khong, M. Singh, M. Sharma, F. Faak, D. Moore, Z. Dai, S. M. Anthony, K. S. Schluns, P. Sharma, V. H. Engelhard, and W. W. Overwijk. 2018. Cancer vaccine formulation dictates synergy with CTLA-4 and PD-L1 checkpoint blockade therapy. J Clin Invest 128: 1338-1354.
127. Khong, H., A. Volmari, M. Sharma, Z. Dai, C. S. Imo, Y. Hailemichael, M. Singh, D. T. Moore, Z. Xiao, X. F. Huang, T. D. Horvath, D. H. Hawke, and W. W. Overwijk. 2018. Peptide Vaccine Formulation Controls the Duration of Antigen Presentation and Magnitude of Tumor-Specific CD8(+) T Cell Response. J Immunol 200: 3464-3474.
128. DeLong, J. H., A. O. Hall, G. Muallem, and C. A. Hunter. 2016. Ly6C expression on T cells is modulated by IL-27, interferon-gamma and TCR stimulation. Journal of Immunology 196.
129. Li, M., P. Xia, Y. Du, S. Liu, G. Huang, J. Chen, H. Zhang, N. Hou, X. Cheng, L. Zhou, P. Li, X. Yang, and Z. Fan. 2014. T-cell immunoglobulin and ITIM domain (TIGIT) receptor/poliovirus receptor (PVR) ligand engagement suppresses interferon-gamma production of natural killer cells via beta-arrestin 2-mediated negative signaling. J Biol Chem 289: 17647-17657.
130. Fourcade, J., Z. Sun, J. M. Chauvin, M. Ka, D. Davar, O. Pagliano, H. Wang, S. Saada, C. Menna, R. Amin, C. Sander, J. M. Kirkwood, A. J. Korman, and H. M. Zarour. 2018. CD226 opposes TIGIT to disrupt Tregs in melanoma. JCI Insight 3.
131. Apte, R. N., and E. Voronov. 2008. Is interleukin-1 a good or bad 'guy' in tumor immunobiology and immunotherapy? Immunological Reviews 222: 222-241.
132. Mantovani, A., I. Barajon, and C. Garlanda. 2018. IL-1 and IL-1 regulatory pathways in cancer progression and therapy. Immunol Rev 281: 57-61.
133. Dinarello, C. A. 1996. Biologic basis for interleukin-1 in disease. Blood 87: 2095-2147. 134. Coffelt, S. B., M. D. Wellenstein, and K. E. de Visser. 2016. Neutrophils in cancer: neutral no
more. Nature Reviews Cancer 16: 431-446. 135. Ocana, A., C. Nieto-Jimenez, A. Pandiella, and A. J. Templeton. 2017. Neutrophils in cancer:
prognostic role and therapeutic strategies. Mol Cancer 16: 137. 136. Templeton, A. J., M. G. McNamara, B. Seruga, F. E. Vera-Badillo, P. Aneja, A. Ocana, R.
Leibowitz-Amit, G. Sonpavde, J. J. Knox, B. Tran, I. F. Tannock, and E. Amir. 2014. Prognostic role of neutrophil-to-lymphocyte ratio in solid tumors: a systematic review and meta-analysis. J Natl Cancer Inst 106: dju124.
137. Powell, D. R., and A. Huttenlocher. 2016. Neutrophils in the Tumor Microenvironment. Trends Immunol 37: 41-52.
138. Shimizu, K., T. Iyoda, M. Okada, S. Yamasaki, and S. I. Fujii. 2018. Immune suppression and reversal of the suppressive tumor microenvironment. Int Immunol 30: 445-454.
139. Gordon, S. R., R. L. M. Aute, B. W. Dulken, G. Hutter, B. M. George, M. N. M. Ccracken, R. Gupta, J. M. Tsai, R. Sinha, D. Corey, A. M. Ring, A. J. Connolly, and I. L. Weissman. 2017. PD-1 expression by tumour-associated macrophages inhibits phagocytosis and tumour immunity. Nature 545: 495-+.

121
Brenda Melendez was born in Lima, Peru, the daughter of Yanet Terrazas and Felix
Melendez. After completing her work at Clements High School, Houston, Texas, in 2006,
she entered the University of Houston in Houston, Texas. She received the degree of
Bachelor of Science in biomedical engineering from U of H in May, 2011. In September of
2011 she entered The University of Texas MD Anderson Cancer Center UTHealth Graduate
School of Biomedical Sciences.