· and accordingly primary data was collected through a structured questionnaire having closed...
TRANSCRIPT

ELK ASIA PACIFIC JOURNAL OF MARKETING AND RETAIL MANAGEMENT
ISSN 2349-2317 (Online); DOI: 10.16962/EAPJMRM/issn. 2349-2317/2015; Volume 6 Issue 4 (2015)
www.elkjournals.com
……………………………………………………………………………………………………………
MARKET POTENTIAL AND GROWTH OPPORTUNITIES FOR BAKERY PRODUCTS:
AN EMPIRICAL ANALYSIS WITH SPECIAL REFERENCE TO PAI BREAD, BELGAUM
MR. AJAY JAMNANI
Assistant Professor
Bharatesh Education Trust’s Global Business School,
Belgaum
Email: [email protected]
MR. PRASAD DADDIKAR
Assistant Professor
Bharatesh Education Trust’s Global Business School,
Belgaum
Email: [email protected]
ABSTRACT
Keywords: Bakery, Potential, Customers, Hypothesis, Statistics
JEL Classification: M0, M1, M3, Y1
Introduction
Bakery is a traditional activity and
occupies an important place in food
processing industry. Despite the advent of
fully automatic and semi-automatic bread
as well as biscuit making plants, a sizeable
number of people still prefer fresh bread
and other products from bakery. With
growing population and preference for
fresh and ready-to-eat convenient food
items, demand for bakery products is
steadily increasing. There are many bakery
Bakery products are perishable in nature as it cannot be inventoried for a long period. Though technological
advancements are evident everywhere, people still prefer fresh bread and other products from the bakery. However
the biggest challenge for any bakery firm is to push the product into the market before its expiry date. This paper
analyses the growth opportunities for Pai Foods with special reference to Pai bread. It also makes an effort to find
the potential market available for Pai Foods to approach. An empirical exploratory research design was used and a
survey technique was employed in selected places viz., Belgaum City, Sankeshwar, Nippani, Chikkodi and
Bailhongal for data collection through a structured questionnaire. In all samples of 360 retailers were identified
and accordingly primary data was collected through a structured questionnaire having closed ended questions &
measurement scales. Data analysis was carried our using MS-Excel & SPSS package and the hypothesis testing has
been done using the one sample t-test. The results reveal that customers have favored the Pai bread and are also
willing to prefer it over its competitors. Further, Pai foods have been committed to quality products and providing
better services to customers.
ELK ASIA PACIFIC JOURNAL OF MARKETING AND RETAIL MANAGEMENT
ISSN 2349-2317 (Online); DOI: 10.16962/EAPJMRM/issn. 2349-2317/2015; Volume 6 Issue 4 (2015)
products like bread and its different
variants, biscuits, cakes & pastries,
cookies, puffs etc. having ready market
round the year. Each product enjoys a very
wide range in terms of size or weight,
flavours, end-use and so on.
The studies conducted so far in food
processing industry have been primarily
focused on the perceptions of consumers
towards bakery products, buying behavior,
competitiveness, advertising impact etc.
No study has been undertaken to
understand and analyze the views of
retailers in bakery supply chain for better
reach of products to customers. Therefore,
the present study attempts to analyze the
retailer’s perception towards product
selection & its retail selling. The paper has
been segregated in different sections like
review of literature, research methodology,
data analysis, hypothesis testing and
suitable conclusion.
Review of Literature
Peterson & Robert A. (1977) in their
research paper conducted an experiment to
assess the effect of color, price, and
nutritional information on consumers'
perceptions of bread. Dependent variables
were perceived nutritional value of bread
and percentage of whole wheat contained
in bread. The major finding was that color
of bread was relatively more important in
determining consumer perceptions than
were price and nutritional information
combined
Natasa Renko, Ivona Sustic & Ruzica
Butigan (2011) have used five competitive
forces model by Michael E. Porter, in this
paper aiming at designing marketing
strategies and the development of
sustainable competitive advantage for one
Croatian small bakery concerning the
influence of five forces on the whole
industry. The findings enabled to
determine the attraction of bakery
industry, to measure perceptions of the
strength of competitive forces, to identify
the existing competitive advantages and
key success factors in the further
development. Although Porter’s model is a
simplified picture of the forces that affect
the profitability of certain industries,
results of this paper have undoubtedly
shown that Porter’s model is valuable even
in the small business sector.
Ghai and Sneha (2012) have analyzed the
consumer shopping behavior while
purchasing Biscuits and their choice and
preference for type and variety of biscuit.
ELK ASIA PACIFIC JOURNAL OF MARKETING AND RETAIL MANAGEMENT
ISSN 2349-2317 (Online); DOI: 10.16962/EAPJMRM/issn. 2349-2317/2015; Volume 6 Issue 4 (2015)
Many factors are taken into considerations
for knowing consumer behavior like
availability, price, flavor, packaging etc.
This study made an attempt to analyze the
existing buying behavior for Biscuits by
individual households and to predict the
demand for Biscuits. The study also
explains about the consumer buying
behavior of biscuits where different brands
of biscuits are taken into consideration and
assessing the impact of demographic
dynamics on their choice. The practical
implications of this study could be change
in its price, sales force size, distribution,
packaging & advertising expenditures in
the short run to further improvise its
marketing strategies
Jayaraman, K. & S. Kiumarsi (2014) in
their study deals with the issues faced by
SMEs and provided some valid
recommendations to resolve the existing
problems in the bakery business. The case
analysis and its findings reveal that SMEs
have unstructured marketing strategies and
needs enhancements in the areas of
packaging, value add to the bakery
products, focus on promotion and
appropriate advertising strategies. Further,
the analysis reveals that more coverage of
selling points for bakery products, the
increased number of distribution centers
and proper incentives to the agents may
definitely improve the marketing of bakery
products
Tatiana Litvinova, Irina Morozova &
Stanislav Yatsechko (2015) in their
article studied the Russian market of bread
and bakery products. On the basis of the
developed method we carried out an
organoleptic evaluation of well-known
types of Russian bread: Barskiy,
Trapeznyy, Appetitnyy, Grozd and
Izyskannyy by a 5-point scale, and on this
basis the radar chart was built. In order to
provide an objective assessment of the
quality of a product it is necessary to
formalize the criteria of quality that is to
present them in a form of an array of
digital data. Then the authors performed a
calculation of the integral index of
competitiveness of bread and bread
products. During the process of research
the authors conclude that the high quality
of product is not enough for it to be in
demand by consumers.
Research Methodology
Exploratory research design was used for
conducting this study. Primary data on
perceptions of the bakery product retailers
was collected through a structured
questionnaire. It was administered to the
ELK ASIA PACIFIC JOURNAL OF MARKETING AND RETAIL MANAGEMENT
ISSN 2349-2317 (Online); DOI: 10.16962/EAPJMRM/issn. 2349-2317/2015; Volume 6 Issue 4 (2015)
targeted respondents in selected places in
Karnataka. To investigate the significant
perceptions of bakery product retailers,
respondents have been selected on random
sampling technique. The variables are
measured using 5 point Likert scale with
responses ranging from “Strongly
Disagree”=1, “Disagree” = 2, “Cannot
Say” = 3, “Agree” =4 and “Strongly
Agree” =5. For data analysis, mean and
standard deviation are used for descriptive
statistics. The hypothesis was tested using
One Sample t-test, and the data collected
from respondents was analyzed with the
help of MS Excel & SPSS.
Objectives of the study
To find out the market potentiality for Pai
Breads
To identify expansion opportunities for Pai
Food products
To know awareness level of Pai brand
To know what customers expectations
about Pai Bread
Sampling method
Sample Method Description
(Refer Table 1 Here)
Profile of the Respondent
(Refer Table 2 Here)
Data Analysis
This part of the study attempts to
understand the opinion of customers with
respect to bakery products, distribution
channels, pricing influence on consumer
behavior and supplier rating for overall
business effectiveness through various
statistical analyses. The descriptive
statistical analysis was carried out in order
to do preliminary data analysis using mean
and standard deviation. For hypothesis
testing inferential statistical analysis was
performed using the one sample t-test at
95% confidence interval with an assumed
mean value of 3.
Testing of Hypothesis
To test the formulated hypothesis, one
sample t-test was used with assumed mean
value of 3. The data was collected using a
structured questionnaire having a set of
statements related to the agreement &
disagreement of respondents towards the
formulated hypothesis.
With respect to respondent’s transaction
nature with Pai Bakery products in
Belgaum, the following null and
alternative hypotheses were postulated as
below:
ELK ASIA PACIFIC JOURNAL OF MARKETING AND RETAIL MANAGEMENT
ISSN 2349-2317 (Online); DOI: 10.16962/EAPJMRM/issn. 2349-2317/2015; Volume 6 Issue 4 (2015)
H01: Majority of the respondents do not
deal with Pai Bakery products on
the basis of Hygiene factor in
Belgaum
Ha1: Majority of the respondents deal
with Pai Bakery products on the
basis of Hygiene factor in Belgaum
For testing of the above hypothesis, t test
is used with assumed mean value of 3. The
total score on the five point scale in the
Likert Scale is 15 and the average is 3. The
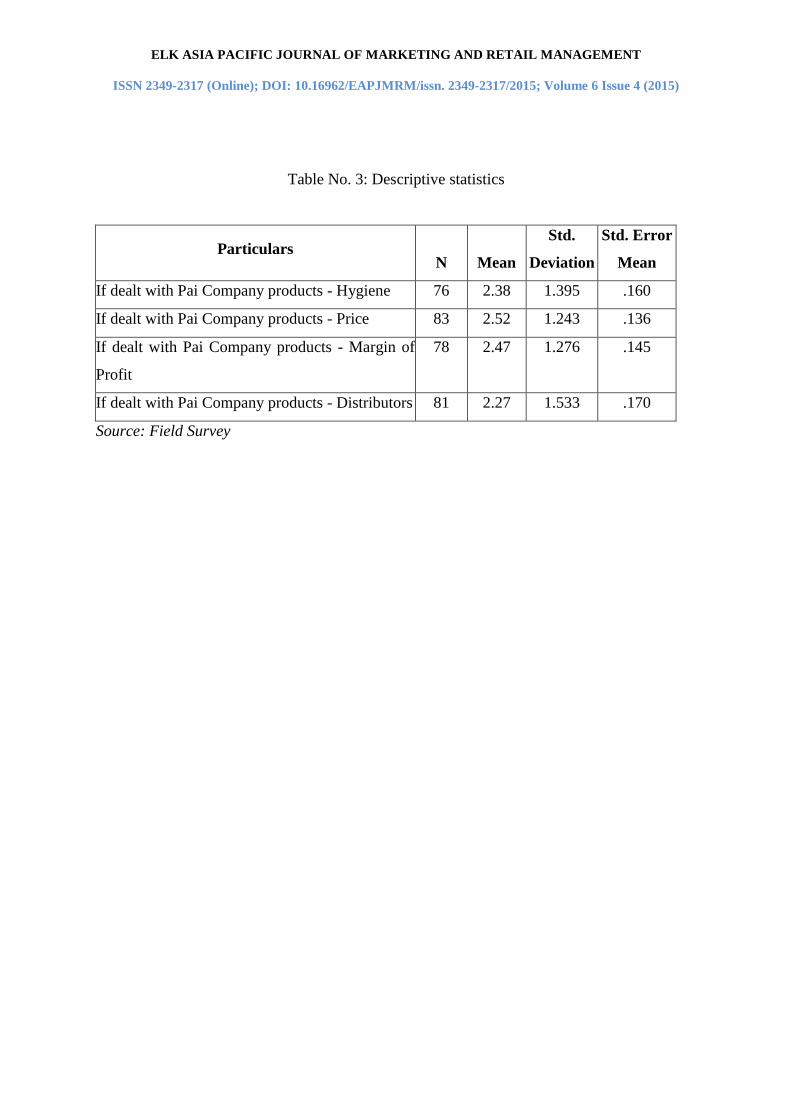
calculated mean value of “Respondents
deal with Pai Bakery products in
Belgaum on the basis of Hygiene factor”
is less than the assumed mean 3 i.e., 2.38
and the observed P value 0.001 is less than
0.05 as indicated in table no. 3 and table
no. 4. This result indicates that the null
hypothesis ‘Majority of the respondents
do not deal with Pai Bakery products in
Belgaum on the basis of Hygiene factor’
is rejected and the alternative hypothesis
that ‘Majority of the respondents deal
with Pai Bakery products in Belgaum
on the basis of Hygiene factor’ is
accepted. The respondents, given an option
always would buy products from Pai
Bakery on the basis of select factors, a
bakery that has been a pulse of the local
buyers since its inception.
Descriptive statistics
(Refer Table 3 Here)
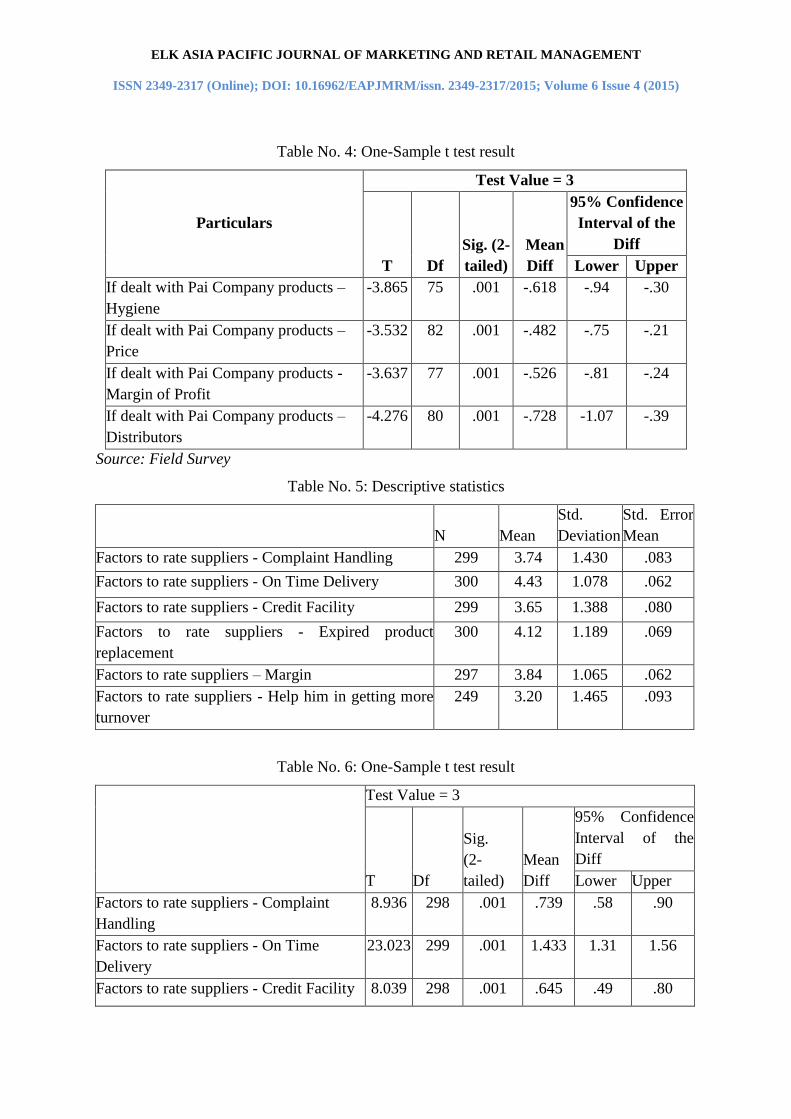
One-Sample t test result
(Refer Table 4 Here)
Testing of 2nd Hypothesis
With respect to respondent’s business
transactions with Pai Bakery products in
Belgaum, the following null and
alternative hypotheses were postulated as
below:
H02: Majority of the respondents do not
deal with Pai Bakery products on
the basis of price factor in
Belgaum
Ha2: Majority of the respondents deal
with Pai Bakery products on the
basis of Price factor in Belgaum
For testing of the above hypothesis, T test
is used with assumed mean 3. The total
score on the five point scale in the Likert
Scale is 15 and the average is 3. The
calculated mean value of “Respondents
deal with Pai Bakery products in Belgaum
on the basis of Price factor” is less than the
assumed mean 3 i.e., 2.52 and the
observed P value 0.001 is less than 0.05 as
indicated in table no. 3 and table no. 4.
This result indicates that the null
hypothesis ‘Majority of the respondents
ELK ASIA PACIFIC JOURNAL OF MARKETING AND RETAIL MANAGEMENT
ISSN 2349-2317 (Online); DOI: 10.16962/EAPJMRM/issn. 2349-2317/2015; Volume 6 Issue 4 (2015)
do not deal with Pai Bakery products on
the basis of Price factor in Belgaum’ is
rejected and the alternative hypothesis
that ‘Majority of the respondents deal
with Pai Bakery products on the basis of
Price factor in Belgaum’ is accepted. The
respondents are price sensitive and given
an option always would buy products from
Pai Bakery if the price of a bakery product
is economical as the entire value chain has
been very responsive to price factor.
Testing of 3rd Hypothesis
With respect to respondents dealing with
Pai Bakery products in Belgaum, the
following null and alternative hypotheses
were proposed as below:
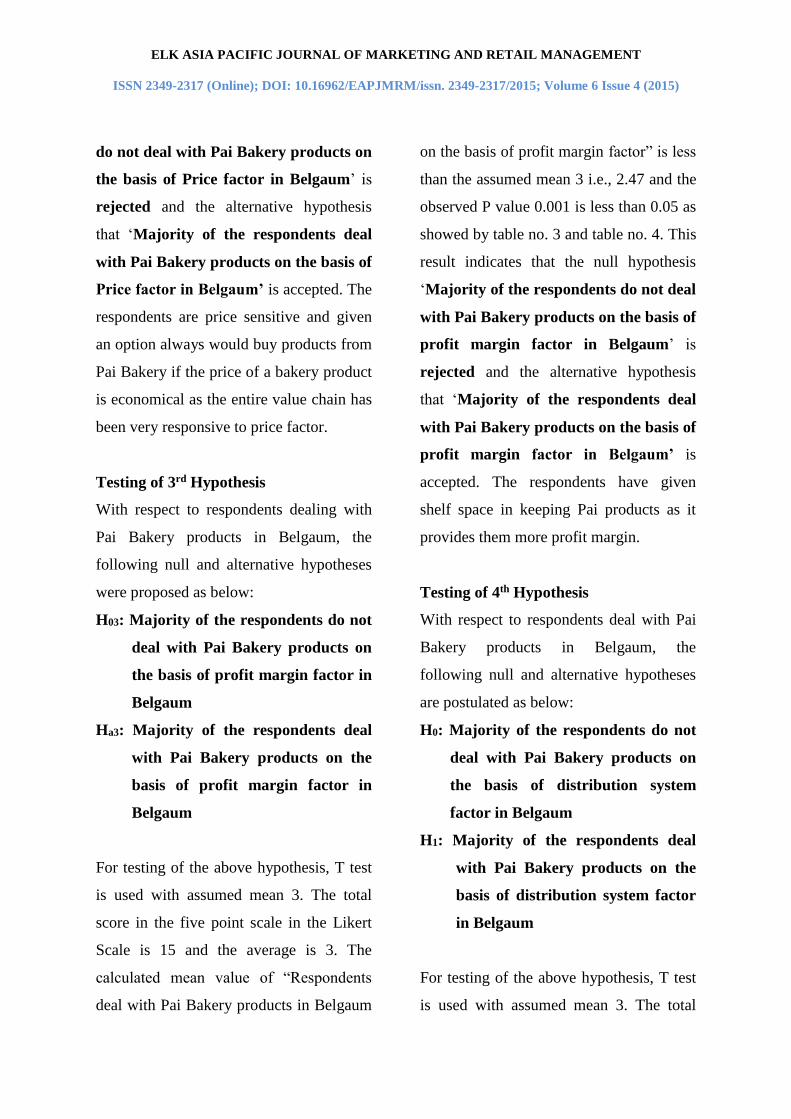
H03: Majority of the respondents do not
deal with Pai Bakery products on
the basis of profit margin factor in
Belgaum
Ha3: Majority of the respondents deal
with Pai Bakery products on the
basis of profit margin factor in
Belgaum
For testing of the above hypothesis, T test
is used with assumed mean 3. The total
score in the five point scale in the Likert
Scale is 15 and the average is 3. The
calculated mean value of “Respondents
deal with Pai Bakery products in Belgaum
on the basis of profit margin factor” is less
than the assumed mean 3 i.e., 2.47 and the
observed P value 0.001 is less than 0.05 as
showed by table no. 3 and table no. 4. This
result indicates that the null hypothesis
‘Majority of the respondents do not deal
with Pai Bakery products on the basis of
profit margin factor in Belgaum’ is
rejected and the alternative hypothesis
that ‘Majority of the respondents deal
with Pai Bakery products on the basis of
profit margin factor in Belgaum’ is
accepted. The respondents have given
shelf space in keeping Pai products as it
provides them more profit margin.
Testing of 4th Hypothesis
With respect to respondents deal with Pai
Bakery products in Belgaum, the
following null and alternative hypotheses
are postulated as below:
H0: Majority of the respondents do not
deal with Pai Bakery products on
the basis of distribution system
factor in Belgaum
H1: Majority of the respondents deal
with Pai Bakery products on the
basis of distribution system factor
in Belgaum
For testing of the above hypothesis, T test
is used with assumed mean 3. The total

ELK ASIA PACIFIC JOURNAL OF MARKETING AND RETAIL MANAGEMENT
ISSN 2349-2317 (Online); DOI: 10.16962/EAPJMRM/issn. 2349-2317/2015; Volume 6 Issue 4 (2015)
score in the five point scale in the Likert
Scale is 15 and the average is 3. The
calculated mean value of “Respondents
deal with Pai Bakery products in Belgaum
on the basis of ROI factor” is less than the
assumed mean 3 i.e., 2.27 and the
observed P value 0.001 is less than 0.05.
This result indicates that the null
hypothesis ‘Majority of the respondents
do not deal with Pai Bakery products on
the basis of distribution system factor in
Belgaum’ is rejected and the alternative
hypothesis that ‘Majority of the
respondents deal with Pai Bakery
products on the basis of distribution
system factor in Belgaum’ is accepted.
Respondents are happy with the
distribution system of Pai Bakery products
as they are readily available and fresh
products are delivered to their store.
Market Potential Analysis for Pai
Breads
The supplier’s performance analysis is
carried out using rating scale
methodology. The field survey data is
collected from potential sample
respondents who were dealing with bakery
& other fast food products. The
researchers have identified most important
factors that would be considered for
performance analysis propose. Statistical
tests like; descriptive statistics tests, one
sample t-test were carried out to determine
the order of significance of select factors.
Descriptive statistics
(Refer Table 5 Here)
One-Sample t test result
(Refer Table 6 Here)
From Table No. 6 it is clearly observed
that respondents have given the highest
rating to on time delivery as the most
important factor. It has recorded the
highest mean value of 4.43 & lowest
standard error mean value of 0.062.
Further the T test is performed to check
the statistical significance of the select
factor with assumed mean value of 3. The
total score in the five point rating is 15
with 1 being the least rating and 5 being
the highest rating to the select factor. The
observed P value 0.001 which is less than
0.05 and calculated t value is greater than
the table t value with df = 298 and α =
0.05.
Thus the statistical analysis reveals that the
on time delivery factor plays an important
role with respect to supplier’s performance
analysis and respondents have rated it as
the number 1.
ELK ASIA PACIFIC JOURNAL OF MARKETING AND RETAIL MANAGEMENT
ISSN 2349-2317 (Online); DOI: 10.16962/EAPJMRM/issn. 2349-2317/2015; Volume 6 Issue 4 (2015)
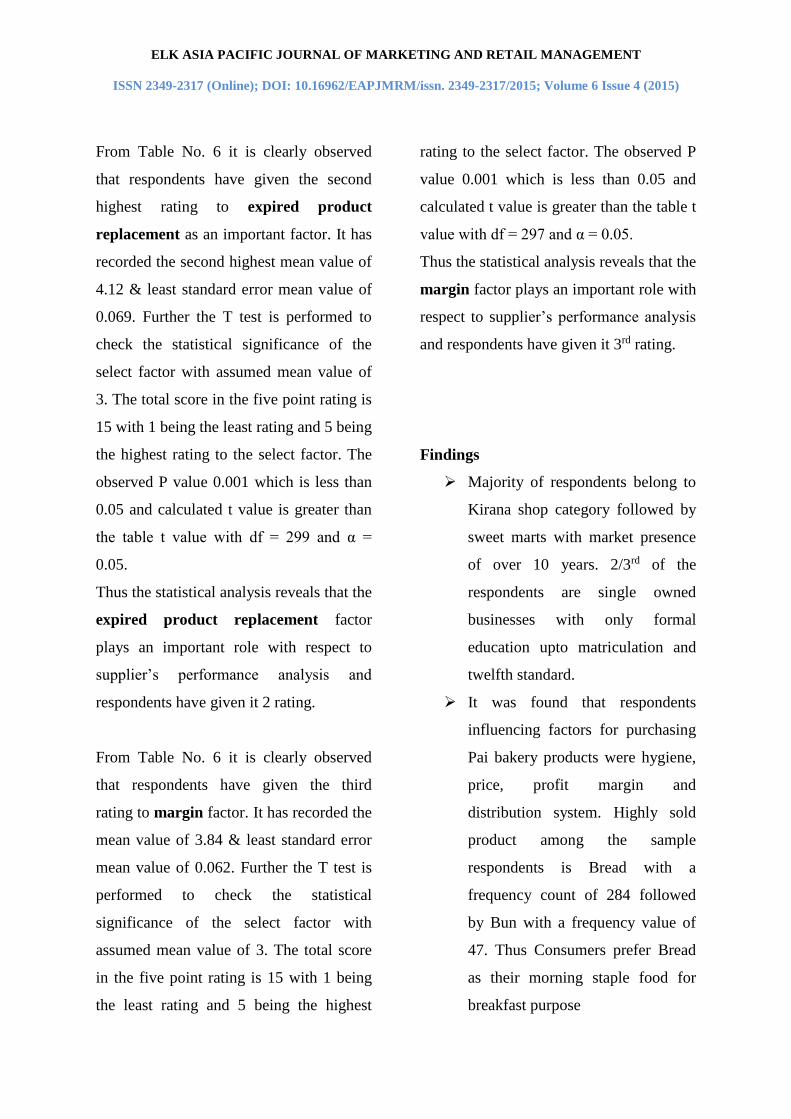
From Table No. 6 it is clearly observed
that respondents have given the second
highest rating to expired product
replacement as an important factor. It has
recorded the second highest mean value of
4.12 & least standard error mean value of
0.069. Further the T test is performed to
check the statistical significance of the
select factor with assumed mean value of
3. The total score in the five point rating is
15 with 1 being the least rating and 5 being
the highest rating to the select factor. The
observed P value 0.001 which is less than
0.05 and calculated t value is greater than
the table t value with df = 299 and α =
0.05.
Thus the statistical analysis reveals that the
expired product replacement factor
plays an important role with respect to
supplier’s performance analysis and
respondents have given it 2 rating.
From Table No. 6 it is clearly observed
that respondents have given the third
rating to margin factor. It has recorded the
mean value of 3.84 & least standard error
mean value of 0.062. Further the T test is
performed to check the statistical
significance of the select factor with
assumed mean value of 3. The total score
in the five point rating is 15 with 1 being
the least rating and 5 being the highest
rating to the select factor. The observed P
value 0.001 which is less than 0.05 and
calculated t value is greater than the table t
value with df = 297 and α = 0.05.
Thus the statistical analysis reveals that the
margin factor plays an important role with
respect to supplier’s performance analysis
and respondents have given it 3rd rating.
Findings
Majority of respondents belong to
Kirana shop category followed by
sweet marts with market presence
of over 10 years. 2/3rd of the
respondents are single owned
businesses with only formal
education upto matriculation and
twelfth standard.
It was found that respondents
influencing factors for purchasing
Pai bakery products were hygiene,
price, profit margin and
distribution system. Highly sold
product among the sample
respondents is Bread with a
frequency count of 284 followed
by Bun with a frequency value of
47. Thus Consumers prefer Bread
as their morning staple food for
breakfast purpose
ELK ASIA PACIFIC JOURNAL OF MARKETING AND RETAIL MANAGEMENT
ISSN 2349-2317 (Online); DOI: 10.16962/EAPJMRM/issn. 2349-2317/2015; Volume 6 Issue 4 (2015)
Respondents have highlighted the
following factors to rate suppliers
in order to have effective and
uninterrupted business operations.
Rank 1 - On Time Delivery
Rank 2 - Expired product
replacement
Rank 3 - Margin
Rank 4 - Complaint Handling
Rank 5 - Help him in getting
more turnover
Though the level of awareness is
limited but Pai Brand does have
highest order of customer loyalty
among the know respondents. Thus
it shows that Pai Bakers has been
committed to quality products &
better services to customers
Customers Expectations from Open
Ended Questions during the survey
1. Packing should improve
2. Life of Product with Good Packing
3. Need fresh Supply, good quality,
reasonable price, fresh and less perishable
Suggestions given from Open Ended
Questions during the survey
1. No replacement & Distribution problem
2. Must give better margin
3. Need Credit facility
4. Should be fresh and bigger bread size at
least price
5. We are needed a good supplier of
bakery product so we are agree to do
business with you
Conclusion
Pai Foods has established a good brand
over the years. Respondents have favored
its presence in the market and are also
willing to prefer it over its competitors. It
was observed that though the level of
awareness about Pai Brand was limited
however it does have highest order of
customer loyalty among the know
respondents. This shows that Pai foods has
been committed to quality products and
providing better services to customers. Pai
foods does have great opportunity to tap
and approach the retailers and plan for its
marketing strategies to expand its
businesses in new horizons.

ELK ASIA PACIFIC JOURNAL OF MARKETING AND RETAIL MANAGEMENT
ISSN 2349-2317 (Online); DOI: 10.16962/EAPJMRM/issn. 2349-2317/2015; Volume 6 Issue 4 (2015)
References
Books:
Naresh Malhotra and Satya Bhushan
Das(2008), Marketing Research: An
applied Orientation, Pearson Education
C.R. Kothari (2004), Research
Methodology Methods & Techniques,
New Age International, New Age
International (P) Ltd., Publishers
S.C. Gupta, Fundamentals of Statistics,
Testing of Hypothesis, 6th Edition,
Himalaya Publishing House
Journals:
Peterson, Robert, A., (1977) Consumer
Perceptions as a Function of Product
Color, Price and Nutrition Labeling,
Advances in Consumer Research, 4(1), 61-
63
Natasa, R., Ivona, S., Ruzica, B., (2011).
Designing marketing strategy using the
five competitive forces model by michael
e. Porter – case of small bakery in Croatia,
International Journal of Management
Cases, 13(3), 376-385
Ghai., Sneha.,(2012). An empirical
analysis on consumer's buying behavior
towards biscuits with reference to NCR,
Asia Pacific Journal of Research in
Business Management, 3(11), 1-2
Jayaraman, K. & 1 S. Kiumarsi (2014),
Marketing strategies to improve the sales
of bakery products of small-medium
enterprise (SMEs) in Malaysia,
International Food Research Journal
21(6): pp 2101-2107
Tatiana Litvinova, Irina Morozova &
Stanislav Yatsechko, (2015), Experiential
Marketing as a Tool of Improvement of
Competitiveness of Enterprises in the
Market of Bread and Bakery Products,
Mediterranean Journal of Social Sciences,
Vol. 6 No 3 S6, ISSN 2039-9340
List of Tables:
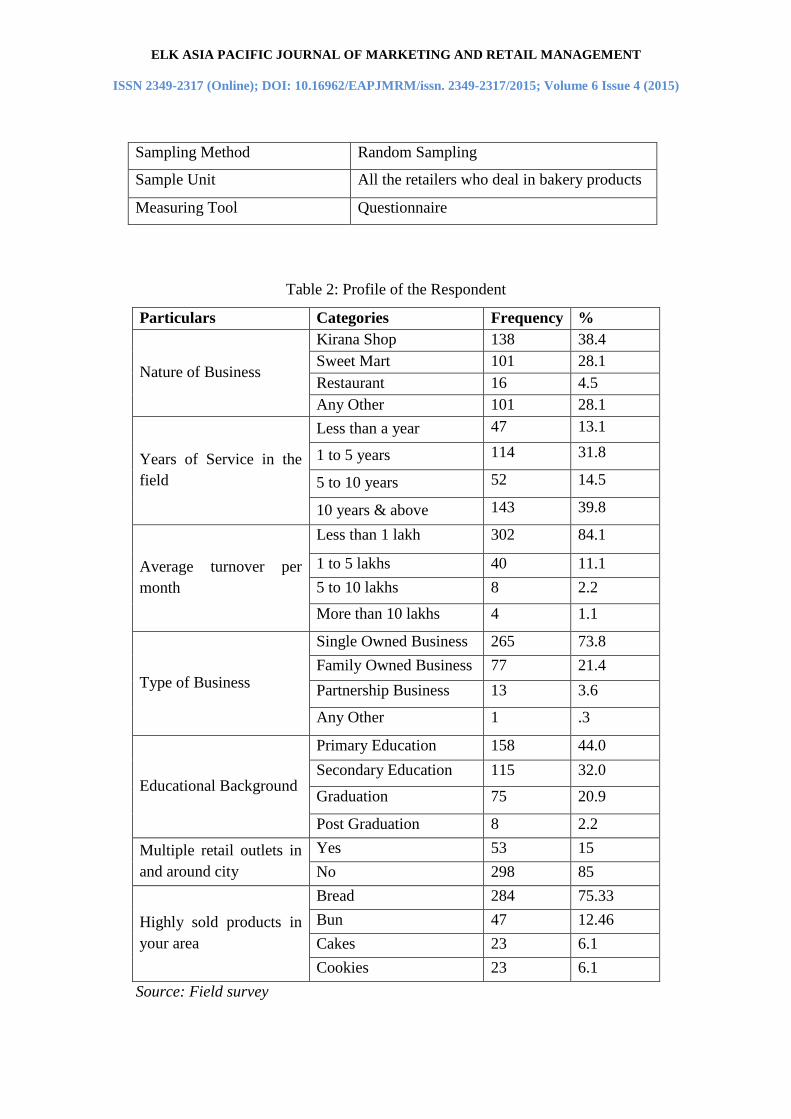
Table 1: Sample Method Description
Sample size 360
ELK ASIA PACIFIC JOURNAL OF MARKETING AND RETAIL MANAGEMENT
ISSN 2349-2317 (Online); DOI: 10.16962/EAPJMRM/issn. 2349-2317/2015; Volume 6 Issue 4 (2015)
Sampling Method Random Sampling
Sample Unit All the retailers who deal in bakery products
Measuring Tool Questionnaire
Table 2: Profile of the Respondent
Particulars Categories Frequency %
Nature of Business
Kirana Shop 138 38.4
Sweet Mart 101 28.1
Restaurant 16 4.5
Any Other 101 28.1
Years of Service in the
field
Less than a year 47 13.1
1 to 5 years 114 31.8
5 to 10 years 52 14.5
10 years & above 143 39.8
Average turnover per
month
Less than 1 lakh 302 84.1
1 to 5 lakhs 40 11.1
5 to 10 lakhs 8 2.2
More than 10 lakhs 4 1.1
Type of Business
Single Owned Business 265 73.8
Family Owned Business 77 21.4
Partnership Business 13 3.6
Any Other 1 .3
Educational Background
Primary Education 158 44.0
Secondary Education 115 32.0
Graduation 75 20.9
Post Graduation 8 2.2
Multiple retail outlets in
and around city
Yes 53 15
No 298 85
Highly sold products in
your area
Bread 284 75.33
Bun 47 12.46
Cakes 23 6.1
Cookies 23 6.1
Source: Field survey
ELK ASIA PACIFIC JOURNAL OF MARKETING AND RETAIL MANAGEMENT
ISSN 2349-2317 (Online); DOI: 10.16962/EAPJMRM/issn. 2349-2317/2015; Volume 6 Issue 4 (2015)
Table No. 3: Descriptive statistics
Particulars N Mean
Std.
Deviation
Std. Error
Mean
If dealt with Pai Company products - Hygiene 76 2.38 1.395 .160
If dealt with Pai Company products - Price 83 2.52 1.243 .136
If dealt with Pai Company products - Margin of
Profit
78 2.47 1.276 .145
If dealt with Pai Company products - Distributors 81 2.27 1.533 .170
Source: Field Survey
ELK ASIA PACIFIC JOURNAL OF MARKETING AND RETAIL MANAGEMENT
ISSN 2349-2317 (Online); DOI: 10.16962/EAPJMRM/issn. 2349-2317/2015; Volume 6 Issue 4 (2015)
Table No. 4: One-Sample t test result
Particulars
Test Value = 3
T Df
Sig. (2-
tailed)
Mean
Diff
95% Confidence
Interval of the
Diff
Lower Upper
If dealt with Pai Company products –
Hygiene
-3.865 75 .001 -.618 -.94 -.30
If dealt with Pai Company products –
Price
-3.532 82 .001 -.482 -.75 -.21
If dealt with Pai Company products -
Margin of Profit
-3.637 77 .001 -.526 -.81 -.24
If dealt with Pai Company products –
Distributors
-4.276 80 .001 -.728 -1.07 -.39
Source: Field Survey
Table No. 5: Descriptive statistics
N Mean
Std.
Deviation
Std. Error
Mean
Factors to rate suppliers - Complaint Handling 299 3.74 1.430 .083
Factors to rate suppliers - On Time Delivery 300 4.43 1.078 .062
Factors to rate suppliers - Credit Facility 299 3.65 1.388 .080
Factors to rate suppliers - Expired product
replacement
300 4.12 1.189 .069
Factors to rate suppliers – Margin 297 3.84 1.065 .062
Factors to rate suppliers - Help him in getting more
turnover
249 3.20 1.465 .093
Table No. 6: One-Sample t test result
Test Value = 3
T Df
Sig.
(2-
tailed)
Mean
Diff
95% Confidence
Interval of the
Diff
Lower Upper
Factors to rate suppliers - Complaint
Handling
8.936 298 .001 .739 .58 .90
Factors to rate suppliers - On Time
Delivery
23.023 299 .001 1.433 1.31 1.56
Factors to rate suppliers - Credit Facility 8.039 298 .001 .645 .49 .80

ELK ASIA PACIFIC JOURNAL OF MARKETING AND RETAIL MANAGEMENT
ISSN 2349-2317 (Online); DOI: 10.16962/EAPJMRM/issn. 2349-2317/2015; Volume 6 Issue 4 (2015)
Factors to rate suppliers - Expired
product replacement
16.263 299 .001 1.117 .98 1.25
Factors to rate suppliers – Margin 13.625 296 .001 .842 .72 .96
Factors to rate suppliers - Help him in
getting more turnover
2.206 248 .028 .205 .02 .39
Source: Field Survey