© 2018 mengda jia
TRANSCRIPT

OCCUPANT BEHAVIOR MODELING FOR IMPROVING COMMERCIAL BUILDING ENERGY USE SIMULATION
By
MENGDA JIA
A DISSERTATION PRESENTED TO THE GRADUATE SCHOOL OF THE UNIVERSITY OF FLORIDA IN PARTIAL FULFILLMENT
OF THE REQUIREMENTS FOR THE DEGREE OF DOCTOR OF PHILOSOPHY
UNIVERSITY OF FLORIDA
2018

© 2018 Mengda Jia

To my family

4
ACKNOWLEDGMENTS
I would like to express my sincere appreciation to my advisor Dr. Ravi
Srinivasan, for his guidance and help in both academic world and real life. I am always
inspired by his continuous passion and hardworking spirit, which gave me motivation to
learn and explore in the scientific ocean. It is my great honor to work with him for my
Ph.D. studies, and his support to my scholar development is priceless fortune that will
benefit me forever.
I also would like to thank the other members of my doctoral committee, Dr.
Robert Ries, Dr. Ian Flood, Dr. Sanjay Ranka, Dr. Damon Allen, and Dr. Gnana
Bharathy. Their comments and feedback on my dissertation consistently provided me
important insights and helped me improve my research work. Thanks to their
contributions in different aspects, I would be able to proceed my dissertation research
smoothly and complete it successfully.
In addition, I would like to extend my gratitude to all faculty, experts, and peer
colleagues who have helped me with my research. Particularly, I want to acknowledge
the faculty members who participated in the survey for the study. Also, special thanks to
Nathan Weyer who developed the application for me time after time with full patience.
Finally, I would like to express my deepest gratitude to my family for their endless
love and support, especially my parents who are always there for me. I dedicate this
work to my mother, who believes in me and encourages me for my whole life, and my
father, my role model, who is in the heaven, blessing me.

5
TABLE OF CONTENTS page
ACKNOWLEDGMENTS .................................................................................................. 4
LIST OF TABLES ............................................................................................................ 8
LIST OF FIGURES .......................................................................................................... 9
LIST OF ABBREVIATIONS ........................................................................................... 12
ABSTRACT ................................................................................................................... 14
CHAPTER
1 INTRODUCTION .................................................................................................... 16
Background ............................................................................................................. 16
Problem Statement ................................................................................................. 19 Research Aim and Objectives ................................................................................. 22 Research Scope ..................................................................................................... 23
Contributions ........................................................................................................... 24 Structure of Dissertation ......................................................................................... 24
2 LITERATURE REVIEW .......................................................................................... 26
Overview ................................................................................................................. 26
Data Acquisition Technologies for Occupant Behavior Modeling ............................ 26 Data Collection Equipment and Devices .......................................................... 27 Commonly Used Data and Variable Types....................................................... 29
Occupant Behavior Modeling Methodologies .......................................................... 30 Simulation-based Methodologies ..................................................................... 32
ABM for interactions between occupants and buildings ............................. 32 ABM for interactions between various occupants ...................................... 36 Others ........................................................................................................ 37
Data-driven Methodologies ............................................................................... 38 Statistical analysis ...................................................................................... 38
Data mining ................................................................................................ 41 Stochastic modeling ................................................................................... 43
Comparison of Major Methodologies ................................................................ 45 Coupling Mechanisms............................................................................................. 50 Introduction of Agent-Based Modeling .................................................................... 57
Common ABM Tools and PMFserv .................................................................. 58
3 METHODOLOGY ................................................................................................... 61
Overview ................................................................................................................. 61
6
Modeling Principles of the Proposed ABM .............................................................. 65 Occupant Behaviors in Commercial Buildings .................................................. 65 Modeling Functions and Rules ......................................................................... 67
Function 1: agent physiology, stress, and coping style .............................. 67 Function 2: agent emotions and value systems ......................................... 68 Function 3: agent perception and object affordance .................................. 68 Other optional functions ............................................................................. 69
Decision Making Algorithm Based on the Model .............................................. 69
Data Collection and Validation Study of the ABM ................................................... 71 Data Collection ................................................................................................. 71
Sensor devices, methods, and parameters for indoor environment monitoring ............................................................................................... 71
Paper-based survey for recording occupant behavior ................................ 73 Outdoor environmental data ....................................................................... 73 Data collection scale .................................................................................. 74
Performance Test of the ABM .......................................................................... 74
Explanation of data use ............................................................................. 74 Validation method ...................................................................................... 76
Integration of Occupant Behavior Model with EnergyPlus™ ................................... 79
Co-simulation Method Development ................................................................ 79 Simulation Scenarios Design ............................................................................ 82
4 CASE STUDY AND RESULTS ............................................................................... 84
Development of ABM based on Actual Building ...................................................... 84
Descriptions of Case Study Building ................................................................ 84 Occupant Behavior Model Units ....................................................................... 86 Discussion of the Model ................................................................................... 90
Model Testing and Validation Study ....................................................................... 92 Data Collection Scope and Preprocessing ....................................................... 92
Results and Analysis of Individuals’ Behavior .................................................. 94 Results and Analysis of Overall Performance ................................................ 101 Summary and Discussion ............................................................................... 105
Simulation Experiments ........................................................................................ 108 Default and Survey-based Settings of Building Energy Model ....................... 108 Co-simulation Data Exchange Schema .......................................................... 111 Application and Results .................................................................................. 112
Energy use and cooling/heating demand differences .............................. 113 Occupant comfort level differences .......................................................... 118
Summary ........................................................................................................ 122
5 DISCUSSION AND CONCLUSIONS .................................................................... 124
Summary and Conclusions ................................................................................... 124
Limitations of the Research .................................................................................. 126 Development Barriers of Occupant Behavior Model ....................................... 126
Case Study Scale Limitations ......................................................................... 127

7
Co-simulation Function ................................................................................... 128 Recommendations for Future Study ..................................................................... 129
APPENDIX
A DETAILED INTRODUCTION OF PMFserv MAIN FUNCTIONS ........................... 131
Agent Physiology, Stress, and Coping Style ......................................................... 131 Agent Emotions and Value Systems ..................................................................... 132 Agent Perception and Object Affordance .............................................................. 134
B PMFserv SCREENSHOT SAMPLE ...................................................................... 136
C PMFserv SUPPORTED INFORMATION .............................................................. 138
D DATA COLLECTION CODE FOR SMART SENSOR ........................................... 139
Data Collection Code ............................................................................................ 139
Data File Upload Code.......................................................................................... 140
E IRB APPROVAL LETTER ..................................................................................... 143
F BEHAVIORAL RECORD SURVEY SHEET .......................................................... 145
G DEFAULT GSP TREE ARCHITECTURE ............................................................. 146
H CODE FOR PERCEPTUAL RULES DEFINITION ................................................ 148
I SAMPLE DATASHEET FROM SMART SENSOR ................................................ 155
J CONFIGURATION OF ENERGYPLUS EXTERNAL INTERFACE ....................... 156
K BCVTB CONFIGURATION FILE AND SCREENSHOT ........................................ 157
LIST OF REFERENCES ............................................................................................. 158
BIOGRAPHICAL SKETCH .......................................................................................... 167

8
LIST OF TABLES
Table page 2-1 Comparison of major occupant behavior modeling methodologies .................... 51
2-2 Research criteria of simulation coupling mechanism .......................................... 56
2-3 Commonly used ABM tools for building occupant behavior modeling and PMFserv ............................................................................................................. 60
3-1 Information exchange between ABM and building energy model ....................... 62
3-2 Specifications of environmental sensors ............................................................ 73
3-3 Corresponding settings in EnergyPlus™ for modeling behaviors ....................... 81
4-1 Standard comfortable range of environmental parameters ................................. 87
4-2 Performance summary of the ABM for the sample occupants .......................... 102
4-3 End uses of case study building ....................................................................... 115
4-4 Zone level energy-related data ......................................................................... 116
4-5 Building sensible heat gain factors ................................................................... 117
4-6 People sensible heat addition ........................................................................... 118
4-7 PMV statistics for experiment occupants .......................................................... 119
I-1 Sample of sensor collected environmental data ............................................... 155

9
LIST OF FIGURES
Figure page 1-1 U.S. energy consumption by sector .................................................................... 17
1-2 Problem statement for existing building energy modeling .................................. 20
1-3 Overview of research pipeline ............................................................................ 25
2-1 Typical data acquisition technologies for occupant-related research .................. 31
2-2 Overview of ABM simulation process ................................................................. 34
2-3 Proposed DNAS ontology for occupant behavior modeling ................................ 36
2-4 Characteristics of agents in ABM ........................................................................ 58
3-1 Research workflow overview .............................................................................. 64
3-2 Projection of ABM structure to the context of built environment ......................... 65
3-3 Decision making process of agent ...................................................................... 70
3-4 Customized smart sensor node .......................................................................... 72
3-5 Flow path of validation study .............................................................................. 76
3-6 Co-simulation method development ................................................................... 81
3-7 Simulation scenarios for building performance analysis ..................................... 83
4-1 Case study building in 3-D model ....................................................................... 85
4-2 Screenshot of “Built_Environment” object in PMFserv ....................................... 88
4-3 Causal relation between environmental parameters, perception types, and behavior options ................................................................................................. 91
4-4 Selected sample rooms for validation study ....................................................... 93
4-5 Simulation results and survey record for window blinds operation for occupant A in a selected day, with illumination level showing underneath ......... 95
4-6 Simulation results and survey record for door operation for occupant A in a selected day, with indoor temperature and CO2 concentration showing underneath ......................................................................................................... 96

10
4-7 Simulation results and survey record for window operation for occupant A in another selected day, with indoor/outdoor temperature and humidity, as well as CO2 concentration showing underneath ........................................................ 98
4-8 Simulation results and survey record for window blinds operation for occupant B in a selected day, with illumination level showing underneath ......... 99
4-9 Simulation results and survey record for door operation for occupant B in a selected day, with indoor temperature, humidity, and CO2 concentration showing underneath ......................................................................................... 100
4-10 Simulation results and survey record for window operation for occupant B in a selected day, with indoor/outdoor temperature and humidity, as well as CO2 concentration showing underneath ........................................................... 101
4-11 Percentage of five occupants on their actual interactions with building components during the survey period ............................................................... 104
4-12 Percentage of five occupants on the simulated interactions with building components during the survey period ............................................................... 105
4-13 Window operation variable settings for one occupant ...................................... 110
4-14 Door operation variable settings for one occupant ........................................... 110
4-15 Window blinds operation variable settings for one occupant ............................ 110
4-16 Energy use intensity comparison at building level ............................................ 114
4-17 HVAC sizing: design load per area ................................................................... 117
4-18 PMV fluctuation for occupant A in default simulation scenario ......................... 121
4-19 PMV fluctuation for occupant A in survey-based simulation scenario ............... 122
4-20 PMV fluctuation for occupant A in ABM-based simulation scenario ................. 122
B-1 Agent property: Stress module ......................................................................... 136
B-2 Agent property: Physiology module .................................................................. 137
C-1 Activation of tree items for Utility calculation for decision making ..................... 138
E-1 IRB approval letter – Page 1............................................................................. 143
E-2 IRB approval letter – Page 2............................................................................. 144
F-1 Survey sheet for behavior record ...................................................................... 145
11
G-1 GSP Tree default architecture - part 1 .............................................................. 146
G-2 GSP Tree default architecture - part 2 .............................................................. 147
H-1 Custom rules for blind open due to visual perception ....................................... 148
H-2 Custom rules for blind close due to visual perception ....................................... 149
H-3 Custom rules for window or door close under comfortable air quality and thermal conditions ............................................................................................ 150
H-4 Custom rules for door open due to air quality perception ................................. 151
H-5 Custom rules for window open due to visual perception ................................... 152
H-6 Custom rules for window close due to thermal perception ............................... 153
H-7 Custom rules for window open due to thermal perception ................................ 154
J-1 External Interface activation in EnergyPlus™ ................................................... 156
J-2 Schedule defining in External Interface for behavior update ............................ 156
K-1 XML code for variable settings for data exchange ............................................ 157
K-2 Logical connection for the two simulators in BCVTB graphical interface for co-simulation running ....................................................................................... 157
12
LIST OF ABBREVIATIONS
ABM Agent-Based Modeling
AHU Air Handling Unit
ASHRAE American Society of Heating, Refrigerating and Air-Conditioning Engineers
BCVTB Building Controls Virtual Test Bed
BDI Belief-Desire-Intention
BEM Building Energy Modeling
EUI Energy Use Intensity
FMI Functional Mock-up Interface
FN False Negative
FP False Positive
GHG Green House Gases
GSP Goals, Standards, and Preferences
GUI Graphical User Interface
HMM Hidden Markov Model
HVAC Heating, Ventilation, and Air Conditioning
IDF Input Data File
IEA International Energy Agency
IRB Institutional Review Board
LEED Leadership in Energy and Environmental Design
MAS Multi-Agent System
MC Markov Chain
MDP Markov Decision Problems
MLE Maximum Likelihood Estimation
13
OOP Object-oriented Programming
PIR Passive Infrared
PMFserv Performance Moderator Functions Server
PMV Predicted Mean Vote
RFID Radio Frequency Identification
TN True Negative
TP True Positive
USEIA United States Energy Information Administration
UWB Ultra-wide Band
VAV Variable Air Volume
WSN Wireless Sensor Networks
XML Extensible Markup Language

14
Abstract of Dissertation Presented to the Graduate School of the University of Florida in Partial Fulfillment of the Requirements for the Degree of Doctor of Philosophy
OCCUPANT BEHAVIOR MODELING FOR IMPROVING COMMERCIAL BUILDING
ENERGY USE SIMULATION
By
Mengda Jia
December 2018
Chair: Ravi S. Srinivasan Major: Design, Construction and Planning
Building energy modeling aids in enhancing building energy efficiency and indoor
environment comfort. Among others, occupant behavior is one of the dominant factors
that influence building energy use. Existing building energy simulation programs use
typical occupant schedules that often do not reflect actual situations. In other words, the
dynamic interaction of occupants with the building components is left out in these
existing programs. What is needed is a robust occupant behavior modeling approach
that utilizes the developments in state-of-the-art behavior models and which seamlessly
integrates with building energy simulation programs. Such an attempt will not only
improve the building energy simulation by increasing the functioning and estimation
accuracy of building simulation programs, but also provides a deeper understanding of
occupant behavior itself.
This dissertation develops a novel occupant behavior modeling approach, which
follows a pipeline of development, validation, and application of this model, in the
context of commercial buildings. Agent-based Modeling (ABM) is used as the
foundation of the occupant behavior model, which is implemented in a performance
moderator functions’ platform that captures occupant perception based on surrounding

15
conditions. Specifically, this model explores the occupant’s adaptation to changing
ambient environment. The model is tested in an educational building situated in the
University of Florida campus. Customized smart sensor nodes and paper-based
surveys are developed and implemented to collect data such as the environmental
conditions and the open/close status of targeted building components of the office
spaces. For validation purposes, the environment data is used as inputs to the ABM.
The output of the ABM is compared with surveyed data. Results show satisfactory fit to
reality for the model output.
The validated model is, then, applied to investigate the impact of occupant
behavior on building energy use estimation. For this purpose, a co-simulation
framework is implemented in Building Control Virtual Testbed (BCVTB) to exchange
data between the occupant behavior simulator, PMFserv, and EnergyPlus™, a widely
used building simulation program. Three simulation scenarios were designed to
compare results. Among others, one major contribution of this dissertation is the
simulation coupling of the occupant behavior model and building energy simulation
model.

16
CHAPTER 1 INTRODUCTION
Background
Energy conservation and utilization is part of the goals and key component of
sustainability according to LEED standard and rating system. The increasing energy
demand and consumption in the world will cause a lack of energy resources and
production of greenhouse gases (GHG) directly, which leads to enormous living crisis in
the future. Based on the estimation by USEIA (Energy Information Administration,
2015), the world energy consumption will grow by 56% from year 2010 to 2040, which
emphasizes the necessity of saving energy use from different aspects.
In the United States, buildings are one of the major contributors to the annual
energy use, which accounts for more than 40% of the total amount (Energy Information
Administration, 2015). From Figure 1-1, it could be observed that for the main sectors
that consume energy use, building operations is the largest consumer. Therefore,
abundant opportunities exist for energy savings associated with building sector. In the
life cycle of a building, six driving factors were identified by International Energy Agency
(IEA) that will influence the energy consumption as a whole, including climate, building
envelope, building systems and equipment, building operation and maintenance, indoor
environmental quality, and occupant behaviors (Yan et al., 2015). From the past
decades, research efforts have been addressed on some of the aspects for building
energy efficiency. For example, a research study by Cheung, Fuller, & Luther (2005)
has shown more than 30% energy savings by adding extruded polystyrene thermal
insulation in walls. Zhou, Wu, Li, & Zhang (2014) tested a demand response
mechanism in a home energy management system for household economic benefits.

17
However, among all the controllable factors above, building occupants are considered
as the most dominant factor that determines the energy use trend, while the research
work on understanding and modeling occupant behaviors in buildings for the general
objective of realizing energy-efficient buildings is still being explored. In addition, as one
of the main functions of buildings is to provide comfortable context and services to the
building occupants, research on the topic of occupant behavior modeling is helpful to
develop a “smarter” built environment which is able to improve occupant comfort level
and reduce building energy use at the same time (Jia & Srinivasan, 2015).
Figure 1-1. U.S. energy consumption by sector (Source: USEIA)
Occupant behaviors influence building energy use in a various and uncertain
manner (Valentina Fabi, Andersen, Corgnati, & Olesen, 2012; Yan et al., 2015). As a
consequence, occupant behavior information could serve as a crucial auxiliary element
for improving building energy management in various aspects generally. On one hand,
to incorporate occupant behavior information into building simulation tools will
potentially enhance energy simulation performance with the supplementary input; on the
other hand, occupant behavior information could be involved in the realistic building

18
operations for system optimization and behavior interventions design. Furthermore,
occupant behavior is a key factor to evaluate building design and retrofit technologies
(Hong, Taylor-Lange, D’Oca, Yan, & Corgnati, 2016; Yan et al., 2015), as different
occupant behavior patterns require corresponding technical solutions. In sum, a
thorough understanding and modeling of how occupants interact with buildings and
behave plays an important role in the building life cycle operations, especially for
building energy performance improvement.
Building occupants are the “users” of the building, whose actions vary over time
and among different individuals. In the context of built environment, the focus is placed
more on the direct interactions between occupants and building, which are usually
referred as energy-related behaviors (Hong, Sun, Chen, Taylor-Lange, & Yan, 2016). It
may typically include the use of building component (e.g. window opening/closing) and
the control of building systems (e.g. HVAC, lighting, appliance). Besides, personal
behaviors such as typing, writing, walking and clothing adjustment which affect energy
use subtly or indirectly should also be considered under certain cases. Meanwhile,
occupants behave differently within different building types because of their emphasis of
concerns. For example, physical comfort is the first priority for commercial building
occupants, while more factors including time, economic condition, health issues, etc.
must be taken into consideration for residential building occupants. Due to the complex
mechanism of occupant behaviors, it is difficult to model every single possibility with one
methodology. Hence, the modeling approach of occupant behaviors usually depends on
the scope and purpose of the research, as well as the available technology and
methodology support for the model.

19
Because of the fact that people spend 80% of their lifetime in buildings (R. Yang
& Wang, 2013), needless to say, occupant behavior modeling must be addressed for
the purposes of comfortable indoor environment and building energy efficiency. In fact,
this problem has attracted numerous researchers’ attention in the past few years(D’Oca,
Hong, & Langevin, 2018; Gunay, O’Brien, & Beausoleil-Morrison, 2013; Jia, Srinivasan,
& Raheem, 2017; Nguyen & Aiello, 2013), while there still exists research gaps to be
explored.
Problem Statement
A number of studies have shown that the uncertainty brought by occupant
behavior exerts significant impact on building energy use (Valentina Fabi, Vinther
Andersen, Corgnati, Olesen, & Filippi, 2011; Hong, Taylor-Lange, et al., 2016; Yan et
al., 2015), which, in turn, renders erroneous estimation of building energy use although
often within acceptable error ranges as recommended by ASHRAE (+/- 15% of actual
energy use) and other organizations. It is to be noted that these error ranges are
sufficiently large. Moreover, existing building energy simulation programs use a
relatively complete modeling system for physical and external design factors while
oversimplifying the internal ones, particularly the interactions between occupants and
building (Figure 1-2). These programs have largely ignored occupant behavior and
instead treat occupants as “static.” While an occupant interacts with the building
systems in a real world environment, these members are represented as mere numbers
in the building energy simulation programs and, therefore, “static” as opposed to their
“dynamic” behavior. This leads to large discrepancy between predicted and actual
energy use in most of the cases (de Wilde, 2014). This error could be as much as 300%
according to (Andersen, Fabi, Toftum, Corgnati, & Olesen, 2013). Turner & Frankel

20
(2008) compared the measured and predicted energy use for 62 LEED buildings and
found obvious differences for all the buildings. Part of the reasons can be explained by
the fact that occupants act and interact with building dynamically, and each individual
may behave differently in response to the same ambient settings. This gap needs to be
bridged through a robust model that takes into consideration the behavior of occupants.
A few inherent issues in representing occupants in building energy simulation programs
are discussed below:
Figure 1-2. Problem statement for existing building energy modeling
1. Occupancy vs. Occupant behavior
Studies pertaining to building occupants attract attention from many researchers.
Related research started by tracking occupant presence/absence status in rooms or
buildings, and, then, reduced to number of occupants (Lam et al., 2009; Nasir et al.,
2015; Yang, Li, Becerik-Gerber, & Orosz, 2014). This approach is referred to as
“occupancy”, a basic data used in building energy use estimation. However, occupancy
is a passive data and in contrast to active behaviors of occupants with the building

21
components. Although researchers claimed to have modeled occupant behavior, their
work lies within the “occupancy” study. For example, Carmenate, Rahman, Leante,
Bobadilla, & Mostafavi (2015) claimed that their proposed approach estimates how
occupant behavior affect energy use, whereas their work actually counted the number
of occupants with energy expenditures of a building rather than attempting to
understand and implement the occupant behavior on the building components.
2. Limitation of data-driven modeling approaches
Among the existing research that explored building occupant behavior models,
different types of modeling methodologies have been proposed. In general, the methods
could be divided into data-driven and simulation-based models. Data-driven model is
built based on relevant data of occupant behavior, including environment, weather, and
electricity use, etc. However, data-driven model lacks the ability to directly connect to
building energy simulation tools and might be only effective and valid for certain
buildings and occupant types (Jia & Srinivasan, 2015; Jia, Srinivasan, & Raheem,
2017). Moreover, existing modeling methods, typically, focus on only one particular
behavior, which is not holistic in contrast to simulation-based method.
3. Simulation-based research lacks actual data involvement
Simulation-based model tries to mimic the actual occupant behaviors in the
building under particular ambient and other boundary conditions. This type of model has
a good potential to be integrated with traditional energy simulation tools. However, in
most studies of simulation-based model, it often fails to validate the model and no actual
data and scenarios are involved, which makes the model less robust and convincing to
some extent. Also, there is no agreement yet on the modeling rules for behaviors and
impact factors. Since existing conventional building energy simulation tools do not have

22
an occupant behavior module, either integrated in the simulation algorithm or as an
auxiliary system, to account for energy use attributable to the building occupants, there
is a strong interest by researchers to develop and implement framework to enable
information exchange between heterogeneous simulators.
Research Aim and Objectives
The overall aim of this research is to develop a novel occupant behavior
modeling method to improve building energy use simulation. The specific objectives are
as follows:
Objective 1:
To develop an occupant behavior modeling method for improved energy
simulation by modeling occupant’s interaction with building components owing to indoor
and outdoor environmental conditions.
Sub-objective 1-1:
To model occupant’s interaction with building components for the purpose of
energy estimation at thermal zone level using PMFserv, an Agent-based Model.
Sub-objective 1-2:
To integrate PMFserv and EnergyPlus™ using a co-simulation platform, BCVTB,
which updates activity schedule at each time-step for building energy simulation.
Objective 2:
To collect actual environmental data and occupant behavior data to validate the
developed occupant behavior model.
Objective 3:
To investigate the influences of occupant behavior input to building performance
simulation using real-world educational building as a case study.

23
For sub-objective 1-1, an ABM will be developed with the assistance of a well-
tested and widely applied human behavior modeling platform, PMFServ. This is the first-
ever attempt to utilize this platform for the built environment domain. This model will use
external factors such as indoor and outdoor environmental conditions and internal
factors such as personal cognitions into consideration to simulate occupant behaviors
on a decision-making basis, thus, providing information that incorporates into energy
simulation engine.
For sub-objective 1-2, the developed ABM will be integrated with a widely used
building energy simulation engine, EnergyPlus™. This integration is effected by
transferring behavior decision information, as inputs, to EnergyPlus™ to generate
simulated environmental data, as outputs. For further development, the developed ABM
may be implemented as a separate module of EnergyPlus™ to support occupant
behavior schedule input to improve final energy use estimation.
To achieve objective 2, relevant data will be collected from selected rooms in a
case study building using both custom embedded sensor board and paper-based
survey sheets. The purpose is to test and validate the developed ABM.
Finally, for objective 3, after testing the effectiveness of the proposed model,
three simulation scenarios will be implemented with EnergyPlus™ to understand and
analyze the impact of occupant behaviors to building energy use and indoor comfort
level.
Research Scope
Because occupant behaviors vary according to building types, occupant types,
accessible behavior options, etc., it is impractical to analyze and integrate all potential
scenarios in a generic model. Therefore, this research narrows down the scope to one

24
type of condition using a real-world building as case study. Specifically, this research
focuses on commercial buildings and the occupants modeled in the program are all full-
time users without long-term absence. Direct interactions with building components are
the studied in this research work. The energy impact of occupants owing to their
activities such as reading, seating, walking, writing, and other subtle are not studied.
Refer to Chapters 3 and 4 for additional details.
Contributions
The specific research contributions to the building energy domain are listed
below:
1. Occupant behavior model: The development of an occupant behavior model in PMFserv platform. This is the first ever attempt to utilize PMFserv for the purposes of studying building occupants.
2. Co-simulation of the developed ABM and EnergyPlus™: The development of a simulation coupling method via BCVTB for seamlessly integrating the proposed occupant behavior model and building energy model to improve energy estimation. This development offers a new vision to researchers in the building energy and sustainability areas by providing a new and thorough understanding of the occupant behavior using a sophisticated ABM framework. Besides, this development also increases the functionality of building simulation tools and potentially cuts the discrepancy between predicted and actual energy use;
3. Validation tools: The development of data collection, processing, and analysis procedures for model testing and validation. This research fills the gap which the majority of existing simulation-based occupant behavior models ignored, i.e., the use of actual measurement data from the real-world to enhance future implementation capability of the model for better energy use estimation.
Structure of Dissertation
This dissertation is organized as follows. Chapter 1 provides a brief introduction
to the research background, problem statement, research aims, and expected
contributions. Chapter 2 reviews the state-of-the-art occupant behavior modeling
methodologies, including data collection technologies and simulation coupling
25
mechanisms, in the area of building energy efficiency. Chapter 3 presents the research
methodology in the dissertation, which follows the sequence of model development,
validation and simulation application. Chapter 4 discusses a case study based on an
educational building that implements and instantiates the proposed methodology, along
with relevant results analysis. Finally, Chapter 5 discusses and concludes the
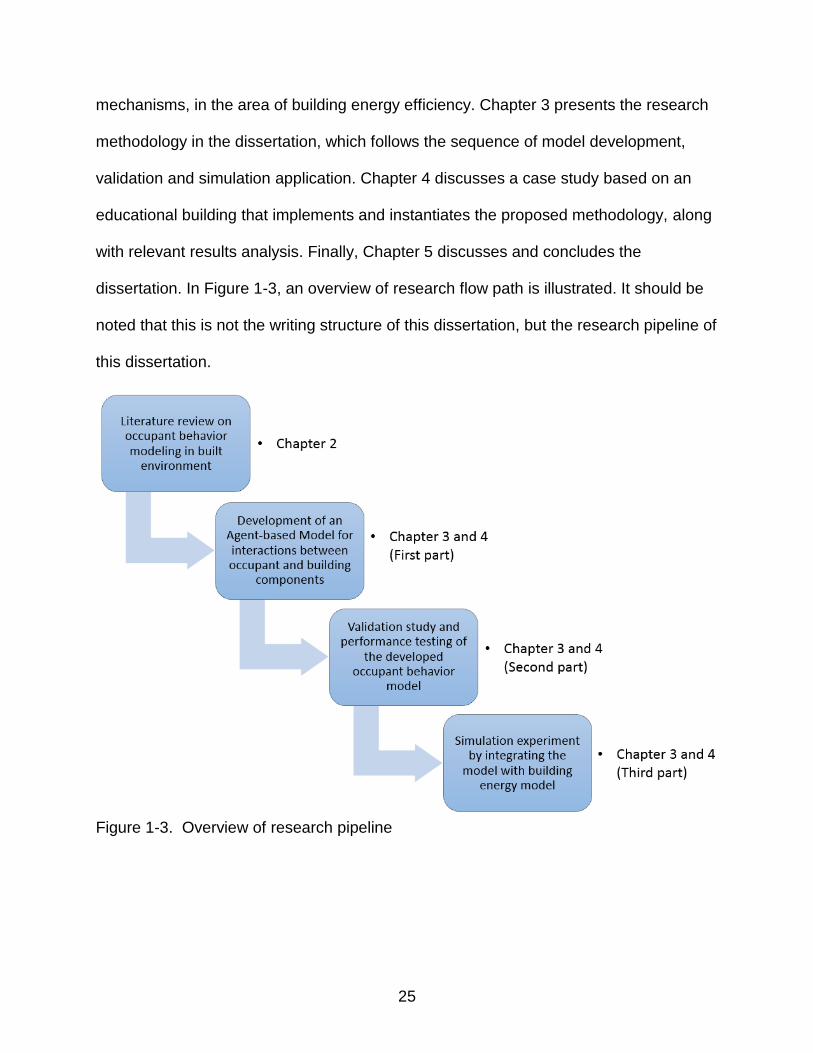
dissertation. In Figure 1-3, an overview of research flow path is illustrated. It should be
noted that this is not the writing structure of this dissertation, but the research pipeline of
this dissertation.
Figure 1-3. Overview of research pipeline

26
CHAPTER 2 LITERATURE REVIEW
Overview
This chapter discusses the literature related to occupant behavior modeling in the
context of built environment. Many researchers have summarized this topic from
different point of views and perspectives (Gunay et al., 2013; Nguyen & Aiello, 2013;
Rafsanjani et al., 2015; Stazi, Naspi, & D’Orazio, 2017; Yan et al., 2015), while for the
purpose of this research, the main focus is on the state-of-the-art data collection
technologies, modeling methodologies and simulation coupling mechanism for occupant
behaviors study in the area of building energy efficiency. Moreover, a thorough
comparison among the literatures which used ABM for occupant behavior modeling is
provided.
Data Acquisition Technologies for Occupant Behavior Modeling
Although occupant behavior modeling methods differ in several forms, data
collection and processing approaches are very similar among most studies, which share
some of the data acquisition devices and data types. In this section, occupancy
modeling technologies as well as methodologies in the later section will be slightly
involved for the reasons that 1) occupant-related data collection share the same
parameters type and properties, thus the data acquisition technology could be applied
to either case; 2) in a similar way, modeling methodologies were usually overlapped,
and understanding occupancy modeling methodology could be considered as a prelude
to developing subsequent methods for occupant behavior modeling.

27
Data Collection Equipment and Devices
Advanced technology in the field of electrical and computer engineering has
been developing rapidly in the past decade, which helps facilitate data collection and
enhance data accuracy. The current collaboration with building energy studies includes
not only model-related parameters monitoring but also energy simulation incorporation.
Various types of devices such as sensors, cameras or meters are being applied on the
basis of research methods and objectives. After collecting the useful data, simulation
software could then assist recognizing energy saving potentials.
Wireless Sensor Networks (WSN) are the most common and popular tool for
monitoring occupant-related variables such as temperature, humidity, carbon dioxide,
sounds, and illumination, etc. Typical WSN consist of sensor nodes that can be
distributed throughout the buildings. By using wireless technology, operation and
maintenance costs are reduced as no cabling is required. Wireless sensors can be
deployed in a remote place where some of the wired devices may not be able to reach.
In addition, by forming a network, sensor nodes will be able to communicate and
exchange information with each other, and the data could be logged in a more
organized way simultaneously. Since occupant behavior usually has a causal
relationship with surrounding environment, ambient data sensors are always placed
within the research areas. Yang et al., (2014) explored a method to estimate real-time
occupancy conditions by monitoring plenty of environmental factors including humidity,
temperature, carbon dioxide concentration, light, sound, and motion. A total of 50
sensor boxes were created and deployed with a main controller board and
corresponding sensors for the parameters mentioned above. Several machine learning
algorithms were applied for the purpose of estimating occupancy without actually tracing

28
it. The best performance model can count numbers of occupants at room level with
higher accuracy and a lower cost. As a result, HVAC operations can be optimized
based on the occupant demand to reach the goal of saving energy while still
maintaining user comfort.
Under particular circumstances, self-developed devices are used in combination
with corresponding algorithms. HVAC operation schedule was revised by Agarwal et al.
(2010) based on real-time accurate occupancy data collected by sensors with a different
but more complex method used by Yang et al. (2014). The research study combined a
magnetic reed switch with passive infrared (PIR) sensors which were commonly used
for occupancy detection, and then developed an algorithm to estimate occupancy in a
comparatively accurate and low-cost fashion. That research showed advantages over
conventional approaches such as using cameras and vision algorithms, and the
simulation results indicated that their system could indeed reflect the presence and
absence of people in individual offices, therefore, improvising the HVAC control system
based on occupancy data for reducing energy consumption.
In addition to environment data, occupancy/behavior status monitoring is often
required for occupant behavior model training and validation. Direct occupancy
detection usually relies on cameras or PIR sensors, with each has its own merits and
shortcomings. Indirect occupancy detection could be widely different which depends on
certain conditions. For example, door or window open/close status change could reflect
the user action, thus special devices like reed switch in the study of Agarwal et al.
(2010) is used. Electricity meter is sometimes installed for usage pattern recognition as
representation of specified occupant behaviors.

29
Moreover, Chen & Ahn (2014) used Wi-Fi as occupant tracking technology. Their
efforts in the research consists of finding correlation between Wi-Fi connection event
and electricity consumption using hypothesis tests. The researchers presented the
benefits of Wi-Fi network over multiple sensors, as Wi-Fi would be able to track
occupancy and the locations of occupants based on access points and signal strength.
Besides, smart phones are nearly available for everyone nowadays so cost would not
be an issue for this technology. However, Wi-Fi only provides occupant positions
without other detailed information that is needed for behavior modeling.
Instead of measuring ambient parameters, Erickson et al. (2009) used self-
developed system called SCOPES based on wireless camera networks. The system
consists of 16 sensor nodes on the testbed building. Each sensor node is comprised of
a camera interfaced with an adapter board. Then the captured images by the system
were processed based on the object detection algorithm. The complex image
processing algorithm finally generated an array of data containing information needed
for occupancy modeling. The cameras used in this study were not for ground truth
monitoring.
Commonly Used Data and Variable Types
In general, the data sources of occupant behavior modeling research are from
following channels based on types of data: regular indoor environment sensors and
outdoor weather stations which are used for ambient parameters measurement
associated with occupant behavior (Andersen et al., 2013); electricity use that is
collected for understanding energy paths and occupant patterns (Zhao, Lasternas, Lam,
Yun, & Loftness, 2014); PIR sensors or cameras that are typically used for grasping
ground truth such as occupancy status (Agarwal et al., 2010); and miscellaneous

30
technologies such as self-developed devices, RFID, Ultra-Wide Band and so on for
specific behavior monitoring including window status, occupant locations, reading and
walking, etc. (Li, Calis, & Becerik-Gerber, 2012; Masoudifar, Hammad, & Rezaee,
2014). Last but not the least, conducting survey is another data source used for
modeling and simulation in many past research studies (Feng, Yan, Wang, & Sun,
2016), which should not be ignored and must be used in coordination with the advanced
technologies.
Figure 2-1 depicts the current data acquisition technologies for corresponding
data types that are used for modeling purpose. It is noticeable that though technologies
provide sufficient convenience for data recording, the most important mission is to
identify the key parameters to measure in order to avoid unnecessary and redundant
data collection. Moreover, many novel methods, or even some existing methods that
are temporarily discarded due to inadequate technical support in the past could be
applied in the future due to the improvements in data processing ability and increase of
device types and performance.
Occupant Behavior Modeling Methodologies
Data collection is the preparation step of modeling occupant behavior. The
current technologies provide adequate access for the data that is needed for the
research. Nevertheless, there is no common view or requirement that determines the
selection and use of collected data. In fact, based on different modeling methodologies,
data is not a mandatory element in some cases in that the models are not built based
on volumes of data with those methods. However, additional validation work may be
required for this type of methods, thus data is still needed for the models.

31
Figure 2-1. Typical data acquisition technologies for occupant-related research

32
In general, based on the modeling purpose and structure, occupant behavior modeling
in buildings could be classified into two major categories, namely simulation-based
methodologies and data-driven methodologies. The main difference between the two
categories reflects in the model foundations, where simulation-based models establish a
virtual environment with heterogeneous objects that mimic how actual human beings
behave, regulated by rules, and data-driven models usually build a mathematical
relationship between particular variables and targeted behaviors using behavior-related
data from the experimental buildings and occupants.
Simulation-based Methodologies
As a representative simulation-based methodology, Agent-based Modeling
(ABM) is a computational model for simulation of objects interaction with each other and
the external environment. The model is on the basis of regulated rules which enable
assessing the effects on the whole system.
ABM for interactions between occupants and buildings
ABM for occupant behavior study has different emphasis. Many research
focused on the interaction of human and building systems. For example, Klein et al.,
(2012) developed their own multi-agent comfort and energy system to model alternative
management and control of building systems and occupants. In their model, devices,
occupants and meetings are all simulated as agents. Four distinct control strategies
were applied as comparison, which are baseline, reactive, proactive, and proactive-
Markov Decision Problems (MDP) for the purpose of building operation as well as
intelligent coordination of devices and occupants. They compared the results of energy
and comfort and stated that proactive with MDP shows the best result.
33
The work of Andrews, Putra, & Brennan (2013) showed strong potential
capability of ABM as their team have been trying to build a modeling framework for
occupant behavior at building level by this method. These researchers created occupant
perception and behavior model and integrated it with simulation software for energy
simulation. Their whole modeling system is comparatively comprehensive as it includes
not only building performance sub-model that modifies the state of indoor environment
but also human agent sub-model that simulates decisions and reactions of occupants.
As for the occupant module, a procedurally oriented framework called Belief-Desire-
Intention (BDI) was introduced which was then enriched for a better version.
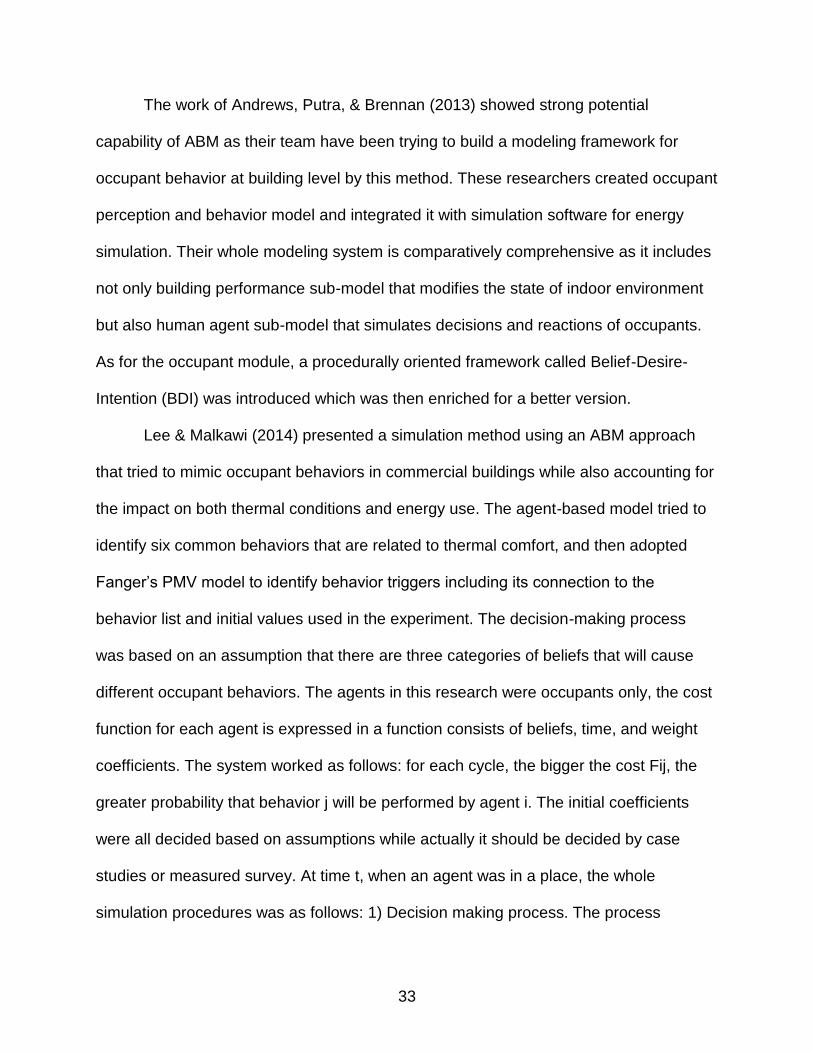
Lee & Malkawi (2014) presented a simulation method using an ABM approach
that tried to mimic occupant behaviors in commercial buildings while also accounting for
the impact on both thermal conditions and energy use. The agent-based model tried to
identify six common behaviors that are related to thermal comfort, and then adopted
Fanger’s PMV model to identify behavior triggers including its connection to the
behavior list and initial values used in the experiment. The decision-making process
was based on an assumption that there are three categories of beliefs that will cause
different occupant behaviors. The agents in this research were occupants only, the cost
function for each agent is expressed in a function consists of beliefs, time, and weight
coefficients. The system worked as follows: for each cycle, the bigger the cost Fij, the
greater probability that behavior j will be performed by agent i. The initial coefficients
were all decided based on assumptions while actually it should be decided by case
studies or measured survey. At time t, when an agent was in a place, the whole
simulation procedures was as follows: 1) Decision making process. The process
34
conforms to a rule of “observe, orient, decide and act”. The outside simulator provides
environmental parameters to an agent and calculate its PMV to see the comfort level,
then cost function will be used to figure out the ranking of behaviors (orient). After that
the type and number and incremental changes (decide). Acts mean to send the impact
back to outside simulators; 2) in the process, the agent could learn by upgrading the
behavioral belief. However, the interaction part in this experiment was decided as fixed,
which means they were muted influenced while in the real world it is not the case; 3)
simulation coupling was also included. ABM was programmed in MATLAB and linked
with EnergyPlus™ with the help of BCVTB architecture, to exchange parameters in a
whole loop. The result part explored how different behaviors affect building energy use
and occupant comfort level by adjusting relevant parameters to get different kinds of
results. Figure 2-2 shows the logical process diagram of their proposed ABM.
Figure 2-2. Overview of ABM simulation process (Adapted from Lee & Malkawi 2014)
35
Langevin, Wen, & Gurian (2015) presented a detailed ABM using thermal
comfort and behavior data from a field study in an office building. This model assigned
building occupant agents dynamics for clothing, metabolic rate, thermal acceptability
and behavior choice hierarchy. The rules of agent behavior conformed to Perceptual
Control Theory to maintain thermal sensation. The performance of prediction was
compared to other modeling options for validation. Although the study was limited to an
office building, this approach provided a platform for more flexible simulations based on
the interactions between occupants and surrounding built environments. The study also
showed that ABM can be used to model interactions between different occupants.
Hong, D’Oca, Turner, & Taylor-Lange (2015) proposed an ontology for modeling
occupant behaviors from the external drivers to internal needs of people, then to the
actions and systems they act on (Figure 2-3). Subsequently, an occupant behavior
simulation tool was created with their so-called “Drivers, Needs, Actions and Systems”
structure (Hong, Sun, et al., 2016). The software tool is built without the support of any
existing ABM tools, but completely invented for the purpose of building energy
simulation. The model applied Weibull functions to determine the probability of actions
as a function of environmental data, and generated outputs of three common behavior
schedules for further use.
The ABM by Kashif, Ploix, Dugdale, & Le (2013) was built via the Brahms
modeling software, which is a popular Modular Execution Framework for integrated
systems. The researchers focused on the residential building occupant behaviors and
described a causal model of behaviors that is analogous but somewhat different to
(Hong, Sun, et al., 2016), as two factors (time and environment) were identified as the

36
triggers of behaviors. However, this research tend to describe the model in a social
science perspective and did not cover the internal details and settings of the simulation
environment. Moreover, the simulation scenario was purely based on an imaginary
home situation which is not convincing enough to be valid.
Figure 2-3. Proposed DNAS ontology for occupant behavior modeling (Adapted from
Hong et al. 2016)
ABM for interactions between various occupants
Azar & Menassa (2012) analyzed the relationships between occupants within
their agent-based model to account for different occupant energy use characters and
changes. The unique contribution of their model as compared to others is that they
considered only energy consumption behaviors and factors that cause behavioral
change. Basically, their modeling process started by identify energy-consuming
behaviors and determine factors that cause behavior changes. Then an iterative model
is created with assumed input. After obtaining energy consumption rate per occupant
behavior type using eQuest, the model was simulated for energy use variation. The
researchers also tested the reaction to different input parameters by conducting
sensitivity analysis, with four scenarios created.

37
Alfakara & Croxford (2014) used agent-based modeling to explore the interaction
between occupants in residential houses and room systems for turning HVAC on/off as
well as opening/closing windows. They built the ABM by dividing the objects into two
classes: person and room. Each of the classes has their own attributes that were
defined by the researchers that are based on probability. At the simulation stage,
iterations were conducted combining the model and temperature input. Two cases were
considered: a baseline and improved case, in which the improved case increased the
temperature threshold of occupants. The results showed a reduction in HVAC used
hours and an increase in window opening rate. Also, the cooling load was reduced by
30%. Although some of the parameters used were simplified, the model set the
foundation for the future stages of research.
Others
Although simulation-based methods (especially ABM) can be generally
categorized into two different forms, there is no strict separation line between them.
Different types of combination approaches exist in the literature as well. For example,
Putra, Andrews, & Senick (2017) built a model that replicated the interactions among
occupant/tenant representative/building manager/building systems. In that research,
both types of interactions were defined as behavior options to deal with external
interruptions. The model showed the importance of heterogeneous occupant
perceptions and behaviors in understanding responses to load shedding events. The
stimulus of behavioral changes is the energy load shedding instead of environmental
conditions, which is an interesting idea, but yet has not been proven to be valid under
the circumstance.

38
The research of (Papadopoulos & Azar, 2016) indicated that ABM can be
combined with data-driven methods. That research modeled six human actions that
have high energy influence on buildings, and translated changes in human attributes to
building energy consumption levels. With 1200 groups of behavior-related variable
value settings, the energy use data was obtained for each group using traditional
building performance simulation. Then, a linear regression model was developed that
associated energy use to the six behavior-related variables, so that a surrogate model
was generated to predict energy use that effectively integrated building performance
simulation in ABM.
Data-driven Methodologies
Data-driven methodologies could be further categorized into three classes, which
are statistical analysis, data mining, and stochastic modeling.
Statistical analysis
Statistical analysis is conducted to establish a numerical relationship between
occupant behavior and other information. Indoor environment, electricity use, or time
series where all somehow influence occupant behavior mutually. Using regression
model, the probability of studied behavior could be expressed via related parameters
input.
A study by Haldi & Robinson (2008) is one of the earlier examples of using the
statistical method. That research asked all the volunteer participants to complete an
electronic survey with several questions about their activity level, thermal sensation, and
adaptive opportunities exercised. At the same time, indoor and outdoor temperatures
were recorded by sensors or from the local department (Swiss Federal Office of the
Environment). Logistic regression was then applied to analyze the influence of thermal

39
stimuli on occupants’ behavior to open/close windows, blinds, fans, and doors. Also
personal behavior like consuming drinks and adaptations on clothing was also included
in the study. The authors found that internal temperature played a more important role
than the external temperature on predicting the probability of occupant behaviors.
Due to a comparatively steady relationship between occupant status and ambient
characters, researchers tend to search the quantitative triggers of occupant behavior.
Indoor environmental data, occupant presence/absence information, and position of
shading and windows were collected by Mahdavi & Pröglhöf (2009) in five office
buildings located in Austria using weather station, occupancy sensors, and time-lapse
digital photography. The statistical relationship was provided among these parameters
by depicting trends in the same coordinate and summarized that long-term general
patterns of occupant control behaviors on building system could be translated as a
function of indoor and outdoor conditions.
Peng et al. (2012) quantitatively described occupant behaviors through various
parameters in different ways. They noted that equipment operational status and their
energy use might reflect occupant behavior. For their research experiment, equipment
energy usage models were divided into three categories, namely time-related,
environmentally related, and random, to describe occupant behavior. Similarly, they
used probability and time steps to model the first type of behaviors, environment and
user feedback data to track the behaviors of second type above. Finally, they assumed
three types of typical lifestyle of humans and simulated the energy consumption based
on the division type.

40
Tabak & de Vries (2010) used two methods to predict the frequency of
intermediate activities in an office building. Based on the context of that paper,
intermediate activities depend on a person’s role to a lesser degree but has more
correlation with human needs, which in their opinion, are independent of a specific
environment and thus could be developed in a generic way. The researchers first
identified nine activities and their influencing factors through a survey, and decided to
use S-curve method for the behaviors that strongly depend on the time elapsed since
the last occurrence. Other behaviors that occur more randomly were assigned a random
function to decide the start time. One of the shortcomings of the research is that the
data source came from a web-based survey with lots of questions about their activities,
frequency and so on. Despite this, the statistical results of effective responses still
showed possible behavior time and duration at an average level.
Some research studies are also conducted for specific behavior objects tracking.
Li, Li, Fan, & Jia (2015) focused on window opening behavior and collected ambient
data of six factors including indoor/outdoor temperature, indoor/outdoor humidity, indoor
CO2 concentration and outdoor wind speed. Window occurrences conditions were then
gathered using self-developed window open status recording device. In that research,
they used multi-factor variance analysis to find the statistical significance of the six
factors to window opening activity. The study concluded that outdoor temperature is the
most influencing factor. Base on the results, a logistic regression, was performed to
obtain the mathematical relationship between the probability of window opening and
outdoor temperature. A second comparative method namely Monte Carlo simulation
was also performed to get the probability distribution of window opening activity.

41
Mahdavi & Tahmasebi (2015) compared two previously developed probabilistic
models and a non-probabilistic model by fitting separate training data given their
performances on occupancy prediction. The probabilistic models demonstrated the
relationship between occupancy and time. The contribution of that research helped to
improve the accuracy of training and validation datasets and an evaluation approach
that analyzed prediction errors on occupant presence prediction.
Data mining
In most of the cases, electricity usage condition of certain equipment may reflect
users’ behavior. Therefore, by mining energy usage data, corresponding occupant
behavior pattern can be learned, especially for a long-term mode.
In the research of (Zhao et al., 2014), a data mining solution was developed to
predict occupant behavior and schedule based on office appliance energy use.
Electricity meter was deployed to measure electricity data of appliances including
desktop computers, monitors, task light, speaker, laptop computer, hard drive and
personal heater. A pedometer was attached to each experiment participant for ground
truth data logging for a total of six occupants. The researchers trained and tested these
data with three data mining algorithms, and the results had good performance on
predicting schedule of appliance application behavior. One of the issues of this study is
that occupant behaviors are only defined into four categories that did not cover all the
possible scenarios.
D’Oca & Hong (2015) used a three-step data mining schedule learning method to
deal with a data set of the occupancy status of 16 offices to provide insights of patterns
of occupancy. Before the learning process, raw occupancy data was transformed to pre-
processed data representing several predictor attributes (season, day, time, window

42
state). The authors applied the C4.5 algorithm to generate a decision tree model that
aimed to predict the value of a label attribute (occupancy) based on those input
attributes. Forty-five decision rules were derived based on the tree model from the root
node to a leaf node, which could understand repetitive occupancy patterns. The cluster
analysis using k-means was performed to group these occupancy presence conditions
into four typical patterns. The final goal of the research was to understand different
occupancy patterns in buildings for better prediction of building performance.
Similarly, Alhamoud et al. (2015) utilized two sets of data to conduct three
experiments for energy-related occupant behavior pattern detection in a residential
building. The datasets comprised of power and environmental data that were obtained
from sensors and a volunteer survey while nine activities were defined on the basis of
regular motions. During the first task, they used the Random Forest Classifier algorithm
to build a model that established a correlation between occupant’s current location and
real-time power consumption. After that, they used Apriori Algorithm to extract the
temporal relations between activities, trying to recognize the activity pattern for a certain
occupant. They compared the distributions of daily power usage for two different days
and found high similarity between them concluding that people has a regularly routine
power consumption behavior. All the information was mainly mined from electricity
consumption of home appliances.
In some studies, the data mining method was integrated with ABM to simulate
occupant behavior. For instance, Baptista, Fang, Prendinger, Prada, & Yamaguchi
(2014) presented a Nearest Neighbor occupant behavior model in multi-agent systems.
The model was established as a set of coordinating agents to mimic occupants. Data

43
mining techniques was employed to classify database according to the resemblance of
states, which would later be selected as the agent’s next behavior with equal
probabilities. Their model outperformed Markov Chain Model by producing better
results.
Stochastic modeling
Building occupants naturally behave in a random way, which make stochastic
modeling an effective way to model and estimate occupancy status and related energy
consumption.
Markov Chains is the fundamental starting point of this methodology. Erickson,
Carreira-Perpiñán, & Cerpa (2011) contributed to temporal dynamics of occupancy
detection by developing two advanced Markov Chain Models from ground truth data
collected from a sensor network. Also, they proved that their previous two models
namely, ABM and Multivariate Gaussian model both have limitations. Their study
showed improved accuracy in occupancy estimation and by implementing the real-time
occupancy data into HVAC operation schedule, 42% annual energy savings can be
achieved.
Also, Dong & Andrews (2009) discovered occupant presence and behavior
patterns based on semi-Markov models to optimize occupancy schedule for lighting and
HVAC control. Then, Dong & Lam (2011) developed an improved model with
environmental data and occupancy ground truth data. A Hidden Markov Model based
on Gaussian Mixture Model was implemented to estimate occupant numbers in a room.
A Semi-Markov Model was generated for occupancy duration estimation to represent a
long-term pattern of behavior.

44
Chen, Xu, & Soh (2015) proposed an advanced occupancy modeling method
using stochastic modeling. This study introduced the methodology with Markov chain in
an optimized manner. Two novel inhomogeneous Markov Chain models were proposed
under two scenarios of Multiple-Occupants-Single-Zone (MOSZ) and Multiple-
Occupants-Multiple-Zone (MOMZ). The novelty of this research is that the researchers
defined the state of Markov Chain (MC) as the increment (change) of occupant numbers
instead of occupant numbers for MOSZ; and for MOMZ, the state of MC was a vector in
which each component is the increment of occupancy in each zone. In this way, the
calculation load was much simpler. When calculating the probability matrix, they
adopted maximum likelihood estimation (MLE). The testing data came from the
research of Liao, Lin, & Barooah (2012), in which a wireless camera was used near the
entrance of a zone. To evaluate the performance of the proposed model, they defined
five parameters and two evaluation criteria to compare the results obtained from 1)
estimation from measurement, 2) prediction from ABM by (Liao et al., 2012), and 3)
their own models. Although some assumptions were made, the results showed this
model outperformed ABM model.
The methodology could also associate energy consumption with occupant
behavior pattern, which is indicated through an occupant behavioral model in (Virote &
Neves-Silva, 2012). The model was based on Hidden Markov Models (HMM) for
predicting building energy consumption using practically measured data. The HMM
consists of an observable layer that represents actions that occupant may take and
hidden layers that represent the factors that influenced the observed behavior. The
stochastic nature of Markov chains Model would strongly influence energy consumption

45
model, which is a cluster of Markov Chains according to the authors. By developing an
algorithm named frame-scene analysis, the energy use could be predicted under the
impact of occupant behaviors. The models provided valuable information for simulating
the influences that occupants have on a building in terms of energy consumption as
they showed that different occupancy patterns result in different patterns of energy
usage.
For a similar purpose, Zaraket, Yannou, Leroy, Minel, & Chapotot (2014)
delivered an activity-based approach for energy consumption forecast in residential
buildings using the stochastic method, since recent energy simulation methods lack
occupant behavior integration. This study provided a probabilistic mapping between
household profiles and corresponding domestic energy consumption. According to the
researchers, there is a reference person in each residential house, plus three other
parameters exist to influence the probability of high-level environmental awareness. In
the same manner, the probability of a household to have a certain appliance and further
energy efficient appliance was generated. Based on the estimating activity quantities
per household, the energy for one behavior could be estimated. The energy use
simulation was based on the variables above and calculated stochastically as a function
of the equipment unit. Later the researchers conducted a case study on the behavior of
“washing laundry”, with relevant data from the web-based survey. The model was
validated by opposing the results to measured data.
Comparison of Major Methodologies
Since building occupant presence and behavior has been demonstrated as one
of the most crucial elements for energy optimization at the building level, various
methodologies have been introduced to detect and model occupant behavior for
46
enabling more efficient building energy management. In this chapter, four modeling
methodologies were identified, namely agent-based modeling, statistical analysis,
stochastic model (Markov chain), and data mining from end-use energy use. However,
this is not a complete list for modeling approaches of building occupant behaviors.
Generally, it could not be concluded that one specific method is more effective than the
other, yet it is necessary to realize the advantages and limitations of these methods as
well as the applicability of them. A detailed specification is described as follows.
Agent-based modeling starts from the perspective of agent, and constructs a
virtual model based on some certain rules. ABM is a relatively new approach as a trial in
occupant behavior modeling and simulation with its particular advantages and
strengths. For instance, ABM can describe uncertainties in real-world as compared to
the static model and can model all behavioral aspects theoretically. Also, ABM
outperforms a simple “if-then” rule as the agents in the system can interact and change
behaviors in each simulation cycle (Y. S. Lee & Malkawi, 2014). However, limitations
still exist as the use of ABM approach to simulate building occupant behaviors is still at
its development age. The comprehensiveness and completeness of the model are
needed to be developed in the future. Researchers using this method have their own
concentration when modeling occupant behavior. As classified in this chapter, some of
the researchers have addressed the interaction between occupants and building
systems while others focused more on communication between occupants themselves.
Besides, the integration of simulated behavior and current energy modeling software
need to be studied as well due to the complexity of this model. Last but not the least,

47
appropriate verification and validation process is needed to boost the robustness of an
ABM, which is often lacked in most of the literatures.
Statistical analysis is the most traditional and common method in modeling
occupant presence and behavior. This methodology is often applied to study the
relationship between the occupant behavior and other factors, environmental
parameters. The idea of this method is to study the probabilities of behavior due to
driving factors through regression or observation. A typical example is the work of (
Fabi, Camisassi, Causone, Corgnati, & Andersen, 2014; Fabi, Maggiora, Corgnati, &
Andersen, 2014), who integrated the methods to understand two different behaviors in
office buildings: window opening, and light switch turning on/off. The researchers
measured indoor and outdoor environment parameters, along with window state in a
temporal manner, and conducted a multivariate logistic regression to obtain the
probability of operating windows with other information. The statistical analysis is a
comparatively direct and convincing way to model occupant behavior, as occupant
behavior will mostly be driven by surrounding environment. However, this method needs
to be improved because of two reasons. First, this method is only limited to one or two
certain types of occupant behaviors, such as window opening or light switch status.
Although this method is somewhat meaningful and straightforward, it is difficult to build
a comprehensive model and further integrate with energy simulation software. Second,
no matter how high the probability is predicted for the behavior, in the real world, people
may still behave or act in another pattern owning to individual psychology or other
conditions (Tabak & de Vries, 2010; Yan et al., 2015). Therefore, involving real-time

48
data in the statistical analysis may be a useful solution for detecting occupant behaviors
in buildings.
Data mining is the process of knowledge discovery in large databases. The goal
of the approach is to explore consistent patterns and/or systematic relationships
between variables and then to validate the findings by applying the detected patterns to
new sets of data. For studying building energy efficiency, data mining has been used as
one of the most popular methods. In terms of occupant behavior modeling in buildings,
data mining is often applied to study a long-term occupancy pattern from end-use
energy consumption data within a specific time. The benefit of this method is that the
data collection and data management is simple to implement, as in most research
studies, only electricity consumption or occupancy data is logged. Based on the strong
prediction capability of data mining, great accuracy could be obtained through this
method with potential room for improvement. This method is confined to pre-defined
occupant behaviors or merely occupancy, which limits the application of this method.
Moreover, research using this method mostly used residential buildings as experiment
object, probably because the energy monitoring procedure is more convenient, and the
occupant behaviors are easier to define. The other issue of this method is that the
pattern mined is hard to link to energy simulation program.
Stochastic modeling is employed by many researchers due to a “random” nature
of occupant behavior. A Markov Chain is the fundamental method that is a stochastic
process following Markov property whose future status depends only on current status
and will not be influenced by the past state. Some studies developed the algorithms
from different perspectives. For example, Dong & Lam (2011) correlated environmental

49
conditions and occupancy numbers using Hidden Markov Chain and found out valuable
accuracy in estimating occupancy status. Lee, Tong, & Cheng (2014) tracked and
modified occupancy level according to the time of day and presented a slight difference
between deterministic and stochastic model. Chen et al. (2015) only focused on
occupancy data through images captured by cameras, which they used to adjust the
size of the matrix that represent Markov chain states so that computing burden will
lower down without decreasing accuracy. According to (Gunay et al., 2013), current
building performance simulation tools provide application integration with stochastic
control models. Thus, this method can test the impact of occupant behaviors on building
energy use. But the drawbacks of this method could not be ignored. Stochastic
modeling is more suitable for long-term occupancy schedule prediction or classification
while detailed occupant behaviors or numbers of occupancy are not being researched
using this method. Similar to ABM method, this method also need development for the
completeness of occupancy model, and there is still no common views on how to build a
perfect stochastic model for occupant behavior detection.
There are plenty of studies on tracking building occupant behavior using other
methodologies apart from the categories mentioned in this paper which were all proved
to have their advantages and acceptable accuracy of realistic conditions. In summary,
the data sources that were analyzed for each method are usually similar, which are
ambient factors, electricity consumptions, and direct occupant behavior status
measurement. Although methods could be as simple as observation only, or as
complicated as a novel algorithm for machine learning. The information is needed
because surrounding environment is the main reason that may cause a change in

50
occupant behavior, and the electricity consumptions are the result of the adaptive
behavior. This causal relationship provides technical support for building occupant
behavior detection, thus cannot be ignored. However, improvement of existing
methodologies is necessary. Understanding the features of these methodologies could
provide researchers a thorough point of views for future study. A comprehensive
comparison (Table 2-1) is illustrated in the table below to offer more insights.
Coupling Mechanisms
A seamless integration of building occupant behavior model and energy
simulation platform can be helpful to quantify the influence of occupant behavior on
building performance, increase the accuracy of building energy prediction, and assist
practical energy optimization strategies. Nevertheless, the coupling mechanism of
occupant behavior model and energy simulation program is still at the early research
stage. This section summarized recent research efforts that indicated how researchers
have explored the impact of occupants on building energy use.
Some researchers directly monitored real-time electricity usage data and
occupancy status to seek energy saving possibility. Masoso & Grobler (2010) measured
electricity use of six buildings and broke down the usage data by equipment type and by
working periods that were defined as working hours and non-working hours. By
analyzing the data, the authors found that more electricity was used during non-working
hours than during working hours, which indicated a large energy saving potential by
changing occupant behavior patterns. Likewise, Kavulya & Becerik-Gerber (2012) linked
the appliance electricity loads data with occupant behaviors extracted from visual
observations of five people in a shared office.

51
Table 2-1. Comparison of major occupant behavior modeling methodologies
Methodology Representative references
Building type(s) that is more suitable
Ability to integrate with simulation
Additional Comments
Agent-based Modeling
(Y. S. Lee & Malkawi, 2014)
Both residential and commercial buildings
High For improving simulation accuracy. This method is used more in simulation the process, usually lack of actual data for support
Statistical Analysis
(Li et al., 2015) Commercial (Office)
Medium For recognizing driving factors of occupant behavior, Statistical comes from early ages
Data Mining (Zhao et al., 2014) Both residential and commercial buildings
Low For understanding occupant behavior Data mining method is usually for “passive” occupant behavior schedule learning.
Stochastic Model (Virote & Neves-Silva, 2012)
More on commercial buildings
Medium Stochastic model is always for MPC, and long-term occupant behavior pattern modeling, it is now used more for occupancy modeling
Others (Calì, Matthes, Huchtemann, Streblow, & Müller, 2015)
N/A N/A Data sources are generally the same. But the methodologies cannot be generalized since they studied from different views and purposes for occupant behaviors

52
They identified during the experiments that occupants were not usually aware of how
much energy was wasted when appliances were actually in use. The authors also
suggested that providing occupants with information on their energy consumption
patterns could somehow modify their behavior to a more efficient way. In energy
simulation tools, occupant behavior patterns were often sorted into several typical types,
such as “energy saving users,” “normal users,” and “energy wasting users” to analyze
their impact on energy respectively. Hong & Lin (2012) claimed that occupant behavior
is the driving factor that causes discrepancies among similar buildings in same climate
zone. They identified and categorized occupant behavior styles into three different
groups that are “austerity,” “standard,” and “wasteful.” They, then, selected three
adjacent offices and assumed each office has a person with the corresponding type.
The selected behaviors for different types consisted of several aspects including heating
and cooling set point, occupancy controls, daylighting controls, etc. By simulating the
energy use and comparing the results, this study was able to show the behaviors that
relate to operation and control of energy service systems of private offices. In the study
of (Peng et al., 2012), three classifications of occupant behavior patterns were
assumed, and the energy consumption was simulated by changing air conditioning
operation schedule, indoor temperature preference, and household loads based on the
division type. Obvious variations were found in building performances.
Yu, Fung, Haghighat, Yoshino, & Morofsky (2011) developed a novel technique
for examining the influences of user behavior on building energy use by excluding
overlapped effect of other conditions. They organized similar buildings among all the
test buildings into four groups based on 12 representative parameters that stand for four
53
factors unrelated to user behavior so that these external factors all have similar effects
on buildings in the same cluster. Grey relational analysis and data normalization were
applied to this cluster analysis. Then, in these four clusters, the effects of occupant
behavior on energy consumption were examined at the end-use level, as the end-use
variations are only induced by occupant behavior.
Clevenger & Haymaker (2006) used DOE-2 as a popular energy simulation
software to discover sensitivity of occupancy related parameters on energy usage. They
identified ten parameters to represent occupant in the simulation software and then set
all the parameters to medium values to run the simulation. Then each of these
parameters were set to either a high or low value to repeat the experiment. By
comparing the energy results with the control group, they were able to know the most
significant contributors to energy use variability. The researchers concluded that a more
reliable occupant model is needed for accurate prediction.
Adjustments relying on assumptions are more inclined to affirm the fact that
occupants do influence building performance, but it lacks the ability to quantify the
practical possible impact. Therefore, realistic data is needed. The paper of (Daniel,
Soebarto, & Williamson, 2015) contributed in three ways. First, although Australia’s
house energy rating system has been developed, namely Nationwide House Energy
Rating Scheme (NatHERS), the regulation has many limitations. According to the
questionnaire results from that research, the NatHERS protocols failed to reflect actual
occupant preference and operations. Second, they validated the capacity of an energy
modeling software that is based on NatHERS named AccuRate by comparing its
simulation result with EnergyPlus and EnerWin. In particular, the simulation showed that

54
AccuRate simulation engine could adequately predict internal conditions in simple
unoccupied buildings. Third, by modifying occupancy preference settings based on the
survey data, such as thermostat temperature set point and rooms being conditioned, the
research obtained much closer predicted heating and cooling loads to actual loads. This
study concluded an overestimation of energy loads in the regulatory mode of the
software. The study took advantage of real life choices of occupants to predict energy
use and found out that the results matched to the actual energy use. The research also
demonstrated that incorporating occupant information into energy simulation tools can
obtain better results than traditional simulation methods. However, in this research
occupancy settings are simple and not real time, thus lacking the ability to predict in a
more accurate way.
Duan & Dong (2014) applied PIR sensor for occupancy detection in four low-
income residential buildings as test beds to validate the information from the American
Time Use Survey data. They created two scenarios that applied measured schedule of
occupancy probability distribution into EnergyPlus and DesignBuilder. The temperature
settings were revised in the second scenario. The simulation study indicated large
energy saving potential compared to the baseline. Though the occupant behavior model
in this study was only represented by occupancy information, it was based on measured
data, which showed strong evidence that occupants do influence building energy use
significantly.
There are some research studies that specifically analyzed the effect of particular
occupant behaviors on energy use. For example, D’Oca, Fabi, Corgnati, & Andersen
(2014) focused on the effect of thermostat adjustment and window opening behavior on

55
energy consumption in residential buildings. Their previously developed probabilistic
human activity models were applied in the energy simulation phase. In an earlier
research work, Haldi & Robinson (2011) attempted to study the impact of occupant
behavior in terms of the window opening and shading devices on buildings. They
concluded that building performance simulation will be more realistic by integrating
occupant behavior models. Meanwhile, the influence of energy-related behavior change
based on individual variability exceeded that of the change from other building design
variables.
Wang & Greenberg (2015) focused on the impact of different types of ventilation
scenarios caused by window operation on building performance. Four scenarios were
defined by the authors, namely open windows, natural ventilation, changer-over mixed-
mode ventilation and concurrent mixed-mode ventilation. Then by changing parameters
in EnergyPlus to represent the four situations, the researchers simulated and cross-
compared the energy and thermal results with three different climate zones. The
researchers stated that mixed-mode ventilation can provide HVAC energy savings.
However, this paper did not mention how to model these behaviors.
In a related research study, Santin, Itard, & Visscher (2009) showed that both
occupant behavior and building characteristics can save energy. But sometimes
occupant behavior is determined by the type of dwelling or HVAC systems and,
therefore, the effect of occupant characteristics such as income or household size might
be larger than expected since these determine the type of dwelling. In Table 2-2, a
summary of research criteria for integration of occupant behavior model and building
performance simulation is illustrated.
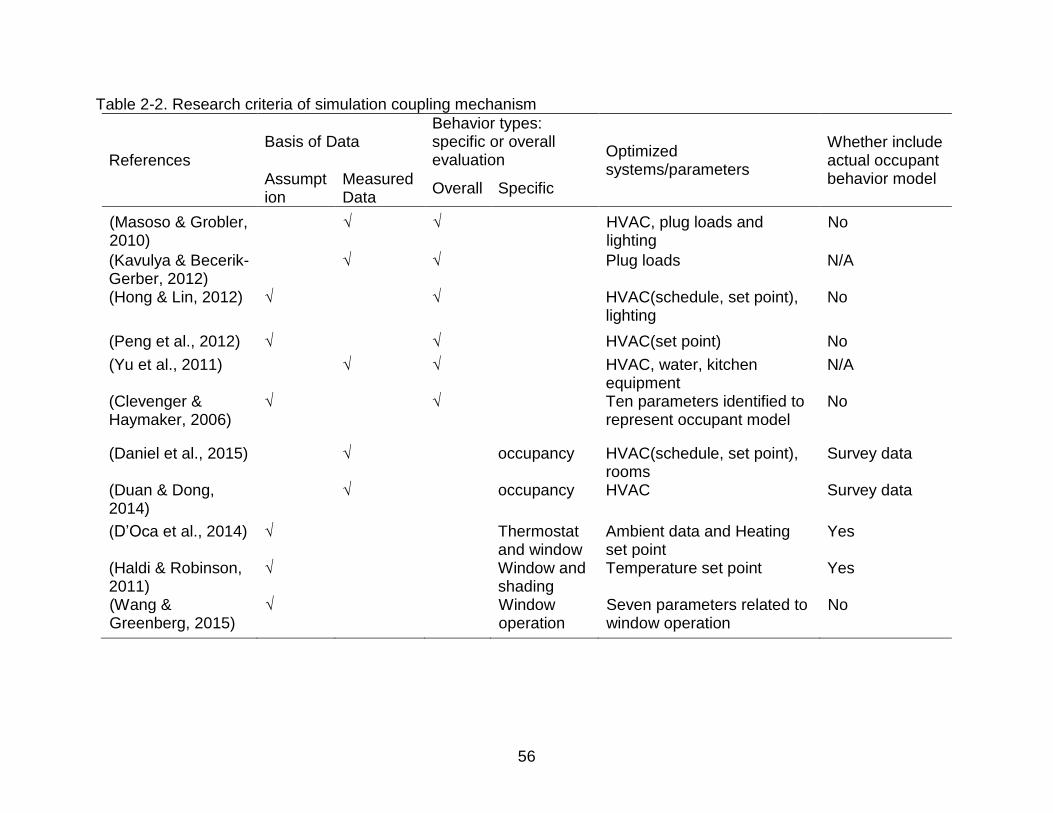
56
Table 2-2. Research criteria of simulation coupling mechanism
References
Basis of Data Behavior types: specific or overall evaluation
Optimized systems/parameters
Whether include actual occupant behavior model Assumpt
ion Measured Data
Overall Specific
(Masoso & Grobler, 2010)
√ √ HVAC, plug loads and lighting
No
(Kavulya & Becerik-Gerber, 2012)
√ √ Plug loads N/A
(Hong & Lin, 2012) √ √ HVAC(schedule, set point), lighting
No
(Peng et al., 2012) √ √ HVAC(set point) No
(Yu et al., 2011) √ √ HVAC, water, kitchen equipment
N/A
(Clevenger & Haymaker, 2006)
√ √ Ten parameters identified to represent occupant model
No
(Daniel et al., 2015) √ occupancy HVAC(schedule, set point), rooms
Survey data
(Duan & Dong, 2014)
√ occupancy HVAC Survey data
(D’Oca et al., 2014) √ Thermostat and window
Ambient data and Heating set point
Yes
(Haldi & Robinson, 2011)
√ Window and shading
Temperature set point Yes
(Wang & Greenberg, 2015)
√ Window operation
Seven parameters related to window operation
No

57
Introduction of Agent-Based Modeling
Through literature review and analysis of different modeling methodologies,
Agent-based Modeling is selected for this research. Agent-based modeling is a novel
approach that provides a platform to modeling complex systems composed of
interacting “agents” (Figure 2-4). Agents have their own characteristics and features
including behaviors, and they have the capability of interacting with their located
environment and other agents, which is often governed by user-defined rules. The rules
are the foundation to model agents’ relationships, interactions, and behaviors.
According to (C. M. Macal & North, 2010), a typical agent-base model has three
elements:
Agents, along with their attributes and behavior options;
Rules and topology, which defines how and with whom agents interact;
Agents’ environment, agents who stay in the environment are supposed to interact with their environment, in addition to other agents if possible.
In contrast with other modeling approaches, agent-based modeling begins and
ends with the agent’s perspective. The application of ABM is spread into many different
domains which include areas of intelligent built environment and building energy
efficiency. The system modeled by ABM is often referred as a Multi-Agent System
(MAS), which could be any combinations of the built environment. In this research, ABM
is used to model building occupants and their interactions with building components in
the indoor environment. Though the application is in the early stages, Lee & Malkawi
(2014) summarized several benefits of ABM implementation in occupant behavior
research. For example, ABM is able to address uncertainties of the real world; an agent
in ABM can simulate humans by perceiving surrounding environment and adapting to

58
changes in order to achieve a certain goal. Besides, even at the simplest level, there
could be valuable findings about the ABM system as a whole if proper agents and
relationships are invented (Jia, Srinivasan, Ries, & Bharathy, 2018).
It should be noted that Agent-based modeling is not mutually exclusive with other
modeling methodologies, in that an agent’s behavior can range from simplistic and
reactive rules to complex behaviors regulated by artificial intelligence techniques (Macal
& North, 2014). Specifically, if proved to be practical, ABM rules can be defined based
on statistical modeling or data mining results as part of the system that manage the
behaviors of autonomous agents.
Figure 2-4. Characteristics of agents in ABM (Adapted from Macal & North, 2014)
Common ABM Tools and PMFserv
Since ABM itself is not a new methodology, different commercial ABM software
exist for practical applications. In addition, some computing tools also provide
programming functions for developing ABM, such as MATLAB or R. For occupant

59
behavior modeling in built environment, the most common tools that have been
successfully applied include Brahms (Kashif et al., 2013), AnyLogic (Azar & Menassa,
2012), NetLogo (Putra et al., 2017), Repast (Alfakara & Croxford, 2014), etc.
Meanwhile, MATLAB is also a popular ABM tool (Langevin et al., 2015; Lee & Malkawi,
2014) due to its powerful computational ability. Moreover, Hong, Sun, et al. (2016)
developed a particular occupant behavior modeling tool (obFMU) for integration with
energy simulation engine. However, except the obFMU that is particularly developed for
modeling occupant behaviors, the public available tools above are not specialized in
tracking building occupant, thus lack of key modeling component and are challenging to
expand the use or standardize due to unsophisticated theoretical framework.
This dissertation adopted a platform named PMFserv that has been well tested in
the social science and system engineering fields and is particularly built for human
behavior modeling. Silverman, Bharathy, Nye, & Eidelson (2007) have built the
PMFserv framework and its derivatives centered on multi-resolution agent based
approach. While some of these models are specialized in conflict scenario, the agents
themselves are generic in representing human behavior under different context.
PMFserv modeling framework and the software were developed over the past
ten years at the University of Pennsylvania as an architecture to synthesize many best-
of-breed models and best practice theories of human behavior modeling. This
environment also facilitates the codification of alternative theories of factional interaction
and the evaluation of policy alternatives. More information on PMFserv can be found in
(Bharathy & Silverman, 2013; Silverman, Bharathy, Nye, et al., 2007). In Table 2-3, a
summary of the ABM tools observed from the literatures for occupant behavior modeling

60
in the built environment, as well as PMFserv which is used in this dissertation, is
presented.
Table 2-3. Commonly used ABM tools for building occupant behavior modeling and PMFserv
Platform Application domains Programming Language
References
AnyLogic General purpose, also supports discrete event and system dynamics simulations
Java; UML-RT Azar & Menassa, 2012
Brahms General purpose modeling, usually models humans as social and collaborative agents
Brahms language (Java-based)
Kashif et al., 2013
MATLAB Multi-paradigm computing environment, not specifically built for ABM
MATLAB Langevin et al., 2015; Lee & Malkawi, 2014
NetLogo Social and natural sciences, such as economics, physics, biology, psychology, etc.
NetLogo (runs on Java Virtual Machine)
Andrews, Putra, & Brennan, 2013
PMFserv Specifically for human behavior modeling in system engineering and social sciences
Python, with PMFserv GUI
Jia, Srinivasan, Ries, et al., 2017
Repast Social sciences Java, Python, Visual Basic, C++, etc.
Alfakara & Croxford, 2014
obFMU (customized with Functional mock-up unit)
Built for building occupant behavior modeling that complies with the Functional Mock-up Interface standard (FMI)
XML and C Hong, Sun, et al. 2016

61
CHAPTER 3 METHODOLOGY
Overview
In this chapter, the proposed occupant behavior modeling methodology using
Agent-based Modeling (ABM) as well as its performance and integration approach with
building energy simulation engine are discussed. ABM is selected as the occupant
behavior modeling method for this research owing to its high potential to integrate with
energy simulation program directly. While many researchers have been using ABM for
building occupant behavior modeling, there is no collective agreement on the
specifications of modeling process and standard. In Chapter 2, a brief summary was
provided that listed major properties of different models. In particular, the uniqueness of
the entire modeling method that distinguishes this research with other studies are as
follows:
1. The ABM platform used in this research, namely PMFserv, is particularly designed for human behavior modeling. This is the first time such a modeling paradigm is applied to the built environment area. The ABM model takes three major perception types of humans into consideration, in order to provide a more comprehensive view for behavior modeling;
2. Although the idea of co-simulation has been proposed by other researchers, this research uses BCVTB to integrate PMFserv and EnergyPlus™. More importantly, the behavior options reflect the realistic situations for each modeling agent, where other research usually assumed some behavior patterns or changes that are not always practical for building occupants, such as thermostats adjustment, as the thermal condition is normally controlled via central HVAC unit in most of today’s buildings.
3. The case study of the modeling method will be based on an actual building rather than a simulated one, along with actual environment data for validation purpose to enhance the reliability of the model instead of using synthetic data on a pure simulation basis;

62
The objectives (introduced in Chapter 1) of the research will be realized through
the following steps:
First, a virtual occupant behavior model is developed based on the case study
prototype building and the targeted occupants. To fulfill the goal, three complementary
paradigms in the modeling platform are embodied and created according to the reality.
Then, the input and output parameters are identified for the model. Input parameters
include fixed-value ones and the ones being updated at each simulation time step.
Output parameters are the behaviors taken by the occupant at each time step. With
certain input parameters being modified, the behaviors are modeled dynamically, which
can be used for building energy modeling in the later stage.
Second, a co-simulation platform, the BCVTB, is used to integrate PMFserv and
EnregyPlus™. Table 3-1 describes the general input and output of the occupant
behavior model and building energy model when conducting integration experiment.
Table 3-1. Information exchange between ABM and building energy model
Input Output
ABM Environmental conditions; building system status; occupant characteristics
Occupant behavior decisions made at each time-step
Building Energy Model Behavior schedules for each modeled building component
Energy usage; variations in environmental conditions; occupant comfort index
Third, custom-built embedded sensor boards and paper-based surveys are used
to observe “ground truth” to test and validate the occupant behavior model. By collecting
required input data for the occupant behavior model, the simulation model can be fed
with actual data and then generates the simulated results. Afterwards, the observed
status data collected at the same time period of input data are compared with the

63
simulation results, so that the performance of the model can be evaluated in a general
view.
Fourth, a few pertinent scenarios are identified to study the energy impacts of the
developed ABM to building performance simulation using real-world educational
building as a case study. After testing and calibration, the occupant behavior model is
integrated with a building simulation tool to exchange input and output to enable a
dynamic simulation process.
Figure 3-1 shows the overall workflow of the research. In this figure, the
simulated environment and the physical environment form a parallel relationship. In the
simulated environment, virtual models are developed based on the reality. ABM for
occupant behavior belongs to this part. First of all, rule-based modules are created and
attached to the model, along with input (built environment) and output (behavior
schedule) defined for the ABM. Then, relevant data from physical environment are
collected, with one portion used for ABM input, and the other portion for comparison
with ABM output. Finally, the ABM output can be further applied in BEM created in the
building simulation engine (EnergyPlus™) to enable a simulation coupling, for improving
simulation functioning and accuracy. For future studies, it is essential to acquire actual
building performance data (e.g. energy use) for the simulation coupling effect analysis.
In the following sections, the methodology for proposed workflow is presented in detail.

64
Figure 3-1. Research workflow overview

65
Modeling Principles of the Proposed ABM
According to the literature review, the core elements of an ABM consist of a set
of agent(s), an environment, and certain topology and rules that direct how the system
works. In correspondence to the modeling background and context in this research, the
specific projection of ABM structure is shown in Figure 3-2. Although the modeling
scenario in the case study is based on an educational building, the modeling principles
and theories can be extended to any building or occupant types. However, in this
research, the focus is placed on commercial (educational) buildings rather than
residential buildings. Details of the ABM development with the selected platform
PMFserv are discussed in the following sections.
Figure 3-2. Projection of ABM structure to the context of built environment
Occupant Behaviors in Commercial Buildings
From the overview of a standard ABM structure as discussed above, the
proposed ABM is characterized with three major parts. First, the agents in the model are
humans, more specifically representing the building occupants. Humans are rather
complex agents in terms of their attributes and characteristics. It is impossible and,
sometimes, unnecessary and/or overly difficult to capture all of the characteristics. In
this research, the model considers physical perceptions and mental cognitions of

66
individuals as the main features for agents. Meanwhile, emotion, stress, and physiology
status are also included as subtle but useful factors for modeling process.
Second, the environment which agents interact with in the model is aptly
identified. The location where agent stays is within the inside of a building (individual
rooms), which is at the thermal zone- or room- level. The ambient environment is the
direct stimulus or driver that influences the agent’s behavioral decisions. Under the
current model development, other building properties such as room size, location,
orientation, etc., are excluded in the ABM as these do not affect the occupant behavior
for the purposes of this research. Researchers have demonstrated the feasibility and
validity of the assumption (Hong, Sun, et al., 2016; Langevin et al., 2015). In addition,
behavior options of agent in the modeled building is included for adapting to
surrounding environmental conditions.
Lastly, as the built environment states and building component states are set, if
the environment states are out of the acceptable range for the agent, it is expected that
the agent will have the possibility to adjust the state of building components to reach
their individual comfort level. This rule is an explanation of the organizational part
“Plot/Play” according to a scenario frame proposed by (Silverman, Johns, Cornwell, &
O’brien, 2006). However, it should be noted that ambient environment is not the only
external factor that influences human’s behavior in real world. For example, usual time,
economical concerns, and other agents’ impact can also affect the behavior patterns of
building occupant (Azar & Menassa, 2012; Kashif et al., 2013), especially in residential
buildings. Nevertheless, under the scope of this study, the ABM is considered to be

67
reasonable, since in commercial buildings, the dominant trigger of occupant behavior is
one’s physical comfort level, rather than other issues such as energy expense, etc.
Modeling Functions and Rules
The conceptual idea of the ABM, along with its purpose is implemented in
PMFserv. PMFserv is a server of many different Performance Moderator Functions
(PMFs) that have been extracted from the literature. Refer to (Bharathy & Silverman,
2013) for more details on PMFserv. It is also an environment for adding new PMFs and
testing them to see their effect on human behavior and performance. As the first trial of
the tool in a built environment application, this research adopts the internal algorithms
and modeling architecture within the platform. Although not a fully-developed model with
the tool, the occupant behavior model complies with the rules as briefly described in the
following. A more detailed introduction for the main functions is provided in Appendix A,
which is extracted from the tutorial manuals of PMFserv (Silverman, Bharathy, & Nye,
2007a, 2007b; Silverman & Johns, 2007).
Function 1: agent physiology, stress, and coping style
This module stores and maintains the agent’s state of biological systems such as
physical energy level in the format of tank flow, which eventually influence the agent
stress status. The agent’s behavior is bounded by the stress status. This function is the
native property of an agent, which can be used for behavior constraint that leads to
behavior failure with some probabilities. However, in this research, it is considered that
no such failures will happen under the modeling circumstances, according to the
behavior characteristics in the context. Therefore, to emphasize the impact of external
factors to behavior decisions of the modeling agent, the module is not fully expanded for
this research. As a result, values of this function are set to medium to represent a
68
generic form during the simulation process. Some of the screenshot samples are
available in Appendix B for visualization illustration. Users are allowed to scale the tank
value as needed for different modeling objects.
Function 2: agent emotions and value systems
The emotion and value systems function is the major determinant of the agent’s
cognitive appraisal of the environment, which can be measured by composite utility of
the behavior options for the agent. The developers of PMFserv have chosen different
emotion models that contains a number of theories for cognition modeling, while specific
emotion is aroused by an individual’s value system. The value system is characterized
by a Goal, Standard, and Preference (GSP) tree based on utility norm and Bayesian
theorem that defines the agent’s short-term needs, behavior standard, and long-term
preferences of the world. The GSP tree is in a hierarchical structure filled with node of
particular cognition items, each attached with a weight that denotes to the importance of
that item. A sample way PMFserv constructs the tree is provided in Appendix C as
supported information. When building the ABM, it suffices to understand that the
execution of a behavior activates selected leaf node items in the tree, and the values of
these items will be used to calculate the utility of the behavior.
Function 3: agent perception and object affordance
The perception function in PMFserv defines how an agent perceives the objects
and other agents surrounded in the virtual world and thus searches the environment for
a potential action to take that affords the agent in terms of needs satisfaction. In the
modeling environment, all the agents can share the perceptual types ruled by platform
users. When certain objects’ status reaches the satisfactory condition of corresponding
perception types, related actions become “visible” to the agent so that agent is able to
69
decide the “best” action to execute. In this research, the rules that govern the perceptual
types are the focus of the occupant behavior model, as the application of PMFserv to
the built environment area. Customized rules are described in the next chapter as case
study examples to elaborate the specific implementation of this module.
Other optional functions
Besides the major functions above, PMFserv provides sociology module that is
able to model socially-aware agents and groups. For example, this module
characterizes relationships between different agents in the environment and how they
influence each other’s emotions and decisions. However, since the case study scope is
limited to single-occupied offices, this function is not applicable to the occupant behavior
model at the current stage. But for a more comprehensive model for the entire building,
for instance, classrooms and meeting rooms, the model could still be applied and
expanded to a more complex level.
Decision Making Algorithm Based on the Model
The developed model executes the simulation process on a time-step basis (no
particular time restrictions). At each time step, the model outputs the most dominant
behavior that the agent gives priority to. The decision-making algorithm works as
follows:
In general, agent behaviors are determined by two aspects. On one hand, the
agents in this framework are cognitively deep and equipped with values (represented by
the GSP tree). On the other hand, the surrounding environment (represented by P-types
and object) provides the context, which makes physical perceptions available for
consideration. Thus, the agent makes decisions based on a minimum of two sets of
factors, (i.e. Decision Utility as a function of) namely,

70
Values: the factors that an agent employs to evaluate the decision.
Contexts: the factors that are associated with decision choices. The values guide decision choices, and in this case, have been arranged
hierarchically or as a network. The contexts sway the agent decisions by providing
additional and context specific utility to the decisions evaluated. The contexts are
broken up into micro-contexts. Each micro-context just deals with one dimension of the
contexts (for example, relationship between the perceiver and target and so on). With a
given set of values, an agent (or person) evaluates the perceived state of the
environment and the choices it offers under a number of micro-contexts, and appraises
which of its importance weighted values are satisfied or violated. This, in turn activates
emotional arousals, which finally are summed up as utility for behavior decisions. At
each step, the decision of the highest utility calculated is considered as the behavior
that will be taken by the agent (occupant) (Bharathy & Silverman, 2013).
Figure 3-3. Decision making process of agent
The ABM platform adopts a decision making process which combines agent’s
cognition (represented by Values) and perception of the environment (represented by
Contexts) (Figure 3-3). Values and Contexts are instantiated by agent’s cognition and
perception, respectively. In the simulation process, the latter part dominates the output
via updating input environmental variables at each time step. Specifically, thermal,
71
visual, and air quality perceptions are associated with indoor (and indirectly, outdoor
when the window is open) temperature and relative humidity, illumination, and indoor
concentration of CO2, respectively. Meanwhile, the status of the building component at
this step is also automatically updated given the agent’s interactions.
Data Collection and Validation Study of the ABM
Since ABM is a simulation-based modeling approach, verification and validation
is a necessary step to enhance the reliability and robustness of the model. For this
reason, it is significant to collect data in the aspects including indoor/outdoor
environmental parameters, occupant behavior record, and actual building energy use.
The information could be used by feeding real-world ambient conditions data into the
ABM and compare the output to the actual behavior data. By conducting this process,
the performance of the ABM can be assessed and the settings and rules of the ABM
can be tuned accordingly. Moreover, actual data could be used to examine the building
energy model output differences among scenarios such as default settings, simulated
behaviors based settings, and actual behaviors based settings. Finally, it is possible to
explore if the proposed method reduces the gap between modeled and measured
energy use. It is also arguable that unlike data-driven modeling approaches, the data
collection coverage in terms of volumes could be smaller for ABM, as the model is not
developed on the basis of data.
Data Collection
Sensor devices, methods, and parameters for indoor environment monitoring
The data collection for this research includes two parts, namely environmental
data sensing and occupant behavior data record (actual energy use data is not
collected at this stage). The first part was measured by a customized embedded sensor

72
node. The sensor node consists of a smart single-board microcontroller computer with
built-in Wi-Fi function, three separate sensors that record indoor temperature (°C),
relative humidity (%), illumination (lux), and concentration of CO2 (ppm) respectively,
and some peripherals. The specifications of the sensors used are listed in Table 3-2. A
programming script (Appendix D) is written and uploaded to the sensor board to
configure the assembling device and log the environmental data along with time stamp
information. The time stamp of data collection is set to 5 minutes, which could be
modified as needed. All the data are stored in a Micro-SD card that is plugged into the
smart sensor board. One of the advantages of the customized sensor node is its
flexibility, which allows more sensors to be added to the sensor node if necessary, such
as a particulate matter (e.g., PM2.5, PM10) sensor. In addition, online data transmission
is available through Bluetooth or Internet thanks to the built-in communication functions.
In this case, the data file is uploaded to a cloud drive every two hours via Wi-Fi
connection for data extraction. Figure 3-4 shows a sample of the customized sensor
node.
Figure 3-4. Customized smart sensor node

73
Table 3-2. Specifications of environmental sensors
Sensing parameter
Model Voltage Range Accuracy Maximum sampling rate
Temperature DHT22 3 to 5 V -40 to 80°C ±0.5°C 0.5 Hz (every 2 seconds)
Humidity DHT22 Same as above
0 -100% 2-5% Same as above
Carbon Dioxide
K-30 5.5-14 V ±30 ppm ±3 % of measured value
0-10,000 ppm
0.5 Hz
Illumination TSL2591 3.3-5 V 0 - 88,000 Lux 188 uLux 400 kbit/s (Data rates)
Paper-based survey for recording occupant behavior
For behavioral data, a customized survey sheet with behavior options and
corresponding time intervals on a daily basis was developed. The survey was submitted
to and approved by the University’s Institutional Review Board (IRB) prior to conducting
actual survey to collect data (Appendix E). To balance the data precision and to avoid
disturbing occupants, the time interval was set to 15 minutes from 8:00 AM to 5:00 PM
every day, and additional time intervals can be manually added according to actual
schedule. The survey sheet is attached as Appendix F. The monitored occupants were
asked to initialize the starting status of the targeted building components every day, and
then manually make a check mark at the correct box when he/she conducts a behavior
at a certain time, during a long duration stay in the office (more than 15 minutes).
Meanwhile, in one of the test rooms, a commercially available sensor system consisting
of a hub and two magnetic sensors was installed on the door and window, to log their
status with Ethernet connection. Although implemented, this sensor system was used
only for the sole purpose of validating the survey sheet over a period of two days.
Outdoor environmental data
Since the ABM requires outdoor ambient temperature and relative humidity as
model inputs as well, these data were acquired from a local weather report website

74
(Weather Underground). The website provides historical weather data collected by
different weather stations that are spread in the locations of interest. For this study, a
weather station located in the University of Florida campus was used for data extraction.
The temperature and relative humidity data with time information are available for
selected date at the time interval of one hour for 24 hours. The data used for validation
study are then extracted according to the survey time period for matching purpose.
Data collection scale
The coverage of data collection area and duration is determined based on the
case study building, which will be described in detail in Chapter 4. For the purpose of
this study, the scope of the data collection area is limited to one level of the building,
with a corridor of offices located on the west side of the building. Five office rooms were
selected as data collection sample spaces. The time period for relevant data collection
is from two to four weeks in the season of spring. To improve the reliability of the
validation result for the ABM, the data collection scale needs to be expanded with
respect to both space and time period. However, the current setup is considered to be
sufficient to evaluate the general performance of the model, and is also able to draw
preliminary conclusions based on the observed results.
Performance Test of the ABM
Explanation of data use
Since the purpose of the ABM is to explore how occupants interact with building
components under certain environmental conditions, collected ambient data are the
input values for the ABM. Unlike data-driven modeling methodologies, instead of
training a model based on environmental data and behavioral data, the occupant
behavior model is developed from the agent’s perspective. In other words, the model
75
will output the behavioral decisions based on the internal algorithm and user-defined
rules with certain input, with some auxiliary parameters which are fixed values during
the simulation process. The behavioral data is not involved for model development
purpose, but only used for calibration and validation for the ABM. Hence, the use of the
collected data can be summarized in two steps: First, as input parameters for the ABM,
environmental data serves as virtual environment indicator that represents the same
condition the occupant locates in the real world; second, after the ABM outputs the
agent’s decision at each time step, the simulated results are logged to compare with the
actual measured occupant behavior data within the same time period.
Another difference of the ABM from data-driven approach is the requirement on
the accuracy of the environmental data. For data-driven methods, a higher accuracy of
the measured value for each environmental variable is preferred as the data is the
foundation of the model. However, some uncertainty is allowed for the input data of the
ABM, since there will be little influence to the overall model performance by the
uncertainty of the measured data, for the reason that occupants in buildings are not
physically sensitive enough to the ambient environment that varies for a certain amount.
For example, a range of temperature fluctuation will generate the same thermal comfort
level for the occupant, so that the behavioral decision made by the occupant will stay
unchanged.
In Figure 3-5, the dataflow for model testing and validation is shown. It should be
noted that in this research, the validation study is performed at the first stage:
behavioral validation. The second stage denote to energy use validation, which
compares the output from building energy model to measured energy use with similar

76
means. This stage is out of the scope of the dissertation and will be discussed as future
recommendations in Chapter 5.
Figure 3-5. Flow path of validation study
Validation method
The occupant behavior model is developed based on a simulation platform that
uses a robust ABM. Although a few researchers used ABM for occupant behavior (Azar
& Menassa, 2012; Kashif et al., 2013; Lee & Malkawi, 2014), none of these validated
their models using data collected on-site. To prove the applicability of these models,
testing and validating these models using actual data collected on-site is crucial. In
other words, it is necessary to evaluate the performance of the simulation results of the
ABM against actual behavior records. For this purpose, this research adopts a black-
box validation method, i.e., the validation focuses on the final results as compared to
white-box validation method that focuses on the internal mechanism and structure. The

77
reasons for using a black-box validation approach are two-fold: first, Bharathy &
Silverman (2010) conducted white-box validation of the human behavior modeling
platform - PMFserv. Besides, several documentation discussing the technical details of
PMFserv is available and the modeling platform is widely applied to social sciences
research, among others. Therefore, for the purposes of this research, it was deemed
unnecessary to challenge the internal algorithms of how an occupant make decisions
based on their characteristics and surrounding environment. Second, since the goal of
this research is to enhance building energy modeling function by adding another crucial
dimension to the current model, a black-box validation is sufficient to demonstrate its
validity. Specifically, the research aims to incorporate a module providing occupant
behavior information to a building energy model, therefore, the validation can only focus
on whether the output of occupant behavior model reflects the reality, so that adding the
module to a building energy model is reasonable to provide a potential improvement.
Based on the data type and property, four evaluation metrics are used to
compare simulated and actual behavioral data for validation purpose, namely recall,
precision, accuracy, and F1 score. The value span for the four metrics are from 0 to 1.
The definitions of these metrics are easily interpreted using research data used in this
study. It is assumed that the status of “open” for all targeted building components are
positive samples, and “close” are negative samples. Thus, each simulation outcome of
a building component is classified as: a True Positive sample (TP), a False Positive
sample (FP), a True Negative sample (TN), or a False Negative sample (FN). Take
window operation as an example, TP indicates the number of time steps when the ABM
predicts the window is open while actually it is open at that time, and FN is the number
78
when ABM predicts window as close while it is open. Similarly, TN indicates the number
of time steps when the ABM predicts the window is close while it is actually closed, and
FP means when ABM predicts window as open while it is closed in reality. Based on
this classification, detailed indication and formula for the evaluation metrics are as
follows:
1. Recall (equivalent to “True Positive Rate”). It measures the proportion of positives that are correctly identified as such, regardless of how many spurious identifications were made. Recall is calculated as:
Recall = TP/(TP + FN) (3-1)
2. Precision. It measures the proportion of correctly identified positives among all the predicted positives, regardless of whether it failed to retrieve correct items. Precision is calculated as:
Precision = TP/(TP + FP) (3-2)
3. Accuracy. It measures the proportion of correctly identified results among the total number of samples. In other words, it indicates how well a binary classification test correctly identifies or excludes a condition. This is the most straightforward metric on the performance of simulation results. Accuracy is calculated as:
Accuracy = (TP + TN)/(TP + FP + FN + TN) (3-3)
4. F1 score. It is referred as the harmonic average of the precision and recall, which balanced out the tradeoff between precision and recall. F1 score reaches its best value at 1 and worst at 0. F1 score is calculated as:
F1 score = 2TP/(2TP + FP + FN) (3-4)
To conduct the comparison for ABM testing, first, personal and environmental
characteristics of real occupants are fed to the agent and surrounding environment
variables in the ABM. These may include same behavior options, comfortable ranges,
daily occupancy, local environment conditions, etc. Then, the ABM is executed under
the same conditions as the actual world, to obtain the simulated behavior results. The
process repeats at each time step to generate a list of targeted building components
79
status. Meanwhile, the actual behavior data through the field survey is overlaid on the
simulated results from the ABM for the same time period. Essentially, a direct mapping
of simulated and actual data is obtained for analysis. Finally, for each behavior, the four
standard metrics are calculated to measure the simulation performance of the ABM.
This process could also be used to calibrate the ABM from the specific validation
results. The case study results for the validation study are referred in Chapter 4.
Integration of Occupant Behavior Model with EnergyPlus™
Co-simulation Method Development
The development of the occupant behavior model aims to add another critical
dimension to building energy simulation program and has the potential to improve its
overall simulation performance. The goal of this research step is to integrate occupant
behavior model and building energy simulation model in order to dynamically exchange
information between the two simulators and to reflect a more realistic virtual
environment for building energy estimation.
It is a broadly accepted fact that occupants in office buildings may adjust building
components or devices such as windows, lighting switch, doors, and heaters to improve
their working environment in a certain form to satisfy their perceptual comfort
requirements. Thus, the building simulation engine should be able to capture these
behavior changes to better estimate energy use. EnergyPlus™ is selected as the
simulation engine due to its wide applicability and the capabilities of representing
common behavior changes in its internal settings.
The concept of co-simulation meets the research goals above. The
implementation of such a co-simulation framework not only enables an additional
module for building energy simulation, but also accounts for influence brought by
80
building occupants(Langevin, Wen, & Gurian, 2016). The integration process works as
follows. At the starting point of the co-simulation, the building energy model (created in
EnergyPlus™) initializes all the necessary parameters and runs simulation on a time-
step basis. At each time step, EnergyPlus™ calculates the zone-level environmental
conditions and outputs these as well as occupancy information to the occupant behavior
model (ABM created by PMFserv); with the updated information, the agent in the ABM
will perceive the level of comfort and make a decision on what action to take that can
satisfy his/her most urgent comfort needs. The decision outcome generated in the zone
is then transmit back to EnergyPlus™ as the new input, where corresponding schedule
settings are adjusted to reflect the particular behavior change (or stay still), for the
calculation of next time step. This procedure repeats as the two simulators exchange
data at each time step in a loop, until the ends of the simulation period. The entire
process runs automatically through a bridging program, namely BCVTB, with the time
step defined by users based on specific simulation scenarios. BCVTB is a software
environment that allows users to couple different simulation programs for co-simulation,
which is developed by Laurence Berkeley National Laboratory (Lawrence Berkeley
National Laboratory, 2016). This software is developed based on Ptolemy II, particularly
for simulation coupling with EnergyPlus™. Figure 3-6 depicts the inputs and outputs
exchange mechanism in a general view.
As shown in the data exchange diagram, at the EnergyPlus™ interface port,
typical behavioral adaptions must be represented in field settings. It should be noted
that there are more than one parameters in the engine to reflect the common office
behaviors. However, in this dissertation, the following parameters are selected to
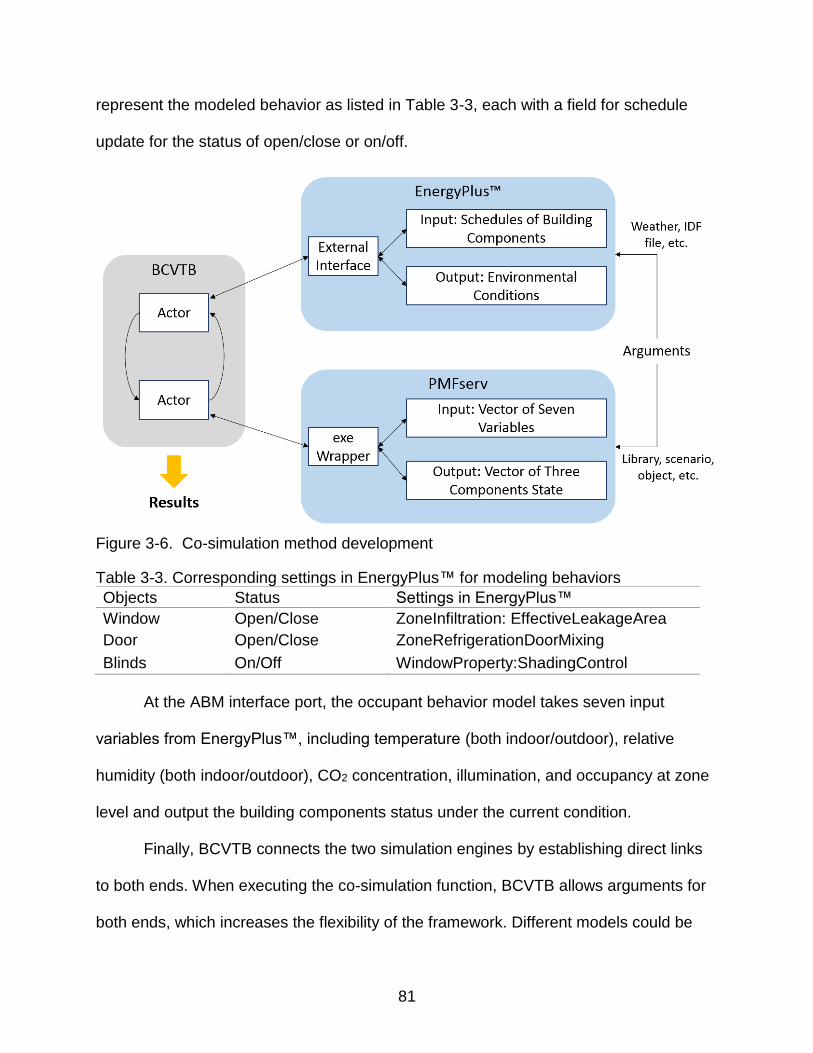
81
represent the modeled behavior as listed in Table 3-3, each with a field for schedule
update for the status of open/close or on/off.
Figure 3-6. Co-simulation method development
Table 3-3. Corresponding settings in EnergyPlus™ for modeling behaviors
Objects Status Settings in EnergyPlus™
Window Open/Close ZoneInfiltration: EffectiveLeakageArea
Door Open/Close ZoneRefrigerationDoorMixing
Blinds On/Off WindowProperty:ShadingControl
At the ABM interface port, the occupant behavior model takes seven input
variables from EnergyPlus™, including temperature (both indoor/outdoor), relative
humidity (both indoor/outdoor), CO2 concentration, illumination, and occupancy at zone
level and output the building components status under the current condition.
Finally, BCVTB connects the two simulation engines by establishing direct links
to both ends. When executing the co-simulation function, BCVTB allows arguments for
both ends, which increases the flexibility of the framework. Different models could be
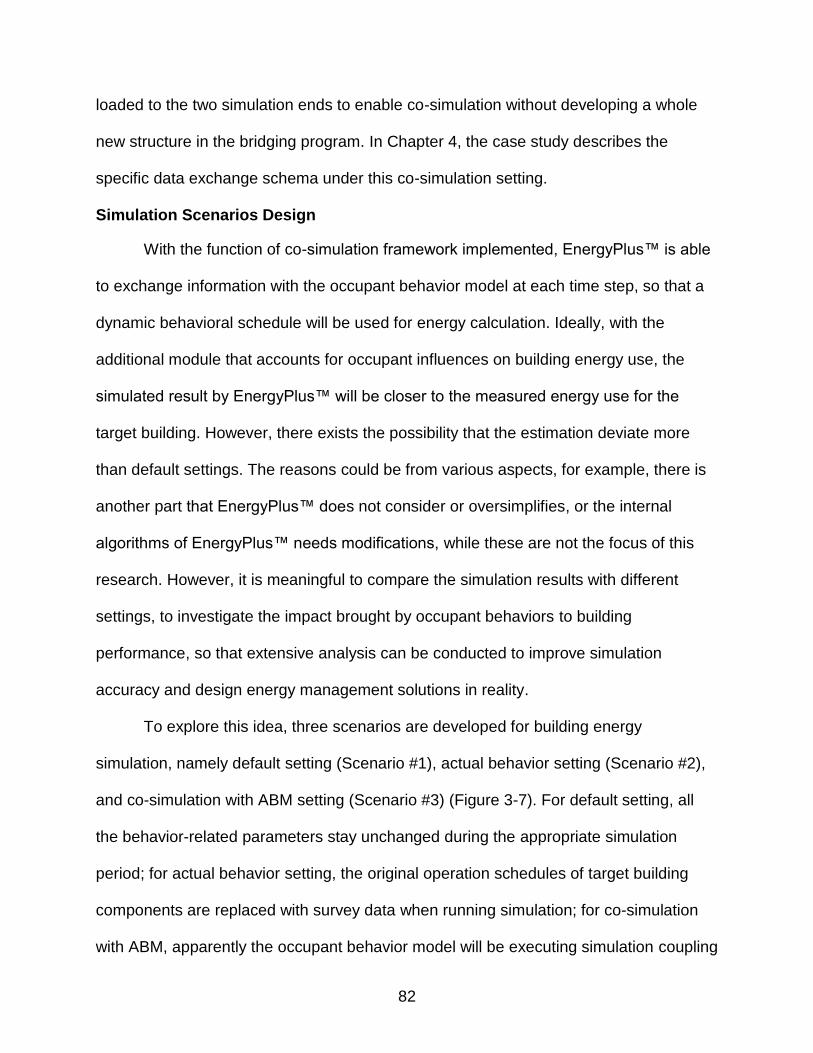
82
loaded to the two simulation ends to enable co-simulation without developing a whole
new structure in the bridging program. In Chapter 4, the case study describes the
specific data exchange schema under this co-simulation setting.
Simulation Scenarios Design
With the function of co-simulation framework implemented, EnergyPlus™ is able
to exchange information with the occupant behavior model at each time step, so that a
dynamic behavioral schedule will be used for energy calculation. Ideally, with the
additional module that accounts for occupant influences on building energy use, the
simulated result by EnergyPlus™ will be closer to the measured energy use for the
target building. However, there exists the possibility that the estimation deviate more
than default settings. The reasons could be from various aspects, for example, there is
another part that EnergyPlus™ does not consider or oversimplifies, or the internal
algorithms of EnergyPlus™ needs modifications, while these are not the focus of this
research. However, it is meaningful to compare the simulation results with different
settings, to investigate the impact brought by occupant behaviors to building
performance, so that extensive analysis can be conducted to improve simulation
accuracy and design energy management solutions in reality.
To explore this idea, three scenarios are developed for building energy
simulation, namely default setting (Scenario #1), actual behavior setting (Scenario #2),
and co-simulation with ABM setting (Scenario #3) (Figure 3-7). For default setting, all
the behavior-related parameters stay unchanged during the appropriate simulation
period; for actual behavior setting, the original operation schedules of target building
components are replaced with survey data when running simulation; for co-simulation
with ABM, apparently the occupant behavior model will be executing simulation coupling

83
simultaneously with EnergyPlus™. One important setting is that the simulation period
should be complying with the survey data collection time period. Besides, the result
comparison will be mainly conducted at the room/zone level where the targeted
occupants in the experiment locate, although the final results will be slightly different at
the whole building level. Moreover, the simulation results of the scenarios above can be
compared with actual building energy use in the future research, on a monthly basis or
based on the availability of measured data. By analyzing the simulation results at both
ends of the two simulators (ABM and BEM), we will gain more insight about how
occupants will react under different environmental conditions and how they cause
energy use variation with different behavioral patterns.
Figure 3-7. Simulation scenarios for building performance analysis

84
CHAPTER 4 CASE STUDY AND RESULTS
Development of ABM based on Actual Building
The ABM platform (PMFserv) provides generic functional modeling modules and
relevant calculation algorithms for decision-making process. However, to develop an
occupant behavior model specifically for built environment context, it requires the
identification of necessary components to model, and the modeling rules design, etc. In
addition, there is no definitive or general model for occupant behaviors in a building.
The development of occupant behavior model must depend on the characteristics of
target building (or rooms) and its occupants. For example, the schedule and activities of
different types of rooms can be different due to their own functionalities; occupants may
or may not have control access to certain building systems. In this research, an
educational building is selected as the case study test bed. As a result, the
development, testing, and application of the occupant behavior model are all based on
the actual conditions of the building, which are introduced in this chapter.
Descriptions of Case Study Building
The case study building is an existing educational building situated in Gainesville,
Florida, USA. This building has three stories with approximately 47,270 ft2 of total gross
floor area, which is comprised of offices, classrooms, laboratories, and some student
facilities. The designed occupancy for the building allows 38 full-time occupants such as
faculties and staffs, and a maximum of 450 total occupants including students, visitors,
etc. The building was built in 2003, and received a LEED Gold certification with diverse
advanced technology building systems. Figure 4-1 shows the appearance of the
building.

85
Figure 4-1. Case study building in 3-D model
The building is supported with steel and the envelope is covered by composite
wall panels of aluminum which enclose exterior insulation and finish systems. The
exterior glazing (including windows, skylights, and external doors) adopts dual low-
emissivity vertical glazing technology for an improved natural lights utilization.
The building has a central HVAC system that contains two air-handling units
(AHU) to serve 54 thermal zones from separate variable air volume (VAV) boxes. AHU
is used to mix outdoor air and returned indoor air and cool or heat the mixed air with
chilled or hot water. VAV boxes then determine the volume of conditioned air according
to different zone size and room temperature, and finally distributed the air via fans and
ducts. A thermal zone usually covers several individual rooms residing to each other.
In this study, the research targets are focused on the third floor of the testbed
building. More specifically, all the rooms on this level are office areas, with a corridor of
16 single-occupancy rooms that are used as university faculty’s offices. These offices
are oriented to the west through their windows. Most of the rooms have a size of 139 or
141 square feet, and are served for full-time occupants. These occupants can control
windows, doors, and window blinds in their private office, but do not have access to

86
HVAC adjustment at room level. In addition, the lighting system is automatically turned
on in each office if occupied through occupancy sensor and actuator, and can be turned
off manually if preferred. A few occupants have personal devices such as heaters or
desk lamps that are used for room condition control.
Occupant Behavior Model Units
Based on the modeling architecture within the ABM platform and the actual
conditions of the testbed building, an occupant behavior model is developed to reflect
how people working in the offices interact with building components. The development
of the model follows the main modules of PMFserv, and is implemented in details with
five parts.
First, the module of agent must be specified. In this case, the department faculty
are the targeted occupants. A prototype of “Professor” is created in the library, which
has native properties such as emotion, physiology, and stress level. The initial values of
these properties are given in default numbers and could be modified to represent
different types of occupants in terms of their internal status, probably due to personal
properties such as age or gender. In this case, “Physiology” level is set to full tank, and
the “Stress” level is set to 50 percent in the model, as an average state of the modeled
agent. This setting is based on the assumption that the simulation process always starts
from the beginning of each day.
Second, the module of objects that agent can directly perceive and interact with
are identified, which can be modeled in hierarchy with multiple items in one object. As
discussed in previous chapter, it is assumed that ambient environment is the major
driver that affects individual’s comfort level and hence his/her behavior decisions.
Therefore, “Built Environment” is created with its attached parameters in this module.

87
Basically, this object comprises of what the agent perceives, i.e., ambient conditions
and what the agent interact with, i.e., building components and their status. Ambient
conditions include environmental parameters such as indoor/outdoor temperature,
relative humidity, level of CO2, illumination, etc. Building component status
encompasses the open/close state of window, door, and window blinds, which will be
associated with behavior decisions later. Other supporting parameters such as
occupancy (room occupied status), comfortable ranges of environmental parameters
are also created for ABM rules definition. A sample screen shot of object “Built
Environment” is shown in Figure 4-2. The values of all the parameters are initialized in
the model, among which occupancy, building component status and six environmental
factors mentioned above are served as model inputs during simulation process, and the
rest are fixed numbers. These fixed numbered parameters are also used as arguments
for the rules definition, and the values of human comfort level are referred from
(Engineering ToolBox, 2001), i.e. maximum comfort level of CO2 (Line 2 of Figure 4-2)
is approximately 1000 ppm for most of the people. Table 4-1 listed the standard
comfortable range of different environmental parameters used in the model.
Table 4-1. Standard comfortable range of environmental parameters
Parameters Unit Value
Temperature (High) Celsius Degree (°C) 26 Temperature (Low) Celsius Degree (°C) 18 Relative Humidity (High) Percentage (%) 60 Relative Humidity (Low) Percentage (%) 25 Carbon Dioxide Concentration Parts per million (ppm) 1000 Illumination (High) Lux (lx) 600 Illumination (Low) Lux (lx) 50
The third step is to define the module of “Goals, Standards, and Preferences”
(GSP) Trees. As mentioned in Chapter 3, this module determines the mental awareness

88
and cognition of the agent. To elaborate, it describes the short-term and long-term goals
and value systems of the agent. For example, safety, economic, and health concerns
are some of the typical items in the tree structure. All the items are following a
hierarchical architecture and are given a weight value to reflect the significance of that
item. These items are selected to be activated when a behavior is conducted in the
simulation process, so that the values of the related items will be used for “Utility”
calculation for decision-making at next time step. In this model, a default structure of
GSP Trees of generic human’s mindset, as well as the weight values for each tree item,
are used in the model after consulting with the platform developers, and the details
could be referred to Appendix G.
Figure 4-2. Screenshot of “Built_Environment” object in PMFserv

89
Next module is the critical component of the ABM, namely Perceptual Types.
This module indicates the agent’s perception towards the surrounding objects, and in
this case, the office space. Previous studies (Yang & Wang, 2013) have shown that in
the context of built environment, there are three primary types of physical perceptions,
namely thermal, visual, and indoor air quality comfort. Therefore, different situations
including a perception type and the state of related building components are created in
this module. For example, the perceptual type of “FreshAirNeeded_Window_Close”
refers to the scenario wherein the window is closed and the CO2 level exceeds a
fraction of the comfort level in the current step. Meanwhile, these perceptual types are
bounded by self-defined perception rules that are programmed with parameters in
object “Built Environment” as input arguments. Appendix H shows the code that define
the custom perception rules for all seven perceptual types. Once the current situation
(building component states and environmental factors) satisfies the threshold of certain
rules, corresponding perceptual types are activated so that the agent will have the
possibility to conduct relevant behaviors. Therefore, each perceptual type is correlated
to at least one behavior, which is the last piece of the modeling units.
The final part of the model is the “Actions” module, which indicates the behavior
options of agent. After a short interview and observation of the targeted rooms, the most
common interactions between occupants and building components lie in operation of
window, door, and window blinds. Therefore, to build a model that is close to the reality,
the ABM incorporates six behavior options which consists of open and close for each
building component. Moreover, as stated before, some occupants may have access to
other miscellaneous devices for environment control. However, to represent a generic
90
behavior model for faculty members, and considering the number of such occupant only
accounts for a small proportion of all the faculty members, behaviors related to these
devices are excluded from the model. With the behavior options being modeled, each
behavior causes a result and returns the outcome to update values in “Built
Environment” object. Besides, a connection between each behavior and corresponding
perceptual types is established, and how the behavior influences the items in GSP
Trees must be defined. These are referred as affordances of the behavior. The
significance of this property is to map environmental factors (model inputs) to behavior
options (model outputs), while the decision-making algorithms calculate the Utility for
each behavior during the simulation process of the ABM.
Discussion of the Model
In PMFserv, the occupant behavior model is saved as a library that comprises of
the five major modules above. To execute the model, one more step is required, that is
to create a simulation scenario in the platform based on the library. The first two
modules, namely agents and objects, can be considered as class which is analogous to
the concept in Object-oriented Programming (OOP). These two classes must be
instantiated in the simulation scenario for modeling execution. Therefore, one or more
instances could be added to the scenario, which increase the flexibility of the model.
One of the benefits of this setting is that the model (library) can be extended to multi-
occupancy rooms. Moreover, it allows combination of various agents and objects with
only one library development. For example, if the ABM is expanded to the whole
building scale, different occupants such as student, staff and building manager can be
created; objects including time, room properties can also be added to the library. Hence,

91
the versatility of the model is improved, which can be applied to any actual sample
rooms at building level.
For ABM execution, at the start of the simulation, all the values in the “Built
Environment” object are initialized. Then, the model runs to output the behavior which
the agent gives priority based on the Utility. If no perception is triggered, the agent will
stay without making any physical status change to window, door, and window blind, i.e.,
with no output at this time step. If there is an output of behavior to a building
component, the status of this component will be updated automatically in the
corresponding parameter of the “Built Environment” object. Following this procedure, at
the beginning of each time step, the values of environmental parameters are updated
with measured data, and the model repeats the calculation process above until the
simulation ends. A list of behavior outcomes can be exported in a Microsoft Excel™ file,
which can be translated into any format that is used for simulation integration or
validation study. Finally, a causal relationship between input data, perception types, and
behavior options is depicted in Figure 4-3.
Figure 4-3. Causal relation between environmental parameters, perception types, and
behavior options

92
Model Testing and Validation Study
With the virtual occupant behavior model being developed, a validation study is
conducted to test the performance of the ABM, in order to extend the use of the model
for application in the next step. The general idea of the testing step is to investigate how
these targeted occupants will react to the changing environment in the offices, and
compare the actual behavior data with simulation outcomes from the ABM under the
same built environment. The setup of the testing approach is for the purpose of
integrating the ABM with building energy simulation engine.
Data Collection Scope and Preprocessing
As mentioned in Chapter 3, the corridor of faculty offices that are oriented to the
west on the third floor of the case study building are used as sample rooms. To avoid
skewness of the sampling data, five faculty offices were further selected with occupants
in different genders and age ranges. Five sets of smart sensor boards and survey
sheets were distributed to the rooms, with overlapped data collection time period. Figure
4-4 shows the third floor plan of the test bed building and selected rooms for data
collection.
Each survey sheet is used to record behavior data for one day. The targeted
occupants were given multiple survey sheets and were requested to complete the
survey sheet voluntarily, preferably on consecutive days. Embedded sensor board were
place near the occupants of this experiment, and were never powered off during the
data collection period.
The data was collected in the spring season when the day/night temperature and
humidity variations are obvious. The data collection process lasted for two to four weeks
depending on the availability of occupants. Considering the average duration which the

93
occupants stayed in the offices, there are approximately 25 to 35 time steps of behavior
records per person each day. For environmental data, the raw data file is in the format
of CSV, with each line consisting of all variable values. A sample of the data is shown in
Appendix I.
Figure 4-4. Selected sample rooms for validation study
Before the final use of the raw behavioral data from the survey, a preprocessing
is conducted to translate the building component status of door, window, and blinds into
numerical values of 0 or 1. Here, it is defined that the status of “close” of any component
corresponds to “0” while “open” corresponds to “1”. Therefore, at each time interval (15
minutes in the survey sheet) when the occupant was in the office, a vector is generated
indicating the current status of door, window, and blinds. For example, [1, 0, 1] means
at that interval, door is opened, window is closed and blinds is opened. This
preprocessing step is completed for each occupant for all the days selected for
validation purpose later. Also, at each time step, the inputs of the ABM were extracted
from the sensor data, and with time information in the datasets, the environmental data
94
at the same time interval with survey results were used to generate the simulated output
in order to have a one-to-one mapping for validation metric calculation.
Results and Analysis of Individuals’ Behavior
The occupants in the experiment are referred by index of A to E as five samples
for results presentation. The actual behavioral data from surveys were compared with
the ABM outputs, and plotted for analysis. Although the developed occupant behavior
model aims to capture a generic behavior of faculty members, the behavioral
differences between these individuals cannot be ignored. In this sub-section, two out of
the five sample occupants who show an obvious discrepancy in behavior patterns are
selected for results explanation.
For occupant A, the simulation result and actual record of behavior for window
blinds operation of a random day are shown in Figure 4-5, as well as the sole
influencing environmental factor fluctuation - indoor illumination. The results indicate
that the initial status of blinds is open at the beginning of the day for the occupant, and
during the most portion of the day, the lighting intensity is either satisfied with the
occupant’s visual comfort level, or slightly lower than that. Therefore, the occupant kept
the blinds open for the most time of the day. Towards the end of the day when the
occupant resided in the office, the illumination level increased significantly, due to the
outside sunlight from the west in the afternoon. The illumination level exceeded the
normal comfortable range intensely, therefore, the occupant chose to close the blinds to
block the direct exposure to the sunlight. It could be seen from the actual status, that the
blinds closing behavior was slightly later than the maximum value state of illumination,
while the simulation results assumed the behavior happened immediately in this
situation. This delaying phenomenon is an interesting finding, and is observed and

95
studied by other researchers. There are many reasons that may cause this condition,
however, the general trend of the simulation result is considered to agree with the actual
record. Last, but not the least, it should be noted that there is a small period in the day
that the occupant was out of the office. The gap in the simulation result reflected this
vacancy since no environmental inputs were used for those particular time steps.
Figure 4-5. Simulation results and survey record for window blinds operation for
occupant A in a selected day, with illumination level showing underneath
In Figure 4-6, the simulation result and actual record of behavior for door
operation of a random day are shown. Unlike window blinds operation, there are three
influencing environmental factors for door operation, namely indoor temperature,
humidity, and CO2 concentration. Figure 4-6 shows the temperature and CO2 fluctuation
only, as the relative humidity variation is relatively stable (with value of around 32%) and
has a very similar trend with temperature change. The results indicate that the initial
status of doors is closed at the beginning of the day for the occupant, and during the
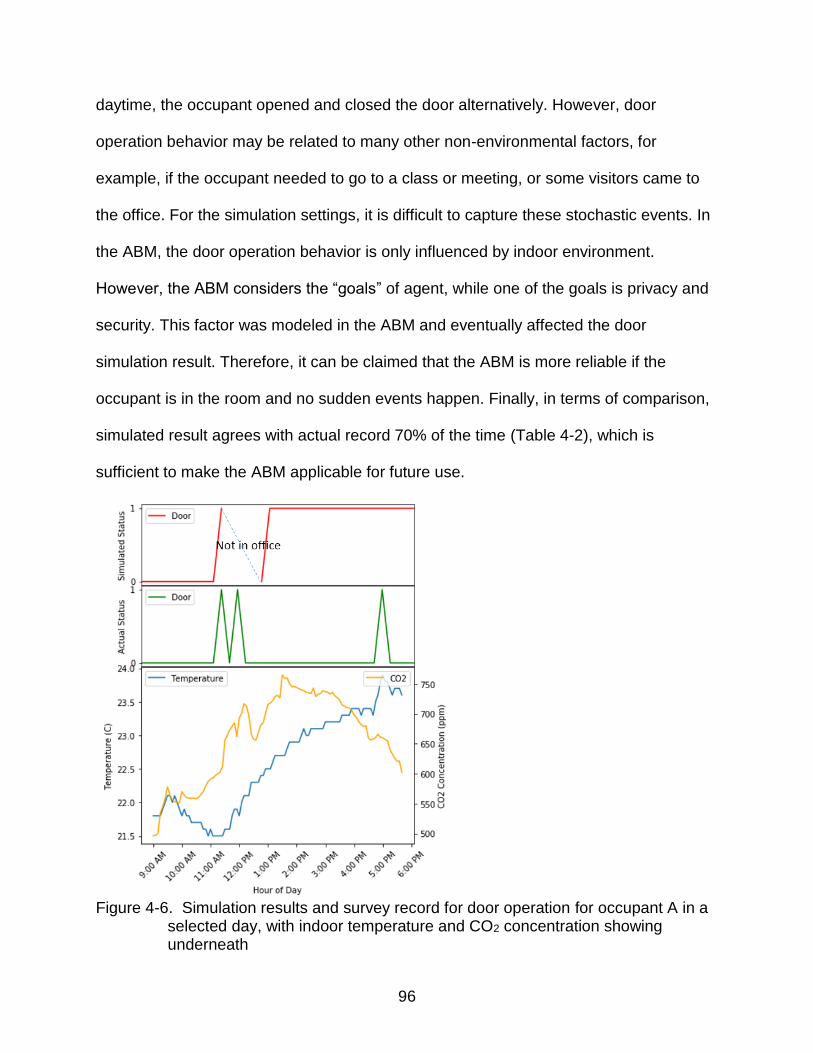
96
daytime, the occupant opened and closed the door alternatively. However, door
operation behavior may be related to many other non-environmental factors, for
example, if the occupant needed to go to a class or meeting, or some visitors came to
the office. For the simulation settings, it is difficult to capture these stochastic events. In
the ABM, the door operation behavior is only influenced by indoor environment.
However, the ABM considers the “goals” of agent, while one of the goals is privacy and
security. This factor was modeled in the ABM and eventually affected the door
simulation result. Therefore, it can be claimed that the ABM is more reliable if the
occupant is in the room and no sudden events happen. Finally, in terms of comparison,
simulated result agrees with actual record 70% of the time (Table 4-2), which is
sufficient to make the ABM applicable for future use.
Figure 4-6. Simulation results and survey record for door operation for occupant A in a
selected day, with indoor temperature and CO2 concentration showing underneath

97
The window opening behavior is influenced by additional environmental
variables, including outdoor temperature and relative humidity. For example, if it is cold
and humid (i.e. rainy) in the daytime, even if the indoor environment is uncomfortable in
some aspects, the occupant may not choose to open the window. In addition, if the CO2
level is higher than the comfortable level, people may feel uncomfortable and would
normally open the window for fresh air. However, in comparison with door operation
behavior, window operation behavior is influenced more by the environmental factors. In
fact, in the test building, window is the only building component for the occupant to
adapt to the thermal conditions, with the HVAC control not accessible in the room.
Figure 4-7 shows the window operation behavior for occupant A in another typical day.
It could be referred from the figure that CO2 level is the major driver of the window
opening behavior for this occupant. For thermal conditions, with the central HVAC,
indoor temperature and humidity maintain on a stable level, while the outdoor
environment has a rather significant change during the day. But since the outdoor
temperature is low, the simulation model assumed that occupant will close the window
for thermal comfort over air quality comfort for most of the time.
In contrast to occupant A, the simulated behavior patterns of occupant B differ
more significantly from actual records. Figure 4-8 shows the window blinds operation
results of a random day for occupant B. As the bottom of the figure shown, the overall
lighting intensity in the room is much lower than the recommended light level (250 lux)
for office work environment (Engineering ToolBox, 2001). However, according to the
survey record, occupant B did not operate on the window blinds for the entire day.

98
Figure 4-7. Simulation results and survey record for window operation for occupant A in
another selected day, with indoor/outdoor temperature and humidity, as well as CO2 concentration showing underneath
The reason could be due to a personal preference range difference of light intensity, or
because of the occupant was using other sources of lighting for visual comfort
adjustment, i.e. a desk lamp (with the sensor uncovered in the lamp area). On the other
aspect, because of the initial illumination level is low, the occupant behavior model
predict an open behavior for the blinds. An interesting phenomena is that around 2:00
pm in the day, although the light level dropped instantly to a very low level, the model
did not output another open behavior. This is because at this time step, the model
output another behavior, such as operation on door or window over blinds, according to

99
the Utility calculation results, which indicates that there are multiple uncomfortable
perceptions felt by the agent at that time period.
Figure 4-8. Simulation results and survey record for window blinds operation for
occupant B in a selected day, with illumination level showing underneath
For behavior to door, simulation results of occupant B can capture a similar trend
as actual record (Figure 4-9), while miss some behaviors at certain time steps. The
reason for this observation is given in the explanation of door behavior for occupant A.
Nevertheless, the differences are that occupant B left the door open at most of the time,
probably due to his personal habit. The door closing behavior periods are comparatively
short, which caused some missing records for the simulation model. From the raw
survey sheets, it is found that the missing data records are infrequent and sporadic and
hence hardly affect the overall simulation results.

100
Figure 4-9. Simulation results and survey record for door operation for occupant B in a
selected day, with indoor temperature, humidity, and CO2 concentration showing underneath
The actual record of window operation behavior for occupant B shows that the
occupant never opens the window no matter how the ambient conditions change during
the day (Figure 4-10). According to the in-situ observation and interview with the
occupant, window operation is not a normal behavior for him, unless some extreme
situations. However, since the ABM only focuses on the environmental impact on
behavior decisions of occupant, the simulated results are fluctuated, mainly based on
the level of CO2 in this case. One of the reasons is that both the indoor and outdoor
thermal conditions are within the comfortable range for most time of the day, which is a
typical day in the spring season at the building located area.

101
Figure 4-10. Simulation results and survey record for window operation for occupant B
in a selected day, with indoor/outdoor temperature and humidity, as well as CO2 concentration showing underneath
Results and Analysis of Overall Performance
Due to the complexity of occupant behaviors, the behavior pattern of each
occupant may be independently different. There are even variations for the same
occupant in different days according to the survey results. Therefore, the virtual model
does not aim to track exactly how people in the built environment will react to certain
ambient conditions. On the contrary, the model is considered to be applicable if the
overall performance reaches an acceptable level, in terms of the evaluation parameters
discussed in Chapter 3. In Table 4-2, a summary of the model performance is
presented. It should be noted that the overall results are not simply the average of all
five occupants, since the sample occupants generate various amounts of time steps

102
due to schedule differences. Instead, the results are obtained by aggregating the data of
all the occupants as a whole datasheet and then calculating the numbers for each
building component. This measure reflects the general performance of the ABM, as the
model aims to represent a generic “faculty” behavior pattern.
Table 4-2. Performance summary of the ABM for the sample occupants
Occupant Building system Recall Precision F1 Score Accuracy
A Blinds 0.98 1.00 0.99 0.98 Door 0.88 0.53 0.66 0.70 Window 0.78 0.83 0.80 0.80 B Blinds N/A 0.00 0.00 0.39 Door 0.93 0.81 0.87 0.79 Window N/A 0.00 0.00 0.67 C Blinds 1.00 1.00 1.00 1.00 Door 0.89 0.38 0.53 0.55 Window N/A 0.00 0.00 0.73 D Blinds 1.00 1.00 1.00 1.00 Door 0.98 0.84 0.90 0.85 Window N/A 0.00 0.00 0.84 E Blinds 0.50 1.00 0.67 0.50 Door 1.00 1.00 1.00 1.00 Window N/A 0.00 0.00 0.79 Overall Blinds 0.82 0.84 0.83 0.74 Door 0.96 0.79 0.87 0.81 Window 0.78 0.35 0.49 0.77
From the table above, it can be seen that for each individual, the model
simulation performance differs in behaviors on the three building components. For
example, for occupant A, blinds operation has the highest accuracy, mostly because of
the fact that the behavior is highly related to environment and not influenced by other
external elements. However, door operation has a relatively low accuracy, while the
reasons were partially explained before. Moreover, door is the most frequently operated
building component that can even be open and closed repeatedly during a 15-minute
time interval. This decreases the probability of door to be accurately tracked in an ABM
model. For recall, or true positive rate, all the three components obtain satisfactory

103
values. In other words, in terms of opening behavior, the ABM can predict fairly well for
this occupant. However, the ABM falsely predict the occupant’s behavior on opening the
door while in reality it is closed for a portion of time steps. It is inferred that either the
occupant has a wider comfortable range, or there are other factors that influence the
behavior even though the indoor environment is out of the comfort level.
Taking occupant B as another example, the simulation results deviate more from
the survey records. Although the door operation behavior has an acceptable
performance, both window and blinds are obtaining a lower accuracy. In the meantime,
the recall is not applicable, and precision value is 0 for this occupant. The reason which
caused the phenomena above is that this occupant reported that he never opens the
window and blinds while in the office. Therefore, as it is assumed that “opening”
behavior is defined as positive outcome, there is no actually positive samples for this
occupant. As a result, true positive and false negative numbers are both 0, which makes
the value of precision 0 and the calculation of recall not applicable. Similarly, the value
of “N/A” and “0” appear in other occupants’ results as well, and they are all attributed to
the same reason.
In the summary statistics, referred as “overall”, behaviors on all the three building
systems achieve a relatively high accuracy (approximately 80%). From the perspective
of black-box validation, it is considered that the ABM can be applied for further use, i.e.
simulation coupling. However, there are still concealed facts to be noticed. Specifically,
for blinds use, most of the occupants kept the component open for better vision from
natural lighting. This increases the positive sample numbers that leads to higher recall
and precision; for door use, although all the parameters show a satisfactory value, the

104
ABM performs much differently between individuals, with some of the reasons
mentioned above; for window use, since most occupants did not open their windows,
the positive outcomes are largely coming from occupant A. In short, the fact that the
sample data of time steps for each individual are slightly different needs to be taken into
consideration when applying the model for other research purposes.
To present the model testing results from a more comprehensive view, Figure 4-
11 illustrates the measured behavior percentages of each occupant during their self-
reported time period. Different behavior patterns can be observed clearly from the
figure. Notice that window opening status is not common for the five occupants, and
blinds operation is also a rare behavior. A clue to this phenomenon may be because of
the data collection season, which is spring with occasional rain during daytimes. Also
these occupants have rather distinguished visual comfort needs. Specifically for
occupant C, a personal heater is presented in the office so that window is not the first
option for indoor environment adjustment.
Figure 4-11. Percentage of five occupants on their actual interactions with building
components during the survey period
0%
10%
20%
30%
40%
50%
60%
70%
80%
90%
100%
Occupant A Occupant B Occupant C Occupant D Occupant E
Door open
Door close
Window open
Window close
Blinds open
Blinds close

105
Figure 4-12 shows the modeled behavior percentages as a comparison to Figure
4-11. Although the base model is applied to all occupants, the simulated behavior
patterns still present an apparent difference, owning to different inputs (ambient
conditions) for the five offices. In addition, the simulated results show a similar
proportion of behaviors to the measured results, demonstrating a good performance of
the occupant behavior model, for all five occupants in the experiment. However, the
simulated results have a rather symmetrical distribution in behavior outputs, especially
for the window opening behavior. The blinds operation behavior is also slightly over-
estimated by the model, but the error rate is much lower. One explanation is that the
ABM places thermal comfort and air quality comfort over visual comfort, which
prioritizes the behavior options related to the first two perceptions.
Figure 4-12. Percentage of five occupants on the simulated interactions with building
components during the survey period
Summary and Discussion
The testing results of the occupant behavior model demonstrate the performance
of the ABM, and thus makes it feasible for simulation coupling application. Before
0%
10%
20%
30%
40%
50%
60%
70%
80%
90%
100%
Occupant A Occupant B Occupant C Occupant D Occupant E
Door open
Door close
Window open
Window close
Blinds open
Blinds close

106
applying the model for further use, some conclusions can be drawn from the model test
study.
To begin with, although the ABM achieved substantial results of comparison
metrics (especially in terms of the overall circumstances), it is not yet a full validated
model. Hence, it is claimed that the model has been tested and verified from the current
sample data, whereas additional validation work is needed to improve the robustness of
the model, both from the result corresponding and model architecture perspectives.
Specifically, more sample data with respect to the data collection time period,
occupants’ numbers and varieties, etc. as well as different validation methodologies are
required for a full validation of the model.
The testing results of individual’s behavior selected two representative samples
(occupant A and B) to evaluate the model performance. Obviously, people have distinct
characteristics, such as perceptual comfortable range, which contribute to different
behavior decisions under certain external conditions. This is also reflected in Table 4-2,
where the ABM performs well for some occupants but achieves lower accuracy for
others. Ideally, each individual should have an independent model, but it is not practical
to create a model separately for each person. Nevertheless, from the other aspect, the
model may perform better if tuned according to target population’s perception
properties, through the methods of survey or quantification analysis, as the comfortable
ranges of the current model are extracted from a general source.
The testing and verification process was conducted under the time periods when
the occupants are present in their offices. In other words, the ABM is executed under
the assumption that the room is occupied by the owner. Therefore, the parameter
107
“occupancy” is added in the “Built Environment” object to reflect the occupancy status in
the modeling space. Currently, the perception rules are set that the agent can perceive
the environment only when occupancy value is non-zero. When coupling with building
energy simulation engine, the occupancy information is available from the default
occupancy schedules and could be output for use in the ABM. More details will be
explained in the simulation experiment section.
The survey records and interview for the occupants in this experiment also show
some interesting facts about how occupant interact with building components in office.
For example, some occupants have a rather stable pattern of behaviors in terms of the
operation on the three building components, regardless of the variation of ambient
environment. As mentioned above, the possible reasons are 1) they are always satisfied
with the ambient environment (which means wider comfortable threshold); 2) other
options exist such as desk lamp (for visual comfort), personal heater (for thermal
comfort) which influence the use of the modeled building components indirectly.
However, the major reason is that environment is not the only driver of occupant
behaviors. Both external and internal factors (e.g. privacy) will affect the behaviors of
occupant, even if the environment is the dominant element. More research should be
conducted to discover the causality of driving factors and behavior decisions at both
individual and group levels.
Finally, it is claimed that the validation work is not limited to demonstrating the
accuracy of the ABM, but also to propose a possible method to associate a virtual
occupant behavior model with the reality. It is argued that the validation approaches
should comply with the future usage of the model. For example, in this research, the

108
ABM aims to integrate with a building energy modeling engine (EnergyPlus™) for
improving simulation functions. Therefore, a stepwise testing was conducted since
EnergyPlus™ is also executing on a time-step basis. In the next section, the simulation
coupling framework is tested, along with the simulation results of the scenarios based
on default schedules and survey-based schedules.
Simulation Experiments
Since one of the most significant aims of this research is to add the “human”
dimension to the current building energy simulation programs, and improve simulation
performance eventually, the last portion for the research is to investigate the integration
capability of the occupant behavior model and existing building simulation engines. With
the validation study of the ABM, the simulation experiments are conducted with the
same test bed building and targeted occupants for results presentation. The building
energy model (BEM) is created using EnergyPlus™. Compare to the other popular tools
for building energy modeling, this program is considered to have broad applicability in
industry and academia, and a variety of parameters settings in the model, which can
reflect typical behavior changes within the program.
Default and Survey-based Settings of Building Energy Model
The virtual model of the test bed building is built with EnergyPlus™ routines.
Basic settings are identical to the actual conditions of the building, and the simulation
period is set to about four weeks in accordance with survey period. Particularly, instead
of using a weather file from the official website of EnergyPlus™ that provides historical
statistic weather information, the weather data used in the simulation experiments is
acquired from (White Box Technologies), where the information contains the realistic
weather information for the designated time duration. In this study, the data covers

109
duration of a full year that consists of two consecutive calendar years (from 2017.5 to
2018.4). The running time step is set in correspondence with the paper-based survey,
namely 15 minutes (4 time steps per hour).
Besides the default settings, another scenario which is based on the survey
results is created for simulation study. To elaborate, the raw results collected from the
survey sheets from five experiment occupants are translated into the schedule format
that is usable by EnergyPlus™. For each occupant, there are three separate schedule
documents created for the targeted building components. In order to eliminate the
warning message from EnergyPlus™ due to input schedule requirement that schedules
must cover a full year, each single document is expanded to 8760 hours. However, the
dates when actual survey results are available are the focus of the study, which will be
taken for simulation results comparison later in the section. Following this manner, for
each occupant, a separate IDF (EnergyPlus™ input file format) file is created with the
building component operation schedules being filled with survey data.
After importing the schedule files in the IDF file, corresponding parameters
information are updated to reflect behavior variations. In Chapter 3, the key variables in
EnergyPlus™ is listed in Table 3-3, and in this case study, specific values for each field
of the variable is shown in Figure 4-13 to 4-15, with a sample of one occupant showing
only. For window opening behavior, new object is created in “ZoneInfiltration:
EffectiveLeakageArea” with the field values (Figure 4-13); for door opening behavior,
new object is created in “ZoneRefrigerationDoorMixing” with the field values (Figure 4-
14); for blinds opening behavior, new object is created in
“WindowProperty:ShadingControl” with the field values (Figure 4-15), and this object is
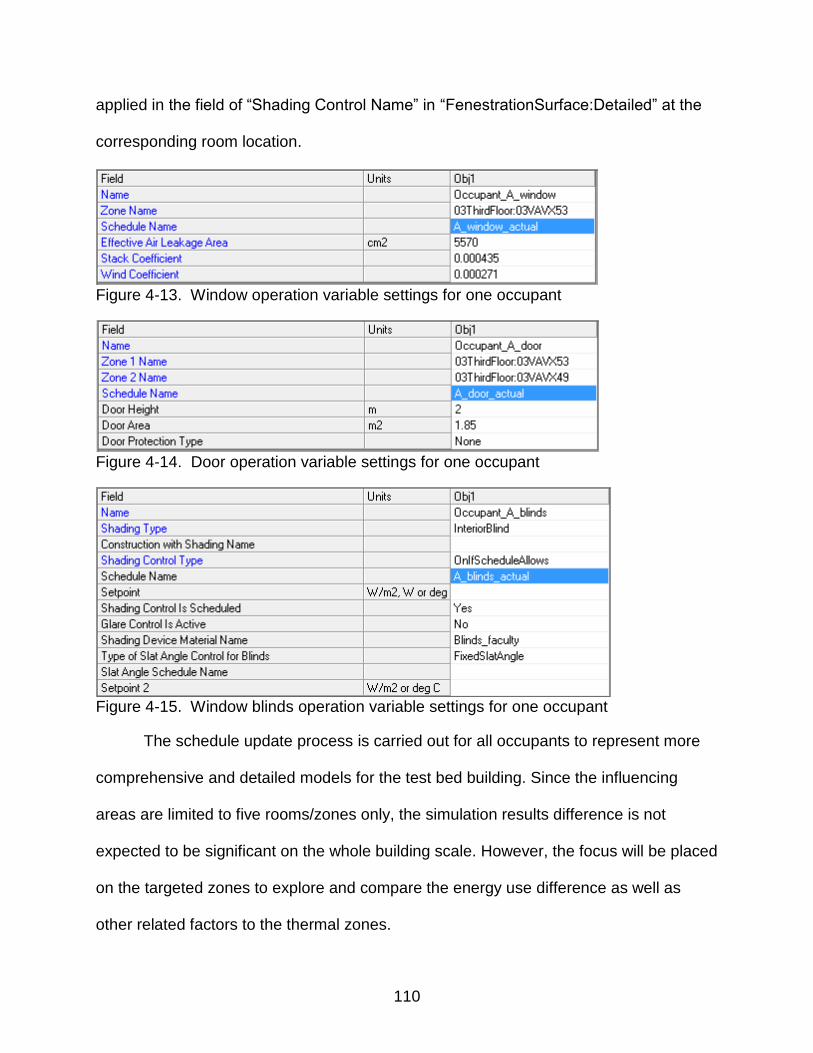
110
applied in the field of “Shading Control Name” in “FenestrationSurface:Detailed” at the
corresponding room location.
Figure 4-13. Window operation variable settings for one occupant
Figure 4-14. Door operation variable settings for one occupant
Figure 4-15. Window blinds operation variable settings for one occupant
The schedule update process is carried out for all occupants to represent more
comprehensive and detailed models for the test bed building. Since the influencing
areas are limited to five rooms/zones only, the simulation results difference is not
expected to be significant on the whole building scale. However, the focus will be placed
on the targeted zones to explore and compare the energy use difference as well as
other related factors to the thermal zones.

111
Co-simulation Data Exchange Schema
With the concept of co-simulation introduced in the previous chapter, this section
describes the implementation steps of the proposed simulation integration method.
First, the variables to be exchanged between two simulation tools are identified.
For the ABM (PMFserv), seven input variables are needed that are output from
EnergyPlus™ at each simulation time step, namely indoor temperature, indoor humidity,
outdoor temperature, outdoor humidity, indoor CO2 level, indoor illumination, and
occupancy. For EnergyPlus™, three variables including status (open/close) of window,
door, and blinds are updated at each time step from ABM.
Second, EnergyPlus™ configuration is done. According to the manual of BCVTB
(Wetter, 2016), to activate the external interface of EnergyPlus™ and enter schedules
to which the external interface writes, particular objects must be created and initiated
with name and values. Details of this configuration is shown in Appendix J. Similar to
the simulation scenario in survey-based case, these schedules coming from the
external interface are used in the same parameter objects that are related to
corresponding building components. In addition, output variables that are exported from
EnergyPlus™ to ABM are declared in the object of “Output: Variable”.
Third, an XML file is created that maps the data to be exchanged between
EnergyPlus™ and PMFserv, and specifies the order of the input/output signal vector. In
Appendix K, a sample code is shown for the XML file that describes the data exchange
mechanism for one occupant. Then, a graphical model (Ptolemy II) must be created in
the BCVTB graphical interface to establish a logical connection for the two simulators.
Some auxiliary modules are also created and connected for input/output format

112
manipulation and real-time results showing during the simulation process, as shown in
Appendix K also.
Finally, PMFserv must be configured to be called by BCVTB. With this being
said, an exe application is developed based on the prototype model and simulation
scenario created in the graphical interface of PMFserv. To comply with the input/output
format with EnergyPlus™, the application is configured to receive the environment and
occupancy data from EnergyPlus™, and feed the values to corresponding parameters
in “Built_Environment” object of PMFserv (Figure 4-2). After the internal calculation for
decision utility of each behavior option, the application will update the status of the three
building components according to the behavior decision at each time step and output a
vector consisting of the current status that returns to EnergyPlus™ for simulation in the
next time step.
After all the configurations are completed, BCVTB can start the co-simulation
process as the manager. The simulation results are assessed from the EnergyPlus™
outputs, and are discussed in the following sub-section.
Application and Results
The simulation experiments not only aims to test the integration function of the
ABM and EnergyPlus™, but also to seek the impact of involving detailed occupant
behaviors in building energy model. Three simulation scenarios are studied in the
experiment, with the implementation approaches introduced above. In short, the
scenarios are referred as default, survey-based, and ABM-based for results
comparison:
Default: no occupant-building interaction schedule is involved.

113
Survey-based: survey results for all occupants are applied to the operation schedules on window, door, and blinds at their situated zones.
ABM-based: co-simulation running with EnergyPlus™ exchanging information with occupant behavior model at each time step.
In particular, there are five IDF files for survey-based and ABM-based scenarios,
with each file representing the behavior update for one occupant. The simulation period
is set from the end of February to end of March in 2018 (28 days). Results are
presented in the following.
Energy use and cooling/heating demand differences
Occupant behaviors influence building performance in various aspects. The
involvement of behavior information directly causes variation on the building side such
as energy use and building system loads. Although the analysis focuses on the zone
level, differences at the building level for some factors can be observed.
Figure 4-16 shows the site energy use (EUI) comparison for the simulation
period, among five occupants’ behavior input, respectively. It can be seen that with the
occupant behavior information involved, even individual’s behaviors cause whole
building energy use variation, in different magnitude and direction. It is noticeable that
simulation period is restricted to approximately a month, therefore the absolute
discrepancy for an annual energy consumption can be larger. Moreover, even though
the adjustment of window, door, and blinds are not direct energy-consuming behaviors,
their impact to total energy use are still considerable according to the simulation results.
Specifically, for survey-based scenario, all the occupants caused a slight increase for
the total energy use, except for occupant A; for ABM-based scenario, the energy use
shows a descending trend. Intuitively, the decreased energy use results can be partially
explained by the window opening behavior, as natural ventilation would lower the

114
overall energy use with the mitigated use of mechanically conditioned air. However, it is
also possible that the outdoor air will increase the HVAC load for maintaining at the set
point, which may compensate the ventilation effect. Hence, more case studies should
be conducted to explore the causality of the energy use and specific occupant
behaviors. In addition, the descending trend of ABM-based scenario indicates that more
energy saving could be achieved if proper energy-efficient occupant behavior is
encouraged, without compromising the occupant comfort level.
Figure 4-16. Energy use intensity comparison at building level
Besides the total energy use variation, the end use distribution also changed in
terms of fuels. In Table 4-3, the end uses differences at building level among three
simulation scenarios are shown. In this table, it can be seen that the ABM-based
scenario shows a larger use of electricity comparing to the other two scenarios. Similar
to the explanation above, as the major contributor of electricity use is the HVAC fans,
and the opening of windows and doors potentially affects the infiltration rate/load, so
that increase occurs in the electricity use. Meanwhile, district cooling and heating uses
decreased in certain amount for ABM-base scenario, probably due to the window
72500
73000
73500
74000
74500
75000
75500
Occupant A Occupant B Occupant C Occupant D Occupant E
Ener
gy U
se In
ten
sity
()k
Wh
Default Survey-based ABM-based

115
operations that have the aid of outside air for a natural temperature adjustment, and the
blinds closing behavior that block the external heat. On the contrary, survey-based
scenario generally deviate less for the three end uses, except for occupant A, who
recorded more window and blinds operation behaviors than others.
Table 4-3. End uses of case study building
End Uses Occupant Default Survey-based ABM-based
Electricity (kWh)
A
30430
30956 31628 B 30431 31624 C 30433 31556 D 30435 31618 E 30430 31562
District Cooling (kWh)
A
23440
23353 22350 B 23440 22334 C 23447 22356 D 23447 22334 E 23447 22335
District Heating (kWh)
A
21013
19029 19653 B 21015 19782 C 21026 19605 D 21027 19809 E 21033 19783
Apart from the comparison at building level, selected parameters at zone level
also show discrepancies. Table 4-4 presents the results of zone level energy-related
parameters. Among these, zone air system sensible heating and cooling energy report
the heating or cooling delivered by the HVAC system to a zone. This does not always
indicate the operation of heating or cooling coils, as outside air can also be supplied for
cooling or heating even if the coils are off (EnergyPlus Documentation, 2015). Results
show that survey-based scenario generate similar trend for cooling energy while
different on the heating energy. This is because most of the time the outside air is
warmer during the simulation period that can contribute to zone heating. For total
internal latent gain energy, although slight deviation is observed, the percentage of

116
difference is subtle in this case. This can be explained by the fact that the behavior
adaptation is not directly consuming energy use and therefore will not influence the
internal gain from people and building equipment in a significant amount.
Table 4-4. Zone level energy-related data
End Uses Occupant Default Survey-based ABM-based
Zone Air System Sensible Heating Energy (kWh)
A 24.46 294.00 136.28 B 12.10 12.02 109.86 C 12.10 14.85 149.44 D 10.98 13.38 111.63 E 10.98 13.32 147.94
Zone Air System Sensible Cooling Energy (kWh)
A 601.48 521.61 519.86 B 352.06 353.99 326.32 C 352.06 355.25 324.83 D 349.98 354.76 332.39 E 349.98 357.34 327.3
Zone Total Internal Latent Gain Energy (kWh)
A 91.98 84.51 85.39 B 40.51 40.52 38.93 C 40.51 40.86 39.75 D 36.02 36.37 35.27 E 36.02 36.41 35.95
Figure 4-17 is the user design load per area based on zone sensible heating for
the HVAC system. The results illustrates that with the behavior information imported,
the calculated design load generally raises, while only the survey-based scenario for
occupant A shows different outcome. Because design load is based on heat balance for
each zone, the behavior on doors apparently influenced the calculated results.
According to the survey records, occupant A shows a more frequent door use in the
survey period, which complies with the results.
Table 4-5 lists some heat gain factors information for the targeted spaces. Due to
the seasonal effect, both survey and ABM-based scenarios shows ascending trend for
HVAC sensible air heating, and descending trend for air cooling. Unexpected results
appear in the window heat addition and infiltration heat addition rows. For window heat

117
addition, the occasionally closed window blinds could be a cause for blocking the heat
energy from the sun outside. For infiltration heat gain, survey-based scenario is showing
a slight decrease for occupant C, D and E. The possibilities may include no opening
window records for the occupants, and infiltration through zones kept stable and
balanced under the same HVAC set point. However, despite how the values of these
factors change, it is clear that the heat gain factors will eventually influence the working
conditions of the entire facility, thus leads to building energy use and built environment
variation under different behavior patterns.
Figure 4-17. HVAC sizing: design load per area
Table 4-5. Building sensible heat gain factors
Heat Gain Scenario A B C D E
HVAC Terminal Unit Sensible Air Heating [GJ]
Default 0.088 0.044 0.044 0.040 0.040 Survey 1.058 0.043 0.053 0.048 0.048 ABM 0.492 0.395 0.316 0.402 0.531
HVAC Terminal Unit Sensible Air Cooling [GJ]
Default -2.165 -1.267 -1.267 -1.260 -1.260 Survey -1.878 -1.274 -1.279 -1.277 -1.286 ABM -1.870 -1.175 -1.206 -1.197 -1.180
Window Heat Addition [GJ]
Default 0.511 0.533 0.533 0.538 0.538 Survey 0.377 0.533 0.436 0.441 0.441 ABM 0.418 0.481 0.488 0.483 0.488
Infiltration Heat Addition [GJ]
Default 0.090 0.059 0.059 0.058 0.058 Survey 0.249 0.059 0.057 0.056 0.056 ABM 0.305 0.312 0.171 0.326 0.241
47.03
56.2
56.2
61.18
61.18
250.51
56.2
59.3
64.6
64.6
44.71
59.3
59.3
64.6
64.6
0 50 100 150 200 250 300
OCCUPANT A
OCCUPANT B
OCCUPANT C
OCCUPANT D
OCCUPANT E
De
sign
Lo
ad p
er
Are
a(W
/m2
)
ABM-based Survey-based Default

118
Occupant comfort level differences
The interactions between occupants and building components also have an
impact on the building occupant side. In Table 4-6, a detailed occupant-related factor is
presented at zone level. From the table, it could be inferred that window opening
behavior dominates the people sensible heat addition in the case study building. For
survey-based scenario, the values remain almost the same for all occupants except
occupant A, who recorded more frequent window opening behavior as stated before.
Furthermore, although the value differences seem subtle, the unit for the factor namely
gigajoule still indicates a considerable volume of heat addition. But from the perspective
of human, whether such amount of heat addition will arouse thermal perception
reflections needs to be studied in the future research.
Table 4-6. People sensible heat addition
People Sensible Heat Addition [GJ] Default Survey-based ABM-based
Occupant A 0.995 1.022 1.019
Occupant B 0.496 0.496 0.499
Occupant C 0.496 0.494 0.493
Occupant D 0.459 0.458 0.462
Occupant E 0.459 0.458 0.461
Another way to understand occupant comfort level is to examine the Predicted
Mean Vote Index (PMV) values within designated time period. PMV stands among one
of the most recognized thermal comfort models that was developed by P.O. Fanger
(Fanger, 1972). Fanger’s equations are used to calculate the mean response of a large
group of people for a combination of thermal and metabolic conditions, according to the
ASHRAE thermal sensation scale, which is a seven-point scale from -3 (cold) to +3
(hot). With the value of “0” being the neutral sense or the most ideal value, ASHRAE
defined a recommended limits for PMV from -0.5 to +0.5 as the comfortable range. In

119
EnergyPlus™, the PMV information is available to extract after declaring the output
variable in the engine, at the user-defined time stamps. In this study, hourly PMV values
are declared for the targeted thermal zones of the building and aggregated for the
simulation period. Table 4-7 summarizes the average PMV values for each experiment
zone where the occupant is situated respectively, for the three simulation scenarios.
Table 4-7. PMV statistics for experiment occupants
Average PMV values Default Survey-based ABM-based
Occupant A -0.879 -0.954 -1.086
Occupant B -0.983 -0.982 -1.182
Occupant C -0.983 -0.979 -1.135
Occupant D -1.013 -1.009 -1.194
Occupant E -1.013 -1.008 -1.179
From the table, all the PMV values are below zero, and are out of the
comfortable range defined by ASHRAE. This complies with the reality that most
permanent occupants on the third floor of the case study building stated a cold indoor
environment in general. However, from the survey-based results, nearly all the PMV
values were slightly closer to the neutral value, which indicates occupant behaviors tend
to adapt to a more comfortable environment. The only exception is occupant A, who
obtained a higher absolute value representing “cold” with the actual behavior inputs.
One of the reasons can be that this occupant’s behavior is not only driven by thermal
comfort, while air quality comfort is possibly the dominant stimuli. Besides, non-
environmental factors can also lead to occupant behaviors on the building components.
Similarly, for all ABM-based scenarios, the PMV values are moving away from the ideal
value. This is mainly because the ABM considers three perceptual types of the agent,
while not limited to the traditional models that only focused on thermal sensation. This
also demonstrates and calls for the necessity to involve different perceptions using ABM

120
for occupant behavior modeling in order to have a thorough representation and
understanding of how occupants interact with building. Aside from the analysis on the
ABM side, other aspects can also be responsible for the results above, for example:
The parameters settings and calculation algorithms for the criteria in EnergyPlus™ does not fully reflect the actual impact of targeted behaviors;
Environment setpoint is out of the range of actual occupant preference, comfortable level based on ASHRAE does not conform to the actual needs of the case study building occupants;
The environmental data simulated by EnergyPlus™ should also be considered as a factor, and must be fully validated for a more improved building performance simulation.
However, although the summary information do not completely meet the
anticipated results, it implies other meaningful information. First, the hypothesis are
demonstrated that occupants and indoor built environment of the space are mutually
influenced. Additionally, the co-simulation functioning was able to accounting for the
dynamic behavioral adaptations with the fluctuation of environmental inputs in the
space.
To provide a more comprehensive view of PMV, Figure 4-18 to 4-20 display the
PMV trends for one of the occupants (occupant A) during the simulation period (672
hours). In fact, for the rest of occupants, the default and survey-based graphs show a
parallel fluctuation with only magnitude differences. While for occupant A, although the
general trend is similar, obvious discrepancy can be observed from certain time
intervals. For example, the extreme value for default scenario almost reach the number
of -3.5, while survey-based scenario tend to have a rather moderate value. The reason
that dragged down the average of PMV in the survey-based scenario is because the
positive numbers have a generally descending tendency. However, a lower positive
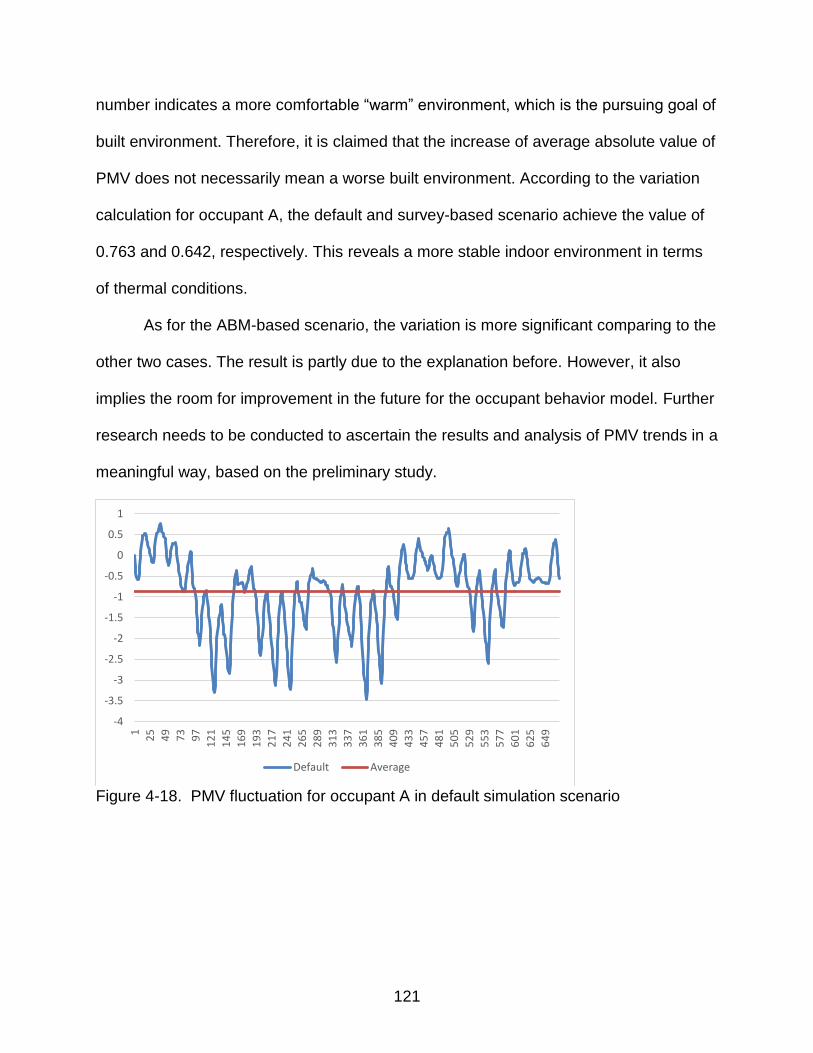
121
number indicates a more comfortable “warm” environment, which is the pursuing goal of
built environment. Therefore, it is claimed that the increase of average absolute value of
PMV does not necessarily mean a worse built environment. According to the variation
calculation for occupant A, the default and survey-based scenario achieve the value of
0.763 and 0.642, respectively. This reveals a more stable indoor environment in terms
of thermal conditions.
As for the ABM-based scenario, the variation is more significant comparing to the
other two cases. The result is partly due to the explanation before. However, it also
implies the room for improvement in the future for the occupant behavior model. Further
research needs to be conducted to ascertain the results and analysis of PMV trends in a
meaningful way, based on the preliminary study.
Figure 4-18. PMV fluctuation for occupant A in default simulation scenario
-4
-3.5
-3
-2.5
-2
-1.5
-1
-0.5
0
0.5
1
1
25
49
73
97
12
1
14
5
16
9
19
3
21
7
24
1
26
5
28
9
31
3
33
7
36
1
38
5
40
9
43
3
45
7
48
1
50
5
52
9
55
3
57
7
60
1
62
5
64
9
Default Average

122
Figure 4-19. PMV fluctuation for occupant A in survey-based simulation scenario
Figure 4-20. PMV fluctuation for occupant A in ABM-based simulation scenario
Summary
The simulation experiment in the section accomplished two research goals. First,
it implemented the simulation coupling idea by enabling a co-simulation framework with
EnergyPlus™ and PMFserv. In other words, the applicability of the novel occupant
behavior model is demonstrated. Second, through the comparison study for different
simulation scenarios, mutual influences of building and occupants are quantified and
-4
-3.5
-3
-2.5
-2
-1.5
-1
-0.5
0
0.5
1
1
25
49
73
97
12
1
14
5
16
9
19
3
21
7
24
1
26
5
28
9
31
3
33
7
36
1
38
5
40
9
43
3
45
7
48
1
50
5
52
9
55
3
57
7
60
1
62
5
64
9
Occupant A_survey Average
-4
-3.5
-3
-2.5
-2
-1.5
-1
-0.5
0
0.5
1
1
25
49
73
97
12
1
14
5
16
9
19
3
21
7
24
1
26
5
28
9
31
3
33
7
36
1
38
5
40
9
43
3
45
7
48
1
50
5
52
9
55
3
57
7
60
1
62
5
64
9
67
3
Occupant A_ABM Average

123
analyzed. The presented results can help building designers and engineers optimize
building’s mechanical or electrical systems, resulting in energy savings and more
comfortable indoor environment.
Future studies may include simulation running period extension, i.e., a whole
calendar year, and probe the seasonal differences among different behavior scenarios.
Sensitivity studies can be performed to delve the relations between pertinent
environment factors, occupant behavior options, and building energy use. The
parameters in EnergyPlus™ that reflect behavioral changes should be revised by
researchers and tool developers to completely capture the actual impact of the
behaviors.
At this stage, the simulation experiment focuses on the functioning improvement
rather than estimation accuracy for building energy simulation. Therefore, the
experiment approaches are not limited to the studied spaces, while can be expanded to
multiple zones or other buildings. The simulation results also suggest a lower energy
use with occupant behavior information inputs for ABM scenario, which promotes
feasible energy conservation solutions through human-in-the-loop building operation.
The capability of accounting for the human side to building performance in a dynamic
manner will benefit all the stakeholders of a building for informed decision-making.

124
CHAPTER 5 DISCUSSION AND CONCLUSIONS
Summary and Conclusions
Occupant behaviors are identified as one of the most influential factors of
building energy use. A deeper understanding of the way occupants interact with building
components not only can optimize system design and energy use during the life cycle of
the building, but also improve occupants’ indoor comfort level. In the design phase of a
building, a solid occupant behavior model that provides information to the building
energy model can improve the simulation performance and potentially reduce the gap
between simulated and actual energy use; in the operation phase, occupant behavior
model can be used for building systems and equipment schedule control for better
services. As an innovative study, this research proposed a framework that combines the
development, testing, and application stages of an occupant behavior model, for the
purpose of gaining insights of how building and its occupants influence each other. A
case study that implemented the framework to a realistic commercial building was
conducted to illustrate the validity and feasibility of the research.
First of all, an agent-based model was developed in the context of built
environment that virtually predicts building occupant’s behavior. This model was built
under the assumption that occupant may adapt to the surrounding environment through
accessible building component for physical comfort adjustment. Three types of physical
comfort (perceptions in the ABM) were considered including thermal, visual, and air
quality comfort. Pertinent built environment parameters such as temperature, relative
humidity, illumination, and CO2 level were used as model inputs. Customized rules were
defined to regulate the decision-making process of the modeling agent at each
125
simulation time step. Moreover, behavior options were provided according to the case
study building while could be modified based on specific conditions if necessary. With a
certain group of input numbers updated at each time step, the model outputs one
behavior that is the first priority for comfort enhancement.
Subsequently, the occupant behavior model was tested with a black-box
validation method, using the data collected by smart sensor nodes and paper-based
survey sheets. In the test bed building, five single-occupied offices were selected to
distribute the data collection combination. Real-time environment data were logged by
sensors for each office and used as input of the occupant behavior model, and the
simulation results were then compared to the survey records which represent the actual
behaviors. The comparison results on both individual and group levels indicate an
acceptable fit on a time-step basis, which verified the theoretical foundation of the
model and showed the validity of using the model for further studies such as integrating
with building energy models.
Finally, a simulation experiment was conducted to seek the mutual impact of the
test bed building and its occupants. In addition, the experiment also served as an
application trial of the occupant behavior model. This experiment adopted EnergyPlus™
– a powerful building performance simulation engine to create a model for the test bed
building, with all the routines involved. Three simulation scenarios were then designed
including the default setting, survey-based setting, and ABM-based setting to execute
the experiment. For survey-based setting, behavior records from the survey sheets
were applied as behavioral inputs for the scenario; for ABM-based setting, a co-
simulation framework was established that exchanges data from the occupant behavior

126
model and building simulation model at each time step. The simulation results were
analyzed in the aspects of energy use, occupant comfortable level, and behavior
change patterns, which quantify the influence to building performance brought by
occupant behaviors.
In summary, this research developed a novel occupant behavior model that was
demonstrated to be practical for providing another crucial dimension to the existing
building simulation models. Through these research initiatives, a new knowledge
system has been supplemented to the domain, and the simulation accuracy and
comprehensiveness of building energy models are generally improved. This research
can be considered as a contribution to building energy efficiency from a life cycle
perspective.
Limitations of the Research
Although this research accomplished the proposed aims in a holistic way,
limitations still exist that should be addressed in the future.
Development Barriers of Occupant Behavior Model
The most significant barrier of this research is that the occupant behavior model
was developed with the emphasis on ambient environment. In other words, it was
assumed that environment is the only stimulant for occupant behaviors, which is
considered as a valid idea by other researchers. However, it has been demonstrated
that many other factors also affect people’s decision of their behaviors. For example,
external factors such as occupant routine, usual time, and room size or locations etc.,
internal factors such as personal background (e.g. comfort range, age, gender),
psychological state, privacy etc. are all contributing to people’s behaviors. Apparently,
the completeness of the model can be advanced by incorporating more relevant factors

127
as the behavior drivers. Nevertheless, from the perspective of engineering study, it may
be unnecessary or redundant to consider every aspect that may influence human
behaviors, since this research does not intend to capture what exactly an occupant will
do, but focuses more on providing additional dimension for building energy modeling. In
addition, as stated by Tabak & de Vries (2010), it is impossible to completely model
occupant behavior, as individuals are too complex and random. With this being said, the
model suffers another limitation that concerns with the randomness of people.
To elaborate, the model only investigated the deterministic relations between the
behaviors and drivers. Stochastic influences should be studied and engaged in the
future model, as people in reality will not act exactly like the programmable agent in
most of the cases. Moreover, some subtle behaviors that are not directly energy-related
were excluded from the model. These behaviors may lead to different heat gains to the
indoor environment, which should not be intentionally ignored. However, these are out
of the scope of the research and could be studied in the future as a follow-up to this
research.
Case Study Scale Limitations
The case study is an instantiating process of the proposed research framework.
It is natural to place limitations to this research. To begin with, the test bed building is a
commercial building, more particularly, an educational building. Offices were the sample
rooms for both validation and simulation studies. The model is not tested in a different
types of building, such as residential buildings or more complex functional buildings. In
fact, occupant behaviors varies significantly in different buildings due to the accessibility
of building components and factors they concern about. Despite the fact that this
128
research is defined in the scope of office buildings, the generality of the model is limited
under the current conditions.
Furthermore, the data collection period is two to four weeks in the season of
spring, while did not cover different climate in a full year. This in turn limited the
simulation experiment running period. However, people may have different preferences
and habits during different seasons, thus leads to different behaviors under similar built
environment. Meanwhile, only five occupants were selected as research samples, which
can be expanded to a larger scale for a more convincing demonstration. Additionally,
the offices are all single-occupied rooms, which means no interactions between multiple
occupants were considered. This, however, has been studied by other researchers as
separate research and can be modeled in the modeling platform in the future.
Last, but not the least, the paper-based survey may cause unexpected error in
the data collection stage. Especially as the time interval was set to 15 minutes for the
survey sheet, it is possible that the occupants conduct multiple behaviors during this
time interval. This problem could be solved by installing smart sensors on the
experiment objects, so that the status can be logged accurately with any time
granularity as needed.
Co-simulation Function
At the current research stage, the co-simulation function was implemented with
the assistance of BCVTB. However, due to the technical constraint, the data exchange
schema was defined at the zone level. Since the ABM is a prototype class, multiple
instances can be created based on the model. Therefore, a hierarchical structure is
needed for a larger scale of simulation that enables a simultaneous running at multi-
zone level.
129
Recommendations for Future Study
This research systematically established a framework from developing and
testing an occupant behavior model in the area of built environment, to the application
of the model. The simulation experiment is a pilot study that lays the foundation to future
studies. It can be concluded that the framework could be used by different stakeholders
including building designers, building owners, and building management staff to
evaluate behavioral changing patterns or plan energy use policies based on potential
building users. Ultimately, the presented framework is aiming to help promote functions
and accuracy of building simulation programs, design behavior interventions, and
develop energy management solutions, etc. However, further studies are required to
realize the future goals. Some of the possible future research directions are suggested
as follows.
The ABM is developed on a rule based platform, which is a simulation approach
of modeling occupant behaviors. As stated in Chapter 2, there is another category of
approaches that are based on behavior-related historical data. It is worthwhile to
compare those typical data-driven methods to the ABM in terms of prediction results
accuracy. Since one of the advantages of data-driven approaches is that it is not
necessary to explore the causality of human and his/her behaviors, one can also
combine these approaches with the ABM which potentially utilizes the benefits of both
methods. A feasible way is to modify the rules that manipulate the agent according to
the statistical inference obtained by collected data. In this way, the need to delve the
causal relationship between behaviors and influencing factors is reduced, and the
randomness of occupant behaviors can be involved by adding probability variables to
the management rules.
130
Since the occupant behavior model was defined in single-occupied offices,
further research could be extended to multi-occupied rooms. Under this circumstance,
the behavior mechanism becomes more complicated as communications between
different occupants influences how they operate building components. Fortunately, the
ABM platform allows the modeling of multiple agents as well as their mutual effects. It is
worthwhile to understand behaviors from individual level to group level as a whole.
Meanwhile, more behavior options such as the ones pertaining to plug loads can be
added and studied as other typical behaviors in office buildings.
With occupant behavior information supplemented to building energy model,
theoretically the simulated energy use result will be closer to reality. Therefore, one can
collect actual energy use data on daily or monthly basis, and compare and contrast the
measured data to simulated result. Especially when the behavioral impact is expanded
from zone level to the whole building level, a comparison on the annual fluctuation for
energy use can assess building performance in a more systematic way.
Finally, the framework can be fed with real-time data to manage building
operation and renovation for an existing building. As behaviors are mostly resulted from
uncomfortable indoor environment, the building systems can start to adjust on/off
schedule in advance to achieve a better balance between building energy efficiency and
occupant comfort enhancement.

131
APPENDIX A DETAILED INTRODUCTION OF PMFserv MAIN FUNCTIONS
Agent Physiology, Stress, and Coping Style
In PMFserv, the physiology module monitors the flows of energy and other
components of the biological systems for PMFServ agents. The results of this system
have an impact on effective-fatigue used in the stress model, which in turn impacts
overall agent stress (Integrated Stress). The Integrated Stress determines the agent’s
coping style, which in turn alters the cognitive and motive capabilities of the agent. If the
agent is sick, hungry (for simplicity sake) or hurt, its cognitive abilities (i.e. perception
and decision making) might be affected. If the agent is dead, unconscious, or in shock,
this will clearly have an effect on its cognitive as well as motive ability. For this research,
it suffices just to know that physiology acts as a constraint on cognitive and motive
abilities and therefore requires modeling.
The agent’s physiology is based around an energy reservoir, or tank. As the
agent’s desired arousal and magnitude of physical exertion change, the agent opens
and closes a valve at the bottom of the tank that releases the energy to be used for
those tanks. The agent is bound by the flow of energy out of the tank. For example, if
the supply of energy in the tank is quite low, the flow out of the tank may not be
sufficient to support a particular energy intensive task.
Event stress comes from the emotion module, and time pressure is derived from
the simulated world. Effective fatigue is driven out of the physiology module that
described before. These all are combined into Integrated Stress. The stress level values
can be moved up and down on the three tanks and finally impacts Integrated Stress, as
defined by user.

132
Agent Emotions and Value Systems
PMFserv has an extensible value system module, the purpose of which is to
primarily output a number of measures of the condition of the agent, including:
How the agent feels about the state of the environment: this is calculated as 11 pairs of oppositely-valenced emotions, with negative emotions summarized into event stress and sent to the Physiology Module. All emotions are summarized into a composite utility (U) measure, or more precisely, Subjective Utility.
Utility to the agent of each of the candidate actions available for the next tick. Or more precisely, the Decision Module makes use of the Emotion Module as a ‘calculator’ to assess the utility of possible actions it might choose to do.
Other Emotion calculator services – various other modules also make use of the Emotion Module to be a calculator for various measures they require (e.g., the Social Module uses it as part of the assessment of how the agent feels about various groups, persons, etc.)
Cognitive appraisal is deciding what the agent feels after interpreting or
explaining what has just happened. In primary appraisal, people consider how the
situation affects the personal well-being (1st bullet above). In secondary appraisal,
people consider how they might cope with the situation (2nd bullet above). In other
words, two things are important for modeling the cognition of agent: whether the event
is interpreted as good or bad, and what the agent believes is the cause of the event.
To implement cognitive appraisal, one needs several ingredients including:
A perception system (covered in the following sub-section)
A value system (represented by GSP Trees) that is used to interpret events
An emotion model that processes the activation and decay of positive and negative ‘arousals’ about how the values have been affected.
A coping or decision module that consults the value-driven emotion model.
The field of cognitive appraisal contains a number of theories and viewpoints. As
a result, there are a number of ways to model it. PMFserv’s implementation relies on

133
best-of-breed models and PMFs based on their pedigree and internal validity. More of
different emotion models’ discussion are available in (Johns & Silverman, 2001;
Silverman et al., 2006) as well as the reasons for choosing to implement the so-called
the Ortony, Clore and Collins emotion model.
PMFserv’s implementation of an agent’s value system (GSP Trees) is based on
multi-attribute utility theory and Bayesian probability mathematics. Utility is the term
from welfare economics that refers to a non-monetary measure of satisfaction one
derives from various goods or situations. Multi-attribute utility simply means that people
have several attributes, or a tree of values, that they care about in any given situation.
Basing the value system trees on Bayesian mathematics means that in practice, one
could derive the value system as a frequency distribution of choices as defined by past
action decisions of a given agent. Thus each branch of the value system tree would
show the importance or prior odds of that value to the individual.
Once the value system of an individual is known, it can drive the emotion model’s
arousals. Thus a universal emotion model is feasible and computationally reasonable if
it is assumed the individual differences arise from the value system and its activations.
One added benefit of the value tree approach is that it is central to an agent’s
personality differences as well. That is, it is quite easy to express any of a number of
best-of-breed motivation theories, personality instruments, and cultural trait models
within a value tree based form. These are not the only source of individual differences,
but they are a vital set to be able to represent and reason with.
134
To produce emotions from values and combine multiple emotions into a utility
estimate, a Goal, Standard, and Preference (GSP) Tree is defined as the structure to
represent the value system of the agents (humans or other beings) where:
Goals: short term needs
Standards: Constraints or standards of behavior (what a person will or won’t do to reach for their long term preferences and short term goals)
Preferences: Long term preferred states of the world -- Likes and Dislikes Any such agent would have richly filled in GSP tree structures and the stopping
rule on filling in GSP trees for any agent is the limit of what behavior is needed from
them in the simulation scenario. Further, GSP trees hold an agent’s previously learned
values or importance weights. Each link of a GSP tree is labeled with a weight, w, and
the sum of child weights always sums to 1.0 for the sake of convenience. These weights
may be thought of as Bayesian prior odds, or the frequency with which the agent favors
that branch of the tree, other things being equal. Finally, each child node can have no
more than one parent.
Agent Perception and Object Affordance
In PMFserv, the perception module permits an agent to monitor the objects and
other agents within the environment and to find out what actions it can do to those
artifacts. The perception is based on “affordances” which is a form of distributing
perceptions so that an agent's knowledge of the environment is formed onto the objects
in the environment rather than into the head of the agent. These knowledge holds ways
to see an object or other agent (Perceptual Types or P-Types), actions that can be
performed upon that object under a given P-Type, and what those actions afford the
agent in terms of filling its needs (i.e., activations for its GSP trees, contributions to its
tanks, and so on). The agent only needs to be aware of its needs, and when it scans the
135
environment for objects it can then pick the one with an action that best satisfies its
need structure (highest utility action choice).
Through this approach, it is no longer required to maintain a “world model” in the
mind of the synthetic agent, which used to mean a constant mapping and updating of
every object/event in the environment to what is in the agent's mind. Through an
affordance-based approach, one can independently markup any environment or third
party videogame world (buildings, resources, other agents, mission/plan objects,
alliance objects, speech act objects, etc.) without having to alter the internals of the
PMFserv agents themselves. The perceptual markups for a PMFserv agent make use
of Gibson’s situated cognition and affordance approach (Gibson, 1979). According to
Gibson (1979), people perceive objects in terms of the possibilities for action they offer,
or afford us.
As indicated earlier, each object’s markup includes its P-types, Actions Afforded,
and Activation levels and type. Unlike the properties such as GSP trees, and physiology
tanks, which are individually dependent, these markups are intended as universals. In
other words, all the agents in the virtual environment treat the object the same way and
get those affordances from taking one action. This setup reduces complexity of objects
and the frame problem. P-types have rules that can be defined by modeler. If the rules
are satisfied, corresponding P-types become visible to the agent so that the actions
associated with the P-types become available to execute.

136
APPENDIX B PMFserv SCREENSHOT SAMPLE
This appendix shows the screenshot of the Stress and Physiology module of
“Agent” in PMFserv. Values can be adjusted accordingly.
Figure B-1. Agent property: Stress module

137
Figure B-2. Agent property: Physiology module

138
APPENDIX C PMFserv SUPPORTED INFORMATION
This appendix shows the screenshot of how PMFserv uses tree items for utility
calculation based on Emotion module.
Figure C-1. Activation of tree items for Utility calculation for decision making

139
APPENDIX D DATA COLLECTION CODE FOR SMART SENSOR
Data Collection Code
#!/usr/bin/python from __future__ import print_function import RPi.GPIO as GPIO import Adafruit_DHT as dht import tsl2591 import timeit from time import sleep import datetime as dt import os GPIO.setmode(GPIO.BOARD) air_quality = 40 temp_humid = 38 sound_on_off = 35 sound_data = 37 sound_clock = 36 GPIO.setup(temp_humid, GPIO.IN) path = '/home/pi/Code/' csv_data_file = path+"Data.csv" data_file = path+"Data.txt" if not os.path.exists(csv_data_file): with open(csv_data_file,'w') as f: f.write("Temp (C), Relative Humidity (%), Illumination (Lux), Timestamp\n") if not os.path.exists(data_file): with open(data_file,'w') as f: f.write("Data Collected every 5 minutes.\n") while True: h,t = dht.read_retry(dht.DHT22, 20) txt = 'Temp={0:0.1f}*C Humidity={1:0.1f}%, '.format(t,h) tsl = tsl2591.Tsl2591() # initialize full, ir = tsl.get_full_luminosity() # read raw values (full spectrum and ir spectrum) lux = tsl.calculate_lux(full, ir) # convert raw values to lux Time = dt.datetime.today() txt += "Illumination = {} lux, Timestamp = {}\n".format(lux, Time) print(txt) with open(data_file, 'a') as f: f.write(txt) with open(csv_data_file,'a') as f:

140
f.write("{},{},{},{}\n".format(t,h,lux,Time)) print("Sleeping for 5 minutes...") sleep(300)
Data File Upload Code
################################ The code is adapted from https://www.raspberrypi.org/forums/viewtopic.php?t=164166 and https://github.com/andreafabrizi/Dropbox-Uploader ################################ import os import subprocess from subprocess import Popen, PIPE #The directory to sync syncdir="/home/pi/ftp/cctv/" #Path to the Dropbox-uploaded shell script uploader = "/home/pi/Dropbox-Uploader/dropbox_uploader.sh" #If 1 then files will be uploaded. Set to 0 for testing upload = 0 #If 1 then don't check to see if the file already exists just upload it, if 0 don't upload if already exists overwrite = 0 #If 1 then crawl sub directories for files to upload recursive = 0 #Delete local file on successfull upload deleteLocal = 0 #Prints indented output def print_output(msg, level): print((" " * level * 2) + msg) #Gets a list of files in a dropbox directory def list_files(path): p = Popen([uploader, "list", path], stdin=PIPE, stdout=PIPE, stderr=PIPE) output = p.communicate()[0].decode("utf-8") fileList = list() lines = output.splitlines() for line in lines: if line.startswith(" [F]"):

141
line = line[5:] line = line[line.index(' ')+1:] fileList.append(line) return fileList #Uploads a single file def upload_file(localPath, remotePath): p = Popen([uploader, "upload", localPath, remotePath], stdin=PIPE, stdout=PIPE, stderr=PIPE) output = p.communicate()[0].decode("utf-8").strip() if output.startswith("> Uploading") and output.endswith("DONE"): return 1 else: return 0 #Uploads files in a directory def upload_files(path, level): fullpath = os.path.join(syncdir,path) print_output("Syncing " + fullpath,level) if not os.path.exists(fullpath): print_output("Path not found: " + path, level) else: #Get a list of file/dir in the path filesAndDirs = os.listdir(fullpath) #Group files and directories files = list() dirs = list() for file in filesAndDirs: filepath = os.path.join(fullpath,file) if os.path.isfile(filepath): files.append(file) if os.path.isdir(filepath): dirs.append(file) print_output(str(len(files)) + " Files, " + str(len(dirs)) + " Directories",level) #If the path contains files and we don't want to override get a list of files in dropbox if len(files) > 0 and overwrite == 0: dfiles = list_files(path)
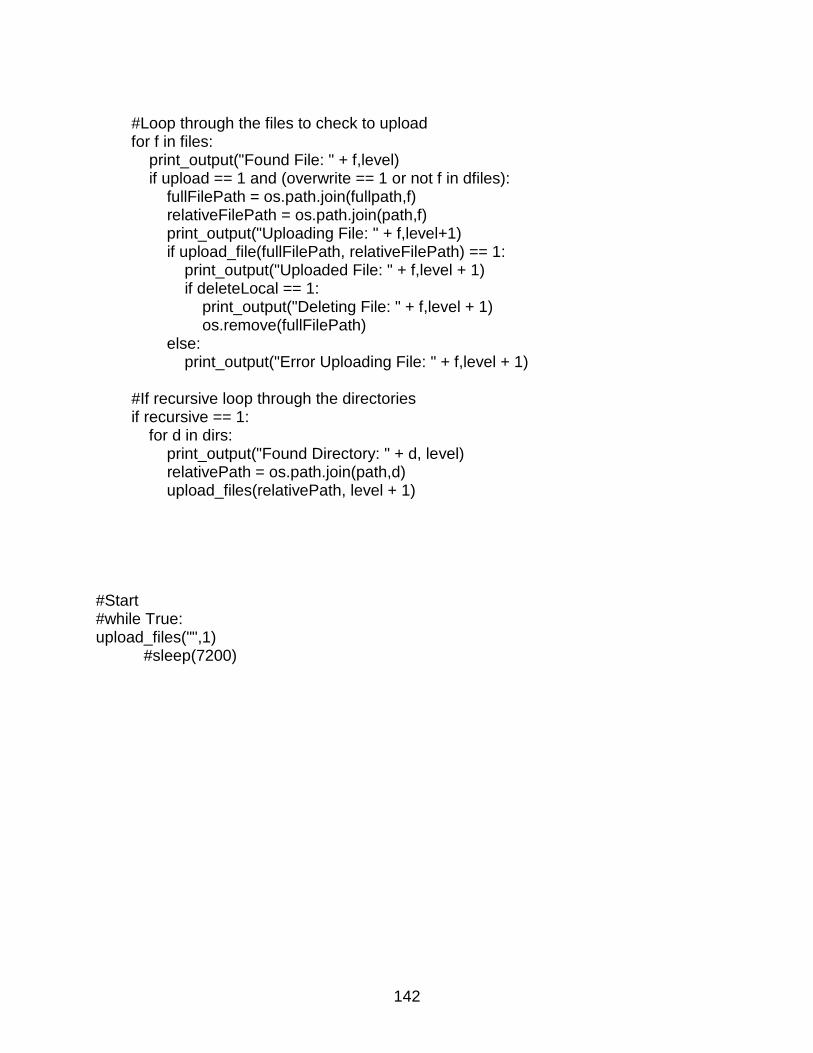
142
#Loop through the files to check to upload for f in files: print_output("Found File: " + f,level) if upload == 1 and (overwrite == 1 or not f in dfiles): fullFilePath = os.path.join(fullpath,f) relativeFilePath = os.path.join(path,f) print_output("Uploading File: " + f,level+1) if upload_file(fullFilePath, relativeFilePath) == 1: print_output("Uploaded File: " + f,level + 1) if deleteLocal == 1: print_output("Deleting File: " + f,level + 1) os.remove(fullFilePath) else: print_output("Error Uploading File: " + f,level + 1) #If recursive loop through the directories if recursive == 1: for d in dirs: print_output("Found Directory: " + d, level) relativePath = os.path.join(path,d) upload_files(relativePath, level + 1) #Start #while True: upload_files("",1) #sleep(7200)

143
APPENDIX E IRB APPROVAL LETTER
Figure E-1. IRB approval letter – Page 1

144
Figure E-2. IRB approval letter – Page 2

145
APPENDIX F BEHAVIORAL RECORD SURVEY SHEET
Figure F-1. Survey sheet for behavior record

146
APPENDIX G DEFAULT GSP TREE ARCHITECTURE
Figure G-1. GSP Tree default architecture - part 1
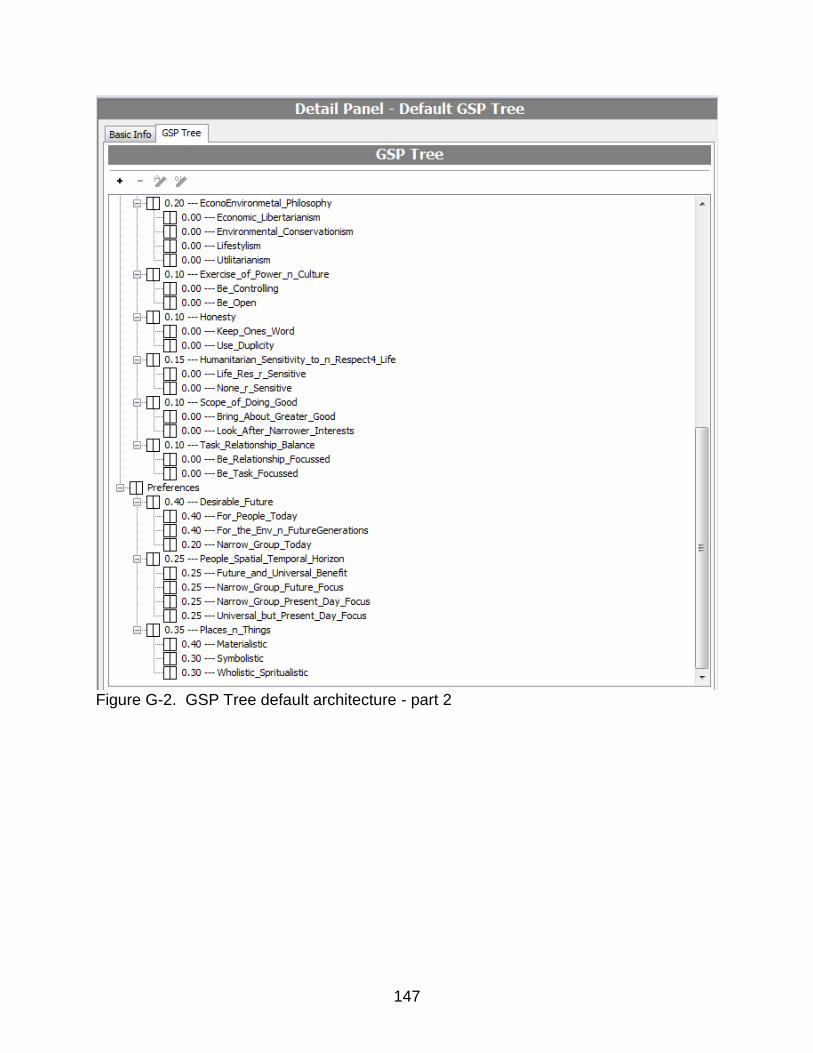
147
Figure G-2. GSP Tree default architecture - part 2

148
APPENDIX H CODE FOR PERCEPTUAL RULES DEFINITION
Figure H-1. Custom rules for blind open due to visual perception

149
Figure H-2. Custom rules for blind close due to visual perception

150
Figure H-3. Custom rules for window or door close under comfortable air quality and
thermal conditions
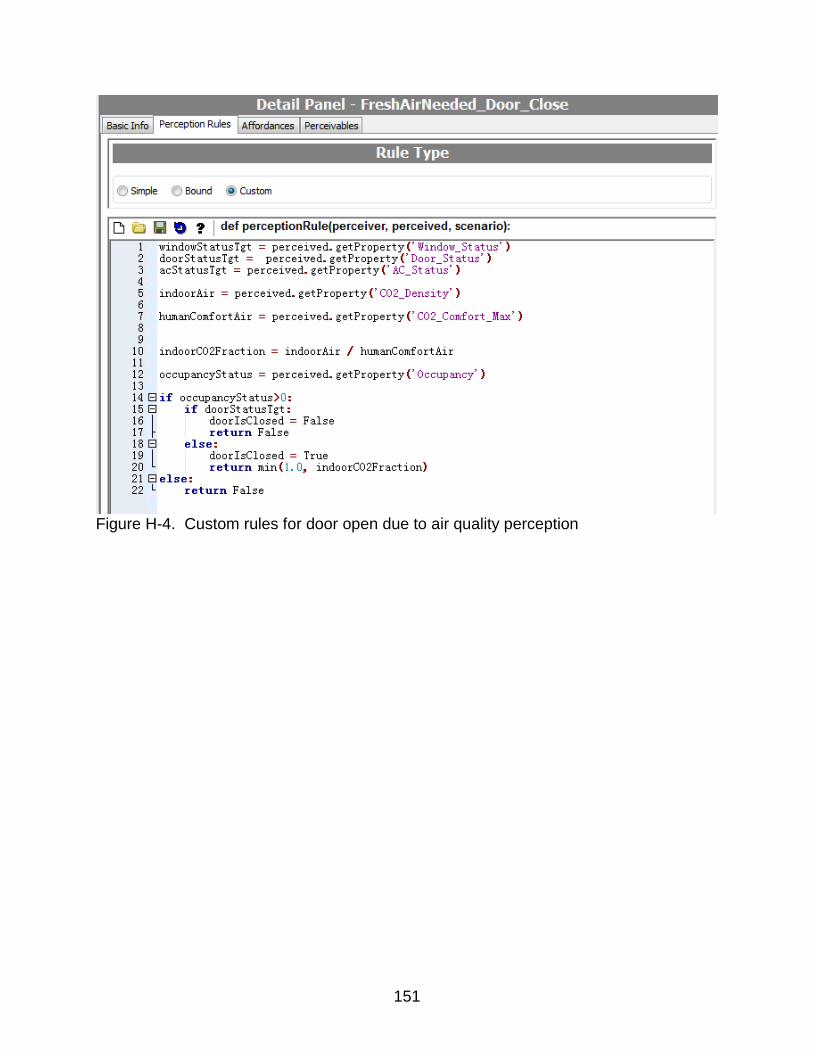
151
Figure H-4. Custom rules for door open due to air quality perception

152
Figure H-5. Custom rules for window open due to visual perception
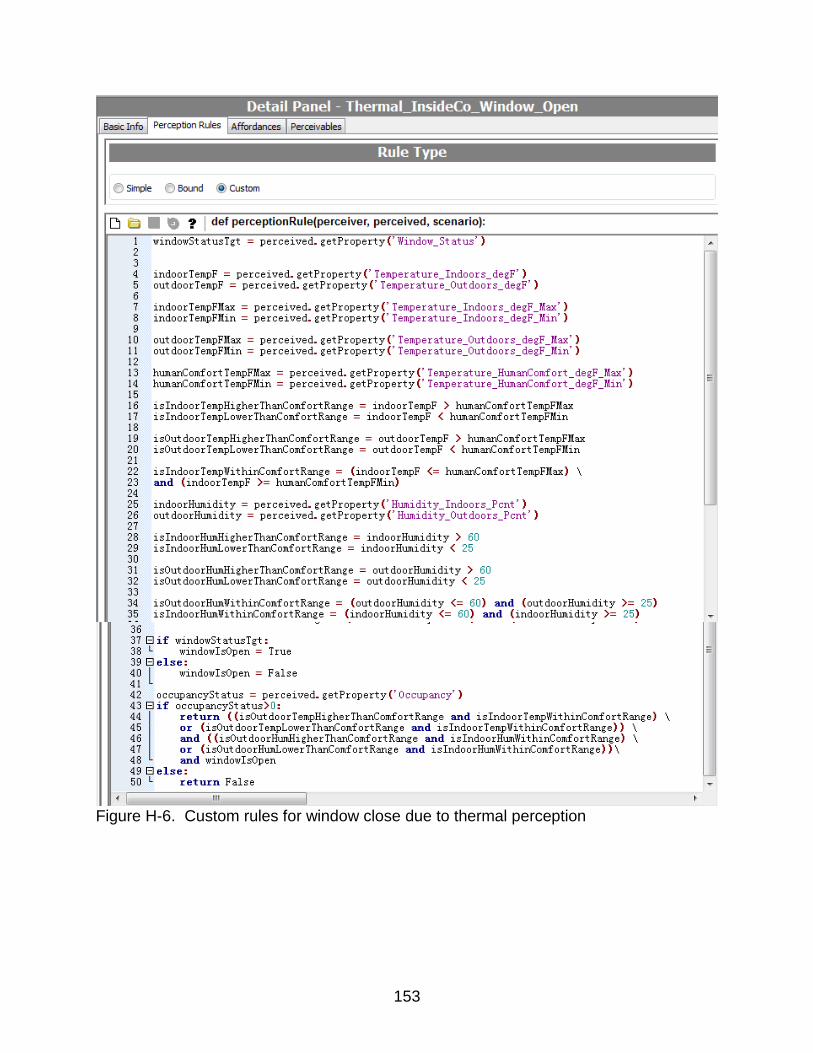
153
Figure H-6. Custom rules for window close due to thermal perception

154
Figure H-7. Custom rules for window open due to thermal perception

155
APPENDIX I SAMPLE DATASHEET FROM SMART SENSOR
This appendix shows an example of the sensor collected data used in this
dissertation.
Table I-1. Sample of sensor collected environmental data
Temp (C) Relative Humidity (%)
Illumination (Lux)
CO2 (ppm)
Timestamp
21.79999924 32.59999847 42.5952 496 2/28/18 9:01
21.79999924 32.70000076 56.304 497 2/28/18 9:06
21.79999924 32.40000153 56.304 500 2/28/18 9:11
21.79999924 32.59999847 74.0928 535 2/28/18 9:16
21.89999962 33.20000076 79.6416 545 2/28/18 9:21
22 33.09999847 64.464 559 2/28/18 9:26
22.10000038 35.90000153 91.8816 578 2/28/18 9:31
22.10000038 33.79999924 91.8816 564 2/28/18 9:37
22 33.20000076 78.1728 557 2/28/18 9:42
22.10000038 33.29999924 79.6416 553 2/28/18 9:47
22 33.29999924 101.5104 552 2/28/18 9:52
21.89999962 33.29999924 111.1392 551 2/28/18 9:57
21.79999924 33.70000076 98.8992 570 2/28/18 10:02
21.89999962 33.79999924 91.8816 564 2/28/18 10:07
21.79999924 34 101.5104 560 2/28/18 10:12
21.79999924 34.20000076 116.688 559 2/28/18 10:17
21.70000076 34.29999924 107.0592 559 2/28/18 10:22
21.70000076 34.5 116.688 559 2/28/18 10:27
21.70000076 34.59999847 135.9456 558 2/28/18 10:32
21.70000076 34.79999924 112.608 561 2/28/18 10:37
21.70000076 34.90000153 101.5104 565 2/28/18 10:42
21.60000038 35.20000076 104.448 570 2/28/18 10:47
21.60000038 35.5 114.0768 580 2/28/18 10:52
21.5 35.59999847 122.2368 587 2/28/18 10:57
21.60000038 35.90000153 120.768 591 2/28/18 11:02

156
APPENDIX J CONFIGURATION OF ENERGYPLUS EXTERNAL INTERFACE
Figure J-1. External Interface activation in EnergyPlus™
Figure J-2. Schedule defining in External Interface for behavior update

157
APPENDIX K BCVTB CONFIGURATION FILE AND SCREENSHOT
Code of variable.cfg file
Figure K-1. XML code for variable settings for data exchange
Figure K-2. Logical connection for the two simulators in BCVTB graphical interface for
co-simulation running
158
LIST OF REFERENCES
Agarwal, Y., Balaji, B., Gupta, R., Lyles, J., Wei, M., & Weng, T. (2010). Occupancy-driven energy management for smart building automation. In Proceedings of the 2nd ACM Workshop on Embedded Sensing Systems for Energy-Efficiency in Building - BuildSys ’10 (p. 1). New York, New York, USA: ACM Press. https://doi.org/10.1145/1878431.1878433
Alfakara, A., & Croxford, B. (2014). Using agent-based modelling to simulate occupants’ behaviours in response to summer overheating. In Proceedings of the Symposium on Simulation for Architecture & Urban Design (p. 13). Society for Computer Simulation International. Retrieved from https://dl.acm.org/citation.cfm?id=2664336
Alhamoud, A., Xu, P., Englert, F., Reinhardt, A., Scholl, P., Boehnstedt, D., & Steinmetz, R. (2015). Extracting Human Behavior Patterns from Appliance-level Power Consumption Data. In European Conference on Wireless Sensor Networks (pp. 52–67). Springer, Cham. https://doi.org/10.1007/978-3-319-15582-1_4
Andersen, R., Fabi, V., Toftum, J., Corgnati, S. P., & Olesen, B. W. (2013). Window opening behaviour modelled from measurements in Danish dwellings. Building and Environment, 69, 101–113. https://doi.org/10.1016/J.BUILDENV.2013.07.005
Andrews, C. J., Putra, H. C., & Brennan, C. (2013). Simulation Modeling of Occupant Behavior in Commercial Buildings. Retrieved from http://rcgb.rutgers.edu/wp-content/uploads/2013/09/EEBHub_ModelingReport_2013.pdf
Azar, E., & Menassa, C. C. (2012). Agent-Based Modeling of Occupants and Their Impact on Energy Use in Commercial Buildings. Journal of Computing in Civil Engineering, 26(4), 506–518. https://doi.org/10.1061/(ASCE)CP.1943-5487.0000158
Baptista, M., Fang, A., Prendinger, H., Prada, R., & Yamaguchi, Y. (2014). Accurate Household Occupant Behavior Modeling Based on Data Mining Techniques. In Proceedings of the Twenty-Eighth AAAI Conference on Artificial Intelligence (pp. 1164–1170). Retrieved from www.aaai.org
Bharathy, G. K., & Silverman, B. (2010). Validating agent based social systems models. In Proceedings of the 2010 Winter Simulation Conference (pp. 441–453). IEEE. https://doi.org/10.1109/WSC.2010.5679142
Bharathy, G. K., & Silverman, B. (2013). Holistically evaluating agent-based social systems models: a case study. SIMULATION, 89(1), 102–135. https://doi.org/10.1177/0037549712446854
Calì, D., Matthes, P., Huchtemann, K., Streblow, R., & Müller, D. (2015). CO2 based occupancy detection algorithm: Experimental analysis and validation for office and residential buildings. Building and Environment, 86, 39–49. https://doi.org/10.1016/J.BUILDENV.2014.12.011

159
Carmenate, T., Rahman, M. M., Leante, D., Bobadilla, L., & Mostafavi, A. (2015). Modeling and analyzing occupant behaviors in building energy analysis using an information space approach. In 2015 IEEE International Conference on Automation Science and Engineering (CASE) (pp. 425–431). IEEE. https://doi.org/10.1109/CoASE.2015.7294116
Chen, J., & Ahn, C. (2014). Assessing occupants’ energy load variation through existing wireless network infrastructure in commercial and educational buildings. Energy and Buildings, 82, 540–549. https://doi.org/10.1016/J.ENBUILD.2014.07.053
Chen, Z., Xu, J., & Soh, Y. C. (2015). Modeling regular occupancy in commercial buildings using stochastic models. Energy and Buildings, 103, 216–223. https://doi.org/10.1016/J.ENBUILD.2015.06.009
Cheung, C. K., Fuller, R. J., & Luther, M. B. (2005). Energy-efficient envelope design for high-rise apartments. Energy and Buildings, 37(1), 37–48. https://doi.org/10.1016/J.ENBUILD.2004.05.002
Clevenger, C. M., & Haymaker, J. (2006). THE IMPACT OF THE BUILDING OCCUPANT ON ENERGY MODELING SIMULATIONS. In Joint International Conference on Computing and Decision Making in Civil and Building Engineering, Montreal, Canada (pp. 1–10).
D’Oca, S., Fabi, V., Corgnati, S. P., & Andersen, R. K. (2014). Effect of thermostat and window opening occupant behavior models on energy use in homes. Building Simulation, 7(6), 683–694. https://doi.org/10.1007/s12273-014-0191-6
D’Oca, S., & Hong, T. (2015). Occupancy schedules learning process through a data mining framework. Energy and Buildings, 88, 395–408. https://doi.org/10.1016/J.ENBUILD.2014.11.065
D’Oca, S., Hong, T., & Langevin, J. (2018). The human dimensions of energy use in buildings: A review. Renewable and Sustainable Energy Reviews, 81, 731–742. https://doi.org/10.1016/J.RSER.2017.08.019
Daniel, L., Soebarto, V., & Williamson, T. (2015). House energy rating schemes and low energy dwellings: The impact of occupant behaviours in Australia. Energy and Buildings, 88, 34–44. https://doi.org/10.1016/J.ENBUILD.2014.11.060
de Wilde, P. (2014). The gap between predicted and measured energy performance of buildings: A framework for investigation. Automation in Construction, 41, 40–49. https://doi.org/10.1016/J.AUTCON.2014.02.009
Dong, B., & Andrews, B. (2009). Sensor-based occupancy behavioral pattern recognition for energy and comfort management in intelligent buildings. In Eleventh International IBPSA Conference (pp. 1444–1451). Retrieved from http://www.ibpsa.org/proceedings/BS2009/BS09_1444_1451.pdf
160
Dong, B., & Lam, K. P. (2011). Building energy and comfort management through occupant behaviour pattern detection based on a large-scale environmental sensor network. Journal of Building Performance Simulation, 4(4), 359–369. https://doi.org/10.1080/19401493.2011.577810
Duan, Y. F., & Dong, B. (2014). The impact of occupancy behavior on energy consumption in low income residential buildings. In Proceedings of the 3rd international high performance building conference at Purdue.
Energy Information Administration. (2015). Annual Energy Outlook 2015. Retrieved November 13, 2018, from https://www.eia.gov/outlooks/aeo/pdf/0383(2015).pdf
EnergyPlus Documentation. (2015). Input Output Reference The Encyclopedic Reference to EnergyPlus Input and Output. Retrieved from https://energyplus.net/sites/default/files/pdfs/pdfs_v8.3.0/InputOutputReference.pdf
Engineering ToolBox. (2001). Tools and Basic Information for Design, Engineering and Construction of Technical Applications. Retrieved November 13, 2018, from www.engineeringtoolbox.com
Erickson, V. L., Carreira-Perpiñán, M. Á., & Cerpa, A. E. (2011). OBSERVE: Occupancy-based system for efficient reduction of HVAC energy. In Proceedings of the 10th ACM/IEEE International Conference on Information Processing in Sensor Networks (pp. 258–269). IEEE.
Erickson, V. L., Lin, Y., Kamthe, A., Brahme, R., Surana, A., Cerpa, A. E., … Narayanan, S. (2009). Energy efficient building environment control strategies using real-time occupancy measurements. In Proceedings of the First ACM Workshop on Embedded Sensing Systems for Energy-Efficiency in Buildings - BuildSys ’09 (p. 19). New York, New York, USA: ACM Press. https://doi.org/10.1145/1810279.1810284
Fabi, V., Andersen, R. V., Corgnati, S., & Olesen, B. W. (2012). Occupants’ window opening behaviour: A literature review of factors influencing occupant behaviour and models. Building and Environment, 58, 188–198. https://doi.org/10.1016/J.BUILDENV.2012.07.009
Fabi, V., Camisassi, V., Causone, F., Corgnati, S., & Andersen, R. (2014). Light switch behaviour: occupant behaviour stochastic models in office buildings. In In: 8th windsor conference;
Fabi, V., Maggiora, V., Corgnati, S. P., & Andersen, R. (2014). Occupants’ behaviour in office building: stochastic models for window opening. In In: 8th windsor conference; Retrieved from http://nceub.org.uk

161
Fabi, V., Vinther Andersen, R., Corgnati, S. P., Olesen, B. W., & Filippi, M. (2011). DESCRIPTION OF OCCUPANT BEHAVIOUR IN BUILDING ENERGY SIMULATION: STATE-OF-ART AND CONCEPTS FOR IMPROVEMENTS 2 3. In Building Simulation Conference (pp. 2882–2889). Sydney. Retrieved from http://www.ibpsa.org/proceedings/BS2011/P_1923.pdf
Fanger, P. O. (1972). Thermal comfort: analysis and applications in environmental engineering,. McGraw-Hill. Retrieved from https://books.google.com/books/about/Thermal_comfort_analysis_and_application.html?id=mUFSAAAAMAAJ
Feng, X., Yan, D., Wang, C., & Sun, H. (2016). A preliminary research on the derivation of typical occupant behavior based on large-scale questionnaire surveys. Energy and Buildings, 117, 332–340. https://doi.org/10.1016/J.ENBUILD.2015.09.055
Gibson, J. J. (1979). The ecological approach to visual perception. Houghton Mifflin. Retrieved from https://books.google.com/books/about/The_Ecological_Approach_to_Visual_Percep.html?id=DrhCCWmJpWUC
Gunay, H. B., O’Brien, W., & Beausoleil-Morrison, I. (2013). A critical review of observation studies, modeling, and simulation of adaptive occupant behaviors in offices. Building and Environment, 70, 31–47. https://doi.org/10.1016/J.BUILDENV.2013.07.020
Haldi, F., & Robinson, D. (2008). On the behaviour and adaptation of office occupants. Building and Environment, 43(12), 2163–2177. https://doi.org/10.1016/J.BUILDENV.2008.01.003
Haldi, F., & Robinson, D. (2011). The impact of occupants’ behaviour on building energy demand. Journal of Building Performance Simulation, 4(4), 323–338. https://doi.org/10.1080/19401493.2011.558213
Hong, T., D’Oca, S., Turner, W. J. N., & Taylor-Lange, S. C. (2015). An ontology to represent energy-related occupant behavior in buildings. Part I: Introduction to the DNAs framework. Building and Environment, 92, 764–777. https://doi.org/10.1016/J.BUILDENV.2015.02.019
Hong, T., & Lin, H.-W. (2012). Occupant Behavior: Impact on Energy Use of Private Offices. In ASim 2012 - 1st Asia conference of International Building Performance Simulation Association. Shanghai. Retrieved from https://www.osti.gov/servlets/purl/1172115
Hong, T., Sun, H., Chen, Y., Taylor-Lange, S. C., & Yan, D. (2016). An occupant behavior modeling tool for co-simulation. Energy and Buildings, 117, 272–281. https://doi.org/10.1016/J.ENBUILD.2015.10.033

162
Hong, T., Taylor-Lange, S. C., D’Oca, S., Yan, D., & Corgnati, S. P. (2016). Advances in research and applications of energy-related occupant behavior in buildings. Energy and Buildings, 116, 694–702. https://doi.org/10.1016/J.ENBUILD.2015.11.052
Jia, M., Srinivasan, R., Ries, R., Bharathy, G., Silverman, B., Weyer, N., & Rinker, M. E. (2017). An Agent-Based Model Approach for Simulating Interactions between Occupants and Building Systems. In Building Simulation Conference (pp. 2407–2413). San Francisco, CA. https://doi.org/10.26868/25222708.2017.673
Jia, M., & Srinivasan, R. S. (2015). Occupant behavior modeling for smart buildings: A critical review of data acquisition technologies and modeling methodologies. In 2015 Winter Simulation Conference (WSC) (pp. 3345–3355). IEEE. https://doi.org/10.1109/WSC.2015.7408496
Jia, M., Srinivasan, R. S., & Raheem, A. A. (2017). From occupancy to occupant behavior: An analytical survey of data acquisition technologies, modeling methodologies and simulation coupling mechanisms for building energy efficiency. Renewable and Sustainable Energy Reviews, 68, 525–540. https://doi.org/10.1016/J.RSER.2016.10.011
Jia, M., Srinivasan, R. S., Ries, R., & Bharathy, G. K. (2018). A Framework of Occupant Behavior Modeling and Data Sensing for Improving Building Energy Simulation. In Symposium on Simulation for Architecture and Urban Design (pp. 153–160). Delft, the Netherlands. Retrieved from https://www.researchgate.net/publication/328415670
Johns, M., & Silverman, B. G. (2001). How Emotions and Personality Effect the Utility of Alternative Decisions: A Terrorist Target Selection Case Study. In Proceedings of the Tenth Conference on Computer Generated Forces and Behavioral Representation (pp. 55–64). Norfolk, Virginia. Retrieved from https://www.seas.upenn.edu/~barryg/emotion.pdf
Kashif, A., Ploix, S., Dugdale, J., & Le, X. H. B. (2013). Simulating the dynamics of occupant behaviour for power management in residential buildings. Energy and Buildings, 56, 85–93. https://doi.org/10.1016/J.ENBUILD.2012.09.042
Kavulya, G., & Becerik-Gerber, B. (2012). Understanding the Influence of Occupant Behavior on Energy Consumption Patterns in Commercial Buildings. In Computing in Civil Engineering (2012) (pp. 569–576). Reston, VA: American Society of Civil Engineers. https://doi.org/10.1061/9780784412343.0072
Klein, L., Kwak, J., Kavulya, G., Jazizadeh, F., Becerik-Gerber, B., Varakantham, P., & Tambe, M. (2012). Coordinating occupant behavior for building energy and comfort management using multi-agent systems. Automation in Construction, 22, 525–536. https://doi.org/10.1016/J.AUTCON.2011.11.012

163
Lam, K. P., Höynck, M., Dong, B., Andrews, B., Chiou, Y.-S., Zhang, R., … Choi, J. (2009). OCCUPANCY DETECTION THROUGH AN EXTENSIVE ENVIRONMENTAL SENSOR NETWORK IN AN OPEN-PLAN OFFICE BUILDING. In Eleventh International IBPSA Conference (pp. 1452–1459). Glasgow. Retrieved from http://citeseerx.ist.psu.edu/viewdoc/download?doi=10.1.1.299.1347&rep=rep1&type=pdf
Langevin, J., Wen, J., & Gurian, P. L. (2015). Simulating the human-building interaction: Development and validation of an agent-based model of office occupant behaviors. Building and Environment, 88, 27–45. https://doi.org/10.1016/J.BUILDENV.2014.11.037
Langevin, J., Wen, J., & Gurian, P. L. (2016). Quantifying the human–building interaction: Considering the active, adaptive occupant in building performance simulation. Energy and Buildings, 117, 372–386. https://doi.org/10.1016/J.ENBUILD.2015.09.026
Lawrence Berkeley National Laboratory. (2016). Building Controls Virtual Test Bed. Retrieved November 13, 2018, from https://simulationresearch.lbl.gov/bcvtb/FrontPage
Lee, C., Tong, J., & Cheng, V. (2014). Occupant Behavior in Building Design and Operation. In HK Joint Symposium 2014. Hong Kong.
Lee, Y. S., & Malkawi, A. M. (2014). Simulating multiple occupant behaviors in buildings: An agent-based modeling approach. Energy and Buildings, 69, 407–416. https://doi.org/10.1016/J.ENBUILD.2013.11.020
Li, N., Calis, G., & Becerik-Gerber, B. (2012). Measuring and monitoring occupancy with an RFID based system for demand-driven HVAC operations. Automation in Construction, 24, 89–99. https://doi.org/10.1016/J.AUTCON.2012.02.013
Li, N., Li, J., Fan, R., & Jia, H. (2015). Probability of occupant operation of windows during transition seasons in office buildings. Renewable Energy, 73, 84–91. https://doi.org/10.1016/J.RENENE.2014.05.065
Liao, C., Lin, Y., & Barooah, P. (2012). Agent-based and graphical modelling of building occupancy. Journal of Building Performance Simulation, 5(1), 5–25. https://doi.org/10.1080/19401493.2010.531143
Macal, C. M., & North, M. J. (2010). Tutorial on agent-based modelling and simulation. Journal of Simulation, 4(3), 151–162. https://doi.org/10.1057/jos.2010.3
Macal, C., & North, M. (2014). Introductory tutorial: Agent-based modeling and simulation. In Proceedings of the Winter Simulation Conference 2014 (pp. 6–20). IEEE. https://doi.org/10.1109/WSC.2014.7019874
164
Mahdavi, A., & Pröglhöf, C. (2009). USER BEHAVIOR AND ENERGY PERFORMANCE IN BUILDINGS. In Internationalen Energiewirtschaftstagung an der TU Wien . Retrieved from www.bpi.tuwien.ac.at
Mahdavi, A., & Tahmasebi, F. (2015). Predicting people’s presence in buildings: An empirically based model performance analysis. Energy and Buildings, 86, 349–355. https://doi.org/10.1016/J.ENBUILD.2014.10.027
Masoso, O. T., & Grobler, L. J. (2010). The dark side of occupants’ behaviour on building energy use. Energy and Buildings, 42(2), 173–177. https://doi.org/10.1016/J.ENBUILD.2009.08.009
Masoudifar, N., Hammad, A., & Rezaee, M. (2014). Monitoring occupancy and office equipment energy consumption using real-time location system and wireless energy meters. In Proceedings of the Winter Simulation Conference 2014 (pp. 1108–1119). IEEE. https://doi.org/10.1109/WSC.2014.7019969
Nasir, N., Palani, K., Chugh, A., Prakash, V. C., Arote, U., Krishnan, A. P., & Ramamritham, K. (2015). Fusing Sensors for Occupancy Sensing in Smart Buildings. In International Conference on Distributed Computing and Internet Technology (pp. 73–92). Springer, Cham. https://doi.org/10.1007/978-3-319-14977-6_5
Nguyen, T. A., & Aiello, M. (2013). Energy intelligent buildings based on user activity: A survey. Energy and Buildings, 56, 244–257. https://doi.org/10.1016/J.ENBUILD.2012.09.005
Papadopoulos, S., & Azar, E. (2016). Integrating building performance simulation in agent-based modeling using regression surrogate models: A novel human-in-the-loop energy modeling approach. Energy and Buildings, 128, 214–223. https://doi.org/10.1016/J.ENBUILD.2016.06.079
Peng, C., Yan, D., Wu, R., Wang, C., Zhou, X., & Jiang, Y. (2012). Quantitative description and simulation of human behavior in residential buildings. Building Simulation, 5(2), 85–94. https://doi.org/10.1007/s12273-011-0049-0
Putra, H. C., Andrews, C. J., & Senick, J. A. (2017). An agent-based model of building occupant behavior during load shedding. Building Simulation, 10(6), 845–859. https://doi.org/10.1007/s12273-017-0384-x
Rafsanjani, H., Ahn, C., Alahmad, M., Rafsanjani, H. N., Ahn, C. R., & Alahmad, M. (2015). A Review of Approaches for Sensing, Understanding, and Improving Occupancy-Related Energy-Use Behaviors in Commercial Buildings. Energies, 8(10), 10996–11029. https://doi.org/10.3390/en81010996

165
Santin, O. G., Itard, L., & Visscher, H. (2009). The effect of occupancy and building characteristics on energy use for space and water heating in Dutch residential stock. Energy and Buildings, 41(11), 1223–1232. https://doi.org/10.1016/J.ENBUILD.2009.07.002
Silverman, B. G., Bharathy, G., & Nye, B. (2007a). PMFserv Training Manual Tutorial – I: Agent Physiology, Stress, and Coping Style.
Silverman, B. G., Bharathy, G., & Nye, B. (2007b). PMFserv Training Manual Tutorial – III: Agent Perception and Object Affordance.
Silverman, B. G., Bharathy, G., Nye, B., & Eidelson, R. J. (2007). Modeling factions for “effects based operations”: part I—leaders and followers. Computational and Mathematical Organization Theory, 13(4), 379–406. https://doi.org/10.1007/s10588-007-9017-8
Silverman, B. G., & Johns, M. (2007). PMFserv Training Manual Tutorial – II: Agent Emotions and Value Systems.
Silverman, B. G., Johns, M., Cornwell, J., & O’brien, K. (2006). Human Behavior Models for Agents in Simulators and Games: Part I: Enabling Science with PMFserv. Presence: Teleoperators and Virtual Environments (Vol. 15). https://doi.org/10.1162/pres.2006.15.2.139
Stazi, F., Naspi, F., & D’Orazio, M. (2017). A literature review on driving factors and contextual events influencing occupants’ behaviours in buildings. Building and Environment, 118, 40–66. https://doi.org/10.1016/J.BUILDENV.2017.03.021
Tabak, V., & de Vries, B. (2010). Methods for the prediction of intermediate activities by office occupants. Building and Environment, 45(6), 1366–1372. https://doi.org/10.1016/J.BUILDENV.2009.11.018
Turner, C., & Frankel, M. (2008). Energy Performance of LEED ® for New Construction Buildings. Retrieved from www.newbuildings.org
Virote, J., & Neves-Silva, R. (2012). Stochastic models for building energy prediction based on occupant behavior assessment. Energy and Buildings, 53, 183–193. https://doi.org/10.1016/J.ENBUILD.2012.06.001
Wang, L., & Greenberg, S. (2015). Window operation and impacts on building energy consumption. Energy and Buildings, 92, 313–321. https://doi.org/10.1016/J.ENBUILD.2015.01.060
Weather Underground. Historical Weather. Retrieved November 13, 2018, from https://www.wunderground.com/history/

166
Wetter, M. (2016). Building Controls Virtual Test Bed. Retrieved November 14, 2018, from https://simulationresearch.lbl.gov/bcvtb/releases/latest/doc/manual/index.xhtml
White Box Technologies. Weather Data for Energy Calculations. Retrieved November 14, 2018, from weather.whiteboxtechnologies.com
Yan, D., O’Brien, W., Hong, T., Feng, X., Burak Gunay, H., Tahmasebi, F., & Mahdavi, A. (2015). Occupant behavior modeling for building performance simulation: Current state and future challenges. Energy and Buildings, 107, 264–278. https://doi.org/10.1016/J.ENBUILD.2015.08.032
Yang, R., & Wang, L. (2013). Development of multi-agent system for building energy and comfort management based on occupant behaviors. Energy and Buildings, 56, 1–7. https://doi.org/10.1016/J.ENBUILD.2012.10.025
Yang, Z., Li, N., Becerik-Gerber, B., & Orosz, M. (2014). A systematic approach to occupancy modeling in ambient sensor-rich buildings. SIMULATION, 90(8), 960–977. https://doi.org/10.1177/0037549713489918
Yu, Z., Fung, B. C. M., Haghighat, F., Yoshino, H., & Morofsky, E. (2011). A systematic procedure to study the influence of occupant behavior on building energy consumption. Energy and Buildings, 43(6), 1409–1417. https://doi.org/10.1016/J.ENBUILD.2011.02.002
Zaraket, T., Yannou, B., Leroy, Y., Minel, S., & Chapotot, E. (2014). A Stochastic Activity-Based Approach for Forecasting Occupant-Related Energy Consumption in Residential Buildings. In Volume 4: 19th Design for Manufacturing and the Life Cycle Conference; 8th International Conference on Micro- and Nanosystems (p. V004T06A034). ASME. https://doi.org/10.1115/DETC2014-35528
Zhao, J., Lasternas, B., Lam, K. P., Yun, R., & Loftness, V. (2014). Occupant behavior and schedule modeling for building energy simulation through office appliance power consumption data mining. Energy and Buildings, 82, 341–355. https://doi.org/10.1016/J.ENBUILD.2014.07.033
Zhou, S., Wu, Z., Li, J., & Zhang, X. (2014). Real-time Energy Control Approach for Smart Home Energy Management System. Electric Power Components and Systems, 42(3–4), 315–326. https://doi.org/10.1080/15325008.2013.862322

167
BIOGRAPHICAL SKETCH
Mengda Jia received his Bachelor of Engineering degree in hydraulic and
hydroelectric engineering at School of Civil Engineering in Tianjin University, China.
Upon graduation in 2010, he came to the United States for his master’s studies in civil
engineering with a focus on construction engineering and management at University of
Southern California in Los Angeles, California. After that, he started his Ph.D. career in
the M.E. Rinker, Sr. School of Construction Management at University of Florida in
Gainesville, Florida. During his doctoral studies, he earned his Master of Science
degree in computer science concurrently at University of Florida in 2017. He completed
his Ph.D. degree in design, construction, and planning in 2018, with specialization in
construction management.