© 2016 pricewaterhousecoopers consulting (singapore) pte ... · preface organisations big and...
TRANSCRIPT
Raising Finance
Productivity and
Capability:
The Lean Approach
© 2016 PricewaterhouseCoopers Consulting (Singapore) Pte Ltd and CPA Australia Ltd. All rights reserved. In this document, “PwC” refers to PricewaterhouseCoopers Consulting (Singapore) Pte Ltd or, as the context requires, the PricewaterhouseCoopers global network or other member firms of the network, each of which is a separate legal entity.
Preface Organisations big and small are faced with two key challenges in today’s increasingly complex business environment. The first is how to improve productivity to continue to deliver profitable growth. The second issue is how to transform to deal with disruption in the external environment. Against this backdrop, the Finance function is under pressure to change and adopt new methods or technologies to deliver greater value to the business.
For the Finance function to stay relevant in the age of disruption, it must change. Finance needs to develop a mindset to become an enabler to the business, and leverage process optimisation and technology. We suggest that applying the Lean approach to the Finance function is a practical solution to cut waste, build capabilities, and sustain productivity gains.
The Lean approach involves identifying and removing non value-adding activities — also known as “waste” — from the Finance processes. This involves reviewing and analysing end-to-end processes, generating improvement ideas, implementing solutions, monitoring the results, and embedding a culture of continuous improvement in the Finance function.
This toolkit, comprising five booklets, shares knowledge and suggests possible solutions based on the Lean approach to improve productivity and capability in the Finance function. We have included case studies to illustrate how getting the right people to lead transformation efforts is crucial.
With proper implementation, organisations will see the benefits of the Lean approach through efficiency gains, higher employee engagement and improved financial performance. We believe this toolkit will be very useful for your Finance function, and hope to see several successful adoptions of the Lean approach in the months ahead.
R Raghunathan Ivan Phuah Melvin YongPartner, Consulting Director, Consulting Country Head, SingaporePwC PwC CPA Australia
INSTRUCTION FOR NGAI HENG PRINTER:
Hi Ellie,This dark grey is the pocket. Please delete this 13.5cm x 30.5cm box when printing. The base supposed to be light grey.
Please DO NOT print this pocket on the base
Call Vera at 9863 0269 for clarification.
Thank you.
The Lean Approach1
2
Lean is a process improvement technique used to create more value for customers (both external and internal) using the same level of resources. The ultimate goal of Lean is to maximise value to the customer through a better value creation process that has minimal waste.
From the advent of the Lean concept by the Japanese in the mid 1950s to present day, the popularity of Lean thinking has spread from the manufacturing to the service sector. From a Finance perspective, the Lean approach helps top performing companies to reduce the time spent on low-value added activities, such as manual report compilation, freeing up resources such as time and money, that can be applied to value-adding activities such as better business partnering and insight creation.
This booklet describes the main principles of Lean that can be implemented in the Finance function.
The Lean Approach
2
The Lean Approach 3
What is Lean?
Lean is a set of principles that aims to:(1) Create customer value(2) Identify value-added activities and
streamline process flows(3) Eliminate waste that does not create
value(4) Build a mindset of continuous
improvement
Lean differentiates value-added (VA) activities and non value-added (NVA) activities. The differentiation is important to visually pinpoint which part of the process creates value and should be enhanced, and which part does not and should be streamlined.
• Value-added activities are activities that change the output — form, fit or function — in a way that the customer is willing to pay for. For example, in the Accounts Payables process, filling in the Purchase Requisition is a value-added activity. Value-added activities should be optimised — for instance, automated for efficiency — to create more value for the customer.
• Non value-added activities (or waste) are activities that do not change the output to bring it closer to the form desired by the customer. Some waste may be essential in the process if the activities must be performed for legal or regulatory reasons. Such activities are called business non value-added activities. Organisations should strive to eliminate non value-added activities and minimise business non value-added activities.
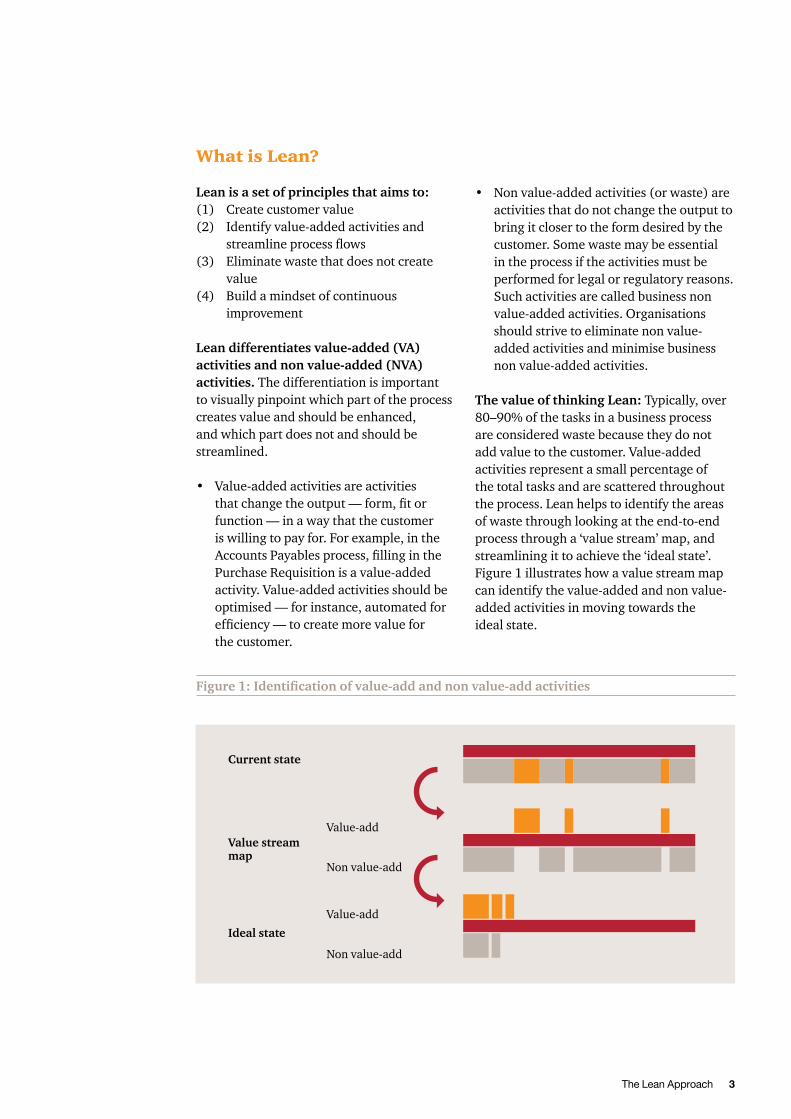
The value of thinking Lean: Typically, over 80–90% of the tasks in a business process are considered waste because they do not add value to the customer. Value-added activities represent a small percentage of the total tasks and are scattered throughout the process. Lean helps to identify the areas of waste through looking at the end-to-end process through a ‘value stream’ map, and streamlining it to achieve the ‘ideal state’. Figure 1 illustrates how a value stream map can identify the value-added and non value-added activities in moving towards the ideal state.
Current state
Value stream map
Value-add
Non value-add
Value-add
Non value-add
Ideal state
Figure 1: Identification of value-add and non value-add activities
4
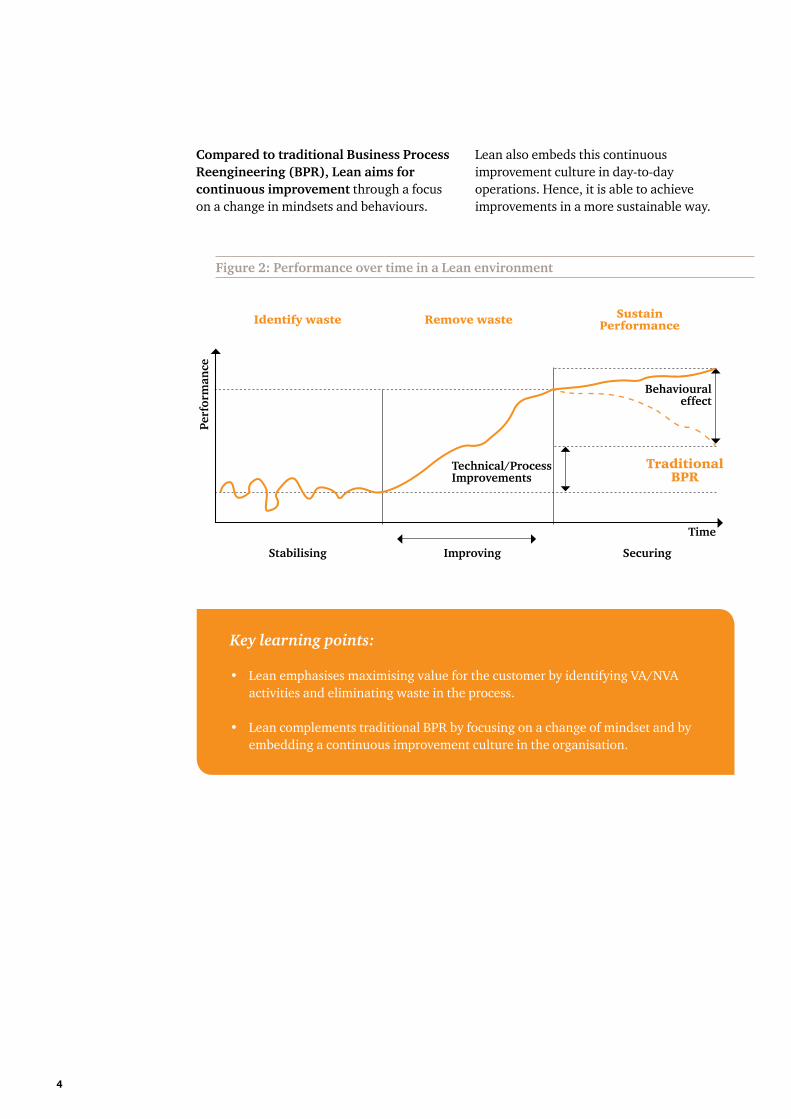
Compared to traditional Business Process Reengineering (BPR), Lean aims for continuous improvement through a focus on a change in mindsets and behaviours.
Lean also embeds this continuous improvement culture in day-to-day operations. Hence, it is able to achieve improvements in a more sustainable way.
Key learning points:
• Lean emphasises maximising value for the customer by identifying VA/NVA activities and eliminating waste in the process.
• Lean complements traditional BPR by focusing on a change of mindset and by embedding a continuous improvement culture in the organisation.
Identify waste Remove waste
TraditionalBPR
Technical/ProcessImprovements
Perf
orm
ance
Time
Stabilising Improving Securing
Behaviouraleffect
Sustain Performance
Figure 2: Performance over time in a Lean environment
The Lean Approach 5
The 5 principles of Lean
Lean is underpinned by 5 principles: Value, Value Stream, Flow, Pull and Perfection.
(1) Understand Value: Lean emphasises the need to understand the internal and external customer, listen to the voice of the customer, understand what is important for the customer or business user, and determine which areas to focus on. For example, in the Finance context, business leaders who are the users of management reports would like to have accurate and timely reports with critical insights that can assist them in the decision-making process. Hence, accuracy, timeliness and relevance are important factors.
(2) Identify the Value Stream: Lean helps to visualise the entire end-to-end value-creation process flow through process mapping. This identifies and quantifies the value-added activities and non value- added activities in the processes.
(3) Make the work Flow: Lean moves towards continuous process flow that is flexible, fast and efficient. Companies should aim to develop simplified, standardised and robust processes that can deal with business requirements and prevent errors. In addition, Lean embeds error-proofing methods into the process to prevent errors from occuring. It is always easier and cheaper to error-proof the process than tracing and fixing defects down the line.
(4) At the Pull of the customers: Lean puts an emphasis on allowing customers to pull value from the next upstream activity. This means a task or processing step is carried out only when the customer needs it, usually in a one-piece flow. The pull system seeks to balance internal resources to meet external demand, eliminating the wastes of over-production and work-in-progress.
“Value can only be specified by the customer.”
“Value is what the customer would pay for.”
“If we can see it, we can kill it.”
“If you can measure it you can improve it.”
“Standardise your work, then you can improve it.”
“Make errors impossible, and you won’t generate waste.”
“Make it when you need it.”
“One-piece flow.”
6
(5) In the pursuit of Perfection: Lean aims to perfect the process and adopt continuous improvement as a “way of life”. After completing Steps 1-4, the team should begin the process again to create more value while further reducing waste. Lean thinking should be embedded in the team, involving all employees so as to drive continuous improvement from every aspect.
Key learning points:
• Lean emphasises the need to understand customers and their requirements while reflecting on the current process to distinguish value-added and non value-added components.
• Lean moves towards continuous work flow by allowing customers to pull value from the next upstream activity.
• Lean adopts continuous improvement as a “way of life” and strives for perfection.
“You never reach perfection, you can only get closer to it.”
“Lean is a mindset change.”
The Lean Approach 7
The 8 Wastes of Lean
Value is defined by the customer. Anything that does not create value for the customer is waste. Organisations should seek to minimise waste within their processes.
The 8 wastes of Lean applied to a Finance context are:
(1) Touch: The handling of items or transactions more than required, which results in wasted efforts and energy, and in turn, adds to cost. One example is where a request has to go through multiple levels of approval, such as to the team lead, department head, Finance head, and so on. In some organisations, this is worsened by manual approvals, which means that the paper request has to be routed to multiple parties.
(2) Inventory: Excess work-in-progress that piles up in between work stations,which is a result of imbalanced demand and supply. Inventory waste can lead to other types of wastes such as longer waiting times, or expiration of the validity of data. Some examples of inventory waste are invoice backlogs, slow collection of outstanding debts, and files and documents pending processing.
(3) Motion: Unnecessary movements by people which do not add value. This waste exists due to sub-optimal office layout or unorganised database or information. Some examples of motion waste in Finance are movement of people between printing machines, fax and filing, daily payment runs, chasing for approvals, and searching for information in separate systems.
(4) Waiting: Time wasted while waiting for the next step in a process. Employees are idle while waiting for invoices, copiers, and information from co-workers. This translates into down time when people and/or equipment are not creating value. Some examples of waiting are multiple invoices sitting in a tray waiting to be signed and delays in reporting.
(5) Over-processing: Unnecessary process steps when a simpler approach would have sufficed. Some examples of over-processing in Finance are significant adjustments in reporting, repetition of data required on the same form, and multiple signatures on a request.
(6) Over-production: Producing, processing or creating more output than what is required by the customer. Over-production leads to high inventory and creation of backlogs. Some examples of over-production are unused reports, printing documents before they are required, and information sent automatically even when not required.
(7) Defects: Incorrect or inaccurate work that requires remediation and often costly or timely rework. If not identified and fixed, it may also cause reputational damage once the work or product reaches the customers. Defects common in a Finance function include incorrect data entry, payment errors, and incorrect entries.
8
(8) Skills: Failure to make the best use of employees’ knowledge, skills and abilities. The most basic example is using highly-trained professionals to perform tasks that could be performed by someone with lesser training, or which could be automated. A more subtle aspect of it is in not making use of employees’ creativity and giving them limited authority and responsibility.
Key learning points:
• Anything that does not create value that customers want is considered waste.
• Wastes are inherent in most processes and can take the form of touch, inventory, motion, waiting, over-processing, over-production, defects and un-utilised skills.
• One process can have multiple wastes and one form of waste can lead to others.
The Lean Approach 9
Case study – Toyota Lean manufacturing
• Jidoka (“Autonomation”, or automation with human touch): Toyota embeds the culture of automation into its organisation to prevent the production of defective products, eliminate over-production, focus attention on understanding problems and ensuring that they do not recur. Every employee is trained to detect abnormality, stop the process when defects happen to fix and find root causes. Rather than waiting until the end of a production line to inspect a finished product, employees self-inspect their own work or inspect the inputs they receive from the previous workstation.
• Employee involvement and continuous improvement: A key success factor of the TPS is that it focuses on the individual’s contribution to improve the company’s performance. All the tools are in place for the sole purpose of allowing people to continually improve their work. Each employee is empowered to stop the workflow and fix problems whenever they spot one. It also stresses the importance of become a learning organisation through relentless reflection and continuous improvement initiatives.
While traditional thinking in the Western world was that only mass production could reduce cost, Toyota managed to achieve low cost manufacturing with smaller volume and shorter lead times by using Lean principles in their TPS. The Lean principles have enabled Toyota to become one of the largest companies in the world.
In the 20th century, the three big motor companies General Motors (GM), Ford and Chrysler dominated the global market. In 1994, Toyota replaced Chrysler as number 3. It became the global number 2 motor manufacturer in 2003. Since 2008, Toyota has replaced GM as the largest automaker globally.
Toyota achieved its success by developing and implementing the Toyota Production System (TPS) of Lean manufacturing. The first president of Toyota Motor Corporation, Kiichiro Toyoda, set up the company’s objective: “To use small lot size with cheaper vehicles to compete with the cost of American motor companies by continuously reducing cost through waste elimination”. This philosophy was refined over generations of leaders, leveraging both local practices and Western concepts borrowed from Henry Ford, to arrive at the TPS.
The main principles of TPS are:
• Just-in-time (JIT): Toyota management invented JIT after visiting a supermarket in America. They saw customers in a supermarket purchasing goods off the shelf, which were then restocked. The shelves were neither empty nor overflowing with excess goods. Applying this to the manufacturing context, it means “making only what is needed, only when and where it is needed, and only in the amount that is needed”. JIT is done by letting customer pull the production, making the process one-piece and making inventory visible.

10
At a glance
The Finance function can draw a few key points from the philosophy and principles of Lean:
• Understand internal and external customers: Every business process or step must deliver a business outcome that customers want and are willing to pay for.
• Waste exists everywhere in the organisation in various forms. Lean principles focus on identifying and eliminating waste.
• Build a mindset of improvement: For Lean to be successful, it needs to become a way of working embedded in the organisational culture.

This content is for general information purposes only, and should not be used as a substitute for consultation with professional advisors.
© 2016 PricewaterhouseCoopers Consulting (Singapore) Pte Ltd and CPA Australia Ltd. All rights reserved. In this document, “PwC” refers to PricewaterhouseCoopers Consulting (Singapore) Pte Ltd or, as the context requires, the PricewaterhouseCoopers global network or other member firms of the network, each of which is a separate legal entity.
Contacts
R Raghunathan Partner PwC Singapore
+65 6236 3258 [email protected]
Ivan Phuah Director PwC Singapore
+65 6236 3373 [email protected]
Melvin YongCountry Head – SingaporeCPA Australia +65 6671 [email protected]
Lean in Finance2
2
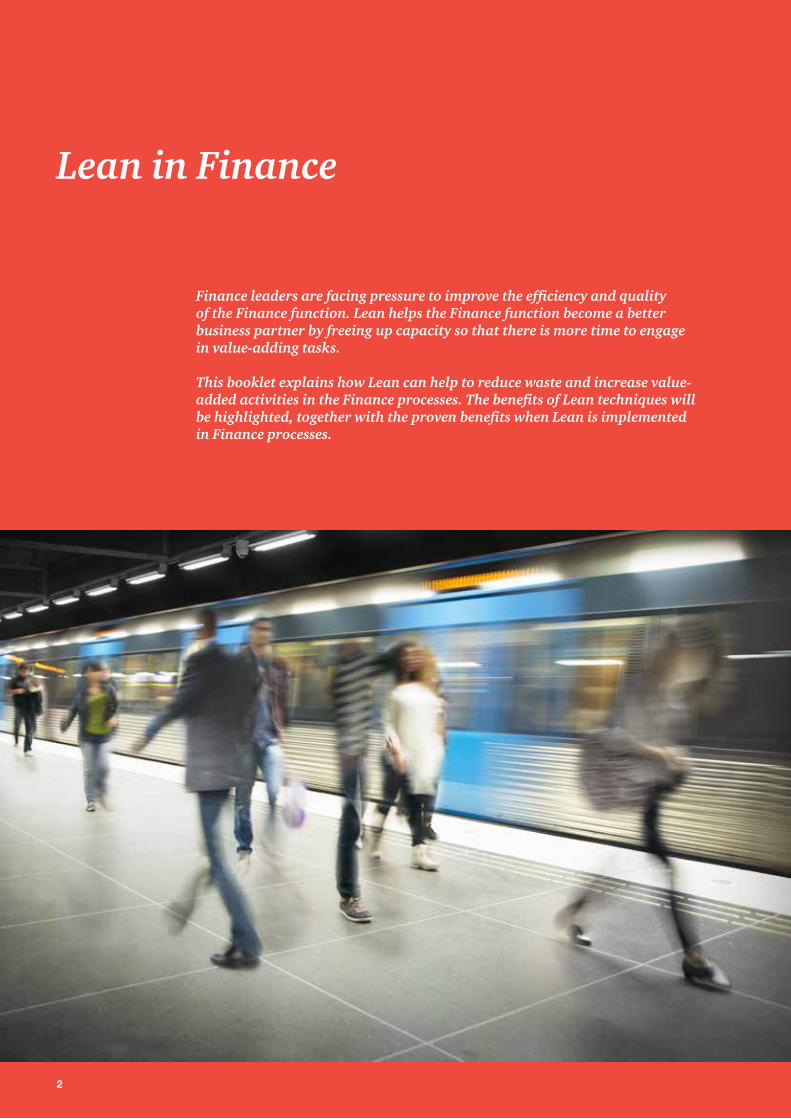
Finance leaders are facing pressure to improve the efficiency and quality of the Finance function. Lean helps the Finance function become a better business partner by freeing up capacity so that there is more time to engage in value-adding tasks.
This booklet explains how Lean can help to reduce waste and increase value-added activities in the Finance processes. The benefits of Lean techniques will be highlighted, together with the proven benefits when Lean is implemented in Finance processes.
Lean in Finance
2
Lean in Finance 3
Understanding Finance Processes
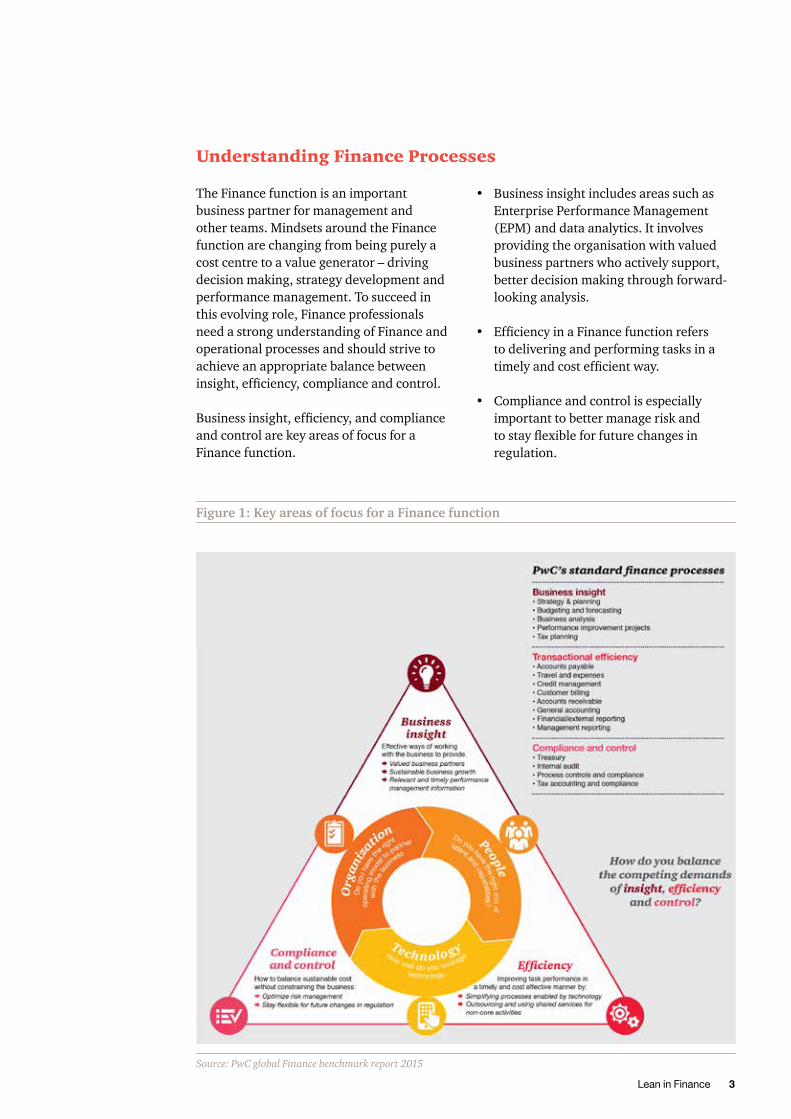
The Finance function is an important business partner for management and other teams. Mindsets around the Finance function are changing from being purely a cost centre to a value generator – driving decision making, strategy development and performance management. To succeed in this evolving role, Finance professionals need a strong understanding of Finance and operational processes and should strive to achieve an appropriate balance between insight, efficiency, compliance and control.
Business insight, efficiency, and compliance and control are key areas of focus for a Finance function.
Figure 1: Key areas of focus for a Finance function
Source: PwC global Finance benchmark report 2015
• Business insight includes areas such as Enterprise Performance Management (EPM) and data analytics. It involves providing the organisation with valued business partners who actively support, better decision making through forward-looking analysis.
• Efficiency in a Finance function refers to delivering and performing tasks in a timely and cost efficient way.
• Compliance and control is especially important to better manage risk and to stay flexible for future changes in regulation.
4
Challenges in Finance
Leading Finance teams are achieving results that are very different from the rest of the market. They continue to reduce waste and effectively leverage technology to increase efficiency and drive the business forward. This is how they set themselves apart from the average performers in the industry, and are able to deliver regular tasks such as month-end closing and reporting in a much shorter time frame. However the average Finance unit still has some way to go.
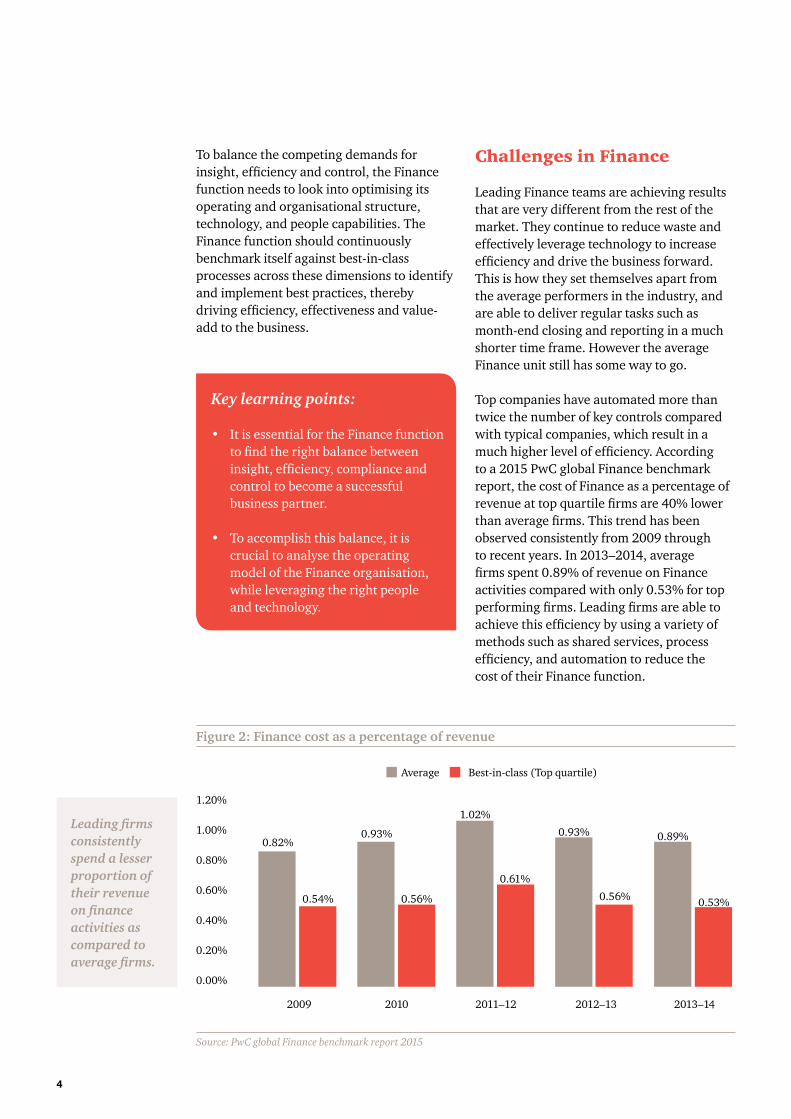
Top companies have automated more than twice the number of key controls compared with typical companies, which result in a much higher level of efficiency. According to a 2015 PwC global Finance benchmark report, the cost of Finance as a percentage of revenue at top quartile firms are 40% lower than average firms. This trend has been observed consistently from 2009 through to recent years. In 2013–2014, average firms spent 0.89% of revenue on Finance activities compared with only 0.53% for top performing firms. Leading firms are able to achieve this efficiency by using a variety of methods such as shared services, process efficiency, and automation to reduce the cost of their Finance function.
Key learning points:
• It is essential for the Finance function to find the right balance between insight, efficiency, compliance and control to become a successful business partner.
• To accomplish this balance, it is crucial to analyse the operating model of the Finance organisation, while leveraging the right people and technology.
Figure 2: Finance cost as a percentage of revenue
Source: PwC global Finance benchmark report 2015
1.20%
1.00%
0.80%
0.60%
0.40%
0.20%
0.00%
2009 2010 2011–12 2012–13 2013–14
0.82%0.93%
Average Best-in-class (Top quartile)
1.02%
0.93% 0.89%
0.54% 0.56%
0.61%
0.56% 0.53%
To balance the competing demands for insight, efficiency and control, the Finance function needs to look into optimising its operating and organisational structure, technology, and people capabilities. The Finance function should continuously benchmark itself against best-in-class processes across these dimensions to identify and implement best practices, thereby driving efficiency, effectiveness and value-add to the business.
Leading firms consistently spend a lesser proportion of their revenue on finance activities as compared to average firms.
Lean in Finance 5
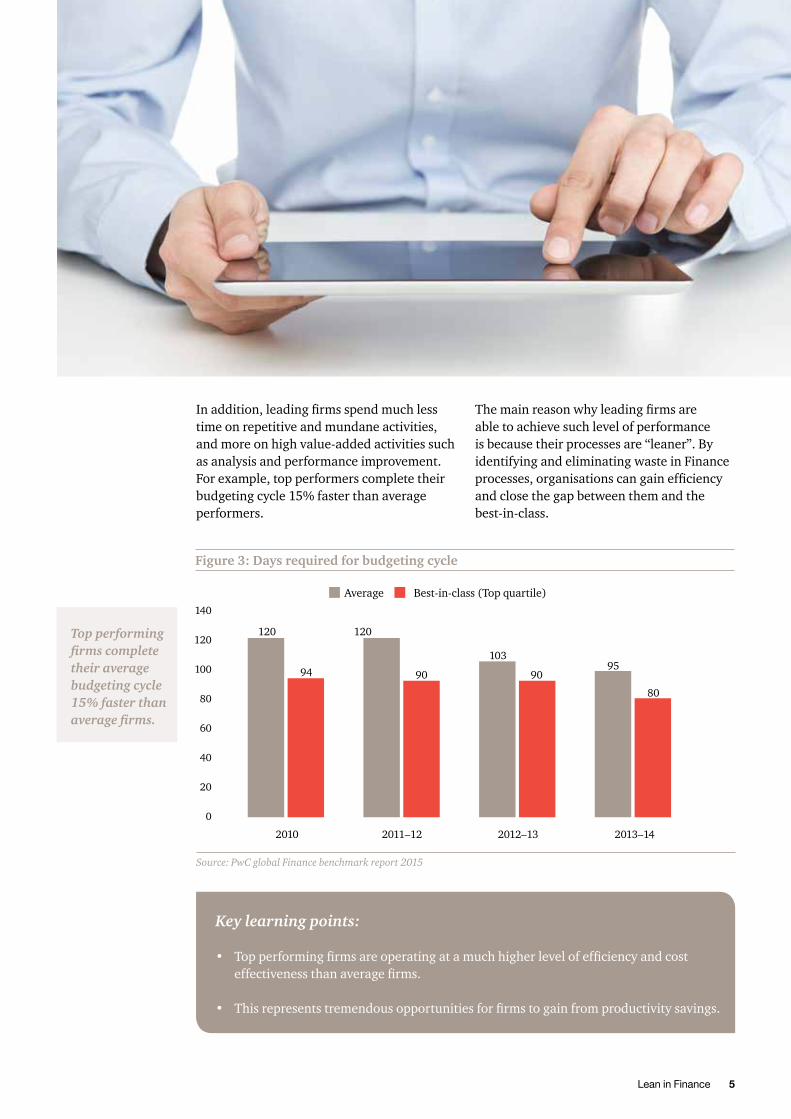
In addition, leading firms spend much less time on repetitive and mundane activities, and more on high value-added activities such as analysis and performance improvement. For example, top performers complete their budgeting cycle 15% faster than average performers.
Key learning points:
• Top performing firms are operating at a much higher level of efficiency and cost effectiveness than average firms.
• This represents tremendous opportunities for firms to gain from productivity savings.
Figure 3: Days required for budgeting cycle
Source: PwC global Finance benchmark report 2015
140
120
100
80
60
40
20
0
2010 2011–12 2012–13 2013–14
120 120
Average Best-in-class (Top quartile)
1039594 90 90
80
The main reason why leading firms are able to achieve such level of performance is because their processes are “leaner”. By identifying and eliminating waste in Finance processes, organisations can gain efficiency and close the gap between them and the best-in-class.
Top performing firms complete their average budgeting cycle 15% faster than average firms.
6
Examples of Waste in a Typical Finance Process
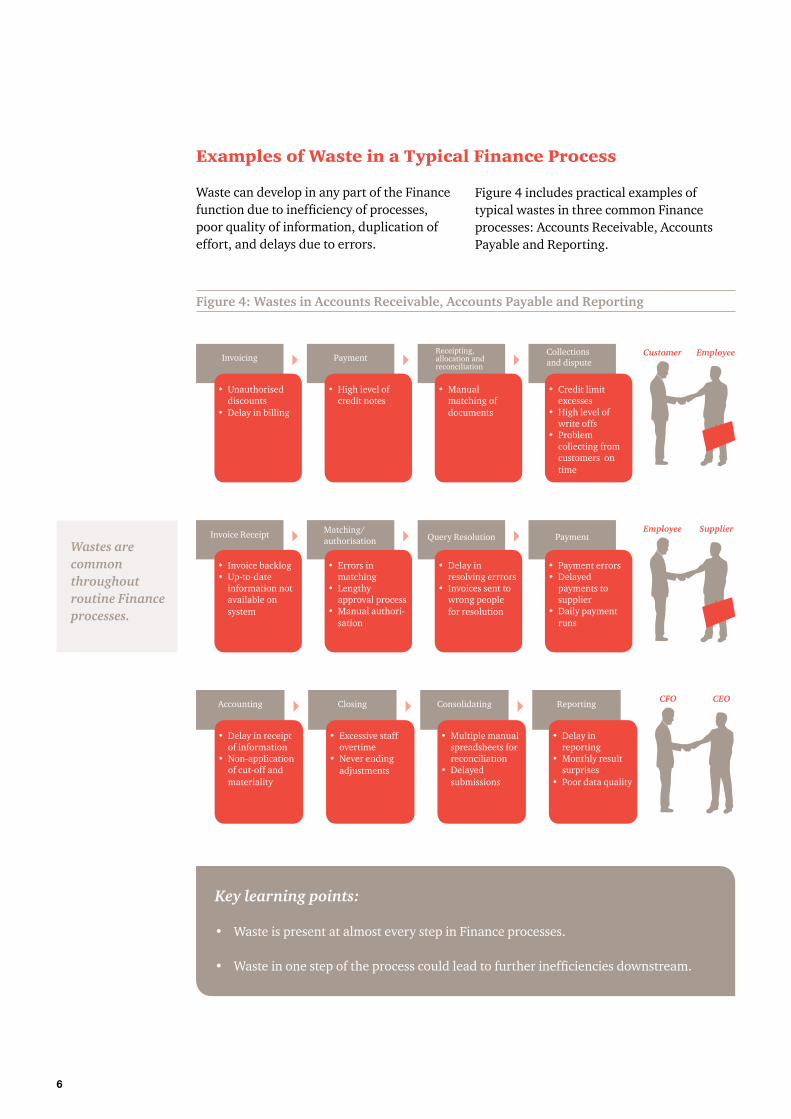
Accounting Consolidating ReportingClosing
• Delay in receipt of information
• Non-application of cut-off and materiality
• Excessive staff overtime
• Never ending adjustments
• Multiple manual spreadsheets for reconciliation
• Delayed submissions
• Delay in reporting
• Monthly result surprises
• Poor data quality
CFO CEO
Figure 4: Wastes in Accounts Receivable, Accounts Payable and Reporting
Waste can develop in any part of the Finance function due to inefficiency of processes, poor quality of information, duplication of effort, and delays due to errors.
Figure 4 includes practical examples of typical wastes in three common Finance processes: Accounts Receivable, Accounts Payable and Reporting.
PaymentInvoicingReceipting, allocation and reconciliation
Collections and dispute
• Unauthorised discounts
• Delay in billing
• High level of credit notes
• Manual matching of documents
• Credit limit excesses
• High level of write offs
• Problem collecting from customers on time
Customer Employee
Invoice Receipt Query Resolution PaymentMatching/authorisation
• Invoice backlog• Up-to-date
information not available on system
• Errors in matching
• Lengthy approval process
• Manual authori-sation
• Delay in resolving errrors
• Invoices sent to wrong people for resolution
• Payment errors• Delayed
payments to supplier
• Daily payment runs
Employee Supplier
Key learning points:
• Waste is present at almost every step in Finance processes.
• Waste in one step of the process could lead to further inefficiencies downstream.
Wastes are common throughout routine Finance processes.
Lean in Finance 7
Applying Lean to Finance
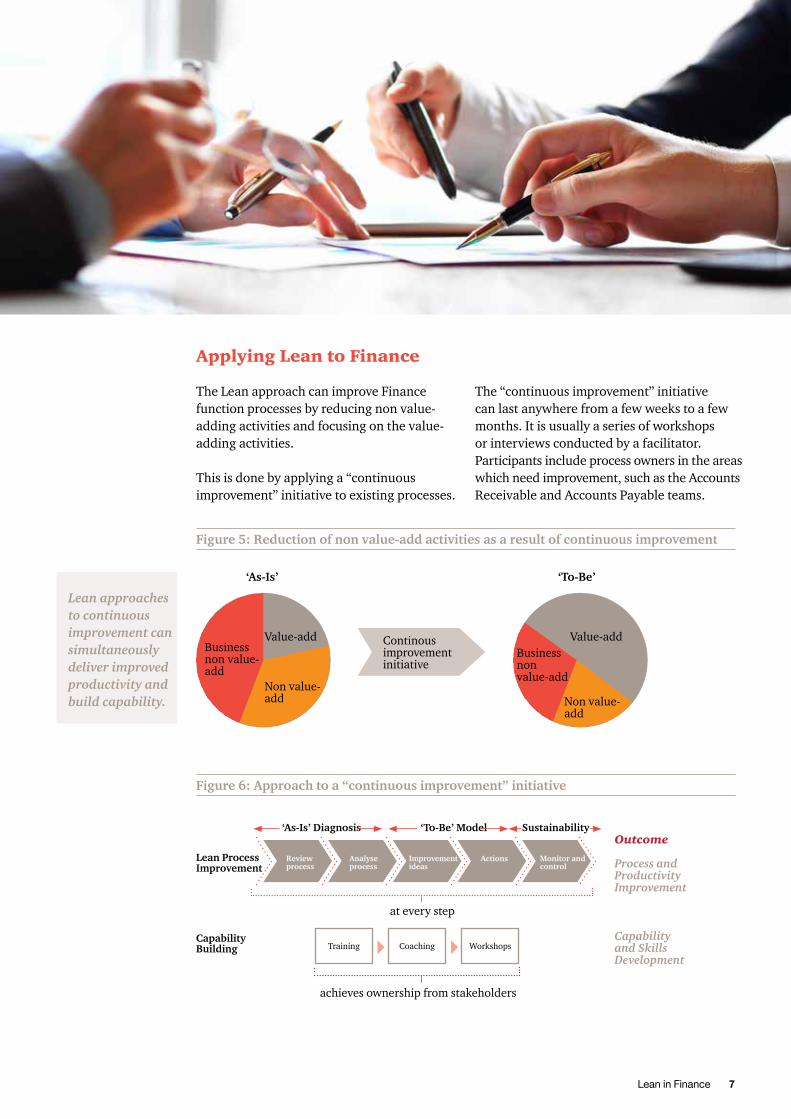
The Lean approach can improve Finance function processes by reducing non value-adding activities and focusing on the value-adding activities.
This is done by applying a “continuous improvement” initiative to existing processes.
The “continuous improvement” initiative can last anywhere from a few weeks to a few months. It is usually a series of workshops or interviews conducted by a facilitator. Participants include process owners in the areas which need improvement, such as the Accounts Receivable and Accounts Payable teams.
Figure 6: Approach to a “continuous improvement” initiative
Figure 5: Reduction of non value-add activities as a result of continuous improvement
Continous improvement initiative
Value-addBusiness non value-add
Non value-add
Business non value-add
Value-add
Non value- add
Training Coaching Workshops
achieves ownership from stakeholders
CapabilityBuilding
Outcome
Process and Productivity Improvement
Capability and Skills Development
Review process
Analyse process
Improvement ideas
Actions Monitor and control
Lean Process Improvement
‘As-Is’ Diagnosis
at every step
‘To-Be’ Model Sustainability
‘As-Is’ ‘To-Be’
Lean approaches to continuous improvement can simultaneously deliver improved productivity and build capability.
8
The Lean approach can help to enhance the traditional business process by focusing on both waste and value-added activities.
• Companies often focus on improving processes without first reducing waste. This waste then gets built into their new processes and systems.
• It is essential for companies to identify and evaluate the aspects which add value and eliminate the rest. They will then be able to shift their focus solely to automating the specific areas which would positively impact their customers.
• This in turn helps to shorten the total process time while increasing the proportion of value-added activities.
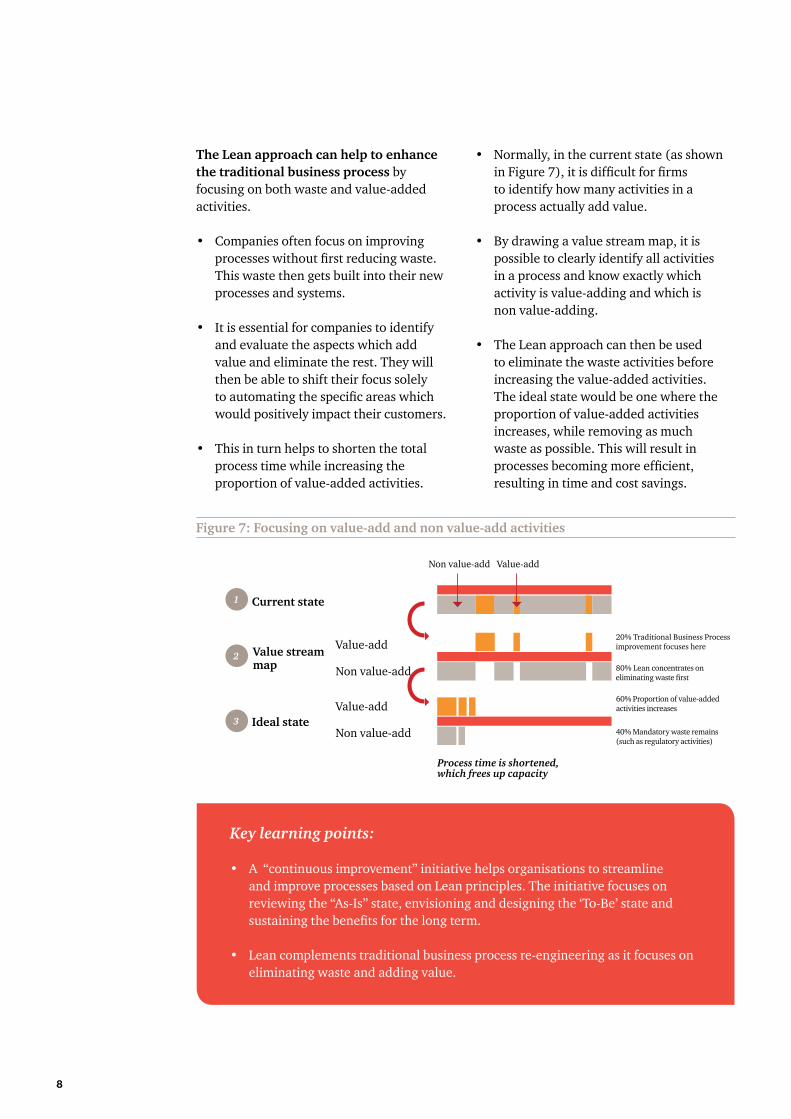
• Normally, in the current state (as shown in Figure 7), it is difficult for firms to identify how many activities in a process actually add value.
• By drawing a value stream map, it is possible to clearly identify all activities in a process and know exactly which activity is value-adding and which is non value-adding.
• The Lean approach can then be used to eliminate the waste activities before increasing the value-added activities. The ideal state would be one where the proportion of value-added activities increases, while removing as much waste as possible. This will result in processes becoming more efficient, resulting in time and cost savings.
Key learning points:
• A “continuous improvement” initiative helps organisations to streamline and improve processes based on Lean principles. The initiative focuses on reviewing the ‘‘As-Is’’ state, envisioning and designing the ‘To-Be’ state and sustaining the benefits for the long term.
• Lean complements traditional business process re-engineering as it focuses on eliminating waste and adding value.
Non value-add
20% Traditional Business Process improvement focuses here
60% Proportion of value-added activities increases
80% Lean concentrates on eliminating waste first
40% Mandatory waste remains (such as regulatory activities)
Value-add
Process time is shortened, which frees up capacity
1
2
3
Current state
Value stream map
Value-add
Non value-add
Value-add
Non value-addIdeal state
Figure 7: Focusing on value-add and non value-add activities
Lean in Finance 9
Benefits of Lean in Finance
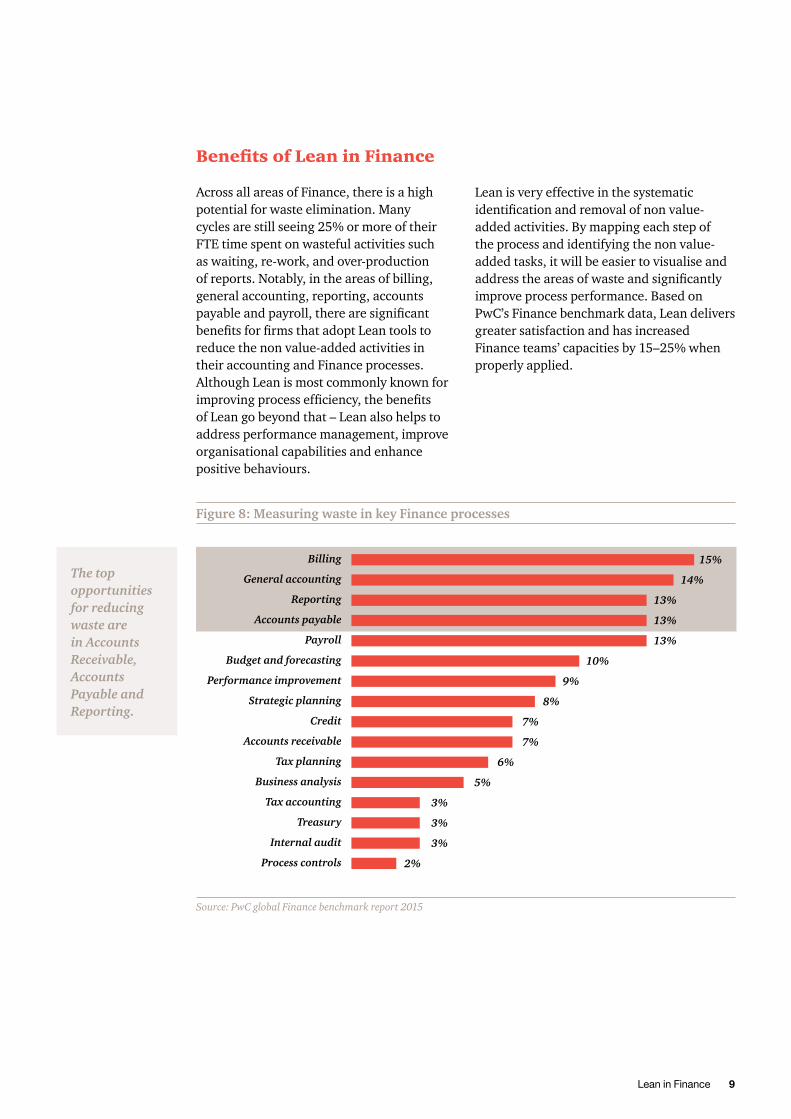
Across all areas of Finance, there is a high potential for waste elimination. Many cycles are still seeing 25% or more of their FTE time spent on wasteful activities such as waiting, re-work, and over-production of reports. Notably, in the areas of billing, general accounting, reporting, accounts payable and payroll, there are significant benefits for firms that adopt Lean tools to reduce the non value-added activities in their accounting and Finance processes. Although Lean is most commonly known for improving process efficiency, the benefits of Lean go beyond that – Lean also helps to address performance management, improve organisational capabilities and enhance positive behaviours.
Figure 8: Measuring waste in key Finance processes
Lean is very effective in the systematic identification and removal of non value-added activities. By mapping each step of the process and identifying the non value-added tasks, it will be easier to visualise and address the areas of waste and significantly improve process performance. Based on PwC’s Finance benchmark data, Lean delivers greater satisfaction and has increased Finance teams’ capacities by 15–25% when properly applied.
Billing
General accounting
Reporting
Accounts payable
Payroll
Budget and forecasting
Performance improvement
Strategic planning
Credit
Accounts receivable
Tax planning
Business analysis
Tax accounting
Treasury
Internal audit
Process controls
15%
14%
13%
13%
13%
10%
9%
8%
7%
7%
6%
5%
3%
3%
3%
2%
Source: PwC global Finance benchmark report 2015
The top opportunities for reducing waste are in Accounts Receivable, Accounts Payable and Reporting.
10
Key learning points:
• Finance functions have high potential of productivity gains from Lean implementation due to the high level of inefficiencies in their current processes.
• In addition to process efficiency, Lean also helps performance management, improves organisational capabilities and enhances positive mindset and behaviours.
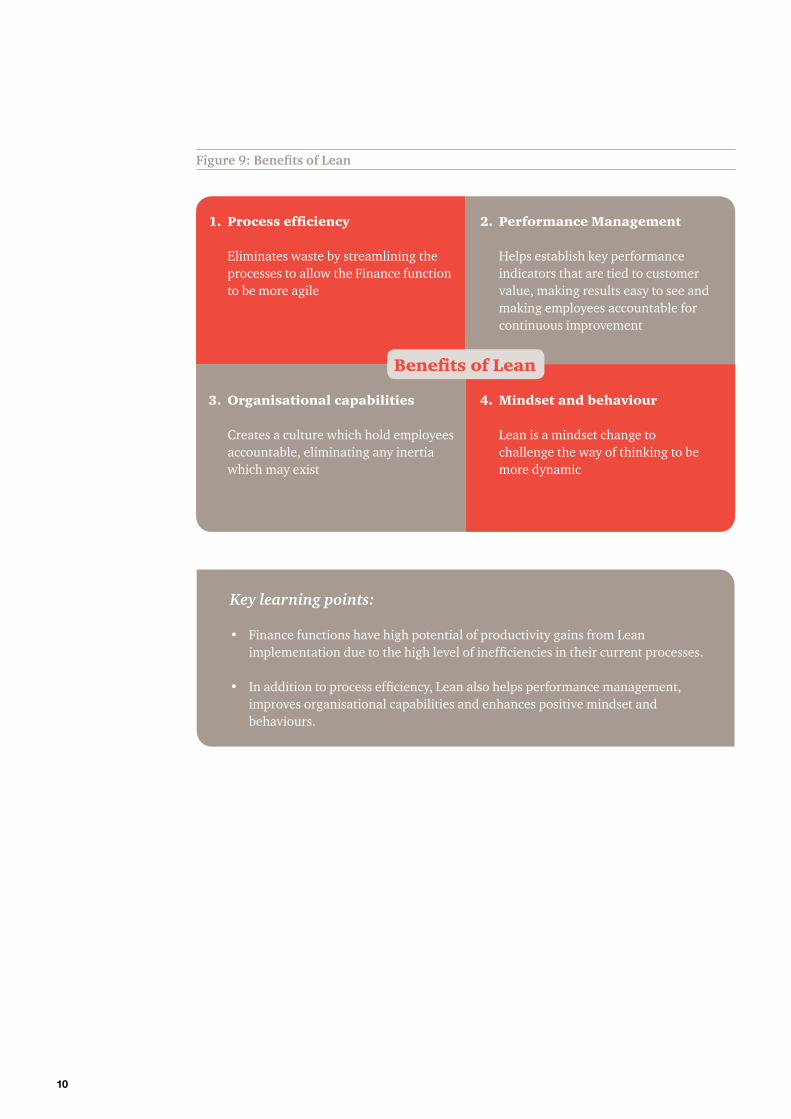
3. Organisational capabilities
Creates a culture which hold employees accountable, eliminating any inertia which may exist
1. Process efficiency
Eliminates waste by streamlining the processes to allow the Finance function to be more agile
4. Mindset and behaviour
Lean is a mindset change to challenge the way of thinking to be more dynamic
2. Performance Management
Helps establish key performance indicators that are tied to customer value, making results easy to see and making employees accountable for continuous improvement
Benefits of Lean
Figure 9: Benefits of Lean
Lean in Finance 11
Case study – One of the UK’s largest financial services group
A leading UK bank had a large Finance function with about 3,600 FTEs spread across multiple locations and divisions with disparate processes and systems. Their challenge was to reduce the overall cost of Finance while improving service and building capabilities. The lender had gone through a number of process re-design and large system implementation programmes and could not see how to further reduce cost within the organisation.
A Finance transformation programme using Lean methods was carried out, involving four aspects:
• Implementation of Lean tools such as problem-solving sessions, standard ways of working, team huddles and information centres to help the team pinpoint and eliminate waste in their Finance processes.
• Office re-organisation: Implementing Lean initiatives at the main service centres and closing satellite sites.
• Building capability of the team through 11 weekly training sessions, 350 individual coaching hours and a bootcamp to embed Lean thinking into the team’s culture.
• Sustainability planning by establishing knowledge transfer of the new ways of working, tools and benefits.
Since the Lean initiative was launched in 2013, 1,000 members of the Finance team have taken part so far and more than 1,200 are coming on board in the coming years. Productivity has increased by up to 20%. In addition, compliance and service rates have increased, overtime has reduced and operational control has improved. Everyone in the Finance function is on board and excited to apply Lean thinking in their everyday work.
At a glance
The key takeaways on applying Lean to improve the Finance function in organisations are:
• The Finance function has high potential for Lean implementation due to the existing inefficiencies across its processes. By applying Lean thinking to eliminate wastes and streamline processes, leading organisations are able to perform much more efficiently than their peers.
• Lean concentrates on eliminating waste first, before focusing on automating specific areas that will add value to the Finance processes. This is done via a “continuous improvement” initiative in which the team reviews the ‘As-Is’ State, envisions and designs the ‘To-Be’ State, and work on sustaining the benefits in the long term.
• Lean benefits the organisations through enchanced process efficiency, performance management, organisational capabilities and instilling positive mindsets and behaviours.

Contacts
R Raghunathan Partner PwC Singapore
+65 6236 3258 [email protected]
Ivan Phuah Director PwC Singapore
+65 6236 3373 [email protected]
Melvin YongCountry Head – SingaporeCPA Australia +65 6671 [email protected]
This content is for general information purposes only, and should not be used as a substitute for consultation with professional advisors.
© 2016 PricewaterhouseCoopers Consulting (Singapore) Pte Ltd and CPA Australia Ltd. All rights reserved. In this document, “PwC” refers to PricewaterhouseCoopers Consulting (Singapore) Pte Ltd or, as the context requires, the PricewaterhouseCoopers global network or other member firms of the network, each of which is a separate legal entity.
Diagnosing ‘As-Is’ Issues3
2
Given the Finance function’s potential for process streamlining and improvement, the Lean approach can help to create value by identifying value-added activities and eliminating wasteful activities that do not add value. This is done through a “continuous improvement” project using Lean principles.
The first part of a “continuous improvement” project is to map out and review the current state. Because processes flow across functions and departments, few people involved have a complete picture of the end-to-end workflow, and interdependencies are often hidden. This can result in costly inefficiencies and high error rates. A detailed analysis of the current state often reveals significant opportunities to improve performance.
This booklet describes how organisations can apply Lean principles to diagnose the current state of their Finance functions.
Diagnosing ‘As-Is’ Issues
2
Diagnosing ‘As-Is’ Issues 3
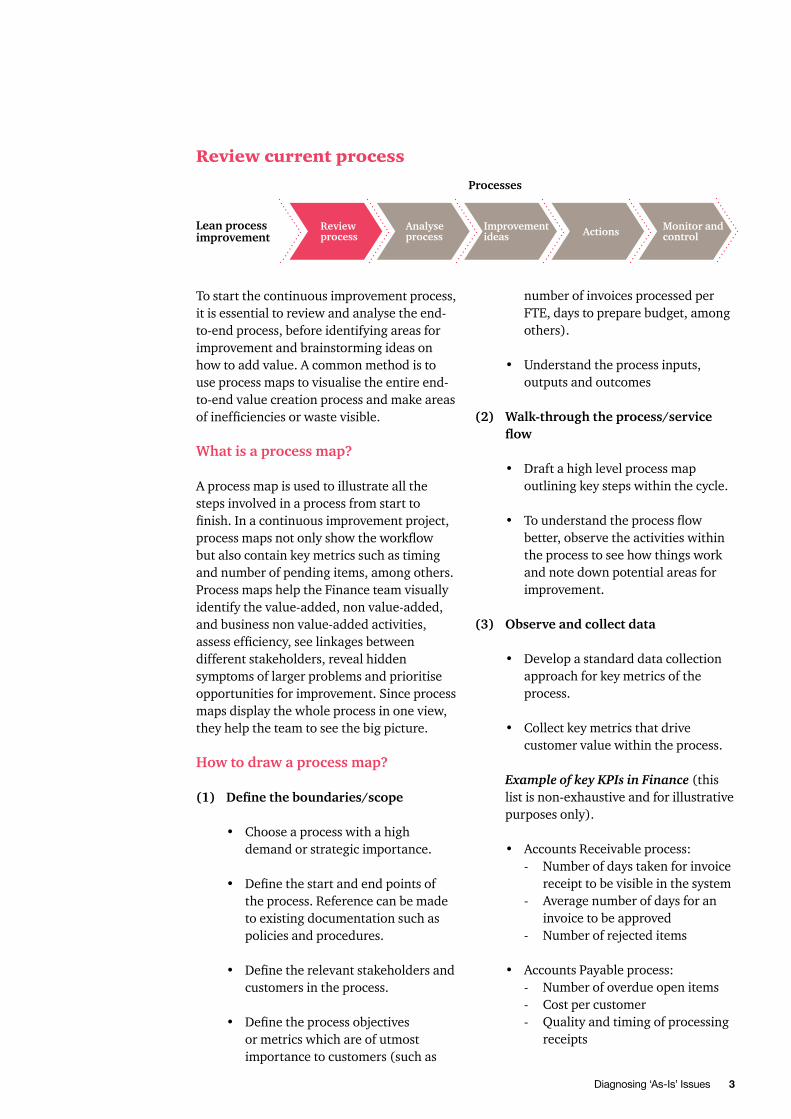
Review current process
To start the continuous improvement process, it is essential to review and analyse the end-to-end process, before identifying areas for improvement and brainstorming ideas on how to add value. A common method is to use process maps to visualise the entire end-to-end value creation process and make areas of inefficiencies or waste visible.
What is a process map?
A process map is used to illustrate all the steps involved in a process from start to finish. In a continuous improvement project, process maps not only show the workflow but also contain key metrics such as timing and number of pending items, among others. Process maps help the Finance team visually identify the value-added, non value-added, and business non value-added activities, assess efficiency, see linkages between different stakeholders, reveal hidden symptoms of larger problems and prioritise opportunities for improvement. Since process maps display the whole process in one view, they help the team to see the big picture.
How to draw a process map?
(1) Definetheboundaries/scope
• Choose a process with a high demand or strategic importance.
• Define the start and end points of the process. Reference can be made to existing documentation such as policies and procedures.
• Define the relevant stakeholders and customers in the process.
• Define the process objectives or metrics which are of utmost importance to customers (such as
number of invoices processed per FTE, days to prepare budget, among others).
• Understand the process inputs, outputs and outcomes
(2) Walk-throughtheprocess/serviceflow
• Draft a high level process map outlining key steps within the cycle.
• To understand the process flow better, observe the activities within the process to see how things work and note down potential areas for improvement.
(3) Observeandcollectdata
• Develop a standard data collection approach for key metrics of the process.
• Collect key metrics that drive customer value within the process.
Example of key KPIs in Finance (this list is non-exhaustive and for illustrative purposes only).
• Accounts Receivable process:- Number of days taken for invoice
receipt to be visible in the system- Average number of days for an
invoice to be approved- Number of rejected items
• Accounts Payable process:- Number of overdue open items- Cost per customer- Quality and timing of processing
receipts
Reviewprocess
Analyseprocess
Improvementideas Actions Monitorand
controlLeanprocessimprovement
Processes
4
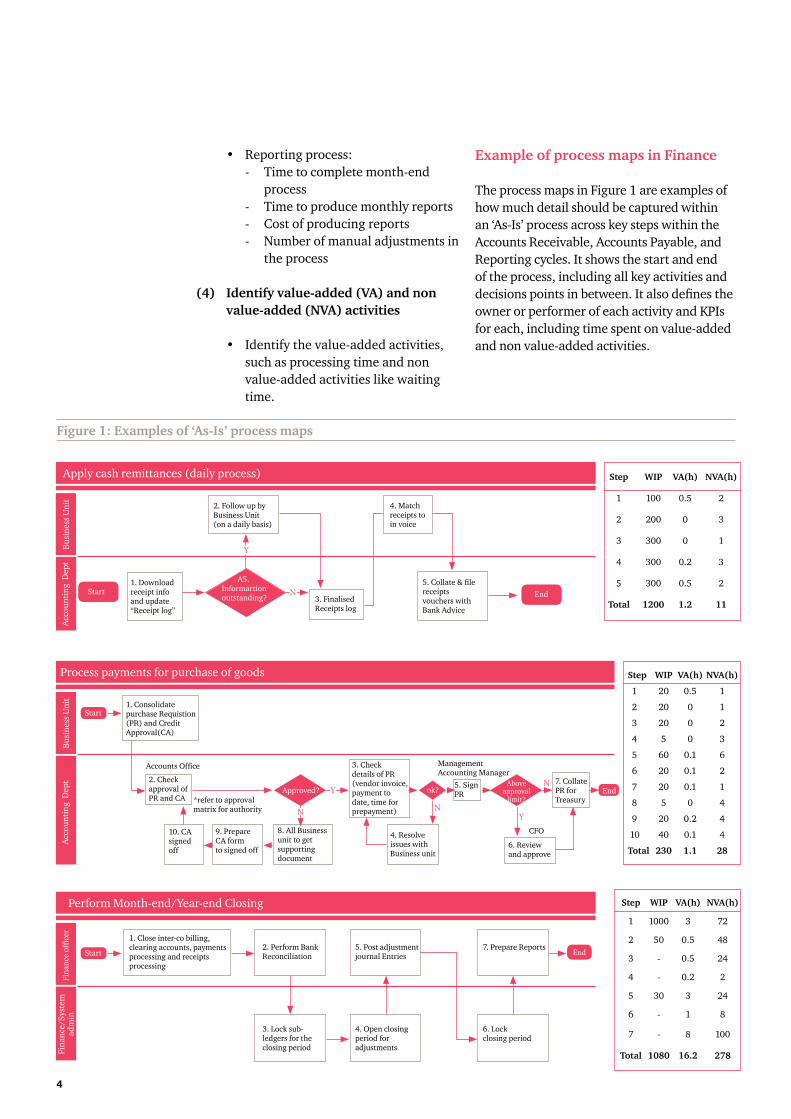
Figure1:Examplesof‘As-Is’processmaps
• Reporting process:- Time to complete month-end
process- Time to produce monthly reports- Cost of producing reports- Number of manual adjustments in
the process
(4) Identifyvalue-added(VA)andnonvalue-added(NVA)activities
• Identify the value-added activities, such as processing time and non value-added activities like waiting time.
ExampleofprocessmapsinFinance
The process maps in Figure 1 are examples of how much detail should be captured within an ‘As-Is’ process across key steps within the Accounts Receivable, Accounts Payable, and Reporting cycles. It shows the start and end of the process, including all key activities and decisions points in between. It also defines the owner or performer of each activity and KPIs for each, including time spent on value-added and non value-added activities.
1. Downloadreceipt info and update “Receipt log”
A5.Informartionoutstanding? 3. Finalised
Receipts log
4. Match receipts to in voice
5. Collate & filereceiptsvouchers with Bank Advice
2. Follow up by Business Unit (on a daily basis)
Acc
ount
ing
Dep
t
Bus
ines
s U
nit
Step WIP VA(h) NVA(h)
1 100 0.5 2
2 200 0 3
3 300 0 1
4 300 0.2 3
5 300 0.5 2
Total 1200 1.2 11
Start
1. Close inter-co billing, clearing accounts, payments processing and receipts processing
2. Perform BankReconciliation End
Step WIP VA(h) NVA(h)
1 1000 3 72
2 50 0.5 48
3 - 0.5 24
4 - 0.2 2
5 30 3 24
6 - 1 8
7 - 8 100
Total 1080 16.2 278
Apply cash remittances (daily process)
End
Y
N
Acc
ount
ing
Dep
t
Bus
ines
s U
nit
Process payments for purchase of goods
Start1. Consolidate purchase Requistion (PR) and Credit Approval(CA)
2. Check approval of PR and CA
Accounts Office
*refer to approval matrix for authority
10. CA signedoff
9. PrepareCA form to signed off
8. All Business unit to get supporting document
3. Check details of PR (vendor invoice, payment to date, time for prepayment)
5. Sign PR
Management Accounting Manager
6. Review and approve
7. Collate PR for Treasury
Step WIP VA(h)NVA(h)
1 20 0.5 1
2 20 0 1
3 20 0 2
4 5 0 3
5 60 0.1 6
6 20 0.1 2
7 20 0.1 1
8 5 0 4
9 20 0.2 4
10 40 0.1 4
Total 230 1.1 28
Approved? Y
N
4. Resolve issues with Business unit
ok? EndAbove
approvallimit?
N
NY
CFO
Fina
nce/
Syst
em
adm
inFi
nanc
e of
ficer
Perform Month-end/Year-end Closing
Start
3. Lock sub-ledgers for the closing period
5. Post adjustment journal Entries
4. Open closing period for adjustments
7. Prepare Reports
6. Lock closing period
Diagnosing ‘As-Is’ Issues 5
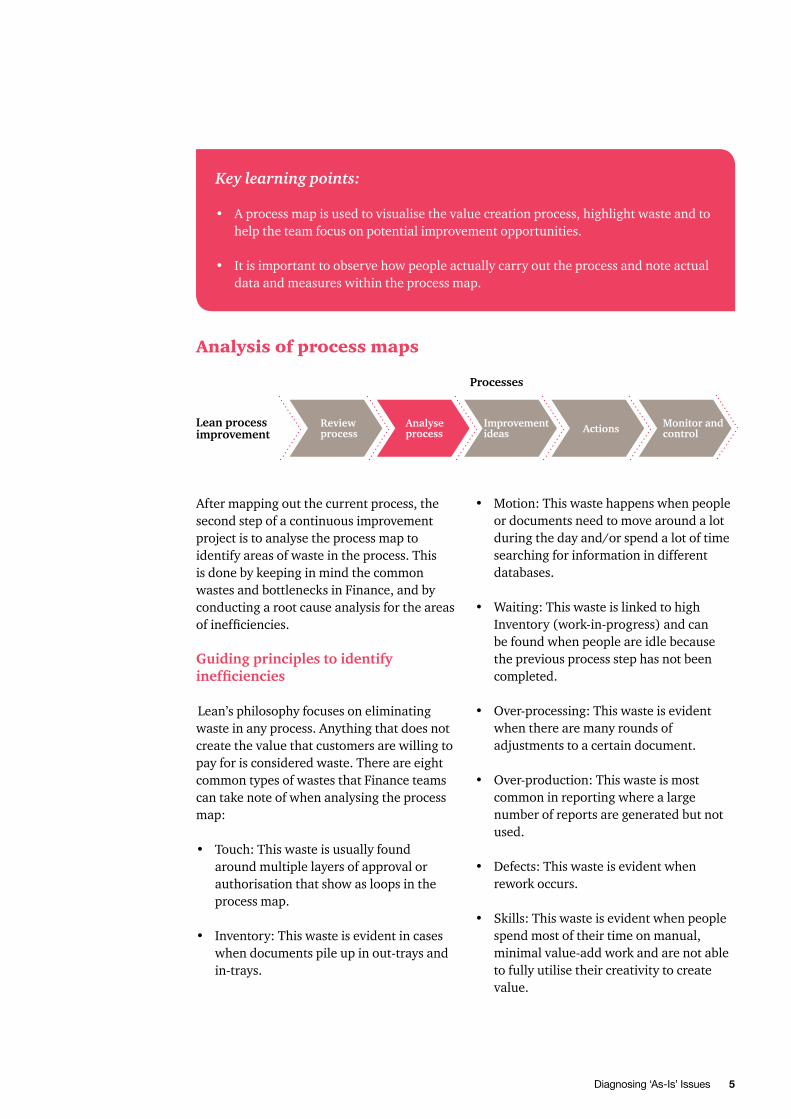
Key learning points:
• A process map is used to visualise the value creation process, highlight waste and to help the team focus on potential improvement opportunities.
• It is important to observe how people actually carry out the process and note actual data and measures within the process map.
Analysis of process maps
After mapping out the current process, the second step of a continuous improvement project is to analyse the process map to identify areas of waste in the process. This is done by keeping in mind the common wastes and bottlenecks in Finance, and by conducting a root cause analysis for the areas of inefficiencies.
Guidingprinciplestoidentifyinefficiencies
Lean’s philosophy focuses on eliminating waste in any process. Anything that does not create the value that customers are willing to pay for is considered waste. There are eight common types of wastes that Finance teams can take note of when analysing the process map:
• Touch: This waste is usually found around multiple layers of approval or authorisation that show as loops in the process map.
• Inventory: This waste is evident in cases when documents pile up in out-trays and in-trays.
• Motion: This waste happens when people or documents need to move around a lot during the day and/or spend a lot of time searching for information in different databases.
• Waiting: This waste is linked to high Inventory (work-in-progress) and can be found when people are idle because the previous process step has not been completed.
• Over-processing: This waste is evident when there are many rounds of adjustments to a certain document.
• Over-production: This waste is most common in reporting where a large number of reports are generated but not used.
• Defects: This waste is evident when rework occurs.
• Skills: This waste is evident when people spend most of their time on manual, minimal value-add work and are not able to fully utilise their creativity to create value.
Reviewprocess
Analyseprocess
Improvementideas Actions Monitorand
controlLeanprocessimprovement
Processes
6
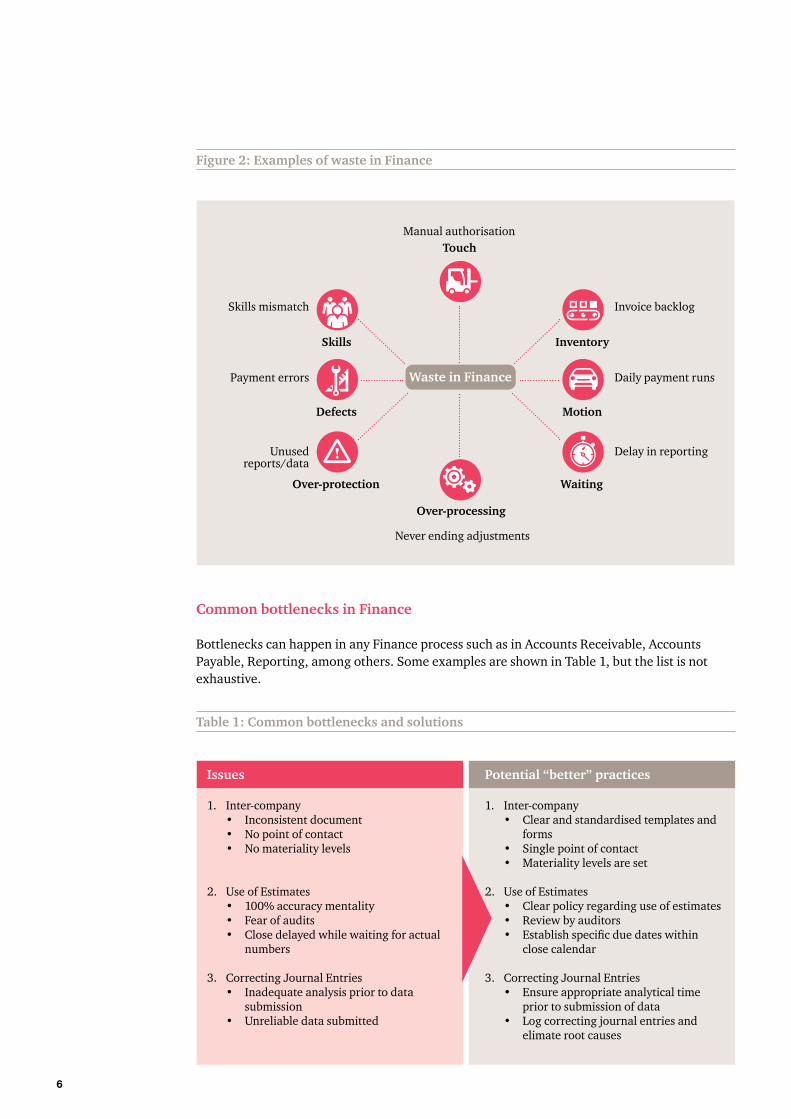
CommonbottlenecksinFinance
Bottlenecks can happen in any Finance process such as in Accounts Receivable, Accounts Payable, Reporting, among others. Some examples are shown in Table 1, but the list is not exhaustive.
Skills
Defects
Over-protection
Inventory
Motion
Waiting
Touch
Over-processing
WasteinFinance
Skills mismatch
Payment errors
Unused reports/data
Invoice backlog
Daily payment runs
Delay in reporting
Never ending adjustments
Manual authorisation
Issues
1. Inter-company• Inconsistent document• No point of contact• No materiality levels
2. Use of Estimates• 100% accuracy mentality• Fear of audits• Close delayed while waiting for actual
numbers
3. Correcting Journal Entries• Inadequate analysis prior to data
submission• Unreliable data submitted
Potential“better”practices
1. Inter-company• Clear and standardised templates and
forms• Single point of contact• Materiality levels are set
2. Use of Estimates• Clear policy regarding use of estimates• Review by auditors• Establish specific due dates within
close calendar
3. Correcting Journal Entries• Ensure appropriate analytical time
prior to submission of data• Log correcting journal entries and
elimate root causes
Figure2:ExamplesofwasteinFinance
Table1:Commonbottlenecksandsolutions
Diagnosing ‘As-Is’ Issues 7
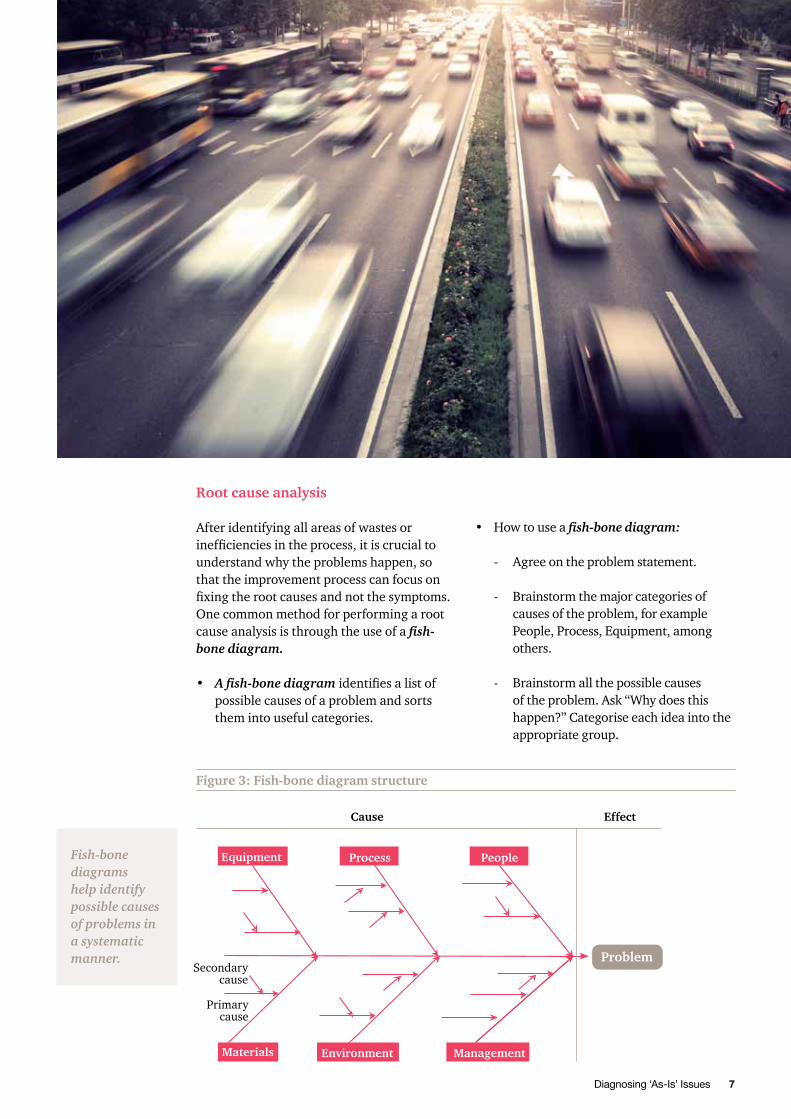
Rootcauseanalysis
After identifying all areas of wastes or inefficiencies in the process, it is crucial to understand why the problems happen, so that the improvement process can focus on fixing the root causes and not the symptoms. One common method for performing a root cause analysis is through the use of a fish-bone diagram.
• A fish-bone diagram identifies a list of possible causes of a problem and sorts them into useful categories.
• How to use a fish-bone diagram:
- Agree on the problem statement.
- Brainstorm the major categories of causes of the problem, for example People, Process, Equipment, among others.
- Brainstorm all the possible causes of the problem. Ask “Why does this happen?” Categorise each idea into the appropriate group.
Equipment Process People
Environment ManagementMaterials
Secondary cause
Primary cause
Problem
Cause Effect
Figure3:Fish-bonediagramstructure
Fish-bone diagrams help identify possible causes of problems in a systematic manner.
8
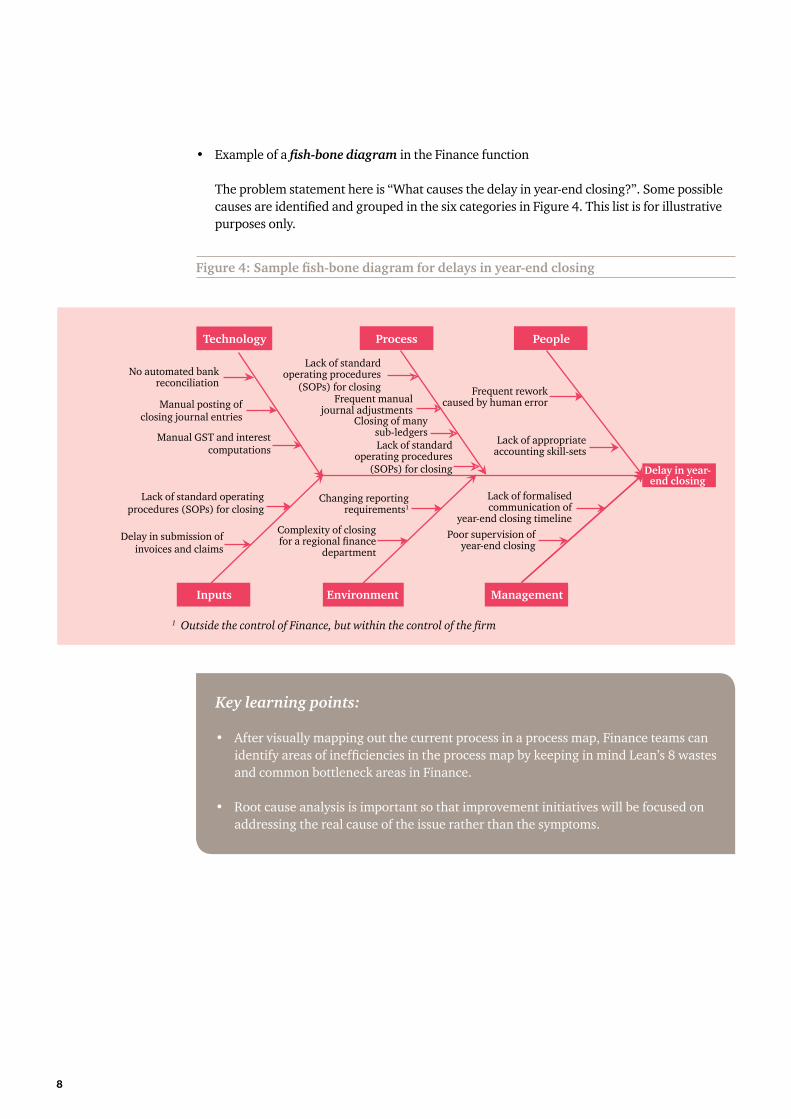
• Example of a fish-bone diagram in the Finance function
The problem statement here is “What causes the delay in year-end closing?”. Some possible causes are identified and grouped in the six categories in Figure 4. This list is for illustrative purposes only.
Key learning points:
• After visually mapping out the current process in a process map, Finance teams can identify areas of inefficiencies in the process map by keeping in mind Lean’s 8 wastes and common bottleneck areas in Finance.
• Root cause analysis is important so that improvement initiatives will be focused on addressing the real cause of the issue rather than the symptoms.
1 Outside the control of Finance, but within the control of the firm
Figure4:Samplefish-bonediagramfordelaysinyear-endclosing
Technology Process People
Delayinyear-endclosing
Inputs Environment Management
No automated bank reconciliation
Manual posting of closing journal entries
Manual GST and interest computations
Delay in submission of invoices and claims
Lack of standard operating procedures
(SOPs) for closingFrequent manual
journal adjustments
Changing reporting requirements1
Complexity of closing for a regional finance
department
Lack of standard operating procedures (SOPs) for closing
Closing of many sub-ledgers
Frequent rework caused by human error
Lack of appropriate accounting skill-sets
Poor supervision of year-end closing
Lack of formalised communication of
year-end closing timeline
Lack of standard operating procedures
(SOPs) for closing
Diagnosing ‘As-Is’ Issues 9
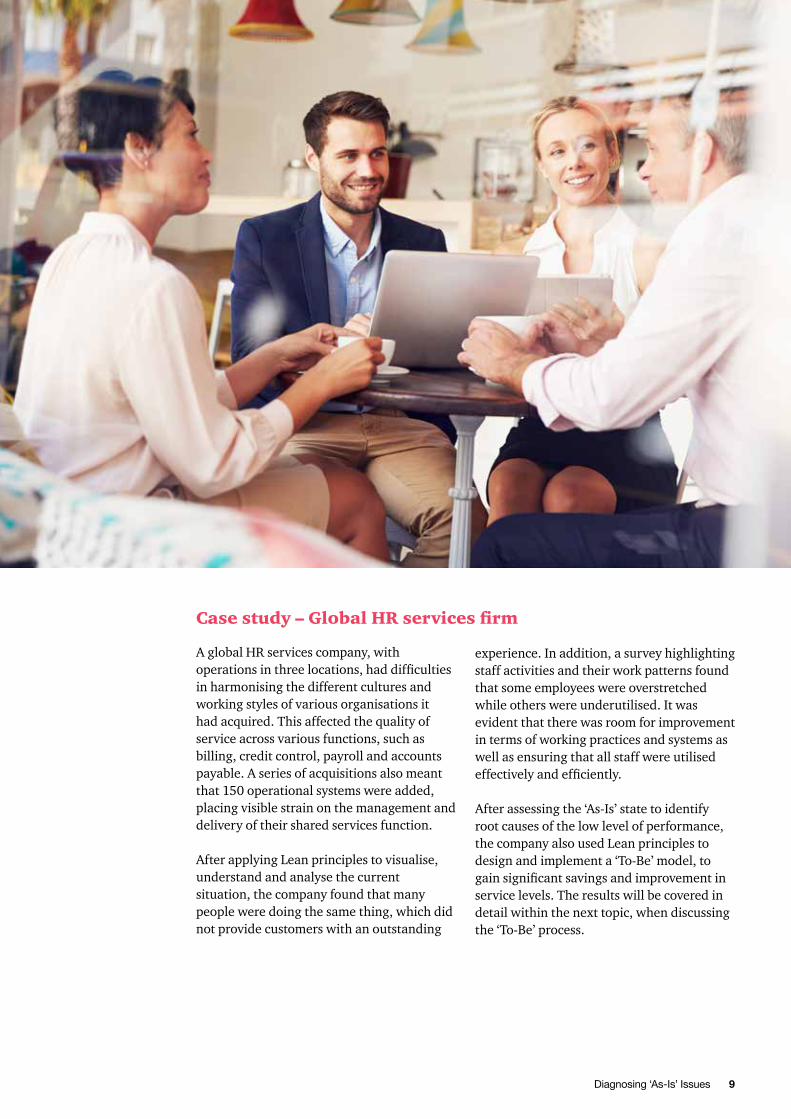
Case study – Global HR services firm
experience. In addition, a survey highlighting staff activities and their work patterns found that some employees were overstretched while others were underutilised. It was evident that there was room for improvement in terms of working practices and systems as well as ensuring that all staff were utilised effectively and efficiently.
After assessing the ‘As-Is’ state to identify root causes of the low level of performance, the company also used Lean principles to design and implement a ‘To-Be’ model, to gain significant savings and improvement in service levels. The results will be covered in detail within the next topic, when discussing the ‘To-Be’ process.
A global HR services company, with operations in three locations, had difficulties in harmonising the different cultures and working styles of various organisations it had acquired. This affected the quality of service across various functions, such as billing, credit control, payroll and accounts payable. A series of acquisitions also meant that 150 operational systems were added, placing visible strain on the management and delivery of their shared services function.
After applying Lean principles to visualise, understand and analyse the current situation, the company found that many people were doing the same thing, which did not provide customers with an outstanding

10
At a glance
There are three key considerations for organisations applying Lean to diagnose ‘As-Is’ issues in their Finance function:
• Before thinking about solutions, it is crucial to map out the entire value creation process in a process map and make areas of waste visible. Remember, “if you can see it, you can kill it”.
• Waste can exist anywhere in a process. Anything that does not create value, as defined by the customer, is considered waste.
• To make the process more efficient, the Finance team needs to identify the areas of inefficiencies or waste and conduct a root cause analysis to understand why those problems occur.

Diagnosing ‘As-Is’ Issues 11
Contacts
R Raghunathan Partner PwC Singapore
+65 6236 3258 [email protected]
Ivan Phuah Director PwC Singapore
+65 6236 3373 [email protected]
Melvin YongCountry Head – SingaporeCPA Australia +65 6671 [email protected]
This content is for general information purposes only, and should not be used as a substitute for consultation with professional advisors.
© 2016 PricewaterhouseCoopers Consulting (Singapore) Pte Ltd and CPA Australia Ltd. All rights reserved. In this document, “PwC” refers to PricewaterhouseCoopers Consulting (Singapore) Pte Ltd or, as the context requires, the PricewaterhouseCoopers global network or other member firms of the network, each of which is a separate legal entity.
Designing ‘To-Be’ Model and Implementation
4
2
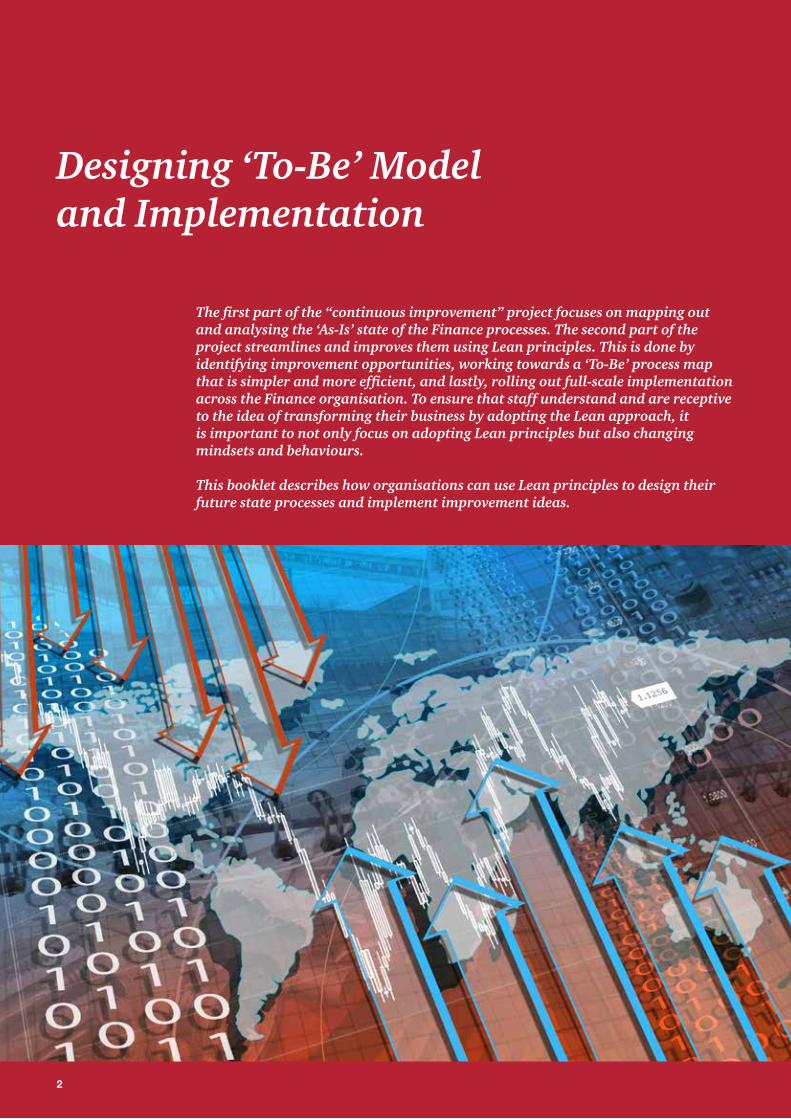
The first part of the “continuous improvement” project focuses on mapping out and analysing the ‘As-Is’ state of the Finance processes. The second part of the project streamlines and improves them using Lean principles. This is done by identifying improvement opportunities, working towards a ‘To-Be’ process map that is simpler and more efficient, and lastly, rolling out full-scale implementation across the Finance organisation. To ensure that staff understand and are receptive to the idea of transforming their business by adopting the Lean approach, it is important to not only focus on adopting Lean principles but also changing mindsets and behaviours.
This booklet describes how organisations can use Lean principles to design their future state processes and implement improvement ideas.
Designing ‘To-Be’ Model and Implementation
2
Designing ‘To-Be’ Model and Implementation 3
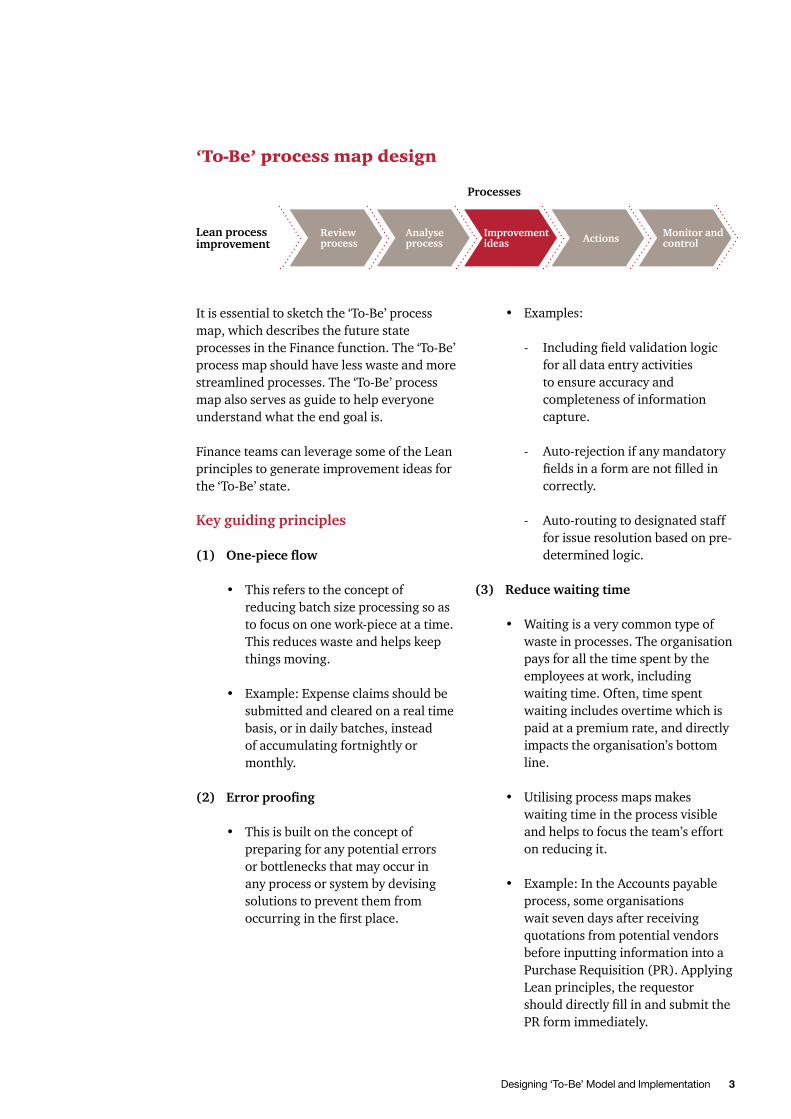
‘To-Be’ process map design
It is essential to sketch the ‘To-Be’ process map, which describes the future state processes in the Finance function. The ‘To-Be’ process map should have less waste and more streamlined processes. The ‘To-Be’ process map also serves as guide to help everyone understand what the end goal is.
Finance teams can leverage some of the Lean principles to generate improvement ideas for the ‘To-Be’ state.
Key guiding principles
(1) One-pieceflow
• This refers to the concept of reducing batch size processing so as to focus on one work-piece at a time. This reduces waste and helps keep things moving.
• Example: Expense claims should be submitted and cleared on a real time basis, or in daily batches, instead of accumulating fortnightly or monthly.
(2) Errorproofing
• This is built on the concept of preparing for any potential errors or bottlenecks that may occur in any process or system by devising solutions to prevent them from occurring in the first place.
• Examples:
- Including field validation logic for all data entry activities to ensure accuracy and completeness of information capture.
- Auto-rejection if any mandatory fields in a form are not filled in correctly.
- Auto-routing to designated staff for issue resolution based on pre-determined logic.
(3) Reducewaitingtime
• Waiting is a very common type of waste in processes. The organisation pays for all the time spent by the employees at work, including waiting time. Often, time spent waiting includes overtime which is paid at a premium rate, and directly impacts the organisation’s bottom line.
• Utilising process maps makes waiting time in the process visible and helps to focus the team’s effort on reducing it.
• Example: In the Accounts payable process, some organisations wait seven days after receiving quotations from potential vendors before inputting information into a Purchase Requisition (PR). Applying Lean principles, the requestor should directly fill in and submit the PR form immediately.
Reviewprocess
Analyseprocess
Improvementideas Actions Monitorand
controlLeanprocessimprovement
Processes
4
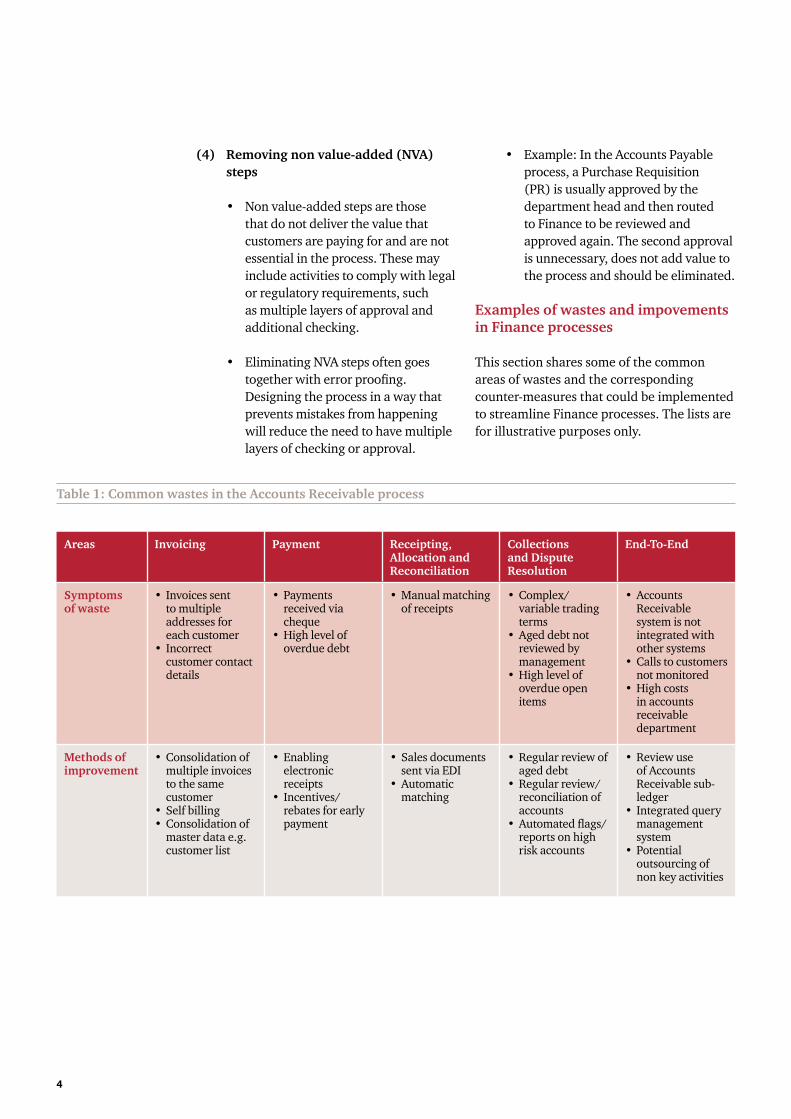
Table1:CommonwastesintheAccountsReceivableprocess
(4) Removingnonvalue-added(NVA)steps
• Non value-added steps are those that do not deliver the value that customers are paying for and are not essential in the process. These may include activities to comply with legal or regulatory requirements, such as multiple layers of approval and additional checking.
• Eliminating NVA steps often goes together with error proofing. Designing the process in a way that prevents mistakes from happening will reduce the need to have multiple layers of checking or approval.
• Example: In the Accounts Payable process, a Purchase Requisition (PR) is usually approved by the department head and then routed to Finance to be reviewed and approved again. The second approval is unnecessary, does not add value to the process and should be eliminated.
ExamplesofwastesandimpovementsinFinanceprocesses
This section shares some of the common areas of wastes and the corresponding counter-measures that could be implemented to streamline Finance processes. The lists are for illustrative purposes only.
Areas Invoicing Payment Receipting,AllocationandReconciliation
CollectionsandDisputeResolution
End-To-End
Symptoms ofwaste
• Invoices sent to multiple addresses for each customer
• Incorrect customer contact details
• Payments received via cheque
• High level of overdue debt
• Manual matching of receipts
• Complex/ variable trading terms
• Aged debt not reviewed by management
• High level of overdue open items
• Accounts Receivable system is not integrated with other systems
• Calls to customers not monitored
• High costs in accounts receivable department
Methodsofimprovement
• Consolidation of multiple invoices to the same customer
• Self billing• Consolidation of
master data e.g. customer list
• Enabling electronic receipts
• Incentives/ rebates for early payment
• Sales documents sent via EDI
• Automatic matching
• Regular review of aged debt
• Regular review/ reconciliation of accounts
• Automated flags/ reports on high risk accounts
• Review use of Accounts Receivable sub-ledger
• Integrated query management system
• Potential outsourcing of non key activities
Designing ‘To-Be’ Model and Implementation 5
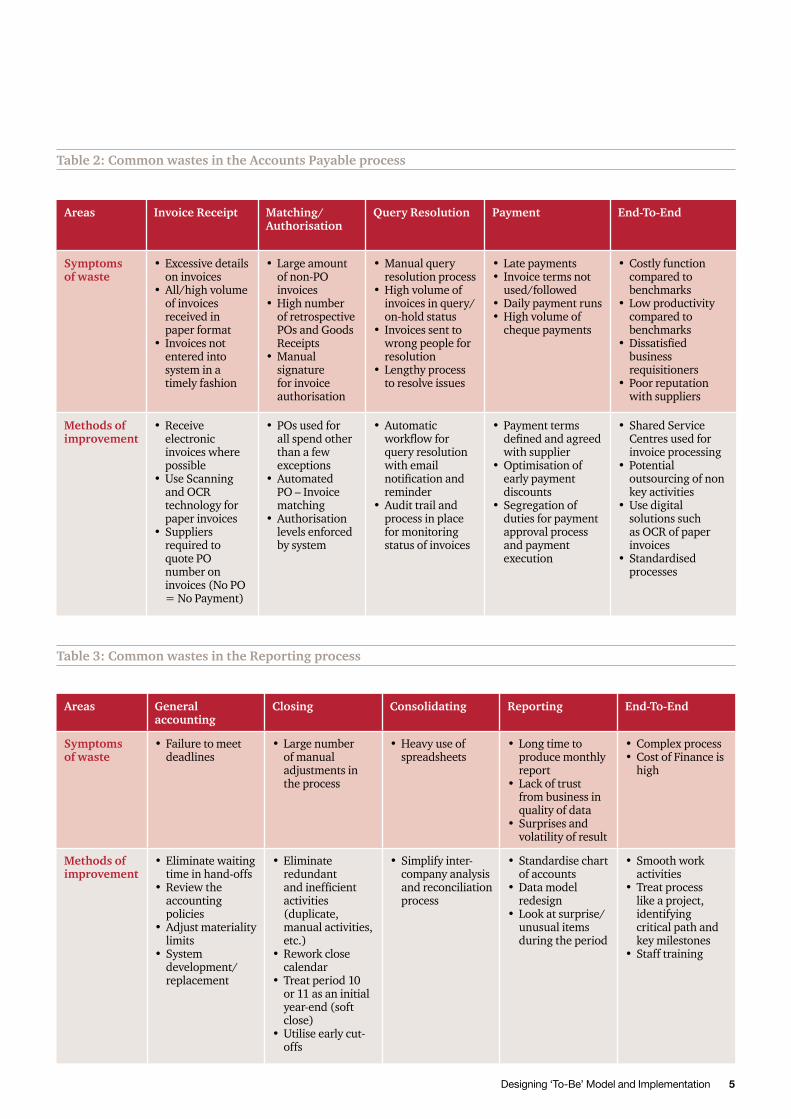
Table2:CommonwastesintheAccountsPayableprocess
Table3:CommonwastesintheReportingprocess
Areas InvoiceReceipt Matching/Authorisation
QueryResolution Payment End-To-End
Symptoms ofwaste
• Excessive details on invoices
• All/high volume of invoices received in paper format
• Invoices not entered into system in a timely fashion
• Large amount of non-PO invoices
• High number of retrospective POs and Goods Receipts
• Manual signature for invoice authorisation
• Manual query resolution process
• High volume of invoices in query/ on-hold status
• Invoices sent to wrong people for resolution
• Lengthy process to resolve issues
• Late payments• Invoice terms not
used/followed• Daily payment runs• High volume of
cheque payments
• Costly function compared to benchmarks
• Low productivity compared to benchmarks
• Dissatisfied business requisitioners
• Poor reputation with suppliers
Methodsofimprovement
• Receive electronic invoices where possible
• Use Scanning and OCR technology for paper invoices
• Suppliers required to quote PO number on invoices (No PO = No Payment)
• POs used for all spend other than a few exceptions
• Automated PO – Invoice matching
• Authorisation levels enforced by system
• Automatic workflow for query resolution with email notification and reminder
• Audit trail and process in place for monitoring status of invoices
• Payment terms defined and agreed with supplier
• Optimisation of early payment discounts
• Segregation of duties for payment approval process and payment execution
• Shared Service Centres used for invoice processing
• Potential outsourcing of non key activities
• Use digital solutions such as OCR of paper invoices
• Standardised processes
Areas Generalaccounting
Closing Consolidating Reporting End-To-End
Symptoms ofwaste
• Failure to meet deadlines
• Large number of manual adjustments in the process
• Heavy use of spreadsheets
• Long time to produce monthly report
• Lack of trust from business in quality of data
• Surprises and volatility of result
• Complex process• Cost of Finance is
high
Methodsofimprovement
• Eliminate waiting time in hand-offs
• Review the accounting policies
• Adjust materiality limits
• System development/ replacement
• Eliminate redundant and inefficient activities (duplicate, manual activities, etc.)
• Rework close calendar
• Treat period 10 or 11 as an initial year-end (soft close)
• Utilise early cut-offs
• Simplify inter-company analysis and reconciliation process
• Standardise chart of accounts
• Data model redesign
• Look at surprise/ unusual items during the period
• Smooth work activities
• Treat process like a project, identifying critical path and key milestones
• Staff training
6
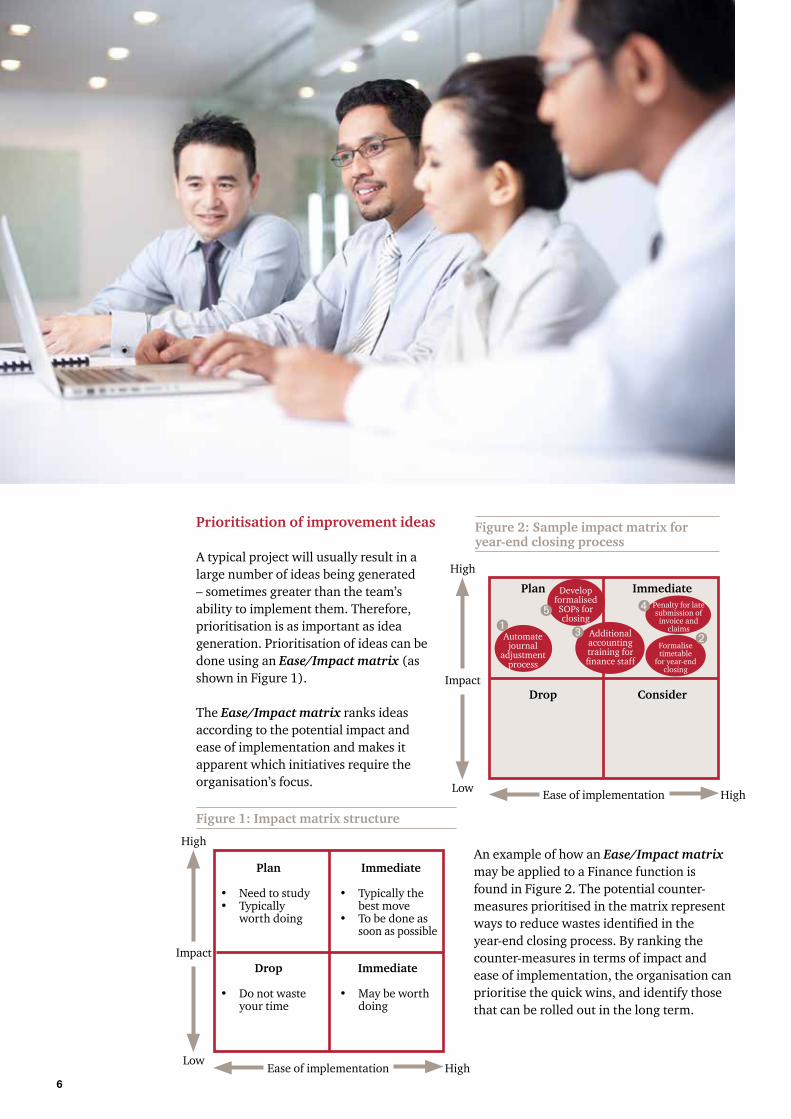
Prioritisationofimprovementideas
A typical project will usually result in a large number of ideas being generated – sometimes greater than the team’s ability to implement them. Therefore, prioritisation is as important as idea generation. Prioritisation of ideas can be done using an Ease/Impact matrix (as shown in Figure 1).
The Ease/Impact matrix ranks ideas according to the potential impact and ease of implementation and makes it apparent which initiatives require the organisation’s focus.
Plan
• Need to study• Typically
worth doing
Immediate
• Typically the best move
• To be done as soon as possible
Drop
• Do not waste your time
Immediate
• May be worth doing
Figure1:Impactmatrixstructure
An example of how an Ease/Impact matrix may be applied to a Finance function is found in Figure 2. The potential counter-measures prioritised in the matrix represent ways to reduce wastes identified in the year-end closing process. By ranking the counter-measures in terms of impact and ease of implementation, the organisation can prioritise the quick wins, and identify those that can be rolled out in the long term.
Plan Immediate
Drop Consider
High
Impact
Low Ease of implementation High
Automate journal
adjustment process
ÊFormalise timetable
for year-end closing
Ë
Penalty for late submission of
invoice and claims
Í
Additional accounting training for finance staff
Ì
Develop formalised
SOPs for closing
Î
Figure2:Sampleimpactmatrixforyear-endclosingprocess
High
Impact
LowEase of implementation High
Designing ‘To-Be’ Model and Implementation 7
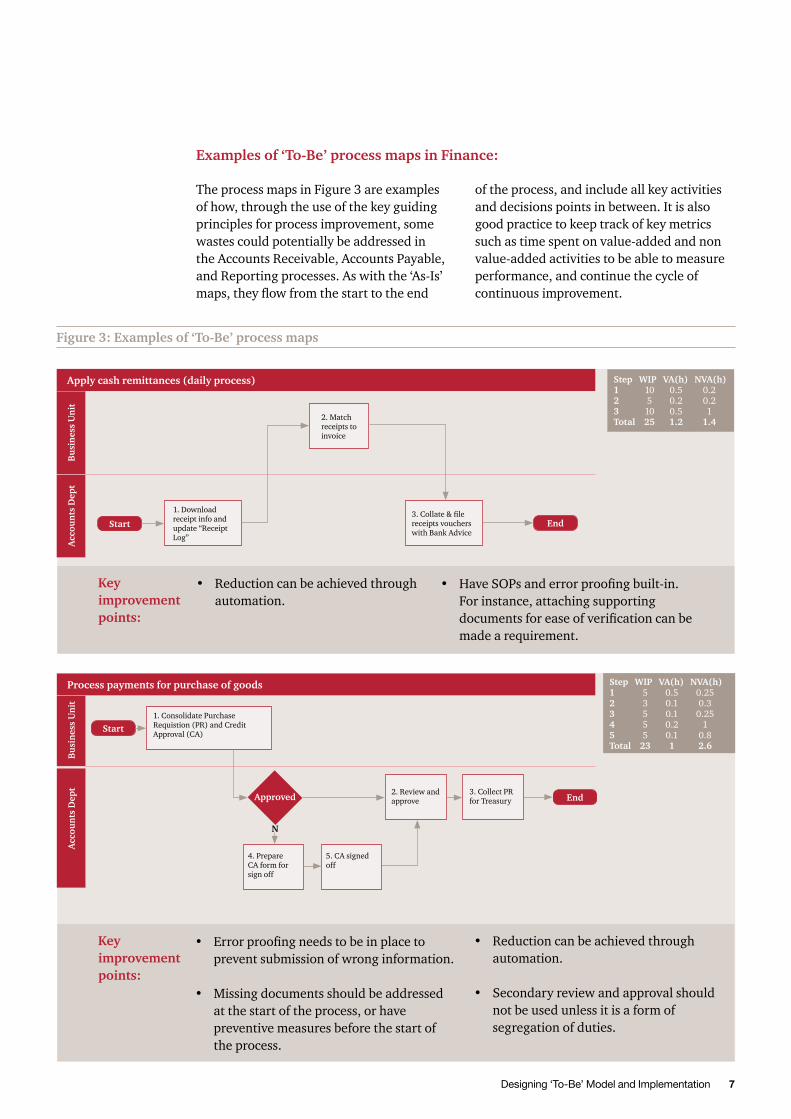
Key improvementpoints:
Examplesof‘To-Be’processmapsinFinance:
The process maps in Figure 3 are examples of how, through the use of the key guiding principles for process improvement, some wastes could potentially be addressed in the Accounts Receivable, Accounts Payable, and Reporting processes. As with the ‘As-Is’ maps, they flow from the start to the end
• Reduction can be achieved through automation.
Figure3:Examplesof‘To-Be’processmaps
• Have SOPs and error proofing built-in. For instance, attaching supporting documents for ease of verification can be made a requirement.
• Error proofing needs to be in place to prevent submission of wrong information.
• Missing documents should be addressed at the start of the process, or have preventive measures before the start of the process.
• Reduction can be achieved through automation.
• Secondary review and approval should not be used unless it is a form of segregation of duties.
2. Match receipts to invoice
1. Download receipt info and update “Receipt Log”
3. Collate & file receipts vouchers with Bank Advice
Start End
Applycashremittances(dailyprocess) StepWIPVA(h)NVA(h)1 10 0.5 0.22 5 0.2 0.23 10 0.5 1Total 25 1.2 1.4
BusinessUnit
AccountsDept
4. Prepare CA form for sign off
1. Consolidate Purchase Requistion (PR) and Credit Approval (CA)
Start
End
Processpaymentsforpurchaseofgoods StepWIPVA(h)NVA(h)1 5 0.5 0.252 3 0.1 0.33 5 0.1 0.254 5 0.2 15 5 0.1 0.8Total 23 1 2.6
BusinessUnit
AccountsDept 2. Review and
approve
5. CA signed off
3. Collect PR for TreasuryApproved
N
Key improvementpoints:
of the process, and include all key activities and decisions points in between. It is also good practice to keep track of key metrics such as time spent on value-added and non value-added activities to be able to measure performance, and continue the cycle of continuous improvement.
8
Key improvementpoints:
Key learning points:
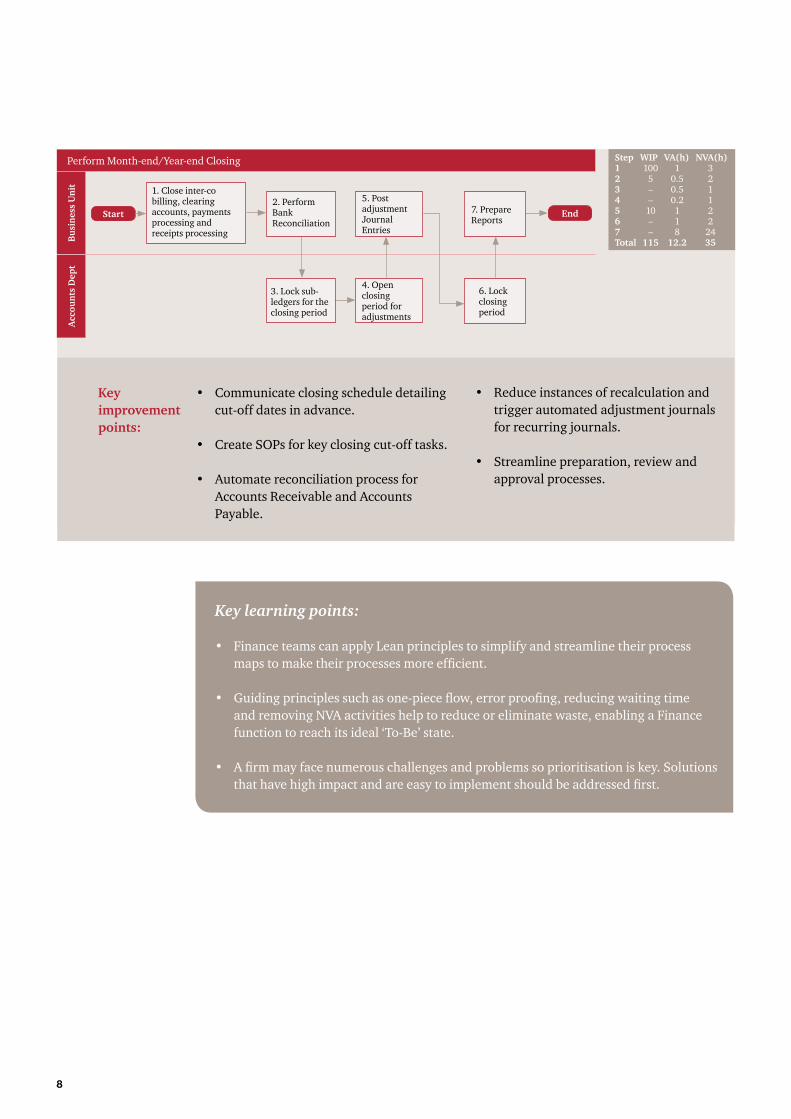
• Finance teams can apply Lean principles to simplify and streamline their process maps to make their processes more efficient.
• Guiding principles such as one-piece flow, error proofing, reducing waiting time and removing NVA activities help to reduce or eliminate waste, enabling a Finance function to reach its ideal ‘To-Be’ state.
• A firm may face numerous challenges and problems so prioritisation is key. Solutions that have high impact and are easy to implement should be addressed first.
• Communicate closing schedule detailing cut-off dates in advance.
• Create SOPs for key closing cut-off tasks.
• Automate reconciliation process for Accounts Receivable and Accounts Payable.
• Reduce instances of recalculation and trigger automated adjustment journals for recurring journals.
• Streamline preparation, review and approval processes.
3. Lock sub-ledgers for the closing period
1. Close inter-co billing, clearing accounts, payments processing and receipts processing
Start End
Perform Month-end/Year-end Closing StepWIPVA(h)NVA(h)1 100 1 32 5 0.5 23 – 0.5 14 – 0.2 15 10 1 26 – 1 27 – 8 24Total 115 12.2 35B
usinessUnit
AccountsDept
7. Prepare Reports
4. Open closing period for adjustments
6. Lock closing period
2. Perform Bank Reconciliation
5. Post adjustment Journal Entries
Designing ‘To-Be’ Model and Implementation 9
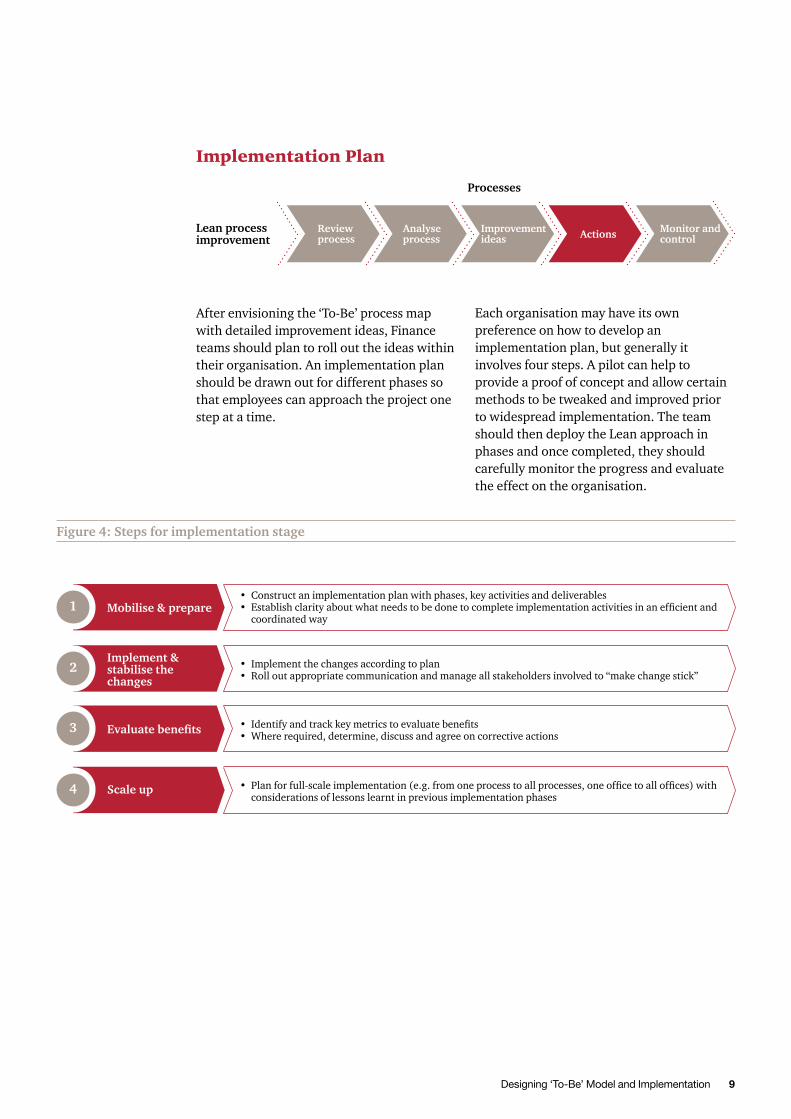
Implementation Plan
After envisioning the ‘To-Be’ process map with detailed improvement ideas, Finance teams should plan to roll out the ideas within their organisation. An implementation plan should be drawn out for different phases so that employees can approach the project one step at a time.
Each organisation may have its own preference on how to develop an implementation plan, but generally it involves four steps. A pilot can help to provide a proof of concept and allow certain methods to be tweaked and improved prior to widespread implementation. The team should then deploy the Lean approach in phases and once completed, they should carefully monitor the progress and evaluate the effect on the organisation.
Figure4:Stepsforimplementationstage
Reviewprocess
Analyseprocess
Improvementideas Actions Monitorand
controlLeanprocessimprovement
Processes
1• Construct an implementation plan with phases, key activities and deliverables• Establish clarity about what needs to be done to complete implementation activities in an efficient and
coordinated way Mobilise&prepare
2 • Implement the changes according to plan• Roll out appropriate communication and manage all stakeholders involved to “make change stick”
Implement&stabilisethechanges
3 • Identify and track key metrics to evaluate benefits• Where required, determine, discuss and agree on corrective actionsEvaluatebenefits
4 • Plan for full-scale implementation (e.g. from one process to all processes, one office to all offices) with considerations of lessons learnt in previous implementation phases
Scaleup
10
Key learning points:
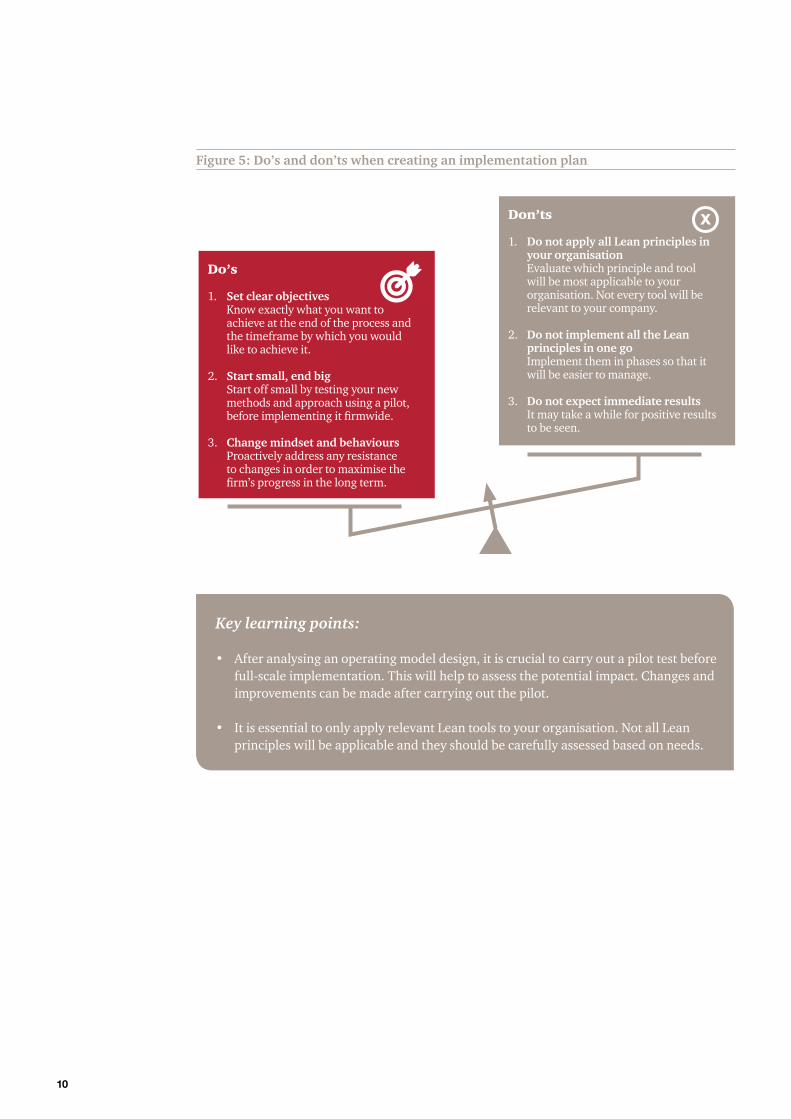
• After analysing an operating model design, it is crucial to carry out a pilot test before full-scale implementation. This will help to assess the potential impact. Changes and improvements can be made after carrying out the pilot.
• It is essential to only apply relevant Lean tools to your organisation. Not all Lean principles will be applicable and they should be carefully assessed based on needs.
Figure5:Do’sanddon’tswhencreatinganimplementationplan
Do’s
1. Setclearobjectives Know exactly what you want to
achieve at the end of the process and the timeframe by which you would like to achieve it.
2. Startsmall,endbig Start off small by testing your new
methods and approach using a pilot, before implementing it firmwide.
3. Changemindsetandbehaviours Proactively address any resistance
to changes in order to maximise the firm’s progress in the long term.
Don’ts
1. DonotapplyallLeanprinciplesinyourorganisation
Evaluate which principle and tool will be most applicable to your organisation. Not every tool will be relevant to your company.
2. DonotimplementalltheLeanprinciplesinonego
Implement them in phases so that it will be easier to manage.
3. Donotexpectimmediateresults It may take a while for positive results
to be seen.
x
s
Designing ‘To-Be’ Model and Implementation 11
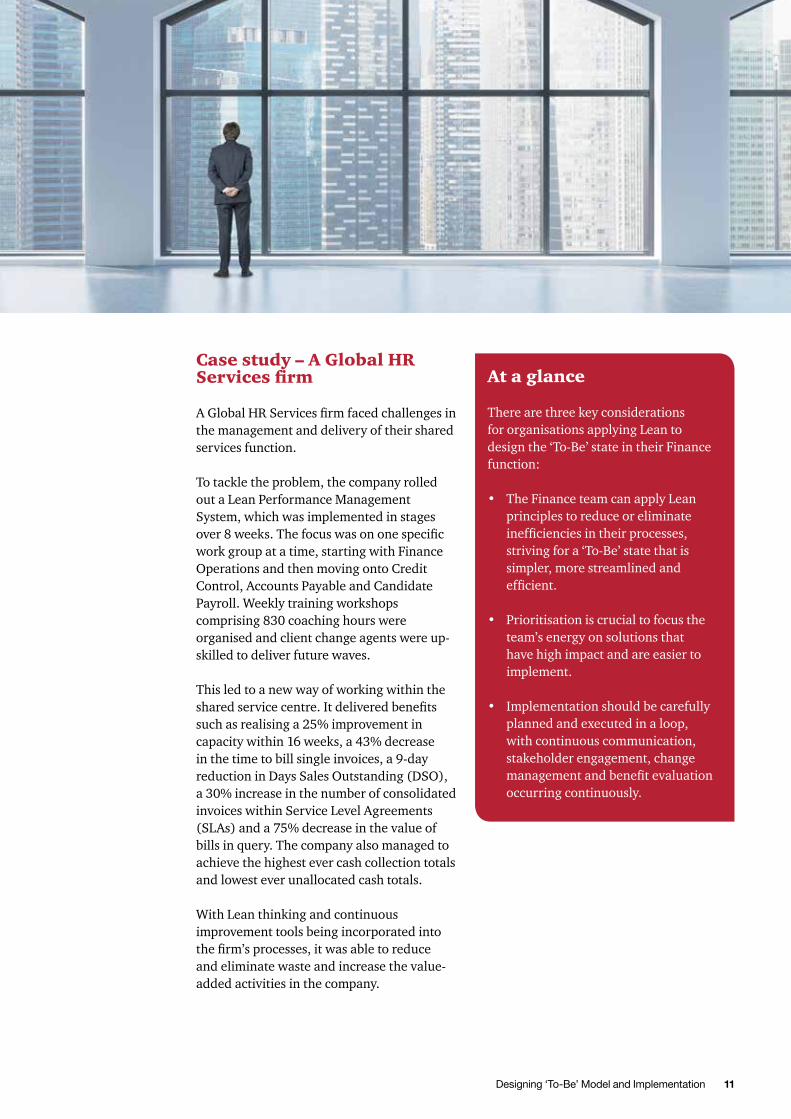
Case study – A Global HR Services firm
A Global HR Services firm faced challenges in the management and delivery of their shared services function.
To tackle the problem, the company rolled out a Lean Performance Management System, which was implemented in stages over 8 weeks. The focus was on one specific work group at a time, starting with Finance Operations and then moving onto Credit Control, Accounts Payable and Candidate Payroll. Weekly training workshops comprising 830 coaching hours were organised and client change agents were up-skilled to deliver future waves.
This led to a new way of working within the shared service centre. It delivered benefits such as realising a 25% improvement in capacity within 16 weeks, a 43% decrease in the time to bill single invoices, a 9-day reduction in Days Sales Outstanding (DSO), a 30% increase in the number of consolidated invoices within Service Level Agreements (SLAs) and a 75% decrease in the value of bills in query. The company also managed to achieve the highest ever cash collection totals and lowest ever unallocated cash totals.
With Lean thinking and continuous improvement tools being incorporated into the firm’s processes, it was able to reduce and eliminate waste and increase the value-added activities in the company.
At a glance
There are three key considerations for organisations applying Lean to design the ‘To-Be’ state in their Finance function:
• The Finance team can apply Lean principles to reduce or eliminate inefficiencies in their processes, striving for a ‘To-Be’ state that is simpler, more streamlined and efficient.
• Prioritisation is crucial to focus the team’s energy on solutions that have high impact and are easier to implement.
• Implementation should be carefully planned and executed in a loop, with continuous communication, stakeholder engagement, change management and benefit evaluation occurring continuously.
Contacts
R Raghunathan Partner PwC Singapore
+65 6236 3258 [email protected]
Ivan Phuah Director PwC Singapore
+65 6236 3373 [email protected]
Melvin YongCountry Head – SingaporeCPA Australia +65 6671 [email protected]
This content is for general information purposes only, and should not be used as a substitute for consultation with professional advisors.
© 2016 PricewaterhouseCoopers Consulting (Singapore) Pte Ltd and CPA Australia Ltd. All rights reserved. In this document, “PwC” refers to PricewaterhouseCoopers Consulting (Singapore) Pte Ltd or, as the context requires, the PricewaterhouseCoopers global network or other member firms of the network, each of which is a separate legal entity.
Control and Sustainability5
2 2
Lean not only streamlines and improves process efficiency but, more importantly, also sustains the positive changes by embedding a culture of continuous improvement in the Finance function. This sustainability is achieved by developing standard practices and providing training for people at all levels.
This booklet describes how organisations can create sustainable change by changing the culture and maximising the benefits of Lean.
Control and Sustainability
Control and Sustainability 3
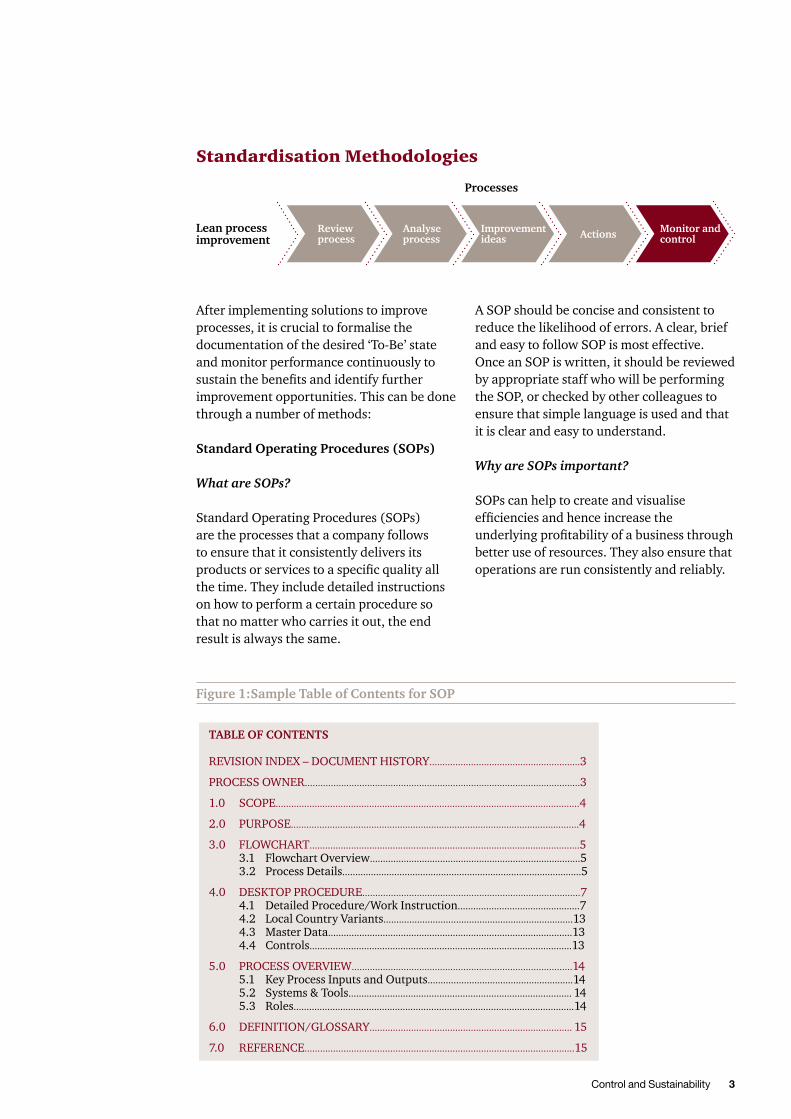
After implementing solutions to improve processes, it is crucial to formalise the documentation of the desired ‘To-Be’ state and monitor performance continuously to sustain the benefits and identify further improvement opportunities. This can be done through a number of methods:
Standard Operating Procedures (SOPs)
What are SOPs?
Standard Operating Procedures (SOPs) are the processes that a company follows to ensure that it consistently delivers its products or services to a specific quality all the time. They include detailed instructions on how to perform a certain procedure so that no matter who carries it out, the end result is always the same.
A SOP should be concise and consistent to reduce the likelihood of errors. A clear, brief and easy to follow SOP is most effective. Once an SOP is written, it should be reviewed by appropriate staff who will be performing the SOP, or checked by other colleagues to ensure that simple language is used and that it is clear and easy to understand.
Why are SOPs important?
SOPs can help to create and visualise efficiencies and hence increase the underlying profitability of a business through better use of resources. They also ensure that operations are run consistently and reliably.
Standardisation Methodologies
Figure 1:Sample Table of Contents for SOP
Review process
Analyse process
Improvement ideas Actions Monitor and
controlLean process improvement
Processes
TABLE OF CONTENTS
REVISION INDEX – DOCUMENT HISTORY..........................................................3
PROCESS OWNER..........................................................................................................3
1.0 SCOPE.....................................................................................................................4
2.0 PURPOSE...............................................................................................................4
3.0 FLOWCHART........................................................................................................5 3.1 Flowchart Overview.................................................................................5 3.2 Process Details............................................................................................5
4.0 DESKTOP PROCEDURE....................................................................................7 4.1 Detailed Procedure/Work Instruction...............................................7 4.2 Local Country Variants.........................................................................13 4.3 Master Data..............................................................................................13 4.4 Controls.....................................................................................................13
5.0 PROCESS OVERVIEW.....................................................................................14 5.1 Key Process Inputs and Outputs........................................................14 5.2 Systems & Tools...................................................................................... 14 5.3 Roles............................................................................................................14
6.0 DEFINITION/GLOSSARY.............................................................................. 15
7.0 REFERENCE........................................................................................................15
4
Performance dashboards
Performance dashboards are commonly used to monitor and gauge the progress of a company, function or team. Using graphs and data visualisation, dashboards help to simplify complex data so that the audience is able to digest the information and assess the progress made at a glance. Dashboards can come in all forms such as tables, bar charts, line graphs, among others.
Performance dashboards can be generated using different tools. Smaller-scale Finance teams use Excel as a starting point to prepare aggregated reports and insightful graphs that assist in decision making. Although Excel is simple and cheap, its functionality is limited especially for big organisations with larger volumes of data.
Some third-party providers offer a wide variety of management reporting tools that can pull data from different sources and run complex analyses.
Key learning points:
• A Standard Operating Procedure should include clear, step-by-step instructions on how to carry out key steps within a process.
• SOPs help to increase efficiency, consistency and reliability of the operation of the process.
• Performance dashboards are management tools that can be used to monitor the progress through key performance indicators that measure the achievement of goals.
Control and Sustainability 5
Improving the Finance function is not just about implementing a series of process improvement projects and tools, but is more about driving sustainable results by building capabilities and an effective continuous improvement culture. This can be done if the Finance team adopts the following key principles:
(1) Long term vision of continuous improvement
For benefits to be sustainable, process improvement should be seen as a long term programme. The Finance function should develop a culture of learning and improvement so that employees are receptive and supportive of positive changes. Ongoing coaching and mentoring play a huge role in the success of Lean and developing capabilities. Educating employees does not work by sending them to a one-off training session. Continuous improvement requires ongoing relevant education in order for the entire workforce to be constantly learning and be equipped with the relevant skills to make the Finance function better.
To achieve these objectives, leading organisations organise regular continuous improvement workshops to focus their resources on improving a particular area. These workshops are usually conducted by an experienced facilitator with requisite skills and experiences, and with participants being the process owners within the focus area. This is an avenue for employees to not only make positive impact on their organisation but also gain valuable Lean skill sets and experience.
(2) Benchmarking and learning from industry best practices
Benchmarking is a common exercise to establish baselines, define best practices in industry and identify improvement opportunities for an organisation. Finance functions can use benchmarking to gauge their success and pinpoint shortcomings. This is a very useful tool in determining the ‘As-Is’ processes, and identify how the potential gains in the ‘To-Be’ state can be realised.
The general process of benchmarking involves identifying a focus area and selecting competitors, usually within a similar industry and/or similar size and maturity, who are leaders in the focus area. The next step is obtaining data on their performance which can either be through publicly available information or from a third-party provider with relevant experience. The final step is to identify the best practices to determine necessary changes within the organisation to achieve the benefits.
Successful companies incorporate benchmarking into their culture by enagaging key decision makers and personnel throughout the process, and bringing in external expertise where necessary.
(3) Leadership commitment
It is crucial that the organisation understands Lean thinking and how it brings value to the Finance function. This requires the full commitment of the organisation’s leaders to become role models and exemplify Lean philosophy through their own behaviour. Employees will follow the example of their leaders. If the leaders are not fully committed to the Lean initiative, employees would not be on board either. It has been shown that when the leadership is clearly committed to the change initiative, change adoption rates increase.
Creating a “continuous improvement” culture
6
(4) Emphasis on customer value
Customer value should drive every activity in the Finance function. Anything that does not create value that customers are willing to pay for should be considered waste and should be eliminated or minimised. One way organisations can go about doing this is by making the customer everyone’s business. Employees’ KPIs should be closely linked to key metrics that drive customer value. This helps to create a sense of ownership within the firm and employees will then be more willing and motivated to adopt Lean tools and methods and reduce inefficient processes.
(5) Change management to ‘make change stick’
A ‘continuous improvement’ culture means employees need to constantly adjust to adopt new practices and behaviours. To achieve and sustain transformational changes, companies need to consider various people-oriented elements of the future organisation. This includes employee value propositions, individual and team roles, as well as required competencies, skills, and behaviours. Performance management, learning and development, and workforce (planning and retention) strategies are key enablers of a successful change programme. Successful organisations view changes not as one-off events but as a continuous journey. They embed the change in their culture, make sure that it sticks and adopt the lessons learnt to implement in the next wave of change.
Key learning points:
• For a company to see the benefits of continuous improvement, it is important to develop and cultivate a Lean culture within the organisation.
• Continuous improvement requires the full commitment and support of top management.
• Continuous training and capabilities building is a must to see the positive impact of the Lean approach.
• Companies should take into account best practices and lessons learnt from benchmarking exercises to identify improvement opportunities.
• Customer value should always be the key focus and should be directly linked to employees’ KPIs.
• A comprehensive change management programme should be in place to make sure that changes put in place are maintained.
Control and Sustainability 7
Case study – Retail Bank
A retail bank was faced with the challenge of operating in a highly cost-constrained environment. Inconsistent ways of working, a lack of visibility of workload and capacity, and limited problem-solving ability had led to wide variances in productivity across departments and a need for significant improvement in operational capabilities.
Through a journey over 12 weeks involving managers and team leaders in weekly learning sessions and capability building, the team addressed issues of work queues across processes. Cross-functional team members used problem-solving techniques to develop solutions which allowed them to create a standard process. This ensured the best way of working was used consistently across the end-to-end process.
As part of a continuous process improvement initiative, the bank closely monitored its key metrics to keep track of progress and evaluate the benefits realised.
Apart from focusing on key metrics, the bank also conducted weekly coaching sessions with managers and team leaders to work with their teams to design and implement continuous improvement initiatives. A new culture was observed within the team – team members challenged each other more, were more involved in the business, and maintained a more stable performance level.
At a glance
• Standard Operating Procedures and performance dashboards are standard methodologies that are used to ensure consistent quality.
• Finance functions can only achieve sustainable benefits if they adopt Lean thinking and continuous improvement as a “way of life”. Continuous improvement should have the full commitment from top management and these initiatives should be embedded in every employee’s day-to-day work.
• Building capability through training and coaching employees is key for knowledge transfer and ensuring the sustainability of the new ways of working.
Contacts
R Raghunathan Partner PwC Singapore
+65 6236 3258 [email protected]
Ivan Phuah Director PwC Singapore
+65 6236 3373 [email protected]
Melvin YongCountry Head – SingaporeCPA Australia +65 6671 [email protected]
This content is for general information purposes only, and should not be used as a substitute for consultation with professional advisors.
© 2016 PricewaterhouseCoopers Consulting (Singapore) Pte Ltd and CPA Australia Ltd. All rights reserved. In this document, “PwC” refers to PricewaterhouseCoopers Consulting (Singapore) Pte Ltd or, as the context requires, the PricewaterhouseCoopers global network or other member firms of the network, each of which is a separate legal entity.