© 2013 craig robert dixon - university of...
TRANSCRIPT
1
THE WIND RESISTANCE OF ASPHALT ROOFING SHINGLES
By
CRAIG ROBERT DIXON
A DISSERTATION PRESENTED TO THE GRADUATE SCHOOL OF THE UNIVERSITY OF FLORIDA IN PARTIAL FULFILLMENT
OF THE REQUIREMENTS FOR THE DEGREE OF DOCTOR OF PHILOSOPHY
UNIVERSITY OF FLORIDA
2013
2
© 2013 Craig Robert Dixon

3
To my Mom

4
ACKNOWLEDGMENTS
First and foremost, I would like to thank my advisors, Drs. David O. Prevatt,
Forrest J. Masters, and Kurtis R. Gurley for their guidance, support, and friendship. This
work would not have been accomplished without their mentoring. I would also like to
thank my external committee member – Dr. Bhavani Sankar.
Additionally, I would like to thank my friends in the wind engineering group for
their help in various aspects of my research, especially: Dany Romero, Kenton McBride,
Daniel Smith, Scott Bolton, David Roueche, Alon Krathammer, Tuan Vo, and Peter
Datin. I would also like to thank the research oversight committee for their valuable
input, especially: Dr. Jon Peterka, Tom Smith, Dr. Ben Thomas, and Dr. Walt Rossiter.
Finally, I wish to thank my mom for being a source of intelligence and strength.
The financial support for this research is gratefully acknowledged from the
Southeast Region Research Initiative under grant #10031592 – Residential Roof
Covering Investigation of Wind Resistance of Asphalt Shingles. I am also grateful to the
financial support of the Florida Building Commission and Florida Department of
Emergency Management.
5
TABLE OF CONTENTS page
ACKNOWLEDGMENTS .................................................................................................. 4
LIST OF TABLES ............................................................................................................ 8
LIST OF FIGURES ........................................................................................................ 10
ABSTRACT ................................................................................................................... 14
CHAPTER
1 INTRODUCTION .................................................................................................... 16
Knowledge Gaps in the Wind Resistance of Asphalt Shingles ............................... 18 Research Goals and Scope .................................................................................... 19
Research Impacts ................................................................................................... 21 Layout of the Dissertation ....................................................................................... 22
2 ASPHALT SHINGLE COMPOSITION AND INSTALLATION ................................. 24
Shingle Composition ............................................................................................... 24 Reinforcement Mat ........................................................................................... 26
Asphalt Coating ................................................................................................ 26 Roofing Granules ............................................................................................. 27
Sealant Strip ..................................................................................................... 28 Fasteners ......................................................................................................... 31 Underlayment ................................................................................................... 31
Three-tab Shingles ........................................................................................... 33 Laminate Shingles ............................................................................................ 33
Asphalt Shingle Installation ..................................................................................... 34
3 LITERATURE REVIEW .......................................................................................... 43
The Early Years (1893 – 1950) ............................................................................... 43
Development of the First Test Standards for Wind Resistance (1950 – 1980) ....... 45 The Development of the Asphalt Shingle Wind Uplift Model (1980-1997) .............. 50 The Modern Era (1997- ) ........................................................................................ 61
The ASTM D6381 Asphalt Shingle Mechanical Uplift Resistance Test Method .......................................................................................................... 61
In-Service Wind Performance of Asphalt Shingles ........................................... 64
4 UNSEALED NATURALLY AGED ASPHALT SHINGLES AND THEIR VULNERABILITY IN WIND ..................................................................................... 68
Study 1: Survey of Naturally Aged Shingle Roofs for Unsealed Shingles ............... 68
6
Survey Method ................................................................................................. 70
Potential for Wind Induced Loss of Shingle Sealing ......................................... 70 Survey Results ................................................................................................. 72
Shingles in the field of the roof ................................................................... 72 Ridge and hip shingles ............................................................................... 78
Study 2: Full-Scale Testing of Asphalt Shingle Roof Systems ................................ 80 Experimental Design ........................................................................................ 80 Wind Test Sequence and Boundary Layer Simulation ..................................... 82
Results ............................................................................................................. 84 Pre-wind test unsealed shingle surveys ..................................................... 84 Wind performance of shingles installed in the field of the roof ................... 85 Hip shingle wind performance .................................................................... 88
Discussion ........................................................................................................ 90
5 WIND RESISTANCE OF NATURALLY AND ARTIFICIALLY AGED ASPHALT SHINGLES .............................................................................................................. 92
Aging of Asphalt Shingles ....................................................................................... 92
Research Objectives ............................................................................................... 94 Study 1: Wind Uplift Capacity of Asphalt Shingles Subjected to Artificial Aging ..... 96
Experimental Setup .......................................................................................... 96
Shingle specimen specifications ................................................................ 96 Thermal aging – chamber specifications and protocol ............................... 96
UV-Thermal-Water aging – chamber specifications and protocol .............. 98 ASTM D6381 Mechanical Uplift Test Procedure ...................................... 102
Results ........................................................................................................... 104
ASTM D6381 Procedures A and B uplift resistance ................................. 104 Failure modes in uplifted shingles ............................................................ 108
ASTM D7158 total wind uplift resistance ................................................. 112 Discussion ...................................................................................................... 114
Study 2: Naturally Aged Shingle Wind Uplift Resistance ...................................... 116 Test Sites ....................................................................................................... 116 Portable Mechanical Uplift Apparatus ............................................................ 117
In Situ ASTM D6381 Specimen Preparation and Test Procedure .................. 117 Results ........................................................................................................... 119
In situ ASTM D6381 mechanical uplift resistance .................................... 119 Failure modes .......................................................................................... 120 ASTM D7158 total wind uplift resistance ................................................. 121
Discussion ...................................................................................................... 122
Discussion of Combined Results .......................................................................... 123
6 THREE-DIMENSIONAL MEASUREMENTS OF WIND FORCE ON ASPHALT SHINGLE SEALANT STRIPS WITH FULL AND PARTIAL ADHESION ............... 125
Knowledge Gaps .................................................................................................. 126 Wind Load Model and Load Path ................................................................... 126
Partially Unsealed Shingles ............................................................................ 128
7
Experimental Setup .............................................................................................. 129
Concept .......................................................................................................... 129 Test Apparatus ............................................................................................... 130
Introduction .............................................................................................. 130 Componentry ........................................................................................... 131
Test Specimens .............................................................................................. 134 Test Deck Specifications ................................................................................ 136 Multi-Axis Load Cell Specifications ................................................................. 139
Velocity Sensor Specifications ....................................................................... 142 Test Specimen Installation ............................................................................. 143 Experimental Procedure ................................................................................. 147
Results .................................................................................................................. 149 Phase I: Wind Field Above the Test Specimen .............................................. 149
Mean longitudinal velocity ........................................................................ 149 Longitudinal turbulence intensity .............................................................. 151
Discussion on Turbulence .............................................................................. 153
Static Pressure ............................................................................................... 154 Phase II: Effect of Static Pressure on Shingle Test Specimens ..................... 155 Phase III: Wind-Induced Forces and Moments on the Shingle’s Sealant
Strip ............................................................................................................. 157 Data processing ....................................................................................... 157
Fully sealed shingle results – mean forces and moments ........................ 159 Fully sealed shingle results – force coefficients ....................................... 163 Partially unsealed shingle results – measured forces and moments ........ 166
Partially unsealed shingle results – interfacial forces ............................... 170 Partially unsealed shingle results – force coefficients .............................. 174
Discussion ............................................................................................................ 176 Significant Findings ............................................................................................... 178
7 CONCLUSIONS AND RECOMMENDATIONS ..................................................... 181
Conclusions on the Causes of Wind Damaged Asphalt Shingle Roofing.............. 181 Partially Unsealed Shingles ............................................................................ 181
Effect of Aging on Wind Resistance ............................................................... 183 ASTM D7158 and the Load Model for Asphalt Shingles ................................ 185 ASTM D7158 Design Methodology ................................................................ 186 Eave and Rake ............................................................................................... 187
Recommendations for Future Research ............................................................... 187
LIST OF REFERENCES ............................................................................................. 189
BIOGRAPHICAL SKETCH .......................................................................................... 197
8
LIST OF TABLES
Table page 1-1 Oversight committee members ........................................................................... 22
2-1 Wind classification required for asphalt shingle installed in Florida .................... 36
3-1 Wind-tunnel-measured three-tab shingle with cutouts ................................ 58
3-2 Summary of standardized test methods to evaluate asphalt shingle wind performance ....................................................................................................... 64
4-1 Estimates of peak instantaneous velocity near the roof plane at each survey location ............................................................................................................... 73
4-2 Wind test sequence duration, wind speeds, and turbulence intensities .............. 83
5-1 Exposure times where ASTM D6381 tests were performed ............................... 98
5-2 Mean resistance in Thermal and UV-Thermal-Water methods ......................... 108
5-3 Specimen dimensions, ASTM D7158 differential pressure coefficients, and ASTM D7158 required resistance. .................................................................... 113
5-4 Mean and lowest measured wind uplift resistance vs. ASTM D7158 Class H required wind resistance. .................................................................................. 114
5-5 Test site location, age, type, and quantity of ASTM D6381 tests ..................... 116
5-6 Test site differential pressure coefficients, length dimensions, and ASTM D7158 Class H required wind uplift resistance. ................................................ 121
6-1 Test specimen ID, type, planform dimensions, and number of specimens ....... 135
6-2 Test specimens’ exposed lengths and ASTM D7158 differential pressure coefficients........................................................................................................ 136
6-3 Force coefficients and relative contribution of ASTM D6381 Procedures A and B to total uplift ............................................................................................ 137
6-4 Six-axis load cell sensing ranges and resolutions ............................................ 140
6-5 Longitudinal integral length scales measured 12 mm above shingle surface ... 153
6-6 Mean forces and moments measured on fully sealed Laminate specimens ..... 160
6-7 Mean forces and moments measured on fully sealed Three-Tab specimens ... 162
9
6-8 Laminate force coefficients directly measured vs. ASTM D7158 predicted ...... 164
6-9 Three-Tab force coefficients directly measured vs. ASTM D7158 predicted .... 165
6-10 Mean forces and moments measured on partially unsealed Laminate specimens ........................................................................................................ 167
6-11 Mean forces and moments measured on fully sealed Three-Tab specimens ... 168
6-12 Laminate Specimen 3 - measured moments and estimated interface forces ... 172
6-13 Laminate Specimen 4 - measured moments and estimated interface forces ... 172
6-14 Three-Tab Specimen 4 - measured moments and estimated interface forces . 173
6-15 Three-Tab Specimen 5 - measured moments and estimated interface forces . 173
6-16 Three-Tab Specimen 6 - measured moments and estimated interface forces . 174
6-17 Laminate force coefficients directly measured vs. ASTM D7158 predicted ...... 176
6-18 Three-Tab force coefficients directly measured vs. ASTM D7158 predicted .... 176
10
LIST OF FIGURES
Figure page 2-1 Asphalt shingles are installed in the field of the roof with additional shingles
along hip and ridge lines. .................................................................................... 24
2-2 Plan view of a standard three-tab shingle with six fastener locations shown. ..... 25
2-3 Exploded view of a three-tab asphalt shingles constitutive materials. ................ 25
2-4 Location of sealant strip relative to the shingle’s leading edge and fasteners. ... 28
2-5 Plan view of typical laminate shingle with six-fastener pattern shown. ............... 34
2-6 Exploded view of typical laminate shingle constitutive materials. ....................... 34
2-7 Diagonal installation of three-tab asphalt shingle system. Laminate installation produces a similar pattern. ............................................................... 40
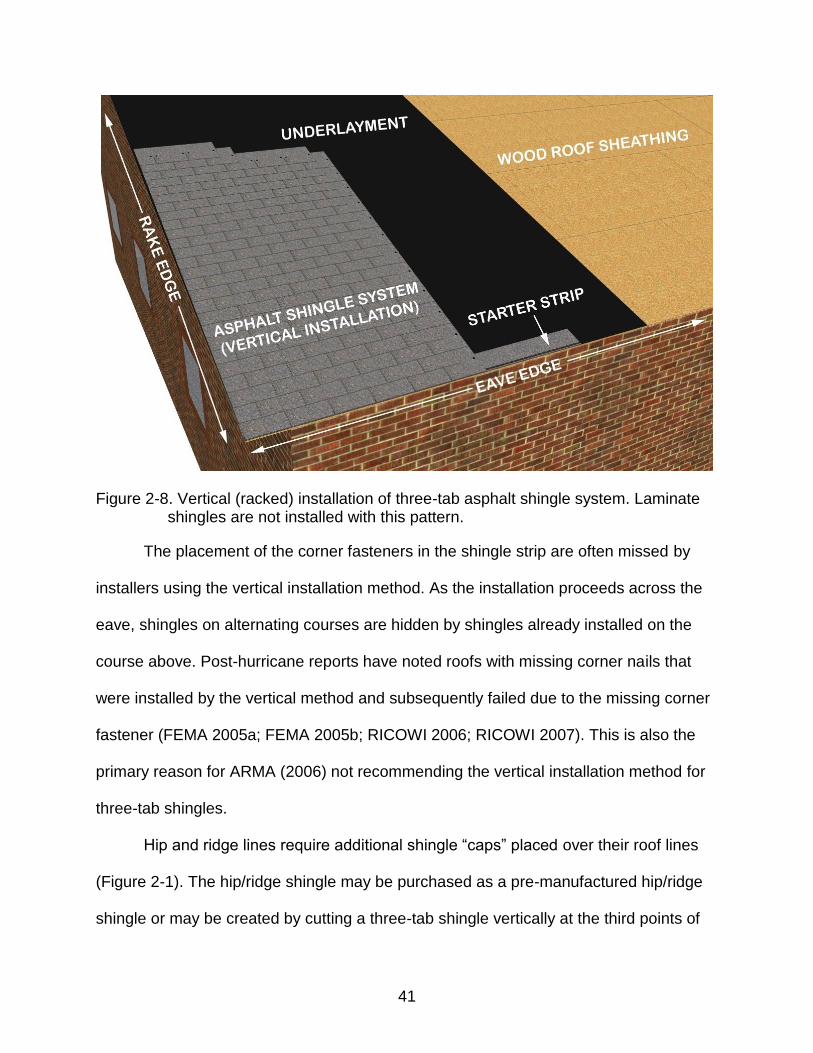
2-8 Vertical (racked) installation of three-tab asphalt shingle system. Laminate shingles are not installed with this pattern. ......................................................... 41
3-1 Pre-wind test asphalt shingle test deck .............................................................. 51
3-2 Post-wind test asphalt shingle test deck ............................................................. 51
3-3 Wind load model proposed by Peterka et al. (1983). .......................................... 52
3-4 Test setups for wind testing of asphalt shingles ................................................. 56
3-5 Peak pressure coefficients measured on a full-scale asphalt shingle subjected to wind flow from varying directions.................................................... 60
4-1 Locations of the asphalt shingle surveys conducted in Florida. .......................... 69
4-2 Location of partial unsealing. .............................................................................. 74
4-3 Location of partially/fully unsealed three-tab and laminate shingles (tape marks). ............................................................................................................... 74
4-4 Shingle roofs located in Houston, TX with partially unsealed shingles located by triangular chalk marks and fully sealed shingles located by dash marks. ...... 75
4-5 Percent of unsealed shingle strips located in the field of the roof verses roof age. .................................................................................................................... 76
4-6 Boxplot of unsealed shingle strips located in the field of the roof verses roof age at the time of investigation. .......................................................................... 77
11
4-7 Blown off three-tab asphalt shingles. .................................................................. 78
4-8 Typical condition for partially unsealed ridge and hip shingle. ............................ 79
4-9 Percent of fully and partially unsealed hip and ridge shingles ............................ 79
4-10 Wind directions for gable and hip roof specimens. ............................................. 81
4-11 Measured and best-fit theoretical normalized mean velocity, longitudinal turbulence intensity, and lateral turbulence intensity. ......................................... 83
4-12 Normalized wind spectrum of Wind Level 3 (measured at 5 m). ......................... 84
4-13 Hip roof three-tab shingle specimen pre- and post-test conditions ..................... 87
4-14 Shingle roof damage initiated by pre-wind test unsealed shingles. .................... 87
4-15 Statistical comparison of roof damage for the roof specimen shown in Figure 4-13. ................................................................................................................... 88
4-16 Characteristic hip shingle blow off patterns. ....................................................... 88
4-17 Progression of hip shingle blow off through the wind test sequence for specimen oriented at the 0° wind direction. ........................................................ 89
5-1 Wind pressures on shingle roofing. .................................................................... 94
5-2 Cross-section view of a shingle’s constitutive materials. .................................... 94
5-3 ASTM D6381 specimens. ................................................................................... 97
5-4 UV-Thermal-Aging chamber components. ......................................................... 99
5-5 Measured irradiance, plan view, and temperature time-history of one cycle. ... 100
5-6 ASTM D6381 test apparatus, setup, and uplifted specimen. ............................ 103
5-7 ASTM D6381 test results for Product A. ........................................................... 105
5-8 ASTM D6381 test results for Product B. ........................................................... 105
5-9 ASTM D6381 test results for Product C. ........................................................... 106
5-10 Example failure modes observed in mechanically uplifted shingles. ................ 109
5-11 Distribution of failure modes on Product A-Procedure A. ................................. 110
5-12 Distribution of failure modes on Product A-Procedure B. ................................. 111
12
5-13 Distribution of failure modes on Product C. ...................................................... 111
5-14 Portable Mechanical Uplift Apparatus components. ......................................... 117
5-15 In situ ASTM D6381 test results. ...................................................................... 119
5-16 Distribution of failure modes for in situ ASTM D6381 tests. .............................. 120
5-17 Wind resistance of naturally aged shingles vs. ASTM D7158 Class H required resistance. .......................................................................................... 122
6-1 Wind pressures on shingle roofing. .................................................................. 126
6-2 Rendering of the Dynamic Flow Simulator componentry. ................................. 132
6-3 Dynamic Flow Simulator, profile view, and test section, orthogonal view. ........ 132
6-4 Dynamic Flow Simulator, as constructed. ......................................................... 132
6-5 Cross-section of DFS test section. ................................................................... 133
6-6 Test deck below opening in test section. .......................................................... 133
6-7 Interior view of the DFS during this study’s wind test. A partially unsealed laminate shingle instrumented with load cells is shown. ................................... 134
6-8 Mean longitudinal velocity across the width of a shingle test specimen ........... 134
6-9 Plan view of Three-Tab test deck. .................................................................... 137
6-10 Plan view Laminate test deck. .......................................................................... 138
6-11 Cross-section of DFS with test deck. ................................................................ 138
6-12 Multi-axis load cell elevation and plane view. ................................................... 139
6-13 Cross-section of load cell attachment detail. .................................................... 141
6-14 Part 1: load cell arrangement for Laminate specimen showing load cell base connection. ....................................................................................................... 142
6-15 Part 2: load cell arrangement for Laminate specimen showing wood decking surrounding top plates. ..................................................................................... 142
6-16 Three-Tab specimen. ....................................................................................... 143
6-17 Plan views for Three-Tab fully sealed and partially unsealed arrangements. ... 144
6-18 Laminate specimen. ......................................................................................... 144
13
6-19 Plan views for Three-Tab fully sealed and partially unsealed arrangements. ... 145
6-20 Fully sealed laminate test specimen installed on the test deck. ....................... 147
6-21 Plan view and cross section of velocity measurement locations. ..................... 148
6-22 Velocity sensor test setup. ................................................................................ 148
6-23 Mean longitudinal velocity profiles – Low wind speed. ..................................... 150
6-24 Mean longitudinal velocity profiles – Medium wind speed. ............................... 150
6-25 Mean longitudinal velocity profiles – High wind speed. ..................................... 151
6-26 Mean longitudinal velocity of all measurement positions and wind speeds normalized by the 152 mm height mean. .......................................................... 152
6-27 Mean longitudinal velocity of all measurement positions and wind speeds. ..... 152
6-28 Phase II experimental setup. ............................................................................ 155
6-29 Relationship between static pressure and mean force. X- and Z- axes component force are shown for 416 mm (16.375 in) length of sealant strip. .... 156
6-30 Representative time-history plot of z-axis force between raw and filtered signals and not affected by temperature. .......................................................... 158
6-31 Time-history plot of z-axis force affected by temperature change on the load cell’s body. ........................................................................................................ 158
6-32 Reference frame for fully sealed Laminate and Three-Tab specimens. ........... 160
6-33 Partially unsealed Laminate Specimen 3 lifting in 44 m/s (98 mph) mean wind velocity. ............................................................................................................ 169
6-34 Partially unsealed Laminate Specimen 4 lifting in 44 m/s (98 mph) mean wind velocity. ............................................................................................................ 169
6-35 Reference frame for partially unsealed Laminate and Three-Tab specimens showing interfacial force location. ..................................................................... 170
14
Abstract of Dissertation Presented to the Graduate School of the University of Florida in Partial Fulfillment of the Requirements for the Degree of Doctor of Philosophy
THE WIND RESISTANCE OF ASPHALT ROOFING SHINGLES
By
Craig Robert Dixon
December 2013
Chair: David O. Prevatt Cochair: Forrest J. Masters Major: Civil Engineering
Asphalt shingle roofing is the leading cause of hurricane wind-related insured
losses in residential buildings. Damage statistics generated from recent hurricanes
indicate shingle roofs sustain damage in wind velocities below design-level with damage
frequency increasing with shingle roof age. The objective of this dissertation is the
identification of primary mechanisms triggering the failure of shingle roof systems in
wind. The research goal is to reduce future shingle roof wind damage and improve our
ability to predict asphalt shingle wind resistance. Five studies comprising this
dissertation addressed the adhesive consistency and strength of aged asphalt shingles,
system-level wind resistance, and the load model underpinning the ASTM D7158 wind
test standard.
The most significant and unexpected finding was partially unsealed shingles on
field, hip, and ridge locations on Florida and Texas homes. Location on the shingle’s
sealant strip where unsealed and failure mode were consistent at each location. Total
quantity of partially unsealed shingles in the field of the roof significantly increased with
age, aligning with damage statistics. Full-scale wind tunnel tests demonstrate partially
15
unsealed shingles are more vulnerable than fully sealed due to increased distributed
force on sealant strip and concentrated force at the adhered and non-adhered interface.
Uplift resistance was measured in artificially and naturally aged shingles. For
artificially aged shingles, one of three products evaluated had statistically significant
decreases in mean uplift resistance as exposure time increased. However, resistance
was above design-level at all exposure test intervals. Naturally aged shingles also had
resistance above design-level. Combined results demonstrate that reduced uplift
capacity can occur, but high initial bond strength promotes long-term uplift resistance.
Wind loads exerted on the shingles sealant strip load path were directly
measured on fully sealed and partially unsealed three-tab and laminate shingles.
Results indicate that ASTM D7158 and load model is conservative in force prediction for
fully sealed shingles. ASTM D7158 is not conservative for partially unsealed shingles.
Research concludes that partially unsealed shingles occur naturally and
represent a large contributor to wind damage. Retrofit of existing shingle roofs and
further work identifying specific cause will provide significant reduction of wind risk in
shingle roofing.
16
CHAPTER 1 INTRODUCTION
Over the past 50 years, hurricane-induced economic losses in the United States
(US) have increased from an estimated average annual total loss - adjusted for 2006
$US - of $1.3 billion in 1949-1989, $10.1 billion in 1990-1995 to $35.8 billion in 2001-
2006 (National Science Board 2007). The greatest impact from US landfalling
hurricanes is felt along the Atlantic and Gulf coastal communities where approximately
one-third of the US population resides within 100 miles of the coastline (US Census
Bureau 2007) and over $9 trillion of insured property exists (Liu et al. 2010). In Florida
alone, insurers lost an estimated $9.3 billion in 2004 (Charley, Frances, Ivan, and
Jeanne) and $3.8 billion in 2005 (Dennis and Wilma) (Malmstadt et al. 2009).
Historically, building failures have played a large role in economic losses
resulting from hurricanes. For example, in Hurricane Hugo (1989), residential building
damage accounted for 58% of the $5.17 billion in total insured losses (2012 $US)
(Sparks et al. 1994). In turn, these losses have been absorbed by residents in
vulnerable coastal areas in the form of higher property insurance premiums (Hamid et
al. 2011). Building failures have a larger societal impact, as well. Displacement from
damaged dwellings is often required while the structure is repaired (Levine et al. 2007) -
debilitating coastal communities that depend on its residents for economic stability and
cultural vibrance (Levine et al. 2007). Hurricane Andrew’s (1992) winds destroyed an
estimated 85,000 homes, leaving 180,000 South Florida residents temporarily homeless
(Mitchell et al. 2012). More recently, over one-half of Galveston’s single family homes
were still vacant two months after Hurricane Ike struck the Texas coast in 2008 (Mitchell
et al. 2012). Increased short- and long-term psychological stress (e.g. post-traumatic
17
stress) can also arise as the result of hurricanes and the subsequent damage that is
imposed on the community (Galea et al. 2005).
Failed roof coverings and rooftop accessories continue to be the leading cause of
building damage in hurricanes (FEMA 2005b) (Figure 1-1). Roof covering damage in
Hurricane Charley (2004) accounted for approximately 50% of the direct losses to
damaged buildings – at all wind speed ranges (Applied Research Associates 2008).
Their failure can also contribute to a building’s interior damage due to rainwater entering
the building envelope through the breach opened by the failed roofing. In Hurricane
Charley, interior damage was the second leading cause of direct loss to the buildings
surveyed.
This dissertation is focused on the wind resistance of asphalt shingles – the
predominant roof covering material for residential buildings. Asphalt shingles were first
introduced in the late 19th century (Cullen 1992) and their use has grown to a 2006 US
steep-slope roofing market share of 89% – predominantly in residential construction
(ARMA 2011). The wind resistance of shingles has been a critical design consideration
throughout its history (Cullen 1992). Prior to the mid-1950s, wind induced blow-off was
the most common premature failure mode of asphalt shingles (Cullen 1992). In
response, manufacturers introduced a thermally-activated adhesive strip along the
shingle’s leading edge to prevent the shingle from lifting in the wind – a design that is
still used today (Cullen 1992). Research conducted in the 1980s and 90s discovered
that uplift forces develop on the shingle’s upper and lower surfaces near its windward
edges due to localized separations of the near-roof surface wind flow (Peterka et al.
1997). Despite this improved knowledge of wind load mechanics and subsequent
18
modifications to standardized test methods and materials (e.g., introduction of polymer-
modification to bitumen chemistry), reports of wind-induced failures of asphalt shingles
continue (FEMA 2005a; FEMA 2005b; FEMA 2006; RICOWI 2006). Approximately 60%
of shingle roofs over five years old were damaged in below design-level winds from
Hurricanes Ike and Gustav (2008) (Liu et al. 2010), while Hurricane Charley caused an
estimated 78% damage rate to shingle roofs subjected to near design-level winds in
Florida’s Charlotte county (Gurley and Masters 2011).
Knowledge Gaps in the Wind Resistance of Asphalt Shingles
The primary challenge towards improving the wind resistance of asphalt shingles
is the lack of substantive data that provides manufacturers, engineers, installers, and
researchers the root causes of failure. Current test methods for certifying a shingle
product’s wind resistance utilize new shingles that are installed in strict accordance with
manufacturer’s specification and tested in a laboratory setting. The effects of aging,
installation errors, and roof edge detailing are not addressed within these wind
certification tests. These test assumptions exist despite repeated observations of a
potential reduction in wind capacity as the shingle ages (Liu et al. 2010; Gurley and
Masters 2011), failures along roof edge details (FEMA 2009), and installation
techniques that may adversely influence wind performance (FEMA 2009; RICOWI 2006;
RICOWI 2007).
Post-hurricane damage assessment reports (FEMA 2005a; FEMA 2005b; Liu et
al. 2010; RICOWI 2006; RICOWI 2007) currently provide the best means for ‘ground-
truth’ to standardized wind tests. These assessments can be useful to manufacturers
and building officials in identifying common damage patterns in order to modify current
material design and installation specifications. However, these reports are limited in

19
their capacity to identify the specific cause of failure as the investigations are conducted
after failure has occurred on roofs where the pre-storm condition of the roof is unknown.
Conditions such as the strength and consistency of sealing of the shingle’s sealant
strips before the storm can influence the shingle’s wind performance. Moreover, the
source of shingle damage is inferred by field investigators using forensic investigative
methods and previous experience on failed roofs. This complicates the issue further, as
it increases the potential for identifying the wrong mode of failure. As will be shown
later, over the past 25 years, post-hurricane reports have repeatedly shown common
damage patterns with commonly associated failure modes. The rate of damage incurred
combined with the consistency of damage suffered by asphalt shingle roofs indicates
the need to identify why shingle roofs continue to fail in wind that is below their design-
level despite the presence of standardized test methods and post-damage analysis
available to all stakeholders in asphalt shingle roofing.
Research Goals and Scope
The overarching goal of this experimental research is to improve the wind
resistance of asphalt shingles through identification of the root causes of continued
asphalt shingle failures in below design-level hurricanes. This new research builds upon
the existing knowledge of the wind load model for asphalt shingles and synthesizes the
results of laboratory and field research to fill the critical knowledge gap between
laboratory testing methods and the in situ wind performance of shingle roofing. More
specifically, this research advances our understanding of the impacts that aging and
system-level components have on the wind load model that functions as the basis for
the methods currently available to assess the wind resistance of asphalt shingle roofing.
20
The shingle roof covering is a discontinuous roof system with each roof
comprised of several thousand water resistant sheets that are designed to act as an
integrated system to resist wind forces in order to maintain a watertight roof envelope.
Yet, wind performance for asphalt shingles is rated by the mean resistance of system
components in isolation, rather than as a holistic unit, ignoring the effects of load
sharing between constituents. Previous post-hurricane damage reports (Liu et al. 2010;
Gurley and Masters 2011) have observed that newer asphalt shingle roofs perform
better in hurricane winds than older. However, they fail to delineate if the primary cause
of this performance gap is due to recent improvements in product design, building code
requirements, and test methods or if it is the result of age-related degradation in older
shingle systems. Unfortunately, the current methods for rating wind resistance cannot
predict the performance of a shingle once it has aged. Furthermore, throughout the
development of the wind load model, measurements of wind uplift forces directed
through the shingle’s main wind load path – the sealant strip – were approximated from
point measurements on the shingles surface, rather than directly measured through the
load path. This measurement technique is also utilized for the ASTM D7158 (ASTM
2011c) wind test. It is hypothesized that these assumptions confined within the current
wind load model and standardized wind test methods may adversely affect the ability for
all stakeholders to design, manufacture, and install asphalt shingle products that are
wind resistant throughout their service life.
The new research presented in this dissertation comprised of five studies. First,
field surveys were performed on thirty homes in Florida and Texas to identify whether
asphalt shingle remain adhered along their sealant strip throughout service. Second,
21
full-scale wind tunnel tests were conducted at the IBHS Research Center on seventeen
asphalt shingle roof systems. The objective was to evaluate the wind resistance of the
system as a holistic unit to identify weaknesses in design and installation not captured
by standard test methods. Third, three asphalt shingle products were artificially aged
using two techniques that accelerate weathering. Wind resistance was measured on a
portion of the shingles at discrete intervals and compared to initial resistance and ASTM
D7158 design-level requirements (ASTM 2011c). Fourth, four naturally aged shingle
roof systems were tested for wind uplift resistance in situ with results compared to
ASTM D7158 design-level requirements (ASTM 2011c). Finally, in- and out-of-plane
wind loads were measured on sealant strips of three-tab and asphalt shingles.
Specimens were fully sealed and partially unsealed. Measured forces were compared to
forces predicted by ASTM D7158 (ASTM 2011c) and the theoretical model for wind
loads on asphalt shingles (Peterka et al. 1997).
Research Impacts
At its foundation, the results from this research impact a broad group of
stakeholders that will rely on this information to develop better asphalt shingle products
and installation methods, refine the understanding of risk to existing homes, and reduce
the economic and societal damage incurred from shingle roof failures during hurricanes.
To achieve the greatest impact, twenty-three experts who represented the interests of
product manufacturers, wind engineers, building officials, governmental agencies, risk
analyzers, insurers, and public interest groups oversaw the research (Table 1-1). The
oversight committee provided an external peer-review of all experiments during the
planning and results disseminating stages of the project. This ensured that the project’s
experiments would provide relevant and impactful results to these critical groups, while,
22
at the same time, fostering by-in from the committee due to their external input on
experiment topics, methods, and results reporting.
Table 1-1. Oversight committee members
Name Affiliation
Peter Vickery, Ph.D., P.E. Applied Research Associates
Bill Coulbourne, P.E. Applied Technology Council
Michael Fischer Asphalt Roofing Manufacturers Association
Jon Peterka, Ph.D., P.E. Cermak Peterka Petersen, Inc.
John Minor, CGC (FL) Complete General Contractors, Inc.
Leslie Chapman-Henderson Tim Smail
Federal Alliance for Safe Homes
John Plisich Andrew Herseth, P.E., S.E. Thomas Smith, A.I.A., R.R.C.a
FEMA
Rick Dixon Mo Madani
Florida Building Commission
Miles Anderson Florida Division of Emergency Management
Jack Glenn Florida Home Builders Association
Anne Cope, Ph.D., P.E. Tim Reinhold, Ph.D., P.E.
Insurance Institute of Business & Home Safety
Michael Young, P.E. Peter Datin, Ph.D.
Risk Management Solutions, Inc. (RMS)
Walter Rossiter, Ph.D. RCI (formally the Roof Consultants Institute)
Jim Baker Roofing Industry Committee on Weather Issues (RICOWI)
Benjamin Thomas Jr., Ph.D. Southeast Region Research Initiative
Tom Nichols U.S. Polyco Inc.
Julie Serakos BMS Intermediaries, Inc. aMr. Smith also works as a consultant for TLSmith Consulting Inc.
Layout of the Dissertation
This dissertation consists of seven chapters. Chapter 1 contains the background
and introduction to the research, knowledge gaps in the wind resistance of asphalt
shingles, research goals and scope, and research impacts. Chapter 2 provides an

23
overview of the asphalt shingle roof system and its installation. A literature review of the
history of the wind resistance of asphalt shingles is presented in Chapter 3.
This is followed by the results of two studies addressing unsealed shingles in
Chapter 4, two studies addressing the wind resistance of aged shingle roofing in
Chapter 5, and an assessment of the wind load model for asphalt shingles in Chapter 6.
The three research chapters (4 – 6) each contain an introduction to the specific
research topic, experimental methods, results, and significant findings. Chapter 7
concludes the dissertation with a discussion of the combined results of the experiments,
recommendations for retrofit solutions, and recommendations for future work.
24
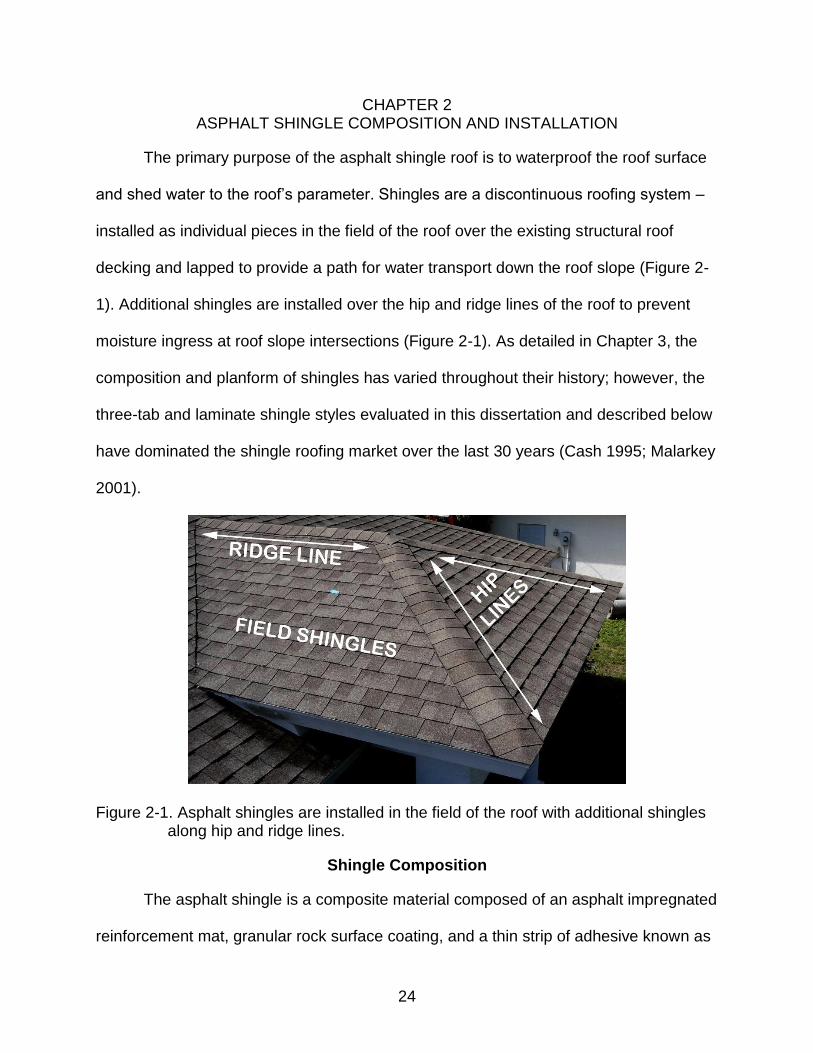
CHAPTER 2 ASPHALT SHINGLE COMPOSITION AND INSTALLATION
The primary purpose of the asphalt shingle roof is to waterproof the roof surface
and shed water to the roof’s parameter. Shingles are a discontinuous roofing system –
installed as individual pieces in the field of the roof over the existing structural roof
decking and lapped to provide a path for water transport down the roof slope (Figure 2-
1). Additional shingles are installed over the hip and ridge lines of the roof to prevent
moisture ingress at roof slope intersections (Figure 2-1). As detailed in Chapter 3, the
composition and planform of shingles has varied throughout their history; however, the
three-tab and laminate shingle styles evaluated in this dissertation and described below
have dominated the shingle roofing market over the last 30 years (Cash 1995; Malarkey
2001).
Figure 2-1. Asphalt shingles are installed in the field of the roof with additional shingles along hip and ridge lines.
Shingle Composition
The asphalt shingle is a composite material composed of an asphalt impregnated
reinforcement mat, granular rock surface coating, and a thin strip of adhesive known as
25
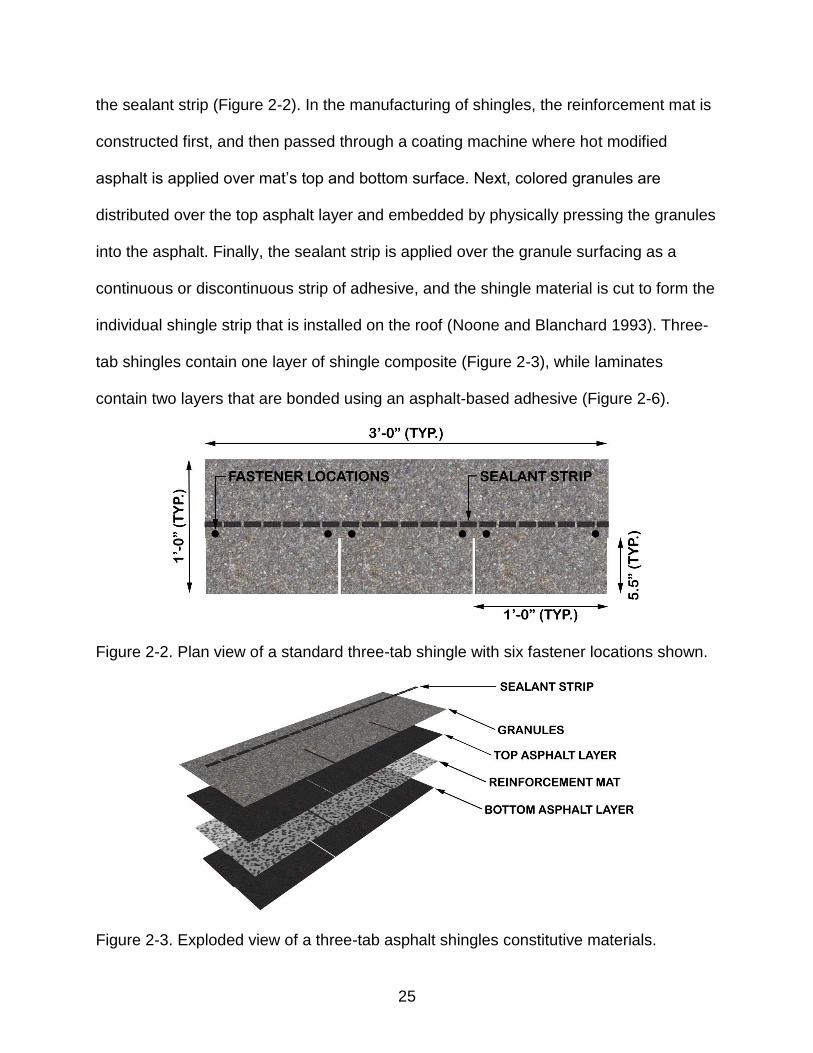
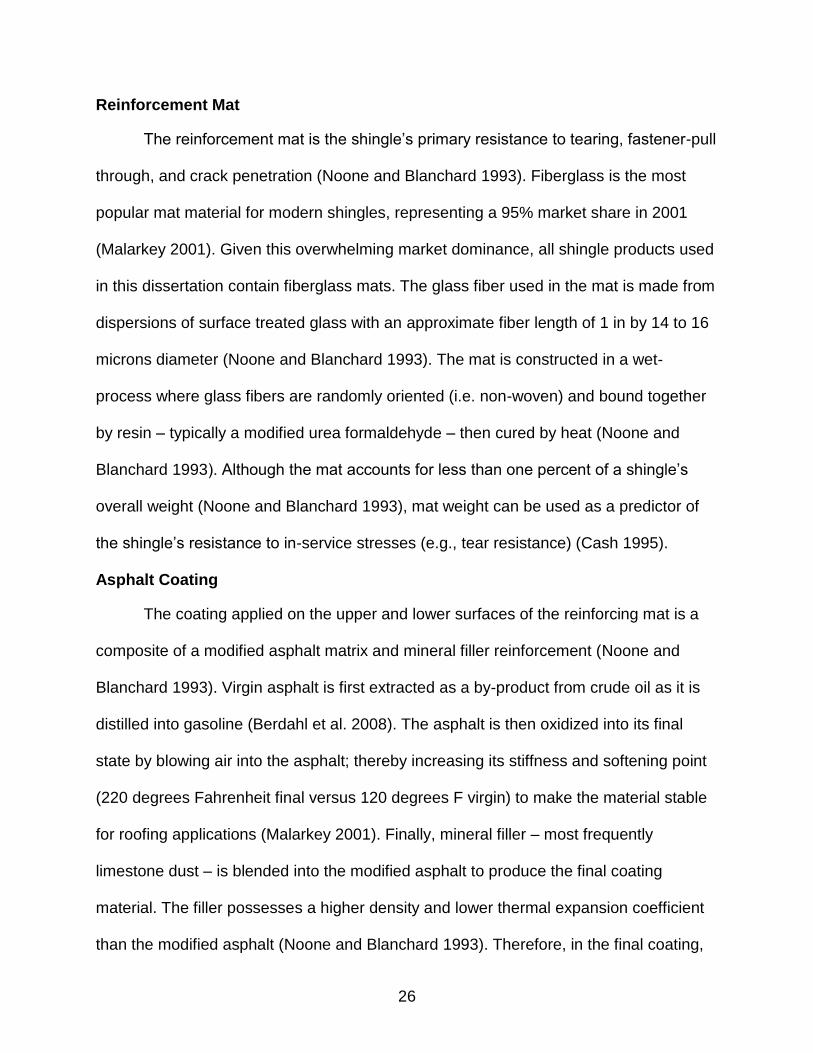
the sealant strip (Figure 2-2). In the manufacturing of shingles, the reinforcement mat is
constructed first, and then passed through a coating machine where hot modified
asphalt is applied over mat’s top and bottom surface. Next, colored granules are
distributed over the top asphalt layer and embedded by physically pressing the granules
into the asphalt. Finally, the sealant strip is applied over the granule surfacing as a
continuous or discontinuous strip of adhesive, and the shingle material is cut to form the
individual shingle strip that is installed on the roof (Noone and Blanchard 1993). Three-
tab shingles contain one layer of shingle composite (Figure 2-3), while laminates
contain two layers that are bonded using an asphalt-based adhesive (Figure 2-6).
Figure 2-2. Plan view of a standard three-tab shingle with six fastener locations shown.
Figure 2-3. Exploded view of a three-tab asphalt shingles constitutive materials.
26
Reinforcement Mat
The reinforcement mat is the shingle’s primary resistance to tearing, fastener-pull
through, and crack penetration (Noone and Blanchard 1993). Fiberglass is the most
popular mat material for modern shingles, representing a 95% market share in 2001
(Malarkey 2001). Given this overwhelming market dominance, all shingle products used
in this dissertation contain fiberglass mats. The glass fiber used in the mat is made from
dispersions of surface treated glass with an approximate fiber length of 1 in by 14 to 16
microns diameter (Noone and Blanchard 1993). The mat is constructed in a wet-
process where glass fibers are randomly oriented (i.e. non-woven) and bound together
by resin – typically a modified urea formaldehyde – then cured by heat (Noone and
Blanchard 1993). Although the mat accounts for less than one percent of a shingle’s
overall weight (Noone and Blanchard 1993), mat weight can be used as a predictor of
the shingle’s resistance to in-service stresses (e.g., tear resistance) (Cash 1995).
Asphalt Coating
The coating applied on the upper and lower surfaces of the reinforcing mat is a
composite of a modified asphalt matrix and mineral filler reinforcement (Noone and
Blanchard 1993). Virgin asphalt is first extracted as a by-product from crude oil as it is
distilled into gasoline (Berdahl et al. 2008). The asphalt is then oxidized into its final
state by blowing air into the asphalt; thereby increasing its stiffness and softening point
(220 degrees Fahrenheit final versus 120 degrees F virgin) to make the material stable
for roofing applications (Malarkey 2001). Finally, mineral filler – most frequently
limestone dust – is blended into the modified asphalt to produce the final coating
material. The filler possesses a higher density and lower thermal expansion coefficient
than the modified asphalt (Noone and Blanchard 1993). Therefore, in the final coating,
27
the modified asphalt provides water resistance, while the mineral filler increases the
mixtures resistance to thermal and mechanical stresses by composite action between
the asphalt and filler (Noone and Blanchard 1993).
Roofing Granules
The primary purpose of the top surface roofing granules is to prevent photo-
oxidation of the top asphalt coating (Berdahl et al. 2008). Photo-oxidation occurs when
incident ultraviolet (UV) light waves are absorbed by bare asphalt and energetic UV
photons break the asphalt’s molecular structure, producing sulfur-oxygen groups,
including sulfate (SO4). The formation of these soluble groups makes the top layer
susceptible to removal from the roofing during rain events, thereby, exposing a new
layer of asphalt for the process to begin anew (Dutt 1986). Physical properties of the
asphalt also change as a result of this altered chemical state due to increased
structuring of the asphalt’s polar materials (Robertson 1991). The result is a stiffer
asphalt material that may be more susceptible to cracking or crazing (Berdahl et al.,
2008).
Roofing granules placed over the asphalt prevent photochemical degradation by
absorbing incident UV before it can penetrate into the asphalt (Dutt 1986). Typical
granule materials include: slate, blast-furnace slag, or crushed stone (Dutt 1986).
Granule size generally ranges from 0.15 mm (0.006 in) to 3.3 mm (0.13 in) with the
relative contribution of each particle size over the shingle surface designated by the
shingle’s manufacturer (Dutt 1986). Given an ideal size and application distribution,
granules can mathematically cover 100% of the shingle’s surface; however weathering
can cause loss of granules and exposure of asphalt (Dutt 1986). While standard tests
for granule coverage and long-term adhesion do not exist, ASTM D4977 – 03(2009)
28
Standard Test Method for Granule Adhesion to Mineral Surfaced Roofing by Abrasion
(ASTM 2008a) does provide a standard test method for manufacturers to evaluate the
granular adhesion of new shingle products.
Sealant Strip
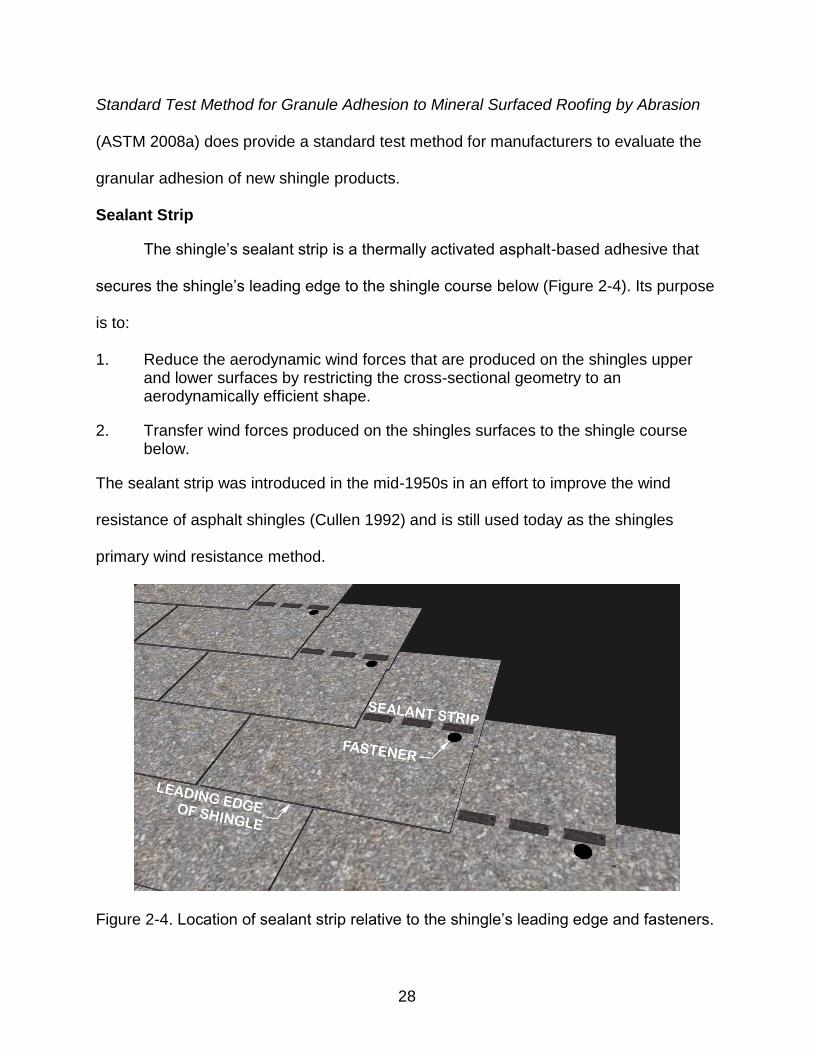
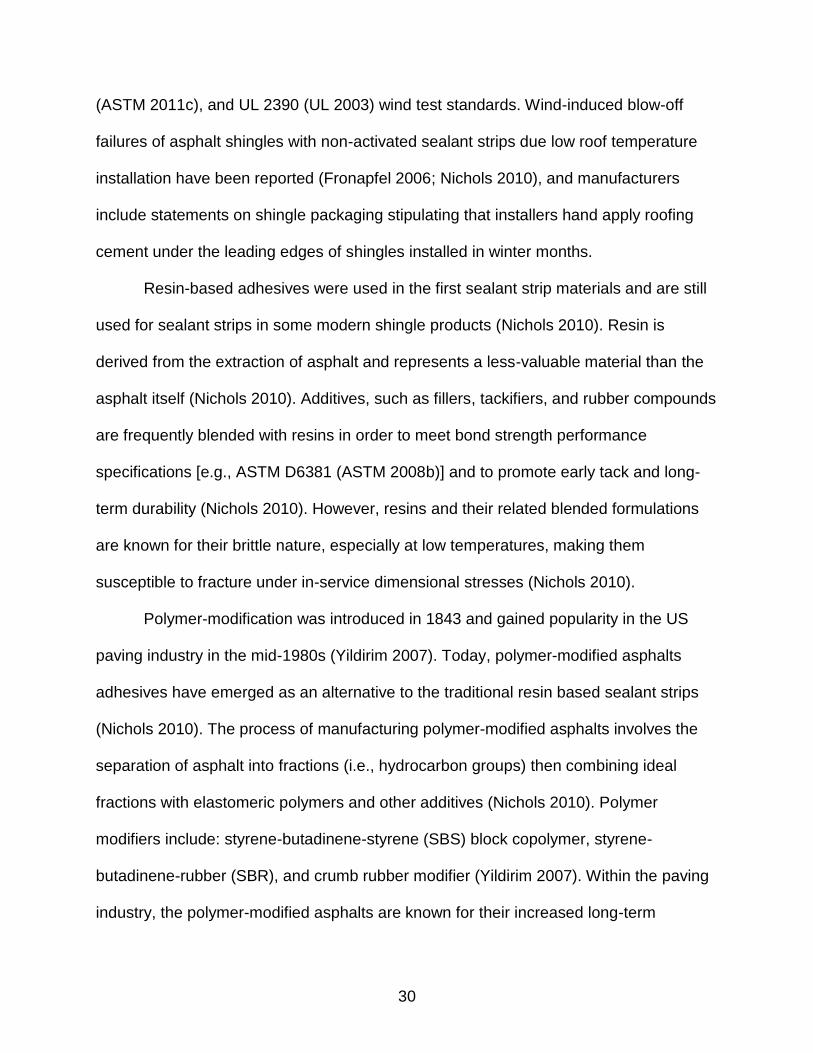
The shingle’s sealant strip is a thermally activated asphalt-based adhesive that
secures the shingle’s leading edge to the shingle course below (Figure 2-4). Its purpose
is to:
1. Reduce the aerodynamic wind forces that are produced on the shingles upper and lower surfaces by restricting the cross-sectional geometry to an aerodynamically efficient shape.
2. Transfer wind forces produced on the shingles surfaces to the shingle course below.
The sealant strip was introduced in the mid-1950s in an effort to improve the wind
resistance of asphalt shingles (Cullen 1992) and is still used today as the shingles
primary wind resistance method.
Figure 2-4. Location of sealant strip relative to the shingle’s leading edge and fasteners.
29
Sealant strip design is controlled by shingle system wind performance, rather
than material composition specifications. Therefore, sealant strip materials and designs
vary between manufacturers, even within different product lines and manufacturing
locations. The sealant can be placed on the top of the shingle’s surface, as shown in
Figures 2-3, 2-4, and 2-6, or on the shingle’s bottom surface near its leading edge.
Recall, shingles are lapped between courses when they are installed; therefore, a
sealant strip manufactured on the top surface of the shingle will seal the leading edge of
the shingle course above, while application of the sealant strip on the bottom surface
will seal that shingle down to the course below. The sealant’s width is approximately 13
mm (0.5 in) and the strip may be applied as a continuous or discontinuous strip.
Placement of the sealant relative to the shingle’s leading edge varies with each
manufacturer; however, as shown later, this distance influences the magnitude of wind
uplift forces that are generated on the shingle’s surface.
As with the other design parameters, the material composition of the sealant strip
varies widely amongst manufactures (Nichols 2010). The overarching goal of the strip
material is to maintain adhesion between the two shingle courses when subjected to in-
service stresses (e.g., wind uplift and thermal movement) throughout the lifetime of the
shingle. The strip’s material is known as a ‘self-sealing’ adhesive that is required to
have a softening point at a temperature that can be achieved on a roof during a sunny
day (Nichols 2010). Despite this ambiguity in performance standard, it is expected that
the softening point (i.e., activation) of the sealant should occur at a minimum
temperature of 57°C (135°F), as this is the minimum required conditioning temperature
set forth in the ASTM D3161 (ASTM 2013), ASTM D6381 (ASTM 2008b), ASTM D7158
30
(ASTM 2011c), and UL 2390 (UL 2003) wind test standards. Wind-induced blow-off
failures of asphalt shingles with non-activated sealant strips due low roof temperature
installation have been reported (Fronapfel 2006; Nichols 2010), and manufacturers
include statements on shingle packaging stipulating that installers hand apply roofing
cement under the leading edges of shingles installed in winter months.
Resin-based adhesives were used in the first sealant strip materials and are still
used for sealant strips in some modern shingle products (Nichols 2010). Resin is
derived from the extraction of asphalt and represents a less-valuable material than the
asphalt itself (Nichols 2010). Additives, such as fillers, tackifiers, and rubber compounds
are frequently blended with resins in order to meet bond strength performance
specifications [e.g., ASTM D6381 (ASTM 2008b)] and to promote early tack and long-
term durability (Nichols 2010). However, resins and their related blended formulations
are known for their brittle nature, especially at low temperatures, making them
susceptible to fracture under in-service dimensional stresses (Nichols 2010).
Polymer-modification was introduced in 1843 and gained popularity in the US
paving industry in the mid-1980s (Yildirim 2007). Today, polymer-modified asphalts
adhesives have emerged as an alternative to the traditional resin based sealant strips
(Nichols 2010). The process of manufacturing polymer-modified asphalts involves the
separation of asphalt into fractions (i.e., hydrocarbon groups) then combining ideal
fractions with elastomeric polymers and other additives (Nichols 2010). Polymer
modifiers include: styrene-butadinene-styrene (SBS) block copolymer, styrene-
butadinene-rubber (SBR), and crumb rubber modifier (Yildirim 2007). Within the paving
industry, the polymer-modified asphalts are known for their increased long-term
31
resistance to fatigue, thermal cracking, rutting, stripping, and temperature susceptibility
when compared to unmodified asphalts (Yildirim 2007).
Fasteners
Fasteners are placed in a row perpendicular to the roof slope to secure each
shingle strip to the roofing substrate below. The type, location, and quantity of fasteners
are either specified by local building codes (e.g., Florida Building Code) or product
manufacturers. For example, the 2010 Florida Building Code section R905.2.5 (Florida
Building Commission 2010) requires that fasteners should consist of:
Galvanized steel, aluminum or copper roofing nails, minimum 12 gage [0.105 in (3 mm)] shank with minimum 3/8 in (10 mm) diameter head, ASTM F 1667, of a length to penetrate through the roofing materials and a minimum of ¾ in (19 mm) into the roof sheathing. Where the roof sheathing is less than ¾ in (19 mm) thick, the fasteners shall penetrate through the sheathing.
Florida Building Code also requires a minimum of four fasteners per strip, and, where
the structure is within the High-Velocity Hurricane Zone (Broward and Miami-Dade, FL
counties), a minimum of six nails are required (Florida Building Commission 2010).
Fasteners are either placed by hand or pneumatic air pressure guns.
Underlayment
The main objectives of the underlayment are: 1) serve as a primary water barrier
during re-roofing applications and 2) provide a secondary water barrier to the primary
asphalt shingle waterproofing during normal in-service use (Schaack 2006a).
Underlayment is a general term describing an application and purpose; therefore,
several products exist with varying degrees of rated water and wind resistance
(Schaack 2006a). The most popular underlayments are asphalt saturated felt paper and
32
self-adhered polymer modified bitumen sheets. Saturated felt paper is produced in two
grades (Schaack 2006a):
1. “#15 felt” [ASTM D226 Type I (ASTM 2009)] or “Shingle Underlayment” [ASTM D4869 Type I (ASTM 2011a)]
2. “#30 felt” [ASTM D226 Type II (ASTM 2009)] or “Heavy-Duty Shingle Underlayment” [ASTM D4869 Type II (ASTM 2011a)]
In general, the self-adhered modified bitumen will provide the best protection from wind
and moisture, followed by the Type II and Type I felt papers, respectively. Underlayment
is packaged as rolls with a 914 mm (36 in) width and installed parallel with eave edge of
the roof. As with asphalt shingles, underlayment are installed with laps on their head
region (i.e., lap parallel to the eave) and end region (i.e., lap perpendicular to the eave)
to provide a path for moisture transport and fasteners secure the sheets to the roof
substrate (Schaack 2006b). Local building codes control what underlayment products
are allowed and installation methods, including: minimum lap distances (head and end),
fastener types, and fastener patterns (Schaack 2006b).
The 2010 Florida Building Code: Residential (Florida Building Commission 2010)
requires that all felt paper underlayment be installed with 483 mm (19 in) head laps (i.e.,
double layer) for roofs with a slope of 2 units vertical in 12 units horizontal, up to 4 units
vertical in 12 units horizontal. When roofs have a slope greater than 4 units vertical in
12 units horizontal, a single layer of underlayment with a minimum 51 mm (2 in) head
lap must be installed. Fasteners for both roof slope conditions are a required 914 mm
(36 in) on center along the head lap sections. When the residential building is located in
a High-Velocity Hurricane Zone, all roofs should have a 483 mm (19 in) head lap for
Type I felt paper and 102 mm (4 in) head lap for Type II. Fastener density also
33
increases within the high wind regions with a maximum spacing of 305 mm (12 in)
throughout the sheet and 152 mm (6 in) along the end and head laps of each sheet.
Three-tab Shingles
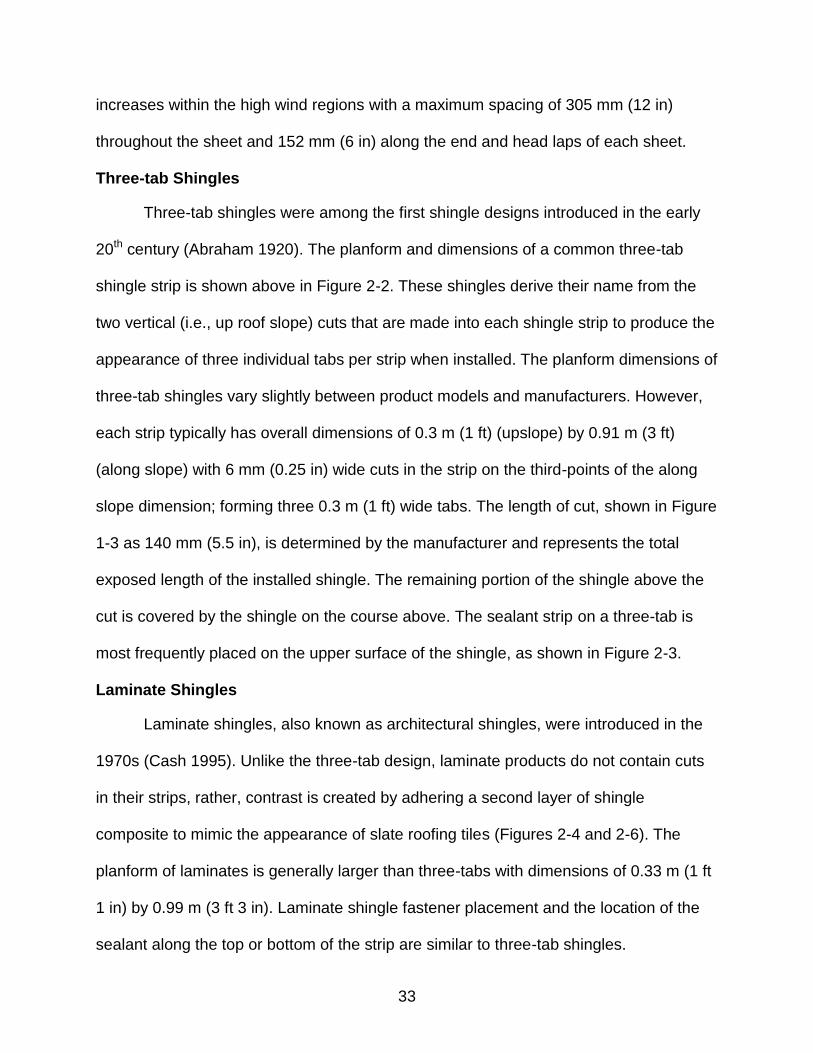
Three-tab shingles were among the first shingle designs introduced in the early
20th century (Abraham 1920). The planform and dimensions of a common three-tab
shingle strip is shown above in Figure 2-2. These shingles derive their name from the
two vertical (i.e., up roof slope) cuts that are made into each shingle strip to produce the
appearance of three individual tabs per strip when installed. The planform dimensions of
three-tab shingles vary slightly between product models and manufacturers. However,
each strip typically has overall dimensions of 0.3 m (1 ft) (upslope) by 0.91 m (3 ft)
(along slope) with 6 mm (0.25 in) wide cuts in the strip on the third-points of the along
slope dimension; forming three 0.3 m (1 ft) wide tabs. The length of cut, shown in Figure
1-3 as 140 mm (5.5 in), is determined by the manufacturer and represents the total
exposed length of the installed shingle. The remaining portion of the shingle above the
cut is covered by the shingle on the course above. The sealant strip on a three-tab is
most frequently placed on the upper surface of the shingle, as shown in Figure 2-3.
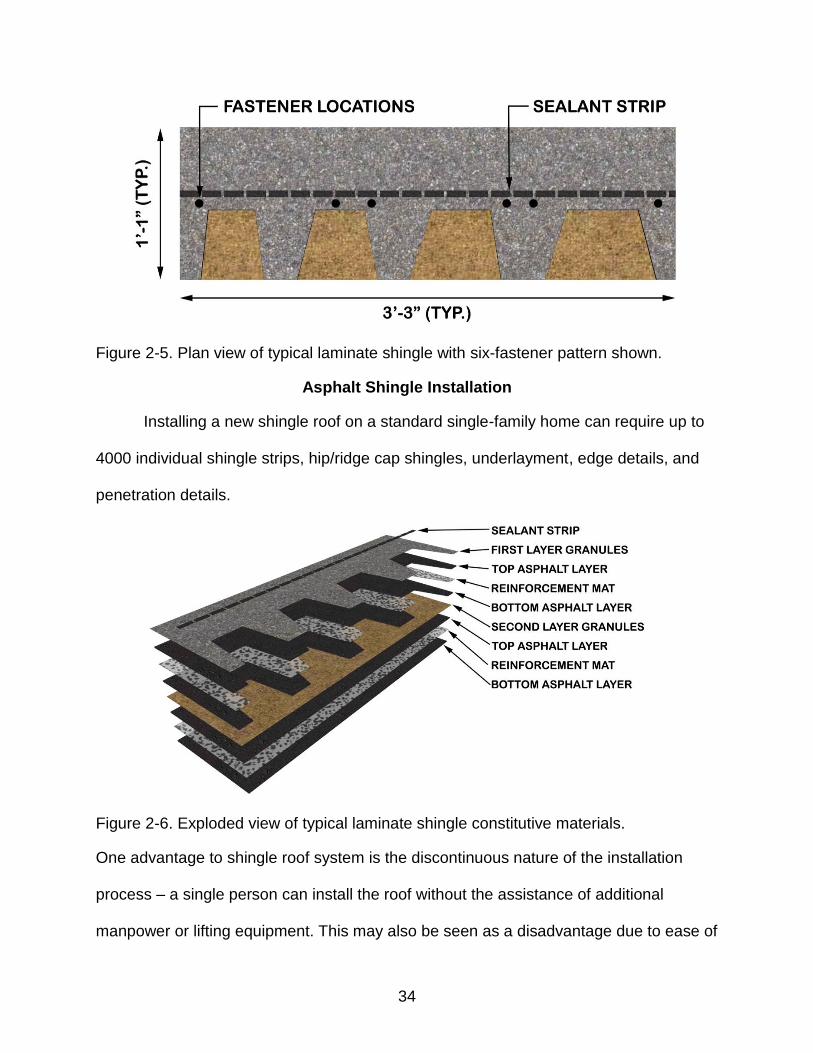
Laminate Shingles
Laminate shingles, also known as architectural shingles, were introduced in the
1970s (Cash 1995). Unlike the three-tab design, laminate products do not contain cuts
in their strips, rather, contrast is created by adhering a second layer of shingle
composite to mimic the appearance of slate roofing tiles (Figures 2-4 and 2-6). The
planform of laminates is generally larger than three-tabs with dimensions of 0.33 m (1 ft
1 in) by 0.99 m (3 ft 3 in). Laminate shingle fastener placement and the location of the
sealant along the top or bottom of the strip are similar to three-tab shingles.
34
Figure 2-5. Plan view of typical laminate shingle with six-fastener pattern shown.
Asphalt Shingle Installation
Installing a new shingle roof on a standard single-family home can require up to
4000 individual shingle strips, hip/ridge cap shingles, underlayment, edge details, and
penetration details.
Figure 2-6. Exploded view of typical laminate shingle constitutive materials.
One advantage to shingle roof system is the discontinuous nature of the installation
process – a single person can install the roof without the assistance of additional
manpower or lifting equipment. This may also be seen as a disadvantage due to ease of
35
materials handling, which, can encourage the homeowner or unqualified contracted
laborer to perform the roof installation. The components of a shingle roof are designed
to function as an integrated system to waterproof the roof, shed water to the roof’s
perimeter, and resist wind forces exerted on the shingle roof covering. As shown in
Chapter 3, the wind-induced failure of a single component can initiate a progressive
system-level failure that exposes the building’s interior to damaging moisture ingress.
Installation quality, or the lack thereof, is frequently cited as a cause of wind-induced
shingle failure (FEMA 2005a; FEMA 2005b; FEMA 2009; RICOWI 2006; RICOWI
2007); therefore, the goal of this section is to introduce the methods and requirements
for asphalt shingle product selection and installation.
Selecting an asphalt shingle product can be based on a combination of pricing,
contractor preference, appearance, minimum material properties, or wind and/or hail
impact requirements stipulated by local building codes. As shown by the Texas
Department of Windstorm Insurance (2011) survey of manufactured shingles, 201
different shingle products are currently available to homeowners, all with varying
degrees of material and performance certifications or ratings. For hurricane-prone
regions of the Southeast US, the wind resistance rating of the shingle is the primary
factor for approved products. In Florida, shingles approved for installation on residential
structures must be rated for their wind resistance by one of three test methods: ASTM
D7158 (ASTM 2011c), ASTM D3161 (ASTM 2013), or TAS 107 (Florida Building
Commission 2010). The specific test methods, limitations, and research leading to each
test method are detailed in Chapter 3. The wind rating requirements outlined in Florida
Building Code section R905.2.6.1 (Florida Building Commission 2010) for asphalt
36
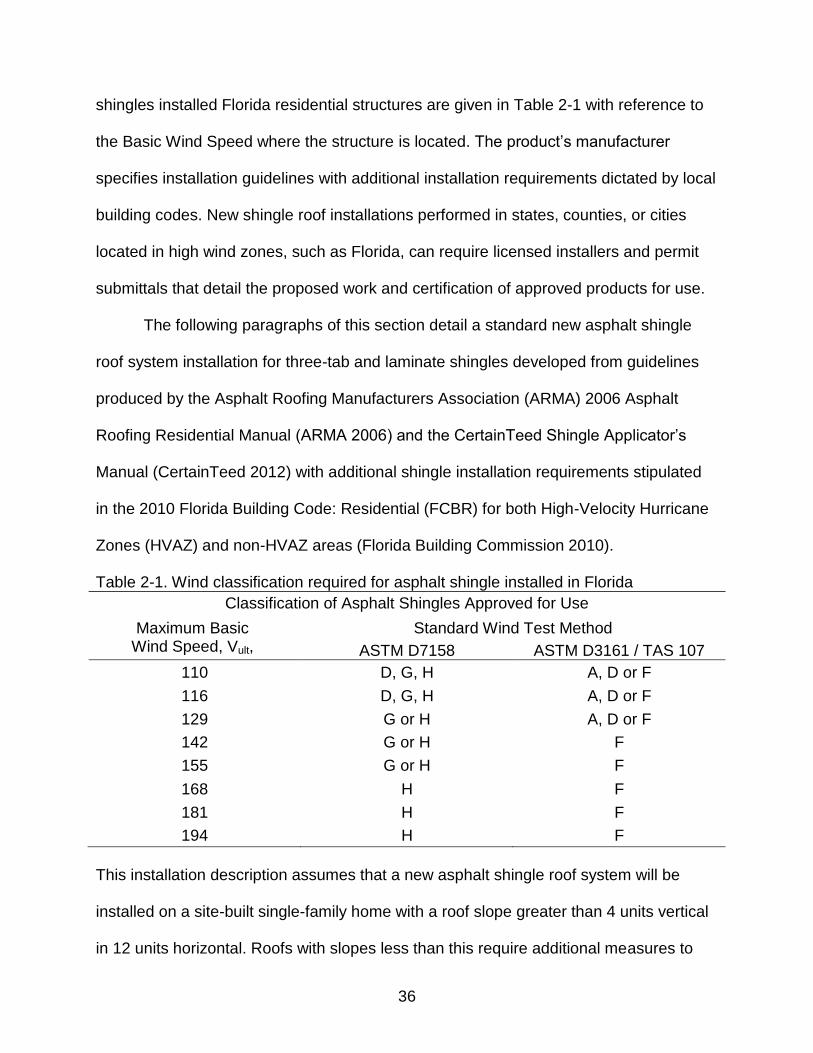
shingles installed Florida residential structures are given in Table 2-1 with reference to
the Basic Wind Speed where the structure is located. The product’s manufacturer
specifies installation guidelines with additional installation requirements dictated by local
building codes. New shingle roof installations performed in states, counties, or cities
located in high wind zones, such as Florida, can require licensed installers and permit
submittals that detail the proposed work and certification of approved products for use.
The following paragraphs of this section detail a standard new asphalt shingle
roof system installation for three-tab and laminate shingles developed from guidelines
produced by the Asphalt Roofing Manufacturers Association (ARMA) 2006 Asphalt
Roofing Residential Manual (ARMA 2006) and the CertainTeed Shingle Applicator’s
Manual (CertainTeed 2012) with additional shingle installation requirements stipulated
in the 2010 Florida Building Code: Residential (FCBR) for both High-Velocity Hurricane
Zones (HVAZ) and non-HVAZ areas (Florida Building Commission 2010).
Table 2-1. Wind classification required for asphalt shingle installed in Florida
Classification of Asphalt Shingles Approved for Use
Maximum Basic Wind Speed, Vult,
Standard Wind Test Method
ASTM D7158 ASTM D3161 / TAS 107
110 D, G, H A, D or F
116 D, G, H A, D or F
129 G or H A, D or F
142 G or H F
155 G or H F
168 H F
181 H F
194 H F
This installation description assumes that a new asphalt shingle roof system will be
installed on a site-built single-family home with a roof slope greater than 4 units vertical
in 12 units horizontal. Roofs with slopes less than this require additional measures to
37
ensure water resistance, such as increased requirements for secondary water barrier
protection.
For new construction, the installation process begins with the application of
underlayment over the new structural decking, following the materials and installation
methods detailed in the Underlayment section above. For reroofing applications, the
homeowner can choose to tear the existing roof off or leave the existing roof on and roof
over. However, there are regulations within the 2010 Florida Building Code Existing
Building Section 611.3 (Florida Building Commission 2010) and the ARMA (2006)
manual stipulating when a roof-over may be allowed. Given previous post-hurricane
observations of failed roof-overs due to uneven substrates causing poor sealant strip
adhesion and lack fastener penetration into the structural roof decking (FEMA 2005b;
RICOWI, 2006), it appears that removing the existing roof covering first would provide
better wind resistance than a roof-over. Therefore, it will be assumed that new and
reroof applications begin with the underlayment installed directly over the structural
deck.
Edge metal (i.e., drip edge) is first installed along the rake and eave edges of
shingle roofs is required by the 2010 FBCR (Florida Building Commission 2010) and
ARMA (2006) manual with the metal installed over the underlayment along the rake
edge and installed over or under the underlayment on the eave edge. Edge metal is an
L-shaped flashing element – aluminum, galvanized steel, or another approved material
in 2010 FBCR Table R903.2.1 (Florida Building Commission 2010) – that provides a
path for moisture to run off of the roof edge. One leg is attached to the wood sheathing
using mechanically fastened roofing nails – 12 gauge or greater – at a spacing of 305
38
mm (12 in) to 102 mm (4 in) on center, contingent on the wind zone where the structure
is located. The other leg of the edge metal projects downward. If the underlayment
installed over the edge metal on the eave, a continuous strip of 102 mm (4 in) wide
asphalt roof cement is required over the edge metal along the eave. When the structure
is located in an HVAZ, a continuous 204 mm (8 in) wide strip of asphalt roof cement is
required along all rake and eave edges under the shingle strips.
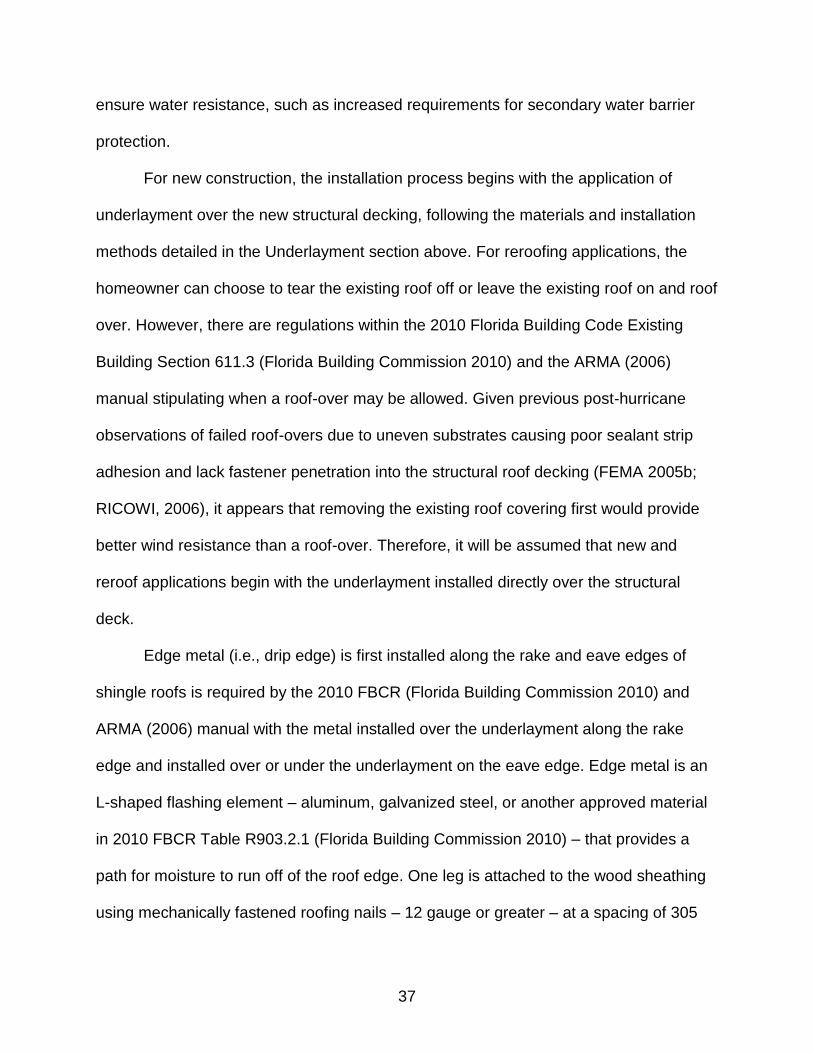
Individual shingles are then installed over the underlayment and edge metal
following one of two procedures. The first procedure is the diagonal installation method
visually depicted in Figure 2-7. This is the preferred method for all shingle installations
as it produces a reliable method for fastening the complete shingle strip on all locations
in the field of the roof (ARMA 2006). The second method is the vertical (i.e., racked)
installation procedure shown in Figure 2-8 This method is not covered and not
recommended in the ARMA (2006) manual and is not allowed for laminate shingle
products. However, the vertical method was used extensively on three-tab shingles in
the hurricane-prone Southeast US throughout the 1980s and 90s and is a frequently
citied cause of wind-related shingle failure (FEMA 2005b; FEMA 2006; RICOWI 2007).
Three-tab product guidelines produced by CertainTeed (2012) present a vertical
installation method; therefore, the vertical installation method will be detailed here as
well.
No matter the installation method, starter strips are required along all eaves
(Figures 2-7 and 2-8). The starter strips can be purchased as a separate item or created
from a three-tab shingle with the tabs cut from the strip and the sealant strip placed
closest to the eave. Shingles along eaves and rakes have an overhang ranging from 6
39
mm (0.25 in) (for HVAZ located residential structures) to 19 mm (0.75 in) (ARMA 2006)
to provide an additional flashing for water runoff. Starter strip are fastened 38.1 mm (1.5
in) to 76 mm (3 in) from the eave edge (ARMA 2006) following a four or six nail pattern,
as required by the product’s manufacturer or local building code.
The diagonal installation method begins at the corner of the roof at the
intersection of the rake and eave. The installation methods for laminate and three-tab
shingles are similar with the main difference occurring on the amount of offset placed
between shingle courses (i.e., rows). The first course starts at the corner with a full
width shingle aligned with the edges of the corner starter strip. The number and type of
fasteners used in each shingle strip is stipulated by either the manufacturer or local
building code. The installation proceeds along the eave installing full width shingles
across the entire eave until terminating either at the far gable end of the building or at a
valley or roof projection. To start the next course of shingles, the first shingle is cut to
create an offset and installed on the rake. For three-tab shingles, one-half tab width is
cut from the far left portion of the leftmost tab. Laminate shingles have more options;
“four inch”, “five inch” and “six inch” offset methods are available (ARMA 2006). Once
offset, full width shingles are used for the remainder of the course. The distance
between the leading edge of the first course and the leading edge of the second course
(i.e., exposure) is stipulated by the product manufacturer. The next course proceeds
with another cut to the rake shingle; for three-tab, it is the complete left tab of the strip
and for laminate it is twice the offset distance. The installation proceeds along eave and
up the rake, as shown in Figure 2-7, until the roof slope is completely shingled.
40
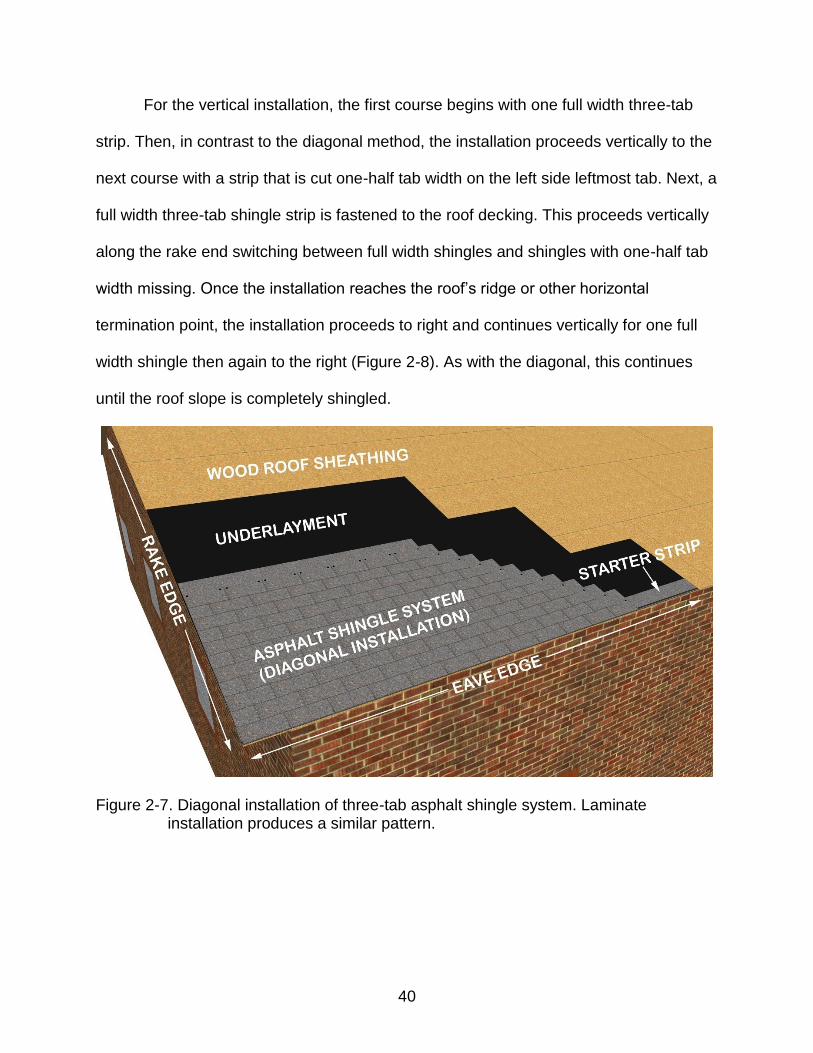
For the vertical installation, the first course begins with one full width three-tab
strip. Then, in contrast to the diagonal method, the installation proceeds vertically to the
next course with a strip that is cut one-half tab width on the left side leftmost tab. Next, a
full width three-tab shingle strip is fastened to the roof decking. This proceeds vertically
along the rake end switching between full width shingles and shingles with one-half tab
width missing. Once the installation reaches the roof’s ridge or other horizontal
termination point, the installation proceeds to right and continues vertically for one full
width shingle then again to the right (Figure 2-8). As with the diagonal, this continues
until the roof slope is completely shingled.
Figure 2-7. Diagonal installation of three-tab asphalt shingle system. Laminate installation produces a similar pattern.
41
Figure 2-8. Vertical (racked) installation of three-tab asphalt shingle system. Laminate shingles are not installed with this pattern.
The placement of the corner fasteners in the shingle strip are often missed by
installers using the vertical installation method. As the installation proceeds across the
eave, shingles on alternating courses are hidden by shingles already installed on the
course above. Post-hurricane reports have noted roofs with missing corner nails that
were installed by the vertical method and subsequently failed due to the missing corner
fastener (FEMA 2005a; FEMA 2005b; RICOWI 2006; RICOWI 2007). This is also the
primary reason for ARMA (2006) not recommending the vertical installation method for
three-tab shingles.
Hip and ridge lines require additional shingle “caps” placed over their roof lines
(Figure 2-1). The hip/ridge shingle may be purchased as a pre-manufactured hip/ridge
shingle or may be created by cutting a three-tab shingle vertically at the third points of
42
the shingle; thereby, extending the vertical cut already placed in the shingle (ARMA
2006). Both the pre-manfacturered and cut three-tab hip/ridge shingles are flat materials
that are folded over the hip or ridge line with the centerline of the shingle aligning with
the centerline of the hip or ridge line (Figure 2-1). The hip/ridge shingle sealant strip
seals down the leading edge of the shingle perpendicular to the hip or ridge line with the
shingle’s exposure specified by the product manufacturer. Hip/ridge shingles are
secured to the structural roof decking with two nails, each driven 140 mm (5.5 in) from
the shingles leading edge and 25 mm (1 in) from the edge of the hip/ridge shingle
parallel to the hip or ridge line. Hip/ridge shingle failures are frequently observed in post-
hurricance assessments as a result of the folding technique that produces poor
adhesion between the shingle and sealant strip near the edges of the shingle (FEMA
2009).
43
CHAPTER 3 LITERATURE REVIEW
The objectives of this review:
1. Detail the research that has shaped our understanding of wind loads on asphalt shingles.
2. Present the standardized wind test methods that drive the design and installation of today’s asphalt shingles.
The chapter is organized chronologically into four time periods:
1. The Early Years (1983 – 1950) 2. Development of the First Test Standards for Wind Resistance (1950 – 1980) 3. The Development of the Asphalt Shingle Wind Uplift Model (1980-1997) 4. The Modern Era (1997- )
Shingle wind performance issues are addressed throughout, with emphasis on the
behavior of in-service shingle systems during hurricanes presented in the final section
of the review.
The Early Years (1893 – 1950)
The first steep slope asphalt roofing system was introduced in 1893. Known as
asphalt prepared roofing, it consisted of a thin reinforcing cotton rag felt impregnated
with asphalt (Abraham 1920). Installation was similar to today’s asphalt roll roofing. In
1897, top surface mineral granules were added to improve the durability of the product
(Cullen 1992). It was later discovered that the mineral granules served an important
function of absorbing the ultraviolet (UV) light from the sun. UV oxidizes the top surface
asphalt coating and leads to an accelerated degradation of asphalt coating (Berdahl et
al. 2008).
Reprinted with permission from Dixon, C.R., Masters, F.J., Prevatt, D.O., and Gurley, K.R. (2012). “An historical perspective on the wind resistance of asphalt shingles.” RCI Interface, (5), 4-14.
44
Asphalt shingles were introduced in the beginning of the 20th century. Shingles
were manufactured by cutting asphalt prepared roofing into smaller sections in order to
create a discontinuous roof covering resembling wood shakes or slate. Similar to
today’s three-tab style, single tab shingles [typically 228 mm by 406 mm (9 in by 16 in)]
and multi-tab shingles [typically 254 mm by 816 mm (10 in by 32 1/8 in)] were produced.
The individual tab shingles had exposed leading edges that were often designed with
interlocking mechanisms to hold the shingles down during wind storms. The multi-tab
styles had unrestrained leading edges, allowing the shingle tab to lift in the wind
(Abraham 1920; Cash 1995).
By the late 1920s, the cotton reinforcing felts were replaced with substitute
materials due to a price increase in cotton rags. In 1926, the Asphalt Shingle and
Research Institute and the National Bureau of Standards (NBS; now the National
Institute of Standards and Technology) jointly investigated the effects of weathering on
the newer substitute felts. Results of the three-year weathering study showed no
adverse aging effects on the shingles containing the substitute materials (Cullen 1992).
The use of asphalt shingles increased as a result of World War II construction demands,
prompting another change of reinforcing felt to a less expensive wood based organic
material. Greenfeld (1969) would later show that the new ‘organic’-reinforced asphalt
shingles performed as well as their predecessors.
Blake (1925) developed one of the earliest known shingle attachment schedules
for a four-tab strip shingle; which called for five, 19 mm (3/4 in) long galvanized clout
nails to be placed one-half inch above each cutout. The specified fasteners are similar
45
to earlier prepared asphalt roll roofing products. Single- and multi-tab shingles were
installed on the roof in a stair-step pattern that mimics today’s standards (Abraham
1920). By 1941, three-tab strip shingles came into the market with fastening
requirements of four 11- or 12-gauge galvanized nails per shingle. Snoke (1941) notes
that three-tab shingles with six nails would be more resistant in high wind prone area; a
statement that is echoed in today’s shingle specifications. The 1947 standard for shingle
attachment called for six galvanized roofing nails with a minimum 10 mm (3/8 in)
diameter head at 25 mm (1 in) from the shingle edge and 38 mm (1.5 in) on either side
of each tab cutout’s centerline (Strahan 1947). The most likely premature shingle failure
during this era was due to wind, signaling that attachment requirements were
inadequate. During moderate wind, continued flexing of the non-restrained exposed
shingle tabs weakened the nailed connection, increasing the vulnerability of the shingle
to blow-off in strong wind gusts (Cullen 1992).
Development of the First Test Standards for Wind Resistance (1950 – 1980)
The 1950s saw the introduction of two tab sealing methods in order to improve
performance under wind loading (Cullen 1960). The first method consisted of a
thermally activated ‘self-seal’ adhesive strip that was applied on the asphalt shingle
during the manufacturing process. Early tab seals were typically resin-based materials,
which are asphalt byproducts that have a sudden softening point that would adhere the
leading edge of the shingle tab to the shingle below. Early formulations of resin-based
tab seals were susceptible to brittle fracture failures as a result of thermal fluctuations.
Today, tab sealants consist of either limestone or fly ash modified resins sealant or
polymer-modified bitumen (Nichols 2010). The second method consisted of a field
application of asphalt roof cement dollops along the underside of each shingle tab
46
(Cullen 1960). This method is still recommended for steep-slope roofs with a slope
greater than 60 degrees and for repairs to shingle tabs that have lost adherence of their
self-seal systems.
In the early 1950s, a letter survey was sent to military installations along the US
East Coast to ascertain the performance of asphalt shingles installed on their buildings.
The results were poor; 67% of those surveyed noted that wind damage had occurred
with their shingles. The survey results, coupled with increasing insurance claims on
wind damaged shingles, prompted the first investigation on asphalt shingle wind
performance in 1955, which was led by NBS. The goal of the investigation was to
assess the wind resistance of organic-reinforced asphalt shingles through laboratory,
simulated service and field performance evaluations (Cullen 1960).
There is some evidence that manufacturers were testing asphalt shingle wind
performance already prior to this NBS study (Cullen 1960). However, this is the first
published study of this kind. The major component of this investigation was the
laboratory simulated wind tests of asphalt shingle test decks. There were two goals to
this test:
1. Evaluation of the performance of free-tab shingles (i.e. unrestrained shingle tabs) and its correlation to the weight of the strip shingle.
2. Evaluation of the performance of restrained shingle tabs by either self-seal or asphalt roof cement methods.
At the time, free-tab systems were losing popularity to the restrained tab
systems. However, given amount of building stock still using the free-tab products, it
was important to understand how the weight of the shingle affected performance. This
would also be useful for later studies on restrained tabs that have lost their adhesive
bonds. The laboratory tests consisted of bond strength tests on the tab sealants and
47
wind storm simulation tests. In his report of the wind tests, Cullen (1960) notes that
laboratory wind tests fell short of completely simulating in-service wind behavior, but
that these tests may serve as a useful tool when combined with other methods. The
simulation was conducted by using an open jet configuration; however, no mention of
the flow characteristics of the jet (i.e., magnitude of turbulence) is provided in Cullen’s
report. A 1.2 m by 0.9 m (4 ft by 3 ft) test deck with a slope of two on twelve was placed
in front of the jet.
The free-tab test decks, nine in total, were subjected to a mean wind speed of 13
m/s (30 mph) for an unknown amount of time with the rise of the leading edge
measured to describe performance. Good performing free-tab shingles were defined as
having smaller lifts during wind testing. Not surprisingly, heavier shingles performed the
best and a near linear relationship between performance and weight was identified for a
given uniform shingle thickness.
The goal of the wind investigation was to assess the sealing characteristics of
several manufacture’s self-sealing three tab organic-reinforced shingles. Therefore, the
test decks containing self-sealing shingles, twelve in total, were subjected to three
different curing temperatures [49°C (120°F), 60°C (140°F), and 76°C (160°F)] for
sixteen hours each. The test consisted of four step-and-hold mean wind velocities of 13
m/s (30 mph), 18 m/s (40 mph), 22 m/s (50 mph), and 27 m/s (60 mph). The time held
at the first three wind velocities was not reported. The time for the 27 m/s (60 mph) test
was two hours. Failure for these tests was defined as failure of the adhesion on one
shingle tab. The tests revealed that nine of the twelve shingle deck specimens could
48
withstand 27 m/s (60 mph) for two hours when they were conditioned at 60°C (140°F)
for two hours. The remaining three required a 76°C (160°F) cure.
Bond strength tests correlated well with the wind tests findings. Twelve asphalt
shingle products were subjected to the same variation in cure temperature for five and
sixteen hours and then tested for uplift resistance of their tab seals (Cullen 1993). From
these two tests, it was reported that a cure temperature of 60°C (140°F) and time of 16
hours was adequate to evaluate the wind performance of self-sealing shingle systems.
To validate the findings of the laboratory tests, Cullen investigated the performance of
self-sealing shingle systems in the natural environment. Twenty-two test decks were
exposed for a period of one year in Washington D.C. starting in the spring. The tab
seals were periodically inspected for adherence and results showed that all decks had
full adhesion within fifty days. When the tab seal bonds were broken the following
December, all shingles resealed the following spring.
At the time of the Cullen (1960) report, no standard wind performance tests
existed for asphalt shingles, but as a result of this investigation the Underwriters
Laboratory (UL) 997 Wind Resistance of Prepared Roof Covering Materials (1995) was
developed. The test is similar to Cullen’s 1960 work in both test setup and conditioning.
When first drafted in 1960, 27 m/s (60 mph) was near the limit of fan controllability;
therefore, the test decks were subjected to a maximum of 27 m/s (60 mph) despite the
likelihood of higher in-service wind speeds. The American Society for Testing and
Materials (ASTM) D3161 Standard Test Method for Wind-Resistance of Asphalt
Shingles (2008b) was first published in 1972 with an identical test procedure. These
49
standards are based on data from shingles that were developed and manufactured
using 1950’s technology.
Following up on Cullen’s experiments, UL conducted a study of self-seal organic-
reinforced asphalt shingle response to higher wind speeds and wind speed fluctuations
(Benjamin and Bono 1967). This research was conducted using a larger fan system
capable of wind speeds up to 44 m/s (100 mph); additional tests were conducted on
shingles that passed the UL 997 27 m/s (60 mph) wind test. All of the 225 shingle test
decks passed a 15 minute, 33 m/s (75 mph) mean wind test and 95% of the test decks
passed a 5 minute, 44 m/s (100 mph) mean wind speed test. To replicate the fluctuating
component of the wind speed, the wind speed was varied between 13 m/s (30 mph) and
44 m/s (100 mph). Each wind speed was held for 60 s for some decks and 30 s for
others before a series of wind speed changes cycling from 13 m/s (30 mph) to 44 m/s
(100 mph) for a total of 20 oscillations were applied. All test decks passed the wind
fluctuation tests. While results of higher wind speed research showed good asphalt
shingle wind performance in simulated hurricane-strength wind speeds, concerns
surrounding the validity of the ASTM D3161 (ASTM 2013) and UL 997 (UL 2005) test
methods soon followed.
With the advent of the asphalt shingle self-seal tab system and its improved wind
resistance, the weight of the asphalt shingle was no longer the main source of wind
resistance. This allowed the use of lighter weight and cheaper shingle mats (Cash
1995). In 1960, glass fiber strand-based mats were introduced as a replacement to the
organic material-based mat (Cullen 1992). The drawback to the fiberglass mat is an
increase in flexibility of the shingle; that is, if a self-seal were to fail the shingle would be
50
more likely to lift in the wind compared to a heavier and stiffer organic-reinforced
shingle. Beyond their lighter weight and lower manufacturing costs, the new “fiberglass”-
fiberglass shingles contain a chemical saturant that gave the fiberglass-reinforced
shingles a Class A fire rating. Organic-reinforced asphalt shingles typically have a lower
class (Class C) rating due to the combustibility of the organic material. The growth of
the fiberglass-reinforced asphalt shingle market can be partly attributed to the increase
in condominium and commercial construction that required Class A fire ratings. By
1982, production of fiberglass-reinforced asphalt shingles overtook organic-reinforced
asphalt shingle production; a trend that has continued (Cash 1995).
The Development of the Asphalt Shingle Wind Uplift Model (1980-1997)
The goal of the UL 997 test was to provide a predictive method for in-service
asphalt shingle wind performance. However, during in-house product testing in the early
1980s using the UL 997 wind test standard, Owens-Corning Fiberglas observed no
appreciable shingle performance differences between products that should have
produced significantly different results. Following this, Drs. Jon Peterka and Jack
Cermak of Colorado State University (CSU) were contracted by Owen-Corning to
reevaluate UL 997 and develop a more refined test method that would more accurately
simulate in-service wind loading conditions. This work (Peterka and Cermak 1983) lead
to today’s asphalt shingle wind uplift model.
Dr. Peterka’s experiments concentrated on modifying the UL 997 procedure to
include more realistic wind effects. The standard 0.9 m by 1.2 m (3 ft by 4 ft) test deck
was placed inside CSU’s Meteorological Boundary-Layer Wind Tunnel to conduct tests
using turbulent boundary layer wind that simulated the natural wind behavior (Figures 3-
1 and 3-2). Unsealed organic-reinforced and fiberglass-reinforced shingles from several
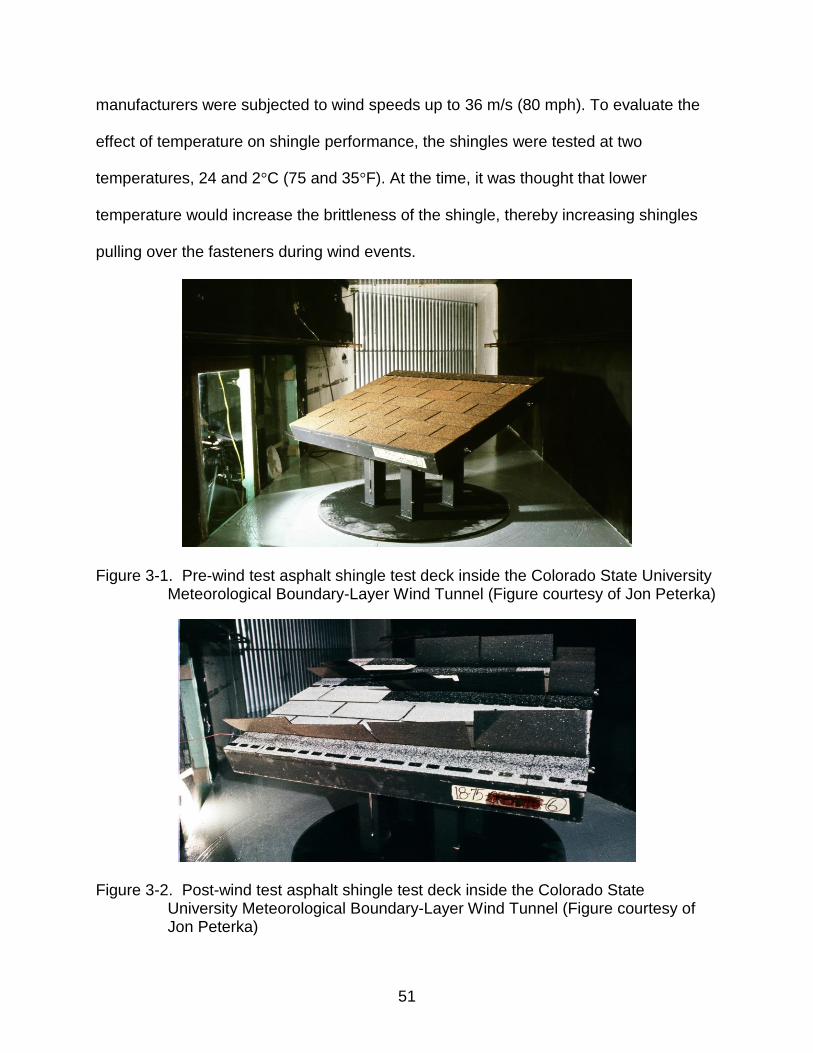
51
manufacturers were subjected to wind speeds up to 36 m/s (80 mph). To evaluate the
effect of temperature on shingle performance, the shingles were tested at two
temperatures, 24 and 2°C (75 and 35°F). At the time, it was thought that lower
temperature would increase the brittleness of the shingle, thereby increasing shingles
pulling over the fasteners during wind events.
Figure 3-1. Pre-wind test asphalt shingle test deck inside the Colorado State University Meteorological Boundary-Layer Wind Tunnel (Figure courtesy of Jon Peterka)
Figure 3-2. Post-wind test asphalt shingle test deck inside the Colorado State
University Meteorological Boundary-Layer Wind Tunnel (Figure courtesy of Jon Peterka)
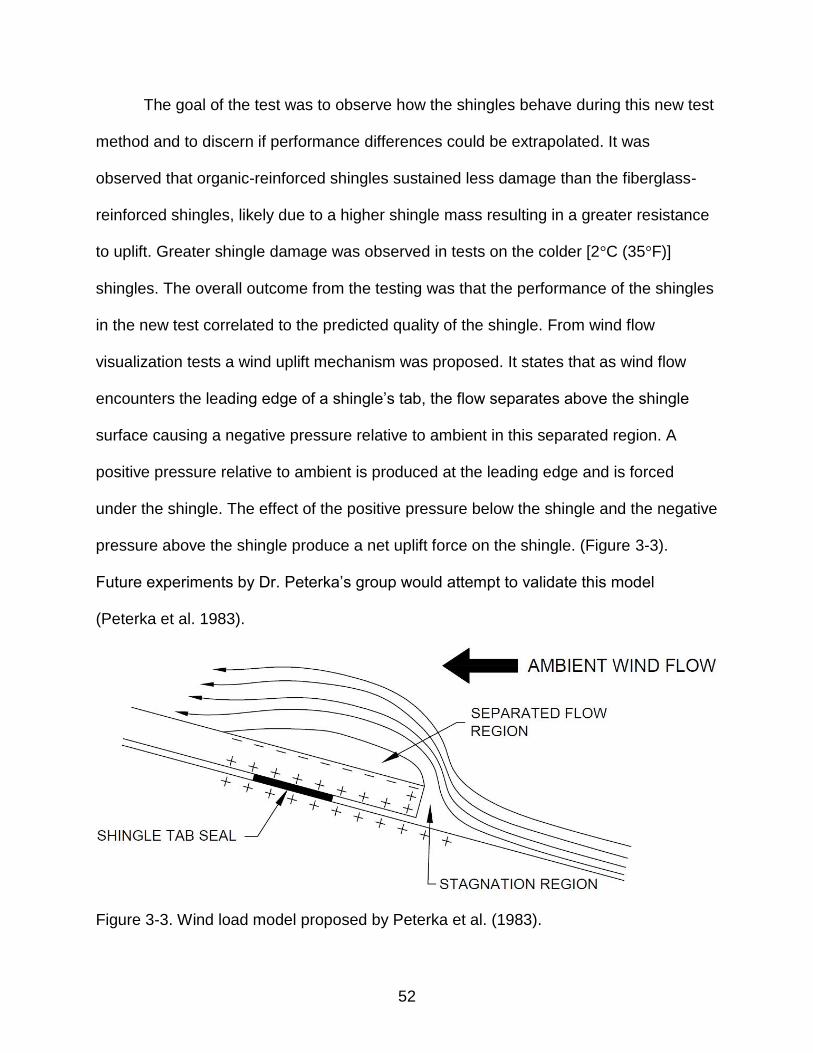
52
The goal of the test was to observe how the shingles behave during this new test
method and to discern if performance differences could be extrapolated. It was
observed that organic-reinforced shingles sustained less damage than the fiberglass-
reinforced shingles, likely due to a higher shingle mass resulting in a greater resistance
to uplift. Greater shingle damage was observed in tests on the colder [2°C (35°F)]
shingles. The overall outcome from the testing was that the performance of the shingles
in the new test correlated to the predicted quality of the shingle. From wind flow
visualization tests a wind uplift mechanism was proposed. It states that as wind flow
encounters the leading edge of a shingle’s tab, the flow separates above the shingle
surface causing a negative pressure relative to ambient in this separated region. A
positive pressure relative to ambient is produced at the leading edge and is forced
under the shingle. The effect of the positive pressure below the shingle and the negative
pressure above the shingle produce a net uplift force on the shingle. (Figure 3-3).
Future experiments by Dr. Peterka’s group would attempt to validate this model
(Peterka et al. 1983).
Figure 3-3. Wind load model proposed by Peterka et al. (1983).
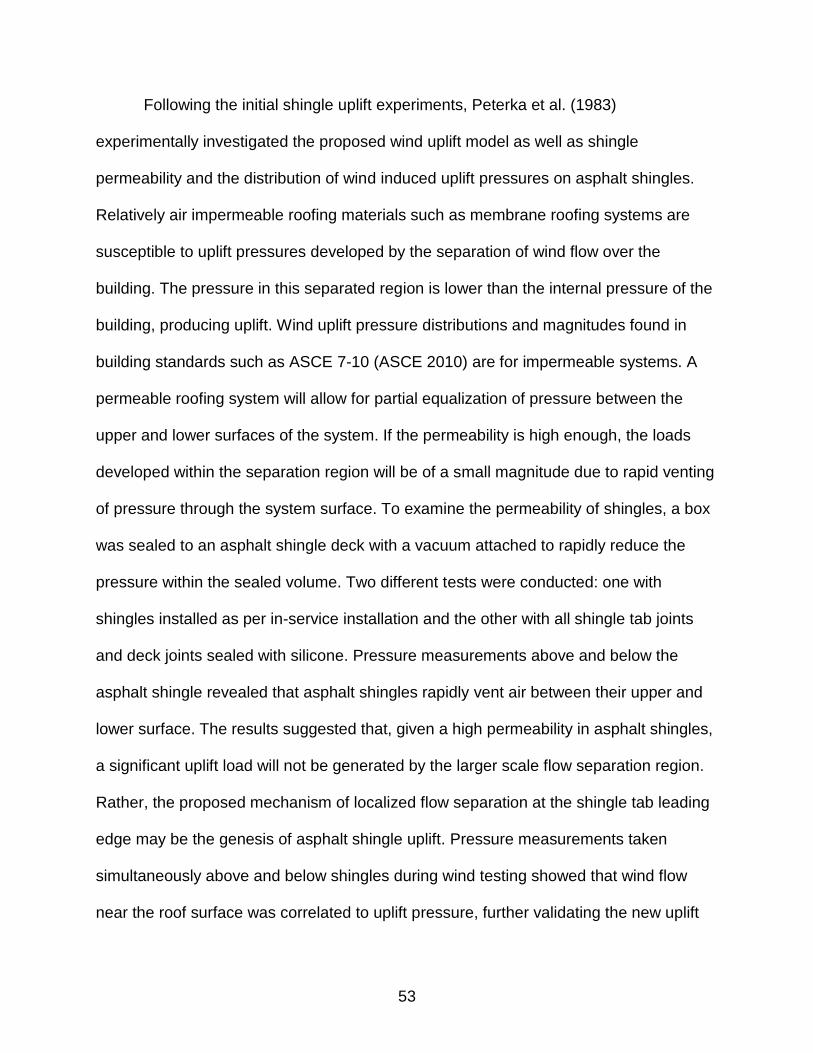
53
Following the initial shingle uplift experiments, Peterka et al. (1983)
experimentally investigated the proposed wind uplift model as well as shingle
permeability and the distribution of wind induced uplift pressures on asphalt shingles.
Relatively air impermeable roofing materials such as membrane roofing systems are
susceptible to uplift pressures developed by the separation of wind flow over the
building. The pressure in this separated region is lower than the internal pressure of the
building, producing uplift. Wind uplift pressure distributions and magnitudes found in
building standards such as ASCE 7-10 (ASCE 2010) are for impermeable systems. A
permeable roofing system will allow for partial equalization of pressure between the
upper and lower surfaces of the system. If the permeability is high enough, the loads
developed within the separation region will be of a small magnitude due to rapid venting
of pressure through the system surface. To examine the permeability of shingles, a box
was sealed to an asphalt shingle deck with a vacuum attached to rapidly reduce the
pressure within the sealed volume. Two different tests were conducted: one with
shingles installed as per in-service installation and the other with all shingle tab joints
and deck joints sealed with silicone. Pressure measurements above and below the
asphalt shingle revealed that asphalt shingles rapidly vent air between their upper and
lower surface. The results suggested that, given a high permeability in asphalt shingles,
a significant uplift load will not be generated by the larger scale flow separation region.
Rather, the proposed mechanism of localized flow separation at the shingle tab leading
edge may be the genesis of asphalt shingle uplift. Pressure measurements taken
simultaneously above and below shingles during wind testing showed that wind flow
near the roof surface was correlated to uplift pressure, further validating the new uplift
54
model. Expected uplift pressures for asphalt shingles subjected to 80 mph wind testing
varied from 48 to 144 Pa (1 to 3 psf), significantly lower than pressures found on
impermeable roofing systems. The results of these two studies (Peterka and Cermak
1983; Peterka et al. 1983) provided three major conclusions about asphalt shingle wind
loading:
1. For wind flowing up the roof slope, localized flow separation at the leading edge of the shingle tab may be the largest contributor to asphalt shingle wind uplift. Asphalt shingles are a relatively permeable material and may not be significantly affected by the larger scale flow separation bubble.
2. Near roof surface wind speed may be used as a prediction for asphalt shingle uplift pressures.
3. Near freezing temperatures may increase the brittleness of fiberglass-reinforced asphalt shingles; which, in turn, may increase the vulnerability of the wind related damage.
Seeking to develop a more refined predictive method for asphalt shingle wind
resistance than the current UL 997 (UL 1995) and ASTM D3161 (ASTM 2013) test
standards, ARMA formed the High Wind Task Force in 1990. The goal of the task force
was to determine the relationship between wind speeds and asphalt shingle tab uplift
resistance (Shaw 1991). A two phase program was developed: 1) develop a
standardized test method that would determine the uplift resistance of a shingle tab’s
self-seal adhesive strip (described in the next section), 2) define the physics of shingle
wind uplift and resulting loads on the tab’s adhesive strip (described below). Dr. Peterka
and his colleagues were contracted to perform the wind tunnel and outdoor studies that
validated the asphalt shingle load model previously developed (Peterka and Cermak
1983; Peterka et al. 1983). He proposed the asphalt shingle uplift equation shown in
Equation 3-1.
55
(
)
(3-1)
where: is the peak uplift pressure that the shingle must resist, is the density of air,
is the mean approach wind velocity at the eave height of the building, is the
peak gust wind speed on the roof, and is the uplift differential pressure coefficient,
unique for each shingle design.
With this equation, the peak uplift pressure exerted on a shingle can be predicted
by knowing the approach flow characteristics, the near roof surface wind flow
characteristics, and the uplift pressure coefficient that will be unique to each shingle
design. Building standards such as ASCE 7-10 (ASCE 2010) represent uplift loads as
pressure coefficients, a dimensionless number that defines the relative pressure for a
given flow field independent of the flow velocity. For asphalt shingles, a differential
pressure coefficient is used to describe the net uplift pressure on asphalt shingles. The
wind experiments conducted in the early 1990s by Peterka et al. (1997) investigated
parameters of the components in this uplift equation by three methods:
1. Magnitude and distribution of near roof surface wind flow on model-scale residential buildings in a boundary-layer wind tunnel.
2. Correlation between near surface roof flow and uplift pressures generated on a full-scale asphalt shingle test deck in a boundary-layer wind tunnel.
3. Evaluation of uplift pressures and near roof surface wind flow generated on a full-scale residential building located outdoors and subject to natural wind.
For component one, three 1:25 scale t-shape model buildings were constructed
(Figure 3-4a) with roof slopes of 2:12, 5:12, and 9:12. Also tested was a 1:25 scale-
model gable roofed building that matched a full-scale building constructed for validation
of the model-scale data (Figure 3-4b). Each building was placed inside the boundary-
56
layer wind tunnel at CSU and subjected to a wind flow corresponding to open country
exposure [i.e. ASCE 7-10 Exposure C (ASCE 2010)]. Because the flow near the roof
surface was of greatest interest for asphalt shingle wind loading, flow measurements
were taken over each building’s roof surfaces at a height of 1 mm [0.04 in (25 mm at full
scale)] above the roof surface. The ratio between the peak observed near roof surface
wind speed and the mean wind speed of the upwind airflow is needed for Equation 3-1.
An upper bound ratio of 2.5 was observed in the scaled model wind tunnel tests. The
highest observed near roof surface wind speeds for all four buildings were located near
the intersection of the roof ridge and gable end (Cochran et al. 1999).
A B
Figure 3-4. Test setups for wind testing of asphalt shingles. A) Model-scale wind tunnel tests measuring near roof surface flow. B) Full-scale outdoor test measuring simultaneous wind flow and asphalt shingle pressures. (Figures courtesy of Jon Peterka)
The design of the leading edge of the asphalt shingle plays an important role on
the aerodynamics of asphalt shingle uplift These design factors may include: the
location of the self-seal adhesive, the installed pattern (or distribution) of the self-seal
adhesive (i.e. a discontinuous pattern may allow airflow behind the seal, increasing the
pressure on the underside; thereby increasing the net uplift on the shingle), and the
profile of the leading edge of the shingle tab (i.e. thick butt, sharp edge, etc.). The
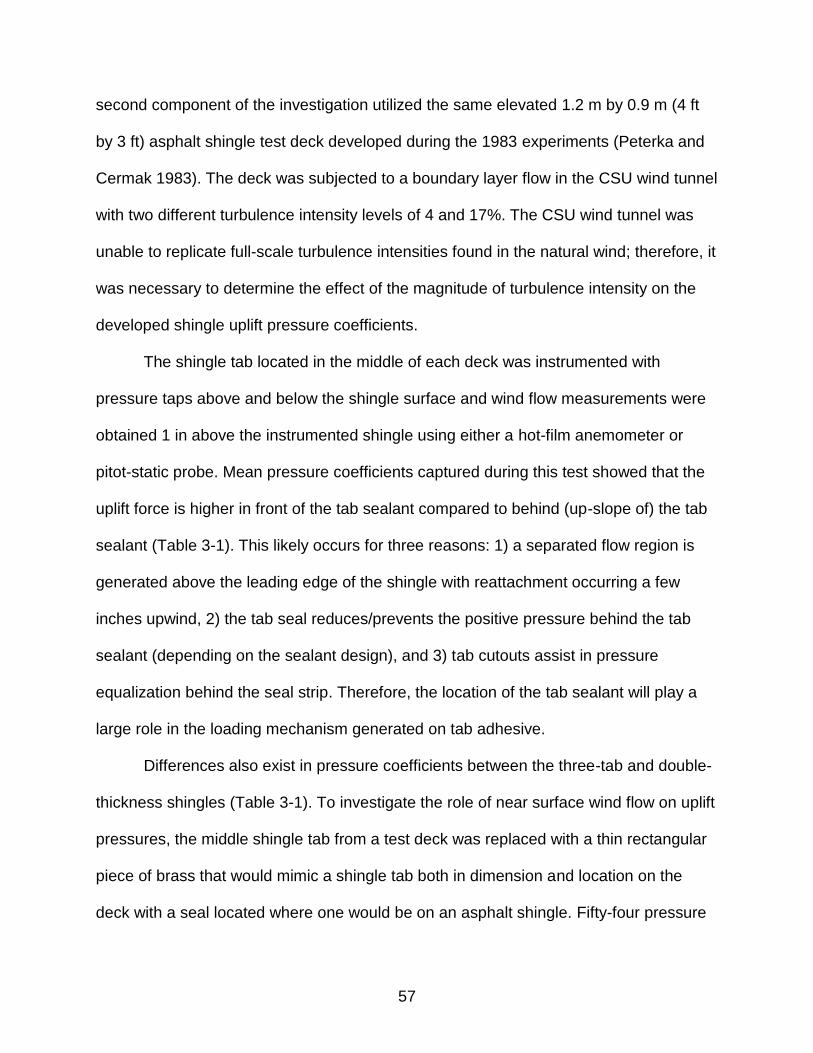
57
second component of the investigation utilized the same elevated 1.2 m by 0.9 m (4 ft
by 3 ft) asphalt shingle test deck developed during the 1983 experiments (Peterka and
Cermak 1983). The deck was subjected to a boundary layer flow in the CSU wind tunnel
with two different turbulence intensity levels of 4 and 17%. The CSU wind tunnel was
unable to replicate full-scale turbulence intensities found in the natural wind; therefore, it
was necessary to determine the effect of the magnitude of turbulence intensity on the
developed shingle uplift pressure coefficients.
The shingle tab located in the middle of each deck was instrumented with
pressure taps above and below the shingle surface and wind flow measurements were
obtained 1 in above the instrumented shingle using either a hot-film anemometer or
pitot-static probe. Mean pressure coefficients captured during this test showed that the
uplift force is higher in front of the tab sealant compared to behind (up-slope of) the tab
sealant (Table 3-1). This likely occurs for three reasons: 1) a separated flow region is
generated above the leading edge of the shingle with reattachment occurring a few
inches upwind, 2) the tab seal reduces/prevents the positive pressure behind the tab
sealant (depending on the sealant design), and 3) tab cutouts assist in pressure
equalization behind the seal strip. Therefore, the location of the tab sealant will play a
large role in the loading mechanism generated on tab adhesive.
Differences also exist in pressure coefficients between the three-tab and double-
thickness shingles (Table 3-1). To investigate the role of near surface wind flow on uplift
pressures, the middle shingle tab from a test deck was replaced with a thin rectangular
piece of brass that would mimic a shingle tab both in dimension and location on the
deck with a seal located where one would be on an asphalt shingle. Fifty-four pressure
58
taps were installed on the brass shingle (half on the top surface, half on the bottom
surface) as this would allow for larger area averages to be determined. The deck was
placed on the floor, oriented such that the generated wind flow would travel up the 4:12
sloped test deck with a smooth curved transition between the wind tunnel floor and the
test deck. As with the previous pressure measurements, near surface roof flow at 25
mm (1 in) above the brass shingle was captured. From this data it was observed that
asphalt shingle uplift pressures correlate with near roof surface flow in flow fluctuations
up to 12 Hz for a wind flow of 10 m/s (22.5 mph).
Table 3-1. Wind-tunnel-measured three-tab shingle with cutouts
Shingle part Shingle thickness
Single, ~2.8 in Double, ~5.6 in
Seal strip to front edge -0.4 -0.8
Top of cutout to seal strip -0.1 -0.1
Top of cutout to front edge for unsealed shingle
-0.4 -0.8
The final component of the investigation was the validation of wind tunnel test
data using a full-scale, gable roofed building constructed outside in a windy location
near Fort Collins, CO. The house consisted of a 7 m by 10.5 m (23 ft by 34.5 ft) one-
story building with a 5:12 gable roof. Three-tab fiberglass-reinforced asphalt shingles
were installed on the roof with pressure taps installed above and below the shingles at
several locations on the roof. To capture simultaneous velocity and pressure data,
unidirectional velocity sensors were installed above the tapped shingles and oriented
down the roof slope. The house could be rotated 360 degrees to provide uplift/velocity
data for all wind azimuths. To capture the approach flow conditions, a 60 m (197 ft)
instrumented meteorological tower was located near the house and a 10 m (33 ft)
59
meteorological tower was installed upwind of the house. Data from the observation
towers, shingle pressure transducers, and roof surface velocity sensors were captured
during strong wind storms with peak wind gusts ranging from 13 m/s (30 mph) to 27+
m/s (60+ mph). Several observations were made from the comparison of the full-scale
outdoor tests and the wind tunnel experiments:
1. The full-scale data appeared to validate the wind-tunnel data, and the highest pressures observed were within the prediction of the uplift model.
2. For wind flow up the roof slope, asphalt shingle uplift pressures correlated well with near surface roof flow.
3. The highest observed shingle uplift pressures corresponded to a 50 degree wind azimuth relative to ridge line of building (Figure 3-5). Due to the unidirectional nature of the velocity sensors, only the upslope component of the wind velocity vector could be obtained for this azimuth.
4. Significant shingle uplift pressures were observed for wind flow approaching the leeward side of the roof (with respect to the instrumented shingles). While the wind uplift model only describes wind flow up the roof slope, it may correctly model the local flow at other wind azimuths.
From Peterka et al. (1997), ARMA and UL drafted a standard test method to
determine the loads generated on a shingle’s tab seal. The UL 2390 Test Methods for
Wind Resistant Asphalt Shingles with Sealed Tabs (UL 2003) was published in May
2003; while the identical ASTM D7158 Wind Resistance of Asphalt Shingles (Uplift
Force / Uplift Resistance Method) (ASTM 2011c) was first published in 2005.
These standards are based on a standards development report (Peterka and
Esterday 2000) that is not publically available, since the provisions are published in the
standard. These methods can be broken up into three parts:
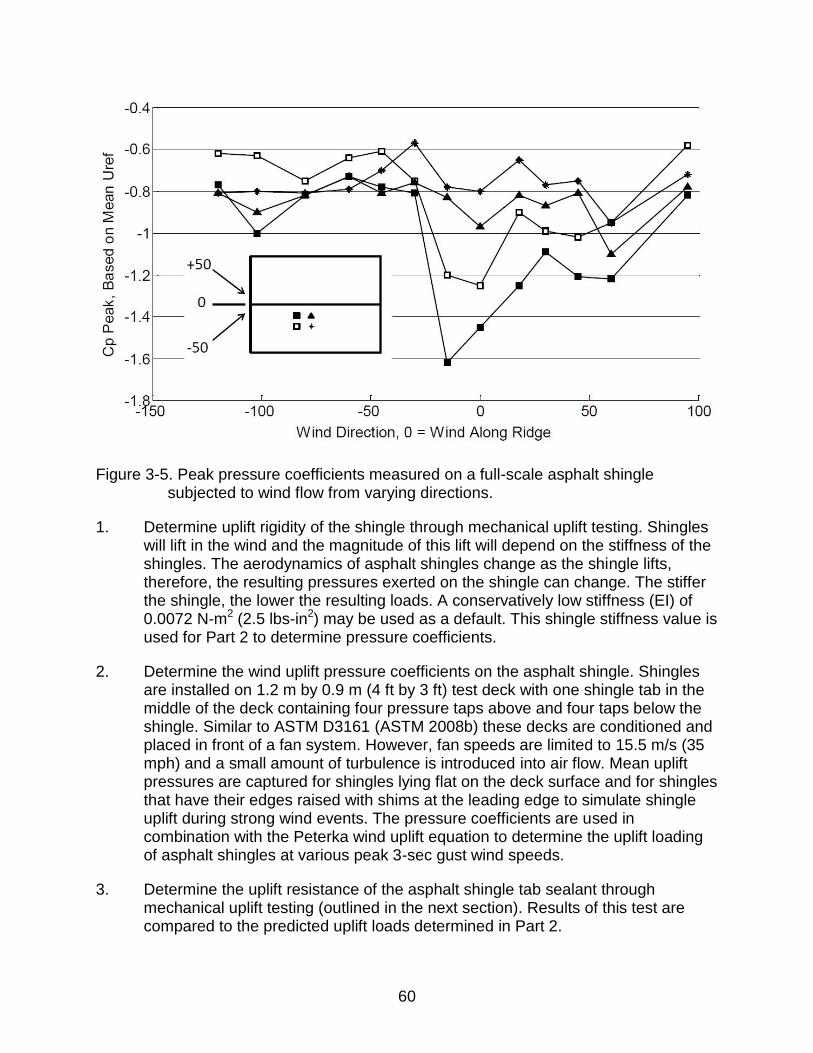
60
Figure 3-5. Peak pressure coefficients measured on a full-scale asphalt shingle
subjected to wind flow from varying directions.
1. Determine uplift rigidity of the shingle through mechanical uplift testing. Shingles will lift in the wind and the magnitude of this lift will depend on the stiffness of the shingles. The aerodynamics of asphalt shingles change as the shingle lifts, therefore, the resulting pressures exerted on the shingle can change. The stiffer the shingle, the lower the resulting loads. A conservatively low stiffness (EI) of 0.0072 N-m2 (2.5 lbs-in2) may be used as a default. This shingle stiffness value is used for Part 2 to determine pressure coefficients.
2. Determine the wind uplift pressure coefficients on the asphalt shingle. Shingles are installed on 1.2 m by 0.9 m (4 ft by 3 ft) test deck with one shingle tab in the middle of the deck containing four pressure taps above and four taps below the shingle. Similar to ASTM D3161 (ASTM 2008b) these decks are conditioned and placed in front of a fan system. However, fan speeds are limited to 15.5 m/s (35 mph) and a small amount of turbulence is introduced into air flow. Mean uplift pressures are captured for shingles lying flat on the deck surface and for shingles that have their edges raised with shims at the leading edge to simulate shingle uplift during strong wind events. The pressure coefficients are used in combination with the Peterka wind uplift equation to determine the uplift loading of asphalt shingles at various peak 3-sec gust wind speeds.
3. Determine the uplift resistance of the asphalt shingle tab sealant through mechanical uplift testing (outlined in the next section). Results of this test are compared to the predicted uplift loads determined in Part 2.
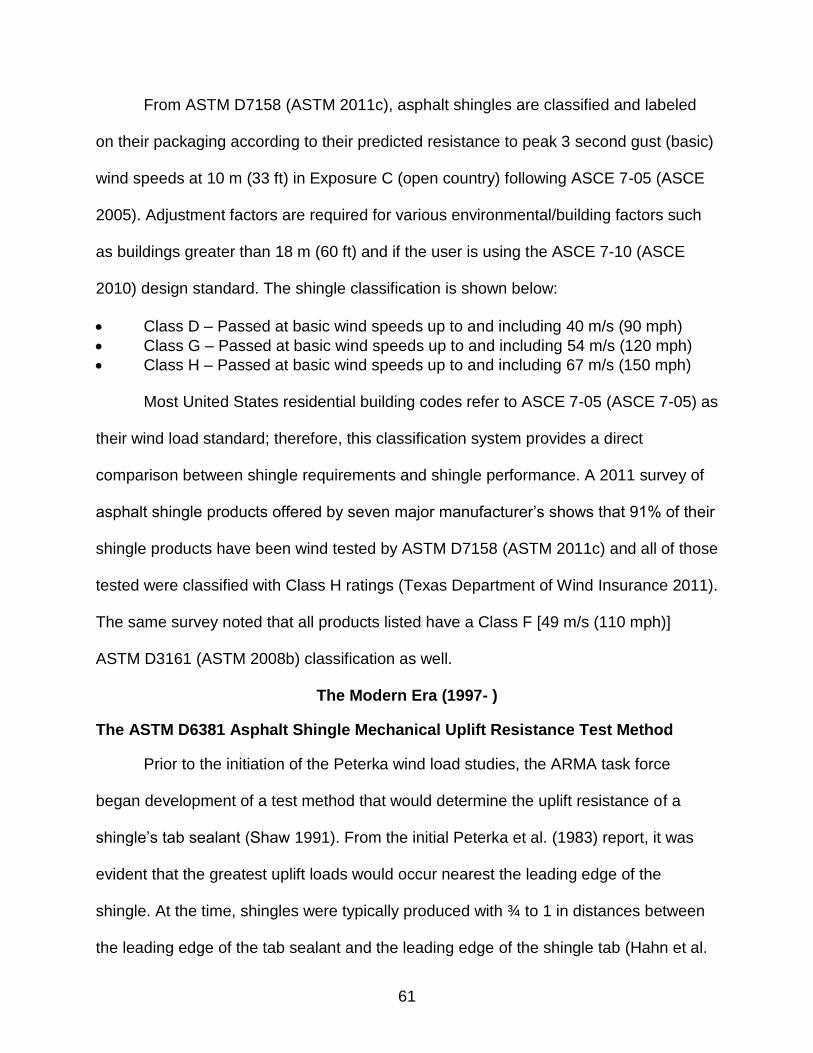
61
From ASTM D7158 (ASTM 2011c), asphalt shingles are classified and labeled
on their packaging according to their predicted resistance to peak 3 second gust (basic)
wind speeds at 10 m (33 ft) in Exposure C (open country) following ASCE 7-05 (ASCE
2005). Adjustment factors are required for various environmental/building factors such
as buildings greater than 18 m (60 ft) and if the user is using the ASCE 7-10 (ASCE
2010) design standard. The shingle classification is shown below:
Class D – Passed at basic wind speeds up to and including 40 m/s (90 mph)
Class G – Passed at basic wind speeds up to and including 54 m/s (120 mph)
Class H – Passed at basic wind speeds up to and including 67 m/s (150 mph) Most United States residential building codes refer to ASCE 7-05 (ASCE 7-05) as
their wind load standard; therefore, this classification system provides a direct
comparison between shingle requirements and shingle performance. A 2011 survey of
asphalt shingle products offered by seven major manufacturer’s shows that 91% of their
shingle products have been wind tested by ASTM D7158 (ASTM 2011c) and all of those
tested were classified with Class H ratings (Texas Department of Wind Insurance 2011).
The same survey noted that all products listed have a Class F [49 m/s (110 mph)]
ASTM D3161 (ASTM 2008b) classification as well.
The Modern Era (1997- )
The ASTM D6381 Asphalt Shingle Mechanical Uplift Resistance Test Method
Prior to the initiation of the Peterka wind load studies, the ARMA task force
began development of a test method that would determine the uplift resistance of a
shingle’s tab sealant (Shaw 1991). From the initial Peterka et al. (1983) report, it was
evident that the greatest uplift loads would occur nearest the leading edge of the
shingle. At the time, shingles were typically produced with ¾ to 1 in distances between
the leading edge of the tab sealant and the leading edge of the shingle tab (Hahn et al.
62
2004). The resultant wind loading on this cantilever span would produce a peel-type
uplift force on tab sealant. The mechanical uplift test was developed to simulate this
loading condition. The test specimen consisted of 89 mm (3.5 in) wide by 178 (7 in) long
asphalt shingle lower piece with an 89 mm (3.5 in) wide by 102 mm (4 in) long upper tab
piece. The tab was installed over the lower piece’s sealant such that the in-service tab
bond is replicated. Prior to uplift testing the bond between the lower and upper shingle
was conditioned at 60°C (140°F) for 16 hours; the same as the ASTM D3161 (ASTM
2013) and UL 997 (UL 1995) conditioning procedure. Mechanical uplift testing consisted
of the specimen attached to a clamp assembly along the 89mm (3.5 in) edges. The
uplift load was generated from a clamp affixed along the leading edge of the shingle
specimen. This clamp was connected to a universal testing machine, which provided a
constant velocity uplift of 127 mm/min (5 in/min) and simultaneous measurement of
uplift load on the shingle tab. Seven testing labs were utilized for round robin testing of
this draft standard to confirm repeatability of test methods and results (Shaw 1991).
After confirmation, the standard published in 1999 and designated as ASTM D6381
Standard Test Method for Measurement of Asphalt Shingle Mechanical Uplift
Resistance (ASTM 2008b).
As described below, recent modifications to the mechanical uplift test have been
made in response to changes in the tab sealant design and market trends. Many
shingles now have tabs seals located closer to the shingle tab’s leading edge. A
decrease in distance between the tab sealant and the leading edge will reduce the total
uplift loading generated ahead of the sealant. Therefore, this loading mechanism can
change from a peel-type to a direct tension-type loading (Hahn et al. 2004). The way an
63
adhesive is loaded (i.e. peeling, direct tension, etc.) is known to have a significant effect
on its strength (Shiao et al. 2003b). Results of asphalt shingle tab sealant mechanical
uplift resistance tests comparing peel, direct tension, and combined showed that direct
tension produced over double the resistance of the D6381 peel-type resistance (Shiao
et al. 2003b). The combined test consisted of an attachment that mimicked the Peterka
wind load model (Peterka et al. 1997) with forces being generated on shingle
specimens ahead and behind the tab sealant. The sealant strength for this loading fell
between the low peel strength and high direct tension strength, suggesting that the
actual loading of a tab seal is a combination of peel and direct tension. As a result, the
2008 edition of ASTM D6381 (ASTM 2008b) test requires direct tension testing be
conducted along with the original peel test. Depending upon the magnitude of the
pressure coefficients obtained from ASTM D7158 (ASTM 2011c) or UL 2390 (UL 2003)
testing, the results of each test may be used separately or in combination to determine
total uplift resistance of a shingle’s tab seal (Hahn et al. 2004).
Questions remain on the applicability of this test method to predicting in-service
shingle wind resistance. Foremost among them is the loading protocol; which specifies
a constant displacement velocity of 127 mm/min (5 in/min). Near roof surface wind flow
is turbulent in nature; therefore, the uplift loading from wind will also contain fluctuations
(Peterka et al. 1997). Shiao et al. (2003b) has shown that an increase in loading rate
correlates to a higher shingle tab seal resistance [i.e. the current ASTM D6381 (ASTM
2008b) loading rate produces conservative resistance results]. However, shingles are
potentially subjected to thousands of wind gusts throughout their lifetime and the long-
term performance of shingle tab seal to these fluctuations (i.e. fatigue resistance) has
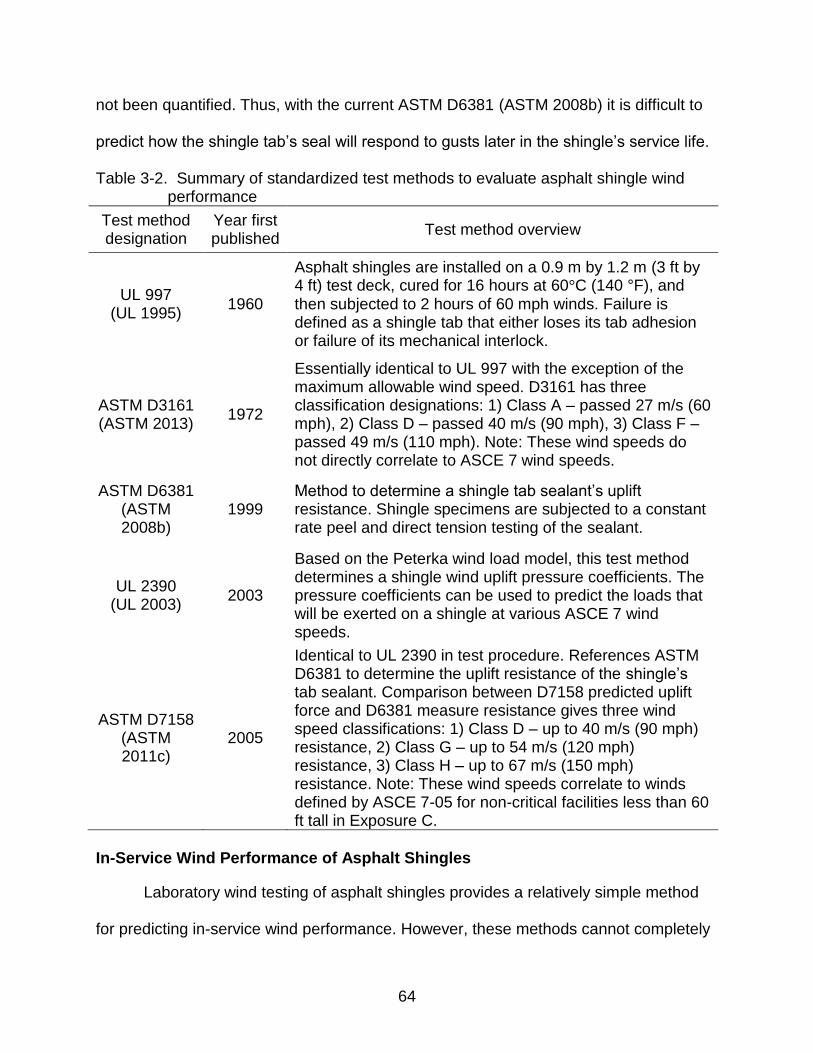
64
not been quantified. Thus, with the current ASTM D6381 (ASTM 2008b) it is difficult to
predict how the shingle tab’s seal will respond to gusts later in the shingle’s service life.
Table 3-2. Summary of standardized test methods to evaluate asphalt shingle wind performance
Test method designation
Year first published
Test method overview
UL 997 (UL 1995)
1960
Asphalt shingles are installed on a 0.9 m by 1.2 m (3 ft by 4 ft) test deck, cured for 16 hours at 60°C (140 °F), and then subjected to 2 hours of 60 mph winds. Failure is defined as a shingle tab that either loses its tab adhesion or failure of its mechanical interlock.
ASTM D3161 (ASTM 2013)
1972
Essentially identical to UL 997 with the exception of the maximum allowable wind speed. D3161 has three classification designations: 1) Class A – passed 27 m/s (60 mph), 2) Class D – passed 40 m/s (90 mph), 3) Class F – passed 49 m/s (110 mph). Note: These wind speeds do not directly correlate to ASCE 7 wind speeds.
ASTM D6381 (ASTM 2008b)
1999 Method to determine a shingle tab sealant’s uplift resistance. Shingle specimens are subjected to a constant rate peel and direct tension testing of the sealant.
UL 2390 (UL 2003)
2003
Based on the Peterka wind load model, this test method determines a shingle wind uplift pressure coefficients. The pressure coefficients can be used to predict the loads that will be exerted on a shingle at various ASCE 7 wind speeds.
ASTM D7158 (ASTM 2011c)
2005
Identical to UL 2390 in test procedure. References ASTM D6381 to determine the uplift resistance of the shingle’s tab sealant. Comparison between D7158 predicted uplift force and D6381 measure resistance gives three wind speed classifications: 1) Class D – up to 40 m/s (90 mph) resistance, 2) Class G – up to 54 m/s (120 mph) resistance, 3) Class H – up to 67 m/s (150 mph) resistance. Note: These wind speeds correlate to winds defined by ASCE 7-05 for non-critical facilities less than 60 ft tall in Exposure C.
In-Service Wind Performance of Asphalt Shingles
Laboratory wind testing of asphalt shingles provides a relatively simple method
for predicting in-service wind performance. However, these methods cannot completely
65
replicate the conditions that shingles are subjected to once they are installed. A key
component to understanding shingle wind resistance is observations that are made
following shingle damage caused by wind events. Since 1989, damage assessments
made by organizations and federal agencies such as FEMA and RICOWI have provided
“ground truth” on asphalt shingle performance. The observations made in these reports
provide an opportunity to evaluate deficiencies in products, design, and installation. An
overview of selected damage report observations is provided below.
Hurricane Hugo made landfall on the east coast of South Carolina in 1989 as a
Category 4 hurricane on the Saffir-Simpson scale. Damage observations of asphalt
shingle roofing by Smith and McDonald (1990) noted highly variable wind uplift
performance of shingles, with some houses sustaining no damage, while others nearby
sustained complete shingle loss. The damage was primarily attributed to weak tab
seals. Improperly located fasteners were also often observed at damaged roofs. Failure
of the roof covering did not only just impact the covering itself. Rather, in financial terms,
the resulting interior losses caused by roofing failure were often greater than loss from
the roof covering. Smith concluded that standardized wind testing of roof coverings,
including the ASTM D3161 (ASTM 2013) for asphalt shingles, appeared deficient in
predicting wind performance. This observation would be repeated after Hurricane
Andrew made landfall in South Florida in 1992, also causing damage to asphalt roofing
systems on houses (Smith 1995).
Improperly located shingle fasteners have often been observed at damaged
shingles (FEMA 2005a; Smith 1995; Smith and McDonald 1990). However, the extent to
which the installation plays on the wind resistance of the shingle has not yet been
66
quantified. Pull-through of the shingle over the fasteners is often attributed to improper
fastener placement. Smith and Millen (1999) note that it is “unrealistic to expect
fasteners to be located exactly in the specified locations.” Furthermore, wind tunnel
tests on unsealed asphalt shingles with misplaced fasteners showed a decrease in wind
performance, but no definitive conclusions could be made regarding variations in
placement (Smith and Millen 1999). A common observation throughout post-storm
reports is the failure of roof details such as hip, ridge, eave, and rake shingle conditions
(FEMA 2005a; FEMA 2005b; FEMA 2006; FEMA 2009; IBHS 2009). These failures
appear to be independent of the age of the roof and more closely tied to the design and
installation of these edge conditions. Bonding of the hip and ridge caps appears to be
an ongoing issue, and starter courses along the eave were often improperly installed.
The implications of failures to these areas of the roof range from a minor exposure of
the hip and ridge deck joints to a more widespread failure propagating from eave and
rake edge failures. While damage reports continue to be a valuable source of
information, more work is necessary to understand the role of installation variability in
asphalt shingle wind performance.
Throughout the 2000s, hurricanes impacted the Southeast and Gulf Coast US
causing extensive shingle damage. Shingle performance was variable (RICOWI 2006).
An Insurance Institute of Business & Home Safety (IBHS 2009) study of shingle
damage in Hurricane Ike showed variable performance amongst products with the same
ASTM D7158 Class H (150 mph) rating (ASTM 2011c). Wind speeds at the investigated
site were 49 m/s (110 mph) [peak 3-second gust at 10 m (33 ft), Exposure C], below
design level. Based on their findings, IBHS “suggests that there remain significant
67
differences between roof cover products with the same nominal design.” Liu et al.
(2010) conducted an asphalt shingle damage survey in Texas after Hurricane Ike and
Gustav in 2008 and found that homes with newer (less than 5 years old) shingle
installations performed significantly better than older shingle roofs (greater than 5 years
old), although it was not certain if age or changes to the building code around 2002 was
the cause. This performance gap was also noted by RICOWI (2006) after Hurricane
Charley struck Florida in 2004 and by Gurley and Masters (2011) in a post-2004
hurricane season building performance survey. All three studies postulated that, while
product improvement could be attributed to the better performance of newer roofs, the
effects of aging could not be discounted. Experiments by Terrenzio et al. (1997) and
Shiao et al. (2003a) have noted that the greatest cause of asphalt shingle aging is
thermal loading. Over time, the asphalt within the shingle becomes oxidized causing
embrittlement of the shingle. Currently, no studies have quantified the effects of aging
on asphalt shingle wind performance. Considering that a shingle’s tab adhesive is
based upon an asphaltic formulation, what effects would this potential oxidation reaction
have on the tab seals adhesive strength? The current ASTM D7158 (ASTM 2011c),
ASTM D6381 (ASTM 2008b), and UL 2390 (UL 2003) standard test methods only
provide information on the performance of new, laboratory prepared asphalt shingles,
making estimation of the long-term performance of the tab adhesive difficult.
68
CHAPTER 4 UNSEALED NATURALLY AGED ASPHALT SHINGLES AND THEIR VULNERABILITY
IN WIND
The first of two studies presented in this chapter describes a field assessment of
30 single-family homes in Florida and Texas to characterize the occurrence of unsealed
shingles on field, hip, and ridge roof regions. In the second study, 17 asphalt shingle
roof systems were subjected to full-scale wind testing at the Insurance Institute of
Business & Home Safety (IBHS) Research Center. The findings indicate that unsealing
of shingles may have been a contributor to shingle roof cover damage reported in post-
hurricane assessments (FEMA 2005a; FEMA 2005b; FEMA 2009; Gurley and Masters
2011; Liu et al. 2010; Rickborn 1992; RICOWI 2006; RICOWI 2007). A strong
correlation is demonstrated between partially unsealed shingles, resultant wind damage
during IBHS wind tests, and damage observations in post-hurricane reports. Further,
new shingles generally appear to remain fully sealed for the first 4-5 years of service
life. Beyond that timeframe, the frequency of unsealing trends upward. These results
are consistent with post-hurricane assessments by Gurley and Masters (2011) and Liu
et al. (2010), which found that shingle roofs with six or more years of weathering were
damaged at a 50% higher rate than newer shingle roofs.
Study 1: Survey of Naturally Aged Shingle Roofs for Unsealed Shingles
The research objective was to assess the adhesion of the shingle sealant strips
on in-service roofs. The subject roofs were located at single-family homes in Florida and
Texas.
Reprinted with permission from Dixon, C.R., Masters, F.J., Prevatt, D.O., Gurley, K.R., Brown, T.M., and Peterka, J.A. (2013c). “The influence of unsealing on the wind resistance of asphalt shingles.” Journal of Wind Engineering and Industrial Aerodynamics. [Article Submitted for Review]
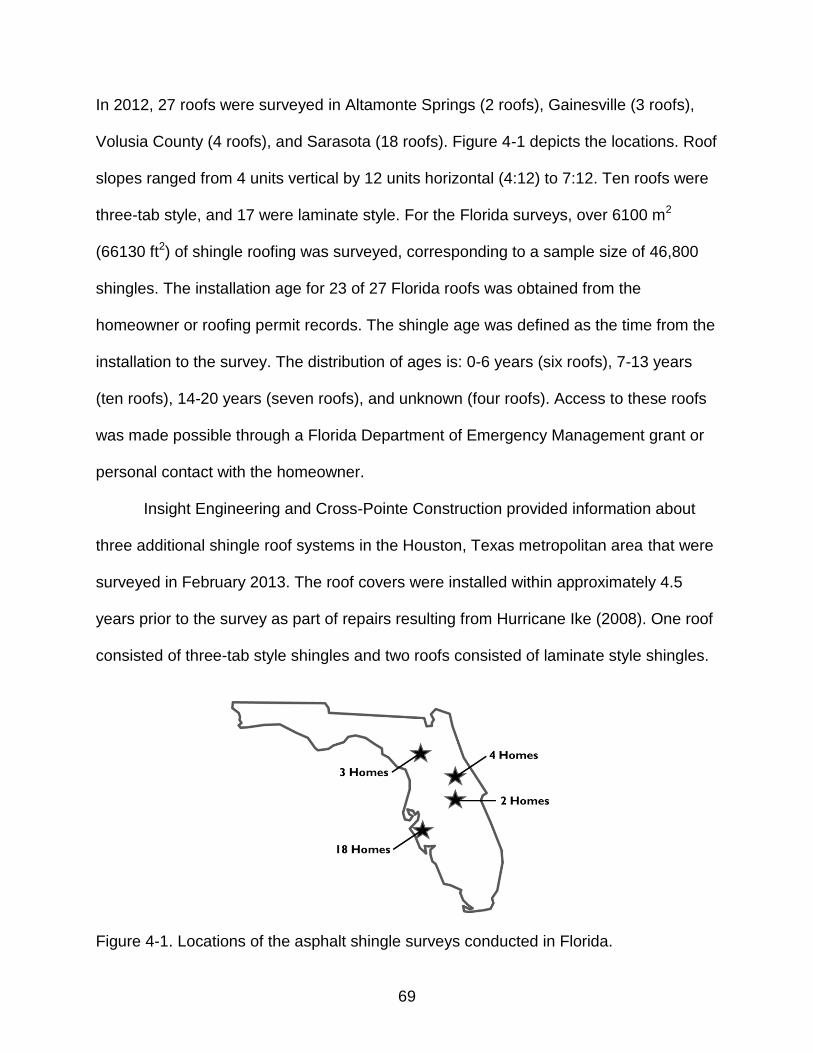
69
In 2012, 27 roofs were surveyed in Altamonte Springs (2 roofs), Gainesville (3 roofs),
Volusia County (4 roofs), and Sarasota (18 roofs). Figure 4-1 depicts the locations. Roof
slopes ranged from 4 units vertical by 12 units horizontal (4:12) to 7:12. Ten roofs were
three-tab style, and 17 were laminate style. For the Florida surveys, over 6100 m2
(66130 ft2) of shingle roofing was surveyed, corresponding to a sample size of 46,800
shingles. The installation age for 23 of 27 Florida roofs was obtained from the
homeowner or roofing permit records. The shingle age was defined as the time from the
installation to the survey. The distribution of ages is: 0-6 years (six roofs), 7-13 years
(ten roofs), 14-20 years (seven roofs), and unknown (four roofs). Access to these roofs
was made possible through a Florida Department of Emergency Management grant or
personal contact with the homeowner.
Insight Engineering and Cross-Pointe Construction provided information about
three additional shingle roof systems in the Houston, Texas metropolitan area that were
surveyed in February 2013. The roof covers were installed within approximately 4.5
years prior to the survey as part of repairs resulting from Hurricane Ike (2008). One roof
consisted of three-tab style shingles and two roofs consisted of laminate style shingles.
Figure 4-1. Locations of the asphalt shingle surveys conducted in Florida.
70
Survey Method
Individual shingles were manually inspected on each roof using a non-destructive
technique (Figure 4-2). Survey personnel gently applied upward pressure by hand to the
leading edge. Shingles were classified as: (1) sealed, (2) partially unsealed, or (3) fully
unsealed. A sealed shingle was defined as a shingle with either full adhesion on the
sealant strip or the loss of adhesion less than a continuous 51 mm (2 in). A partially
unsealed shingle was defined as any loss of adhesion on the shingle that was greater
than or equal to a continuous 51 mm (2 in) length, whereas a fully unsealed shingle was
defined as the loss of adhesion along the entire length of the sealant strip. A strip of
colored tape or chalk was placed on the top surface of each partially or fully unsealed
shingle to assist with pattern recognition and photographic documentation. For each
partially or fully unsealed shingle found on the Florida roofs, the following data were
recorded on a roof plan:
1. Location on the roof.
2. Unsealed location on the strip (left corner, center, right corner).
3. Unsealed length.
4. Plane within the shingle composite where the loss of adhesion occurred to determine the sealant strip failure mode (cf. Shiao et al., 2003a).
Potential for Wind Induced Loss of Shingle Sealing
Extreme wind climatology in Florida and the Texas coast is predominantly
associated with hurricanes, thus the peak wind speeds at each survey location in
Florida and Texas were extracted from H*Wind swath datasets published by the
Hurricane Research Division (Powell et al., 1998) to assess historical wind events as a
potential cause of partially unsealed shingles. Site-specific peak gust wind speeds were
71
calculated from all tropical cyclones impacting a given roof from the date of roof
installation to the date of survey. Houston, TX was not impacted by tropical cyclones in
2009 through 2012, thus it was not included in the survey.
Gust calculations were performed on all tropical cyclones from 1992 to the date
of roof survey, which encompasses all but four roof lifespans in the study. H*Wind wind
swaths are reported as maximum 60 s wind speeds (V60) in open exposure at 10 m (33
ft) for all land areas. The exposure condition at the survey sites was suburban.
Following the approach of Masters et al. (2010), H*Wind velocities (i.e. the 60 s mean
wind speed at 10 m in open country) were converted to mean wind speeds at 5 m (16
ft), which nominally corresponds to the mean eave height of a single family home in
suburban terrain (z0 = 0.3 m). The conversion factor was 0.48. Next, the factor was
multiplied by a speed-up factor of 1.8 to convert the mean wind speed to the peak
instantaneous velocity expected to occur on the roof deck (Dixon et al., 2013). Thus the
total conversion factor was 0.87.
Results of the analysis are shown in Table 4-1. Altamonte Springs experienced
the highest near-roof gust of all locations, 25 m/s (56 mph), during Hurricane Jeanne
(2004). The second highest near roof gust occurred in Ormond Beach during
Hurricanes Floyd (1999) and Irene (1999), 22 m/s (49 mph). The remaining sites
experienced near-roof gust wind speeds ranging from 11-21 m/s (25-47 mph). All of the
wind speed estimates are lower than the 27 m/s (60 mph) maximum near-roof velocity
threshold used in the ASTM D3161 (ASTM 2008b) fan test for shingle wind resistance
certification (Dixon et al., 2012), which is the lowest threshold used by product approval
standards in the last two decades.
72
Based on these assessments, it was concluded that it is unlikely an extreme wind
even caused the unsealing, acknowledging that absent a long-term monitoring program,
it is not possible to prove if wind loads induced at lower wind speeds cause the
unsealing. However, the systematic nature of the partially unsealed shingles detailed in
the next section and the lack of observed surface cracking and tearing normally
associated with shingle wind damage (FEMA 2005a; FEMA 2005b; FEMA 2009;
RICOWI 2006; RICOWI 2007) support the assertion that wind was not the cause of the
shingle tabs losing adhesion.
Survey Results
Shingles in the field of the roof
More than 99% of the unsealed shingles found on the Florida roofs were partially
unsealed and exhibited the same location of unsealing reported in Marshall et al.
(2010). Partially unsealed shingles of this type were found on 8 of 10 three-tab shingle
roofs and 11 of 17 laminate shingle roofs for a total of 19 of 27 surveyed roofs (70%).
The unsealed shingles exhibiting locations and length of unsealing that was different
from those reported by Marshall et al. (2010) (less than 1% of unsealed shingles) were
contained on portions of the 19 roofs identified above and the other eight surveyed
roofs. The results presented below detail the location and plane of failure found on the
more frequently observed partially unsealed shingles.
The partial unsealing of three-tab shingles occurred on the outside end tab of the
strip where the end joint of the shingle course below, aligned with the centerline of the
tab (Figure 4-2A). Laminate shingles exhibited a similar pattern of unsealing to the
three-tabs with the unsealed length running from the end joint of the strip to the end joint
of the shingle course below (Figure 4-2B). The unsealed length for laminate shingles
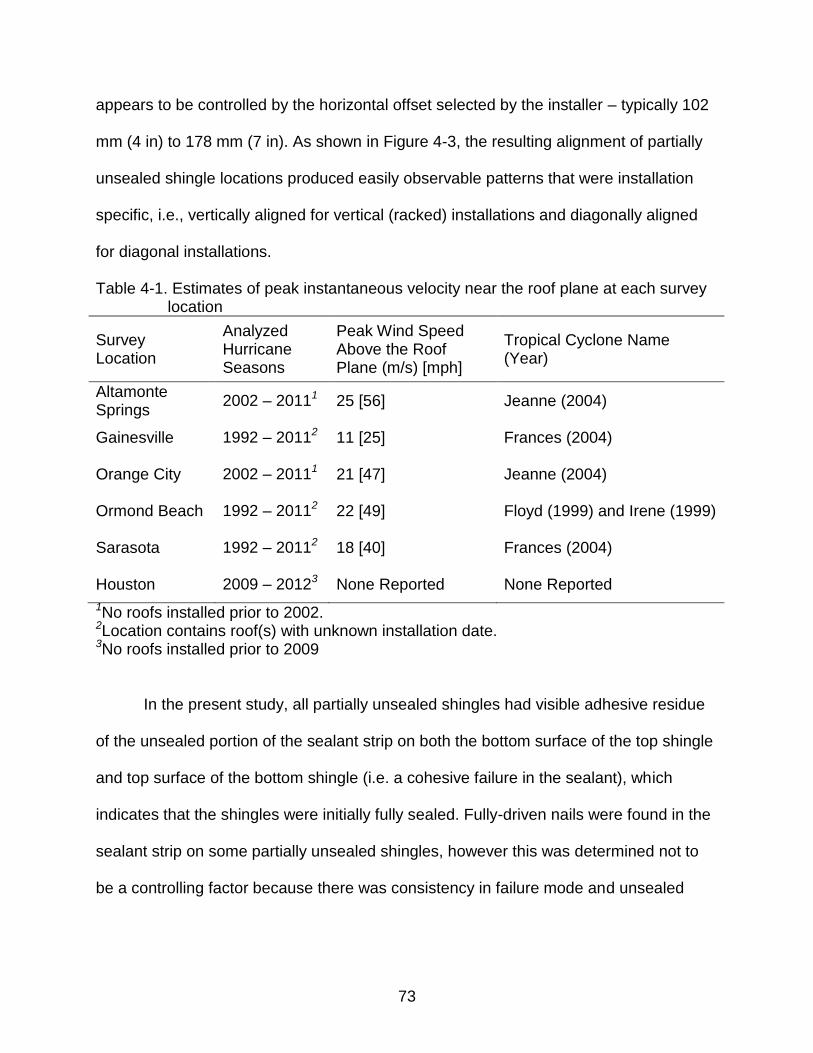
73
appears to be controlled by the horizontal offset selected by the installer – typically 102
mm (4 in) to 178 mm (7 in). As shown in Figure 4-3, the resulting alignment of partially
unsealed shingle locations produced easily observable patterns that were installation
specific, i.e., vertically aligned for vertical (racked) installations and diagonally aligned
for diagonal installations.
Table 4-1. Estimates of peak instantaneous velocity near the roof plane at each survey location
Survey Location
Analyzed Hurricane Seasons
Peak Wind Speed Above the Roof Plane (m/s) [mph]
Tropical Cyclone Name (Year)
Altamonte Springs
2002 – 20111 25 [56] Jeanne (2004)
Gainesville 1992 – 20112 11 [25] Frances (2004)
Orange City 2002 – 20111 21 [47] Jeanne (2004)
Ormond Beach 1992 – 20112 22 [49] Floyd (1999) and Irene (1999)
Sarasota 1992 – 20112 18 [40] Frances (2004)
Houston 2009 – 20123 None Reported None Reported
1No roofs installed prior to 2002. 2Location contains roof(s) with unknown installation date. 3No roofs installed prior to 2009
In the present study, all partially unsealed shingles had visible adhesive residue
of the unsealed portion of the sealant strip on both the bottom surface of the top shingle
and top surface of the bottom shingle (i.e. a cohesive failure in the sealant), which
indicates that the shingles were initially fully sealed. Fully-driven nails were found in the
sealant strip on some partially unsealed shingles, however this was determined not to
be a controlling factor because there was consistency in failure mode and unsealed
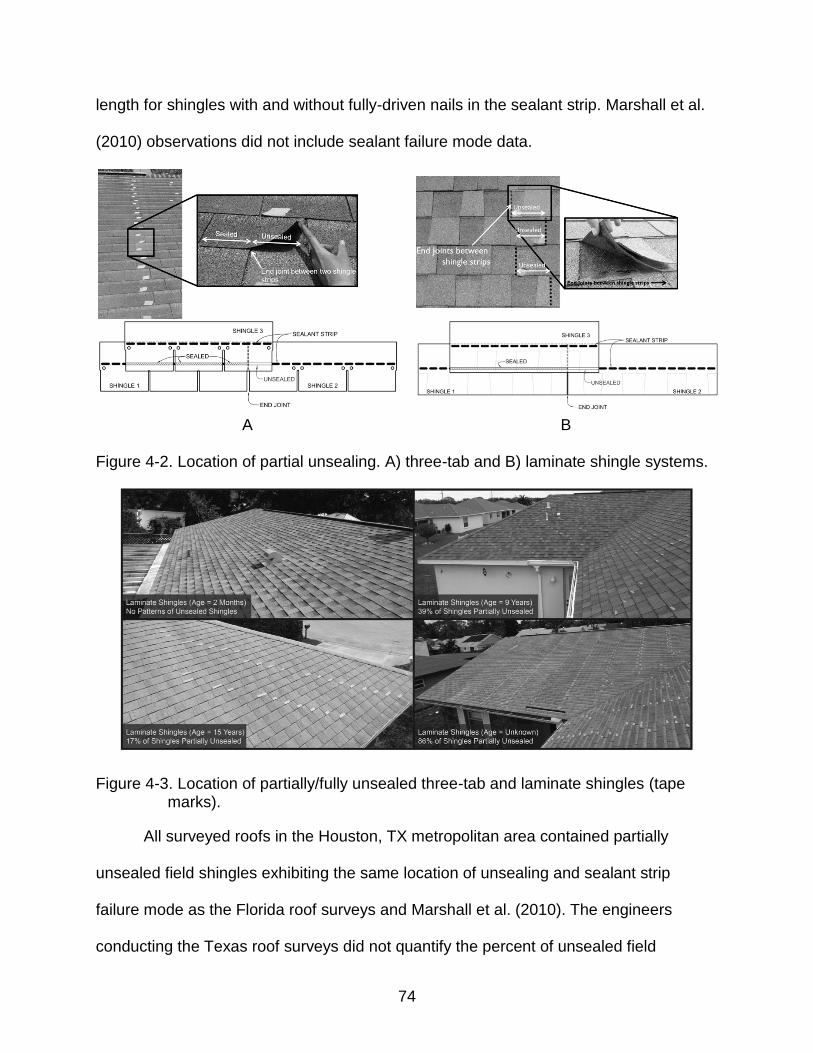
74
length for shingles with and without fully-driven nails in the sealant strip. Marshall et al.
(2010) observations did not include sealant failure mode data.
A B
Figure 4-2. Location of partial unsealing. A) three-tab and B) laminate shingle systems.
Figure 4-3. Location of partially/fully unsealed three-tab and laminate shingles (tape marks).
All surveyed roofs in the Houston, TX metropolitan area contained partially
unsealed field shingles exhibiting the same location of unsealing and sealant strip
failure mode as the Florida roof surveys and Marshall et al. (2010). The engineers
conducting the Texas roof surveys did not quantify the percent of unsealed field
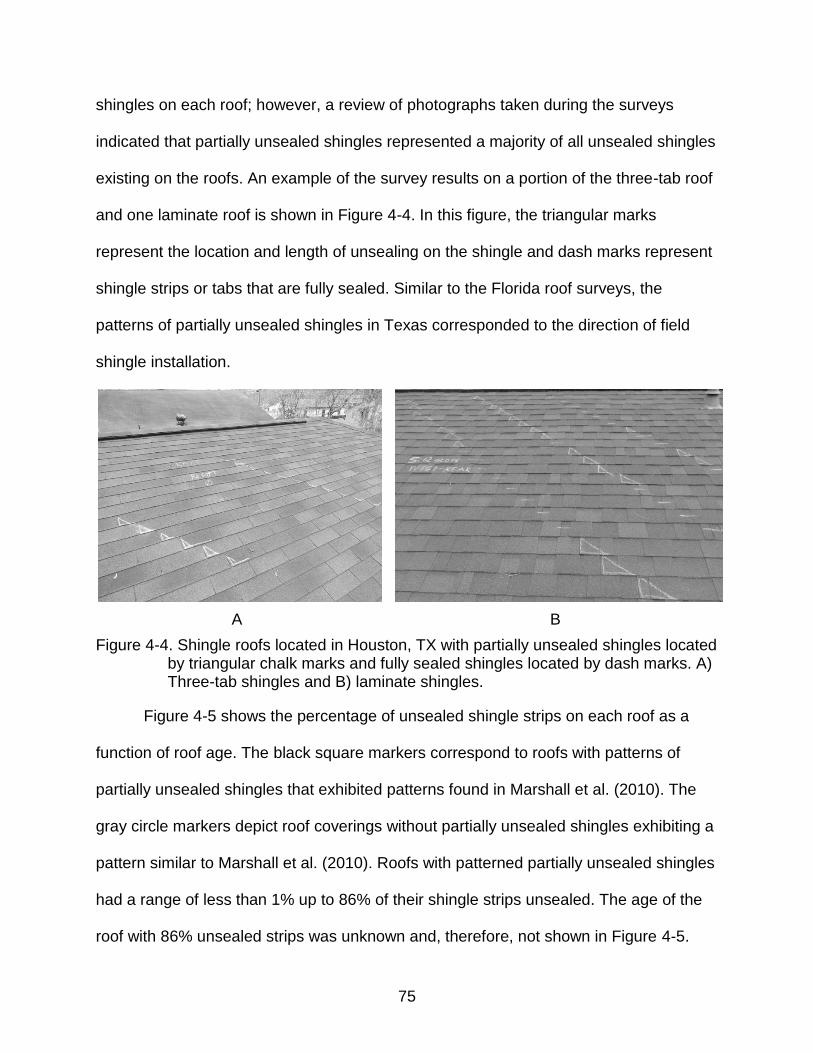
75
shingles on each roof; however, a review of photographs taken during the surveys
indicated that partially unsealed shingles represented a majority of all unsealed shingles
existing on the roofs. An example of the survey results on a portion of the three-tab roof
and one laminate roof is shown in Figure 4-4. In this figure, the triangular marks
represent the location and length of unsealing on the shingle and dash marks represent
shingle strips or tabs that are fully sealed. Similar to the Florida roof surveys, the
patterns of partially unsealed shingles in Texas corresponded to the direction of field
shingle installation.
A B
Figure 4-4. Shingle roofs located in Houston, TX with partially unsealed shingles located by triangular chalk marks and fully sealed shingles located by dash marks. A) Three-tab shingles and B) laminate shingles.
Figure 4-5 shows the percentage of unsealed shingle strips on each roof as a
function of roof age. The black square markers correspond to roofs with patterns of
partially unsealed shingles that exhibited patterns found in Marshall et al. (2010). The
gray circle markers depict roof coverings without partially unsealed shingles exhibiting a
pattern similar to Marshall et al. (2010). Roofs with patterned partially unsealed shingles
had a range of less than 1% up to 86% of their shingle strips unsealed. The age of the
roof with 86% unsealed strips was unknown and, therefore, not shown in Figure 4-5.
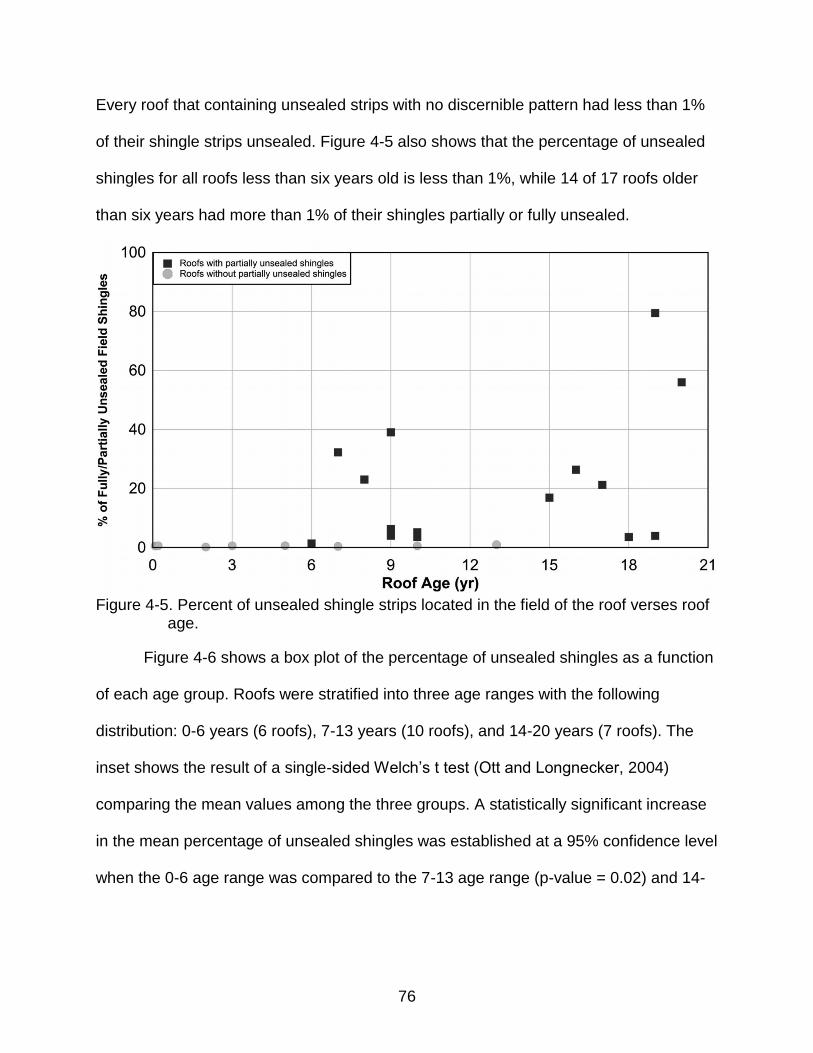
76
Every roof that containing unsealed strips with no discernible pattern had less than 1%
of their shingle strips unsealed. Figure 4-5 also shows that the percentage of unsealed
shingles for all roofs less than six years old is less than 1%, while 14 of 17 roofs older
than six years had more than 1% of their shingles partially or fully unsealed.
Figure 4-5. Percent of unsealed shingle strips located in the field of the roof verses roof
age.
Figure 4-6 shows a box plot of the percentage of unsealed shingles as a function
of each age group. Roofs were stratified into three age ranges with the following
distribution: 0-6 years (6 roofs), 7-13 years (10 roofs), and 14-20 years (7 roofs). The
inset shows the result of a single-sided Welch’s t test (Ott and Longnecker, 2004)
comparing the mean values among the three groups. A statistically significant increase
in the mean percentage of unsealed shingles was established at a 95% confidence level
when the 0-6 age range was compared to the 7-13 age range (p-value = 0.02) and 14-
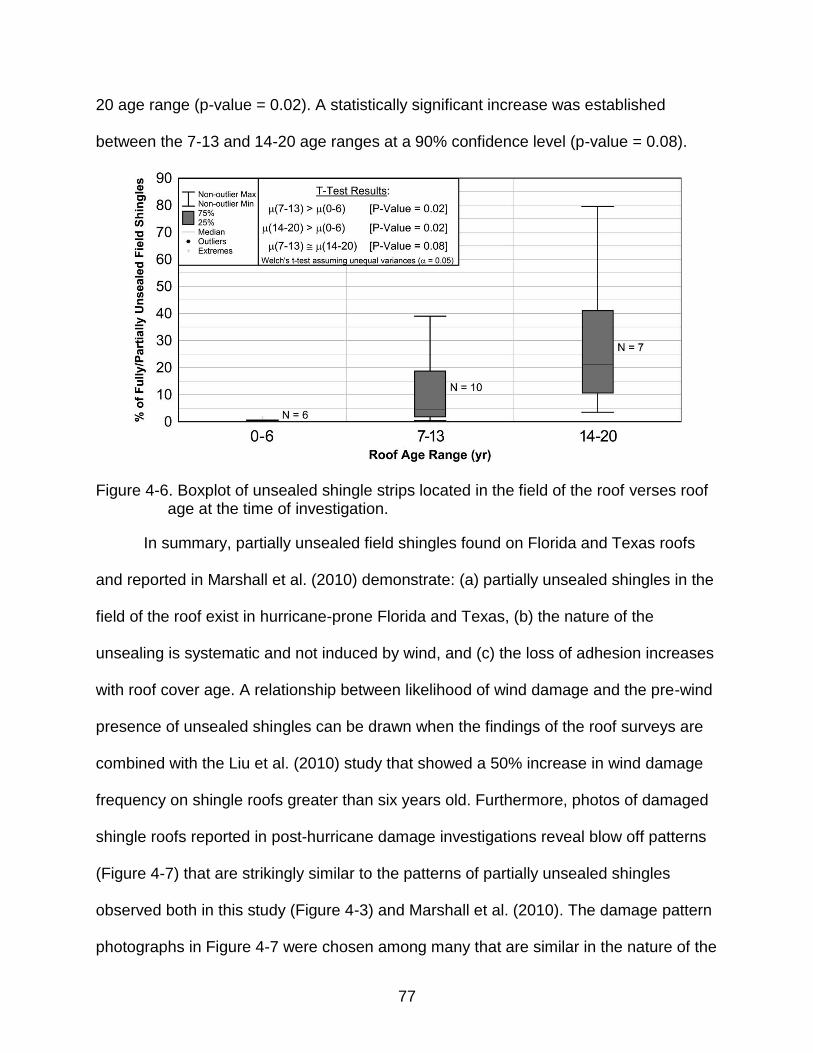
77
20 age range (p-value = 0.02). A statistically significant increase was established
between the 7-13 and 14-20 age ranges at a 90% confidence level (p-value = 0.08).
Figure 4-6. Boxplot of unsealed shingle strips located in the field of the roof verses roof
age at the time of investigation.
In summary, partially unsealed field shingles found on Florida and Texas roofs
and reported in Marshall et al. (2010) demonstrate: (a) partially unsealed shingles in the
field of the roof exist in hurricane-prone Florida and Texas, (b) the nature of the
unsealing is systematic and not induced by wind, and (c) the loss of adhesion increases
with roof cover age. A relationship between likelihood of wind damage and the pre-wind
presence of unsealed shingles can be drawn when the findings of the roof surveys are
combined with the Liu et al. (2010) study that showed a 50% increase in wind damage
frequency on shingle roofs greater than six years old. Furthermore, photos of damaged
shingle roofs reported in post-hurricane damage investigations reveal blow off patterns
(Figure 4-7) that are strikingly similar to the patterns of partially unsealed shingles
observed both in this study (Figure 4-3) and Marshall et al. (2010). The damage pattern
photographs in Figure 4-7 were chosen among many that are similar in the nature of the
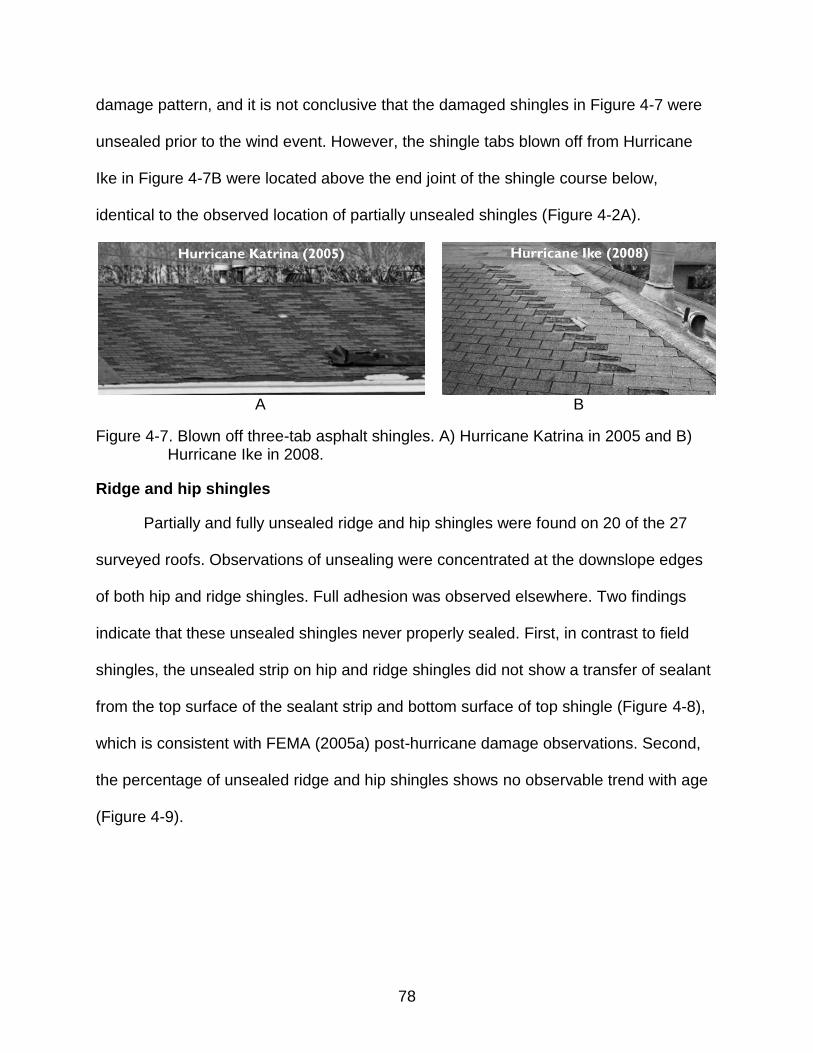
78
damage pattern, and it is not conclusive that the damaged shingles in Figure 4-7 were
unsealed prior to the wind event. However, the shingle tabs blown off from Hurricane
Ike in Figure 4-7B were located above the end joint of the shingle course below,
identical to the observed location of partially unsealed shingles (Figure 4-2A).
A B
Figure 4-7. Blown off three-tab asphalt shingles. A) Hurricane Katrina in 2005 and B) Hurricane Ike in 2008.
Ridge and hip shingles
Partially and fully unsealed ridge and hip shingles were found on 20 of the 27
surveyed roofs. Observations of unsealing were concentrated at the downslope edges
of both hip and ridge shingles. Full adhesion was observed elsewhere. Two findings
indicate that these unsealed shingles never properly sealed. First, in contrast to field
shingles, the unsealed strip on hip and ridge shingles did not show a transfer of sealant
from the top surface of the sealant strip and bottom surface of top shingle (Figure 4-8),
which is consistent with FEMA (2005a) post-hurricane damage observations. Second,
the percentage of unsealed ridge and hip shingles shows no observable trend with age
(Figure 4-9).
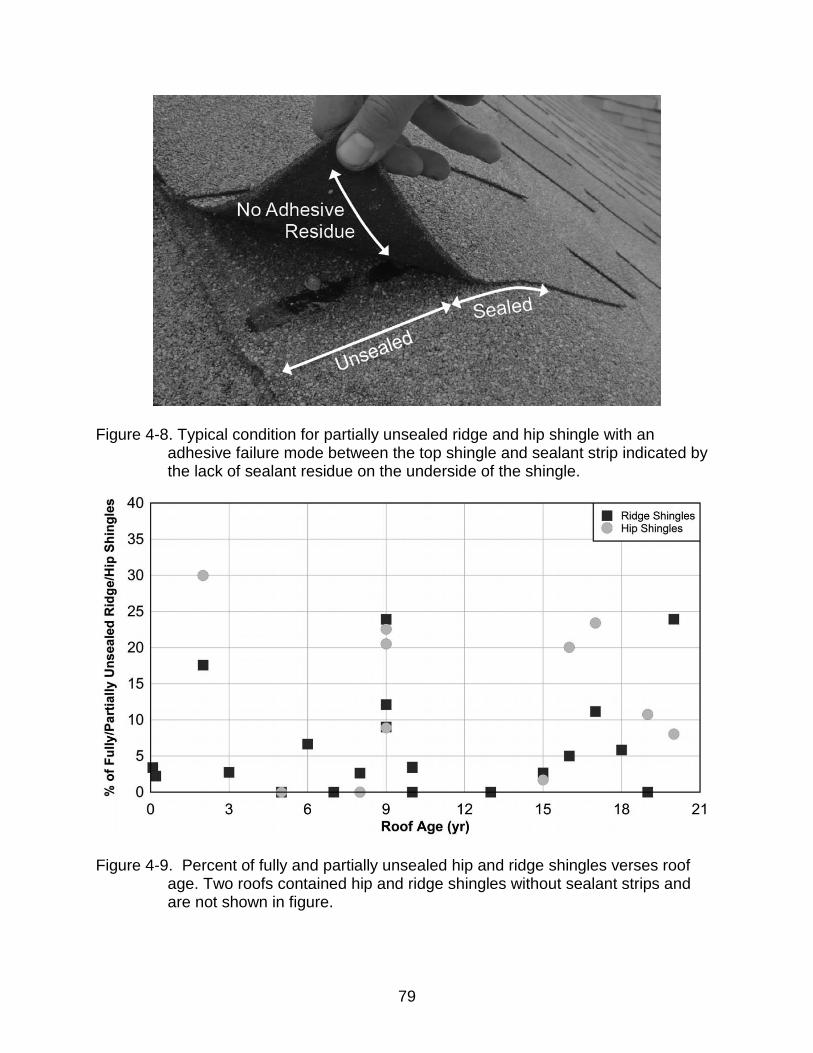
79
Figure 4-8. Typical condition for partially unsealed ridge and hip shingle with an adhesive failure mode between the top shingle and sealant strip indicated by the lack of sealant residue on the underside of the shingle.
Figure 4-9. Percent of fully and partially unsealed hip and ridge shingles verses roof age. Two roofs contained hip and ridge shingles without sealant strips and are not shown in figure.
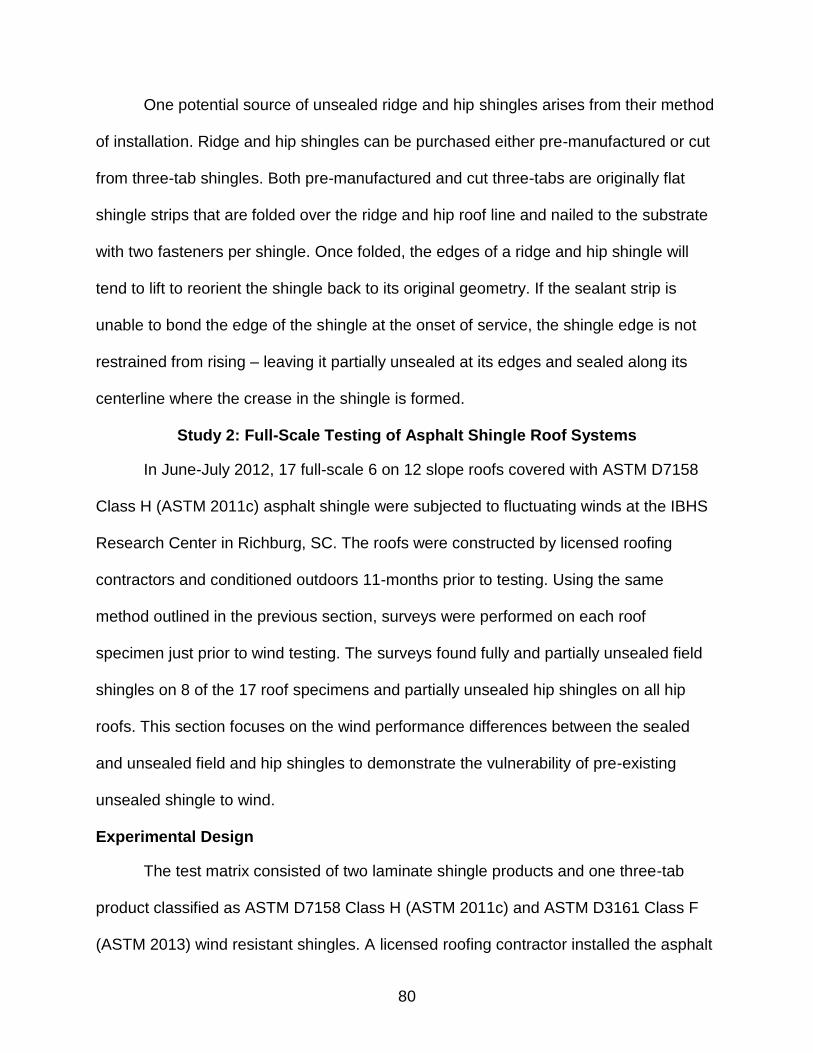
80
One potential source of unsealed ridge and hip shingles arises from their method
of installation. Ridge and hip shingles can be purchased either pre-manufactured or cut
from three-tab shingles. Both pre-manufactured and cut three-tabs are originally flat
shingle strips that are folded over the ridge and hip roof line and nailed to the substrate
with two fasteners per shingle. Once folded, the edges of a ridge and hip shingle will
tend to lift to reorient the shingle back to its original geometry. If the sealant strip is
unable to bond the edge of the shingle at the onset of service, the shingle edge is not
restrained from rising – leaving it partially unsealed at its edges and sealed along its
centerline where the crease in the shingle is formed.
Study 2: Full-Scale Testing of Asphalt Shingle Roof Systems
In June-July 2012, 17 full-scale 6 on 12 slope roofs covered with ASTM D7158
Class H (ASTM 2011c) asphalt shingle were subjected to fluctuating winds at the IBHS
Research Center in Richburg, SC. The roofs were constructed by licensed roofing
contractors and conditioned outdoors 11-months prior to testing. Using the same
method outlined in the previous section, surveys were performed on each roof
specimen just prior to wind testing. The surveys found fully and partially unsealed field
shingles on 8 of the 17 roof specimens and partially unsealed hip shingles on all hip
roofs. This section focuses on the wind performance differences between the sealed
and unsealed field and hip shingles to demonstrate the vulnerability of pre-existing
unsealed shingle to wind.
Experimental Design
The test matrix consisted of two laminate shingle products and one three-tab
product classified as ASTM D7158 Class H (ASTM 2011c) and ASTM D3161 Class F
(ASTM 2013) wind resistant shingles. A licensed roofing contractor installed the asphalt
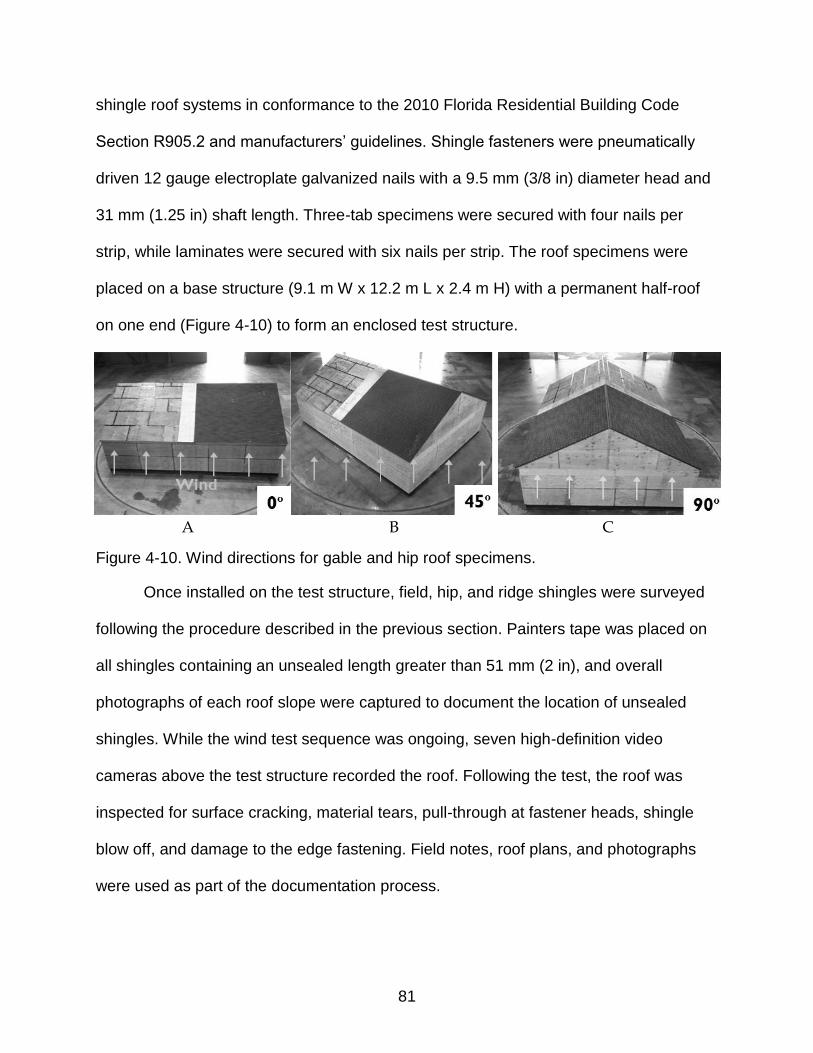
81
shingle roof systems in conformance to the 2010 Florida Residential Building Code
Section R905.2 and manufacturers’ guidelines. Shingle fasteners were pneumatically
driven 12 gauge electroplate galvanized nails with a 9.5 mm (3/8 in) diameter head and
31 mm (1.25 in) shaft length. Three-tab specimens were secured with four nails per
strip, while laminates were secured with six nails per strip. The roof specimens were
placed on a base structure (9.1 m W x 12.2 m L x 2.4 m H) with a permanent half-roof
on one end (Figure 4-10) to form an enclosed test structure.
A B C
Figure 4-10. Wind directions for gable and hip roof specimens.
Once installed on the test structure, field, hip, and ridge shingles were surveyed
following the procedure described in the previous section. Painters tape was placed on
all shingles containing an unsealed length greater than 51 mm (2 in), and overall
photographs of each roof slope were captured to document the location of unsealed
shingles. While the wind test sequence was ongoing, seven high-definition video
cameras above the test structure recorded the roof. Following the test, the roof was
inspected for surface cracking, material tears, pull-through at fastener heads, shingle
blow off, and damage to the edge fastening. Field notes, roof plans, and photographs
were used as part of the documentation process.
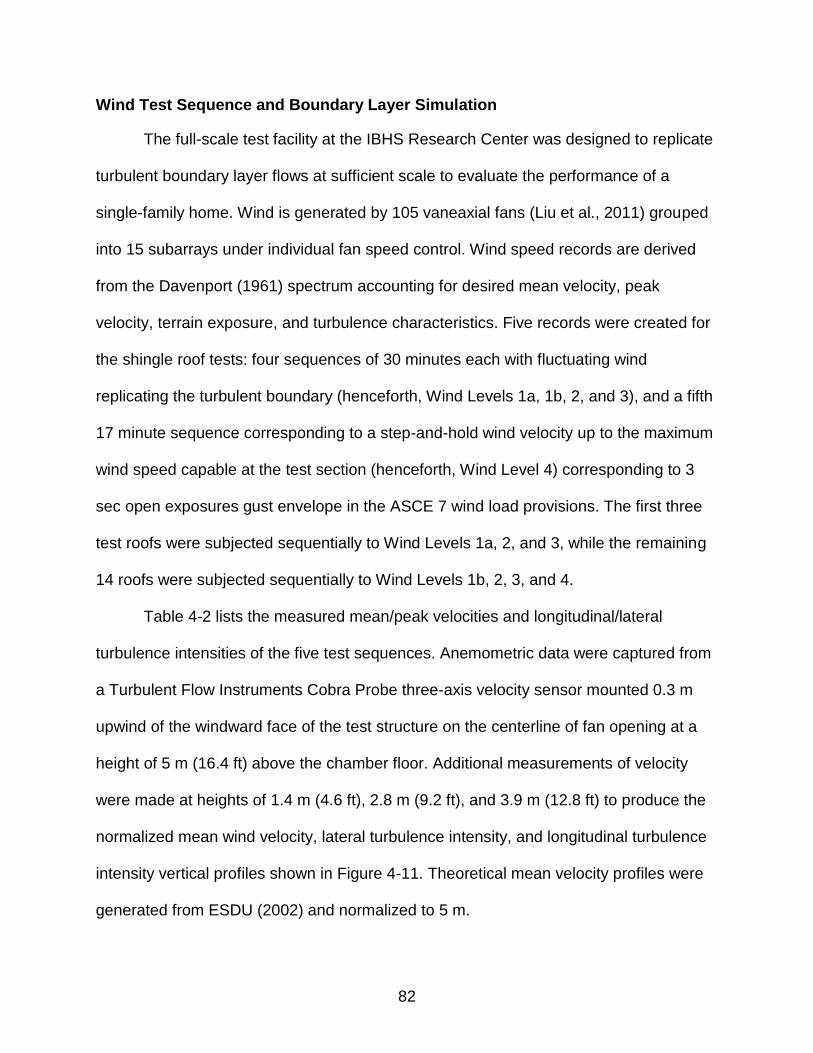
82
Wind Test Sequence and Boundary Layer Simulation
The full-scale test facility at the IBHS Research Center was designed to replicate
turbulent boundary layer flows at sufficient scale to evaluate the performance of a
single-family home. Wind is generated by 105 vaneaxial fans (Liu et al., 2011) grouped
into 15 subarrays under individual fan speed control. Wind speed records are derived
from the Davenport (1961) spectrum accounting for desired mean velocity, peak
velocity, terrain exposure, and turbulence characteristics. Five records were created for
the shingle roof tests: four sequences of 30 minutes each with fluctuating wind
replicating the turbulent boundary (henceforth, Wind Levels 1a, 1b, 2, and 3), and a fifth
17 minute sequence corresponding to a step-and-hold wind velocity up to the maximum
wind speed capable at the test section (henceforth, Wind Level 4) corresponding to 3
sec open exposures gust envelope in the ASCE 7 wind load provisions. The first three
test roofs were subjected sequentially to Wind Levels 1a, 2, and 3, while the remaining
14 roofs were subjected sequentially to Wind Levels 1b, 2, 3, and 4.
Table 4-2 lists the measured mean/peak velocities and longitudinal/lateral
turbulence intensities of the five test sequences. Anemometric data were captured from
a Turbulent Flow Instruments Cobra Probe three-axis velocity sensor mounted 0.3 m
upwind of the windward face of the test structure on the centerline of fan opening at a
height of 5 m (16.4 ft) above the chamber floor. Additional measurements of velocity
were made at heights of 1.4 m (4.6 ft), 2.8 m (9.2 ft), and 3.9 m (12.8 ft) to produce the
normalized mean wind velocity, lateral turbulence intensity, and longitudinal turbulence
intensity vertical profiles shown in Figure 4-11. Theoretical mean velocity profiles were
generated from ESDU (2002) and normalized to 5 m.
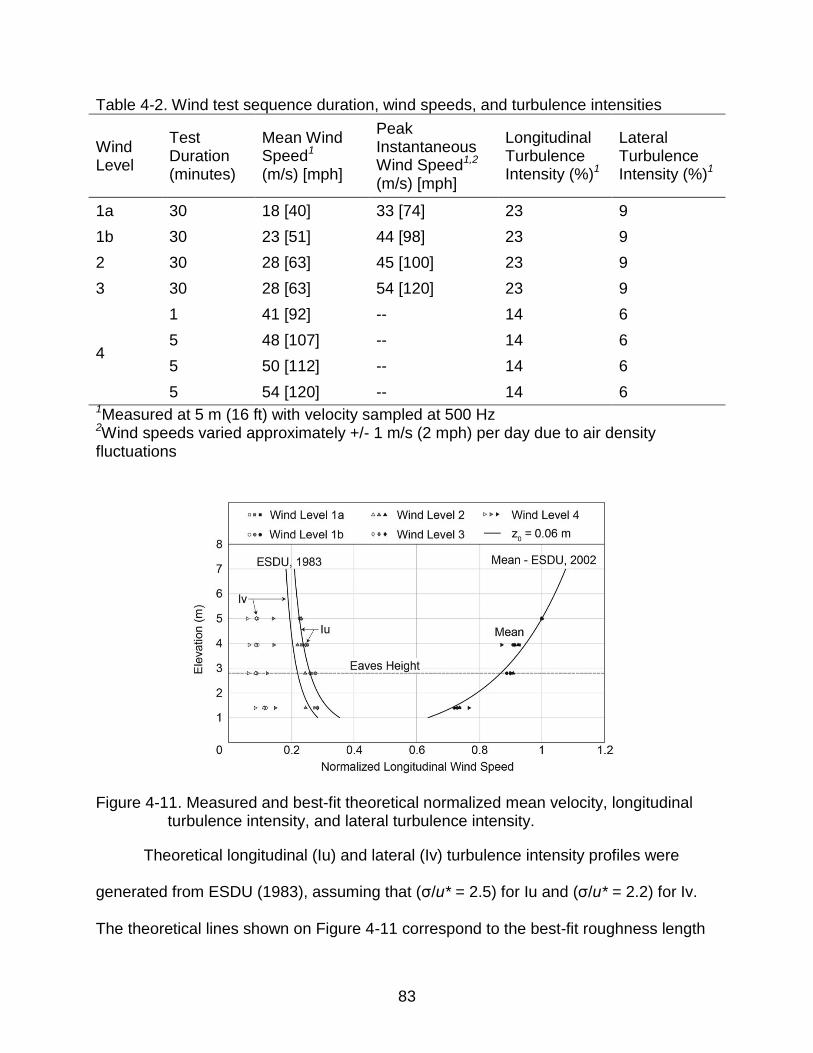
83
Table 4-2. Wind test sequence duration, wind speeds, and turbulence intensities
Wind Level
Test Duration (minutes)
Mean Wind Speed1
(m/s) [mph]
Peak Instantaneous Wind Speed1,2 (m/s) [mph]
Longitudinal Turbulence Intensity (%)1
Lateral Turbulence Intensity (%)1
1a 30 18 [40] 33 [74] 23 9
1b 30 23 [51] 44 [98] 23 9
2 30 28 [63] 45 [100] 23 9
3 30 28 [63] 54 [120] 23 9
4
1 41 [92] -- 14 6
5 48 [107] -- 14 6
5 50 [112] -- 14 6
5 54 [120] -- 14 6 1Measured at 5 m (16 ft) with velocity sampled at 500 Hz 2Wind speeds varied approximately +/- 1 m/s (2 mph) per day due to air density fluctuations
Figure 4-11. Measured and best-fit theoretical normalized mean velocity, longitudinal
turbulence intensity, and lateral turbulence intensity.
Theoretical longitudinal (Iu) and lateral (Iv) turbulence intensity profiles were
generated from ESDU (1983), assuming that (σ/u* = 2.5) for Iu and (σ/u* = 2.2) for Iv.
The theoretical lines shown on Figure 4-11 correspond to the best-fit roughness length
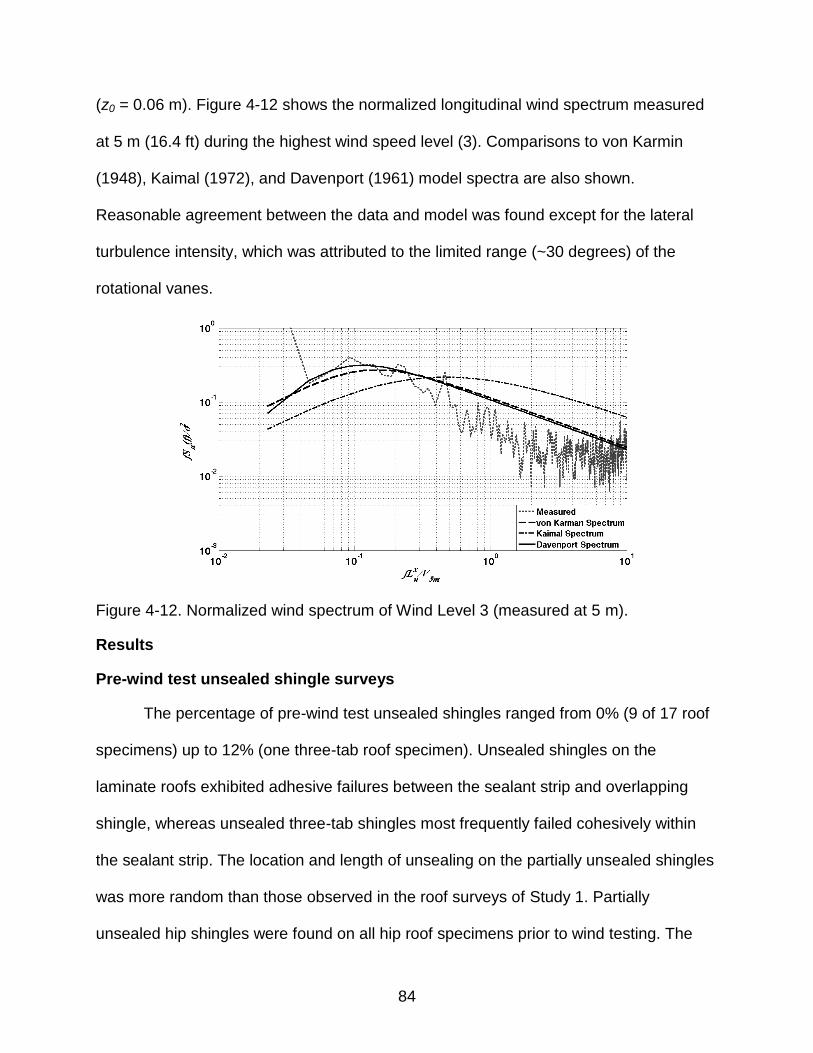
84
(z0 = 0.06 m). Figure 4-12 shows the normalized longitudinal wind spectrum measured
at 5 m (16.4 ft) during the highest wind speed level (3). Comparisons to von Karmin
(1948), Kaimal (1972), and Davenport (1961) model spectra are also shown.
Reasonable agreement between the data and model was found except for the lateral
turbulence intensity, which was attributed to the limited range (~30 degrees) of the
rotational vanes.
Figure 4-12. Normalized wind spectrum of Wind Level 3 (measured at 5 m).
Results
Pre-wind test unsealed shingle surveys
The percentage of pre-wind test unsealed shingles ranged from 0% (9 of 17 roof
specimens) up to 12% (one three-tab roof specimen). Unsealed shingles on the
laminate roofs exhibited adhesive failures between the sealant strip and overlapping
shingle, whereas unsealed three-tab shingles most frequently failed cohesively within
the sealant strip. The location and length of unsealing on the partially unsealed shingles
was more random than those observed in the roof surveys of Study 1. Partially
unsealed hip shingles were found on all hip roof specimens prior to wind testing. The
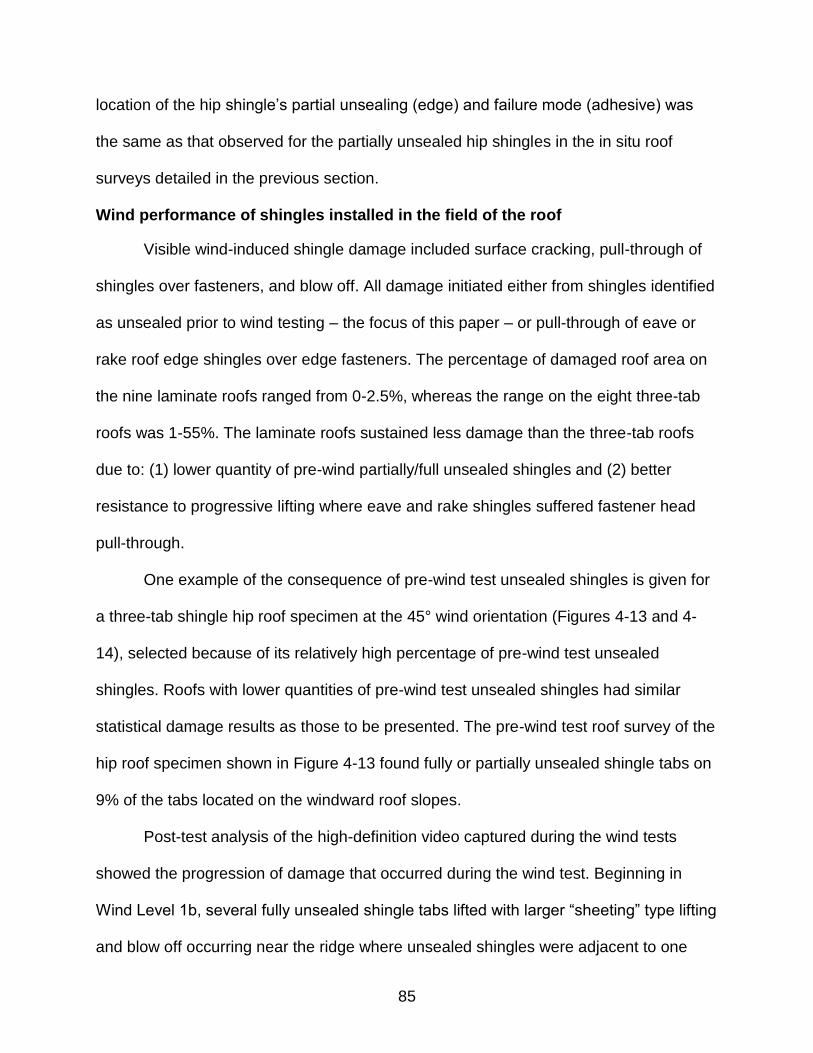
85
location of the hip shingle’s partial unsealing (edge) and failure mode (adhesive) was
the same as that observed for the partially unsealed hip shingles in the in situ roof
surveys detailed in the previous section.
Wind performance of shingles installed in the field of the roof
Visible wind-induced shingle damage included surface cracking, pull-through of
shingles over fasteners, and blow off. All damage initiated either from shingles identified
as unsealed prior to wind testing – the focus of this paper – or pull-through of eave or
rake roof edge shingles over edge fasteners. The percentage of damaged roof area on
the nine laminate roofs ranged from 0-2.5%, whereas the range on the eight three-tab
roofs was 1-55%. The laminate roofs sustained less damage than the three-tab roofs
due to: (1) lower quantity of pre-wind partially/full unsealed shingles and (2) better
resistance to progressive lifting where eave and rake shingles suffered fastener head
pull-through.
One example of the consequence of pre-wind test unsealed shingles is given for
a three-tab shingle hip roof specimen at the 45° wind orientation (Figures 4-13 and 4-
14), selected because of its relatively high percentage of pre-wind test unsealed
shingles. Roofs with lower quantities of pre-wind test unsealed shingles had similar
statistical damage results as those to be presented. The pre-wind test roof survey of the
hip roof specimen shown in Figure 4-13 found fully or partially unsealed shingle tabs on
9% of the tabs located on the windward roof slopes.
Post-test analysis of the high-definition video captured during the wind tests
showed the progression of damage that occurred during the wind test. Beginning in
Wind Level 1b, several fully unsealed shingle tabs lifted with larger “sheeting” type lifting
and blow off occurring near the ridge where unsealed shingles were adjacent to one
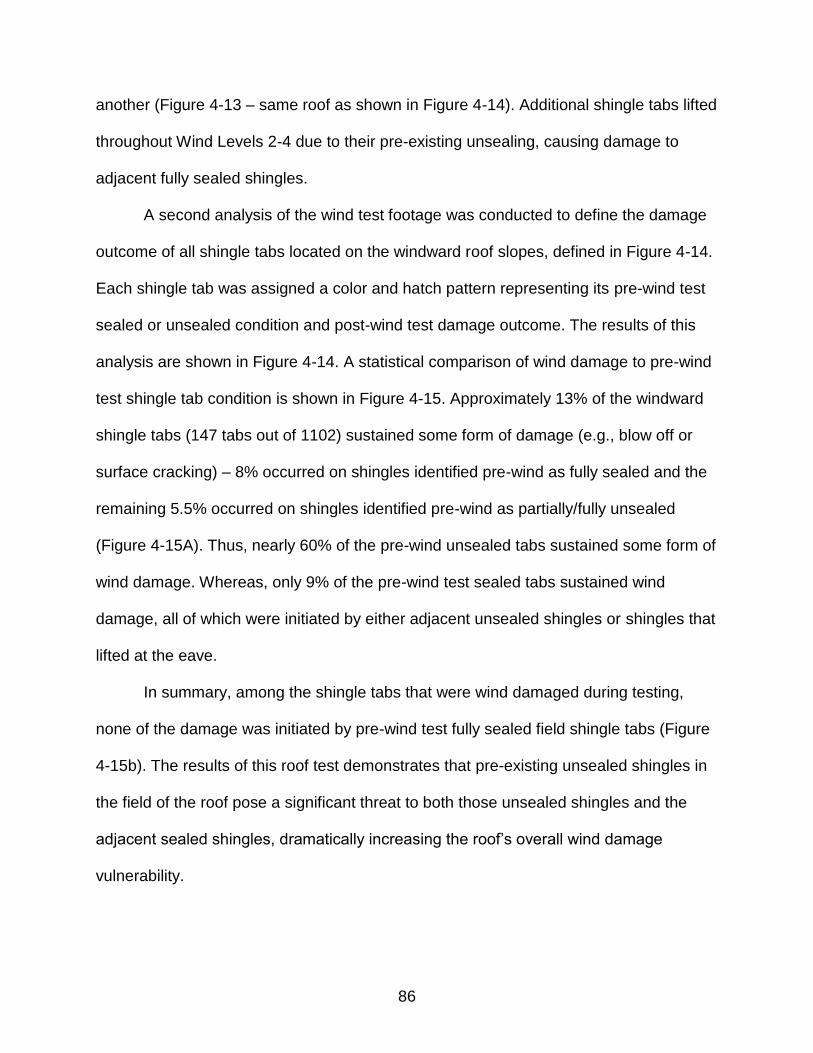
86
another (Figure 4-13 – same roof as shown in Figure 4-14). Additional shingle tabs lifted
throughout Wind Levels 2-4 due to their pre-existing unsealing, causing damage to
adjacent fully sealed shingles.
A second analysis of the wind test footage was conducted to define the damage
outcome of all shingle tabs located on the windward roof slopes, defined in Figure 4-14.
Each shingle tab was assigned a color and hatch pattern representing its pre-wind test
sealed or unsealed condition and post-wind test damage outcome. The results of this
analysis are shown in Figure 4-14. A statistical comparison of wind damage to pre-wind
test shingle tab condition is shown in Figure 4-15. Approximately 13% of the windward
shingle tabs (147 tabs out of 1102) sustained some form of damage (e.g., blow off or
surface cracking) – 8% occurred on shingles identified pre-wind as fully sealed and the
remaining 5.5% occurred on shingles identified pre-wind as partially/fully unsealed
(Figure 4-15A). Thus, nearly 60% of the pre-wind unsealed tabs sustained some form of
wind damage. Whereas, only 9% of the pre-wind test sealed tabs sustained wind
damage, all of which were initiated by either adjacent unsealed shingles or shingles that
lifted at the eave.
In summary, among the shingle tabs that were wind damaged during testing,
none of the damage was initiated by pre-wind test fully sealed field shingle tabs (Figure
4-15b). The results of this roof test demonstrates that pre-existing unsealed shingles in
the field of the roof pose a significant threat to both those unsealed shingles and the
adjacent sealed shingles, dramatically increasing the roof’s overall wind damage
vulnerability.
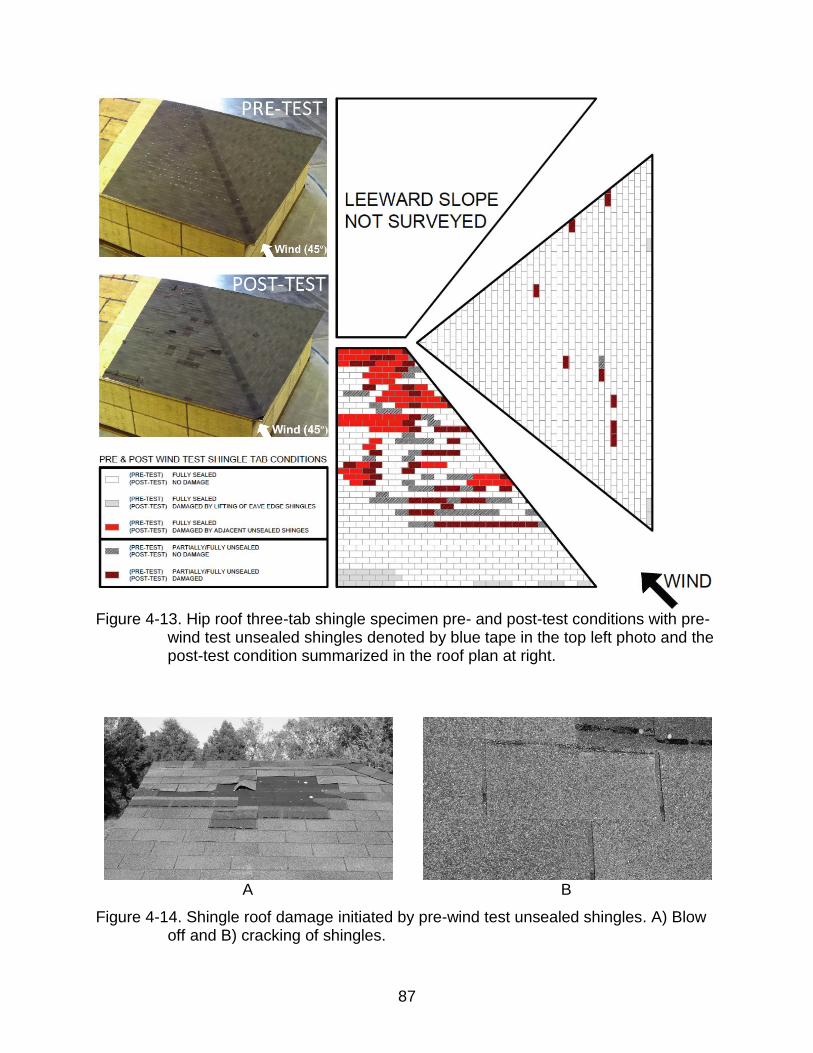
87
Figure 4-13. Hip roof three-tab shingle specimen pre- and post-test conditions with pre-
wind test unsealed shingles denoted by blue tape in the top left photo and the post-test condition summarized in the roof plan at right.
A B
Figure 4-14. Shingle roof damage initiated by pre-wind test unsealed shingles. A) Blow off and B) cracking of shingles.
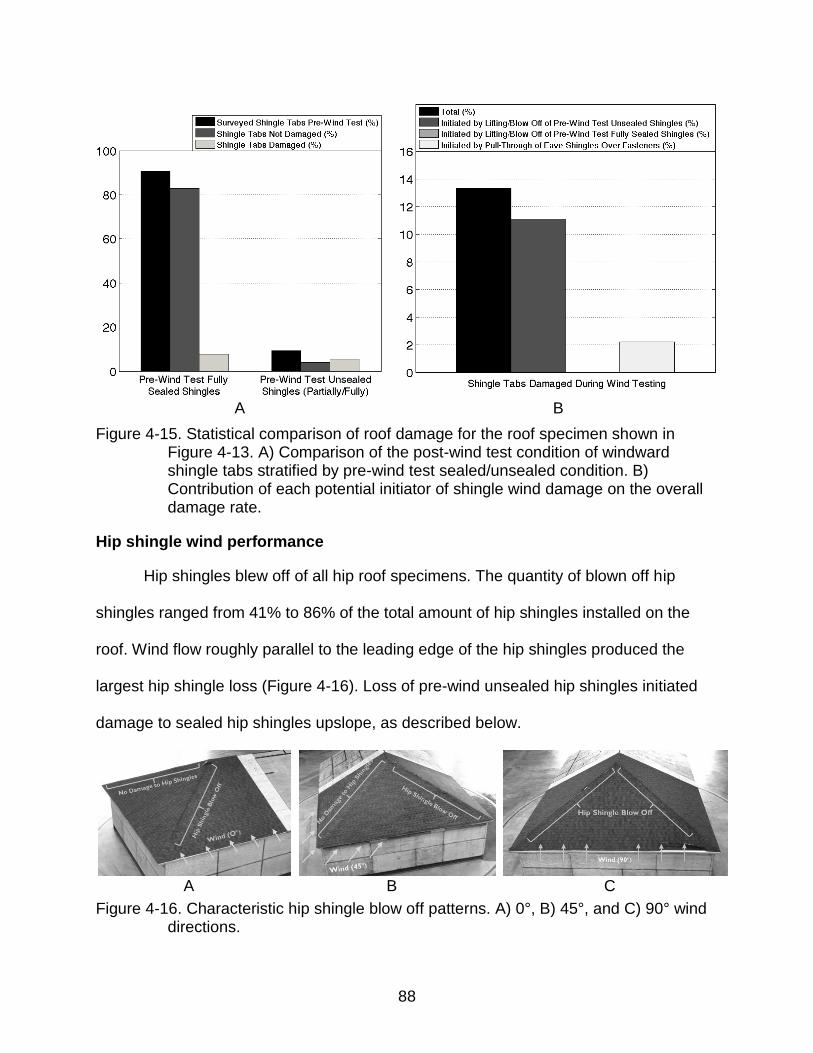
88
A B
Figure 4-15. Statistical comparison of roof damage for the roof specimen shown in Figure 4-13. A) Comparison of the post-wind test condition of windward shingle tabs stratified by pre-wind test sealed/unsealed condition. B) Contribution of each potential initiator of shingle wind damage on the overall damage rate.
Hip shingle wind performance
Hip shingles blew off of all hip roof specimens. The quantity of blown off hip
shingles ranged from 41% to 86% of the total amount of hip shingles installed on the
roof. Wind flow roughly parallel to the leading edge of the hip shingles produced the
largest hip shingle loss (Figure 4-16). Loss of pre-wind unsealed hip shingles initiated
damage to sealed hip shingles upslope, as described below.
A B C
Figure 4-16. Characteristic hip shingle blow off patterns. A) 0°, B) 45°, and C) 90° wind directions.
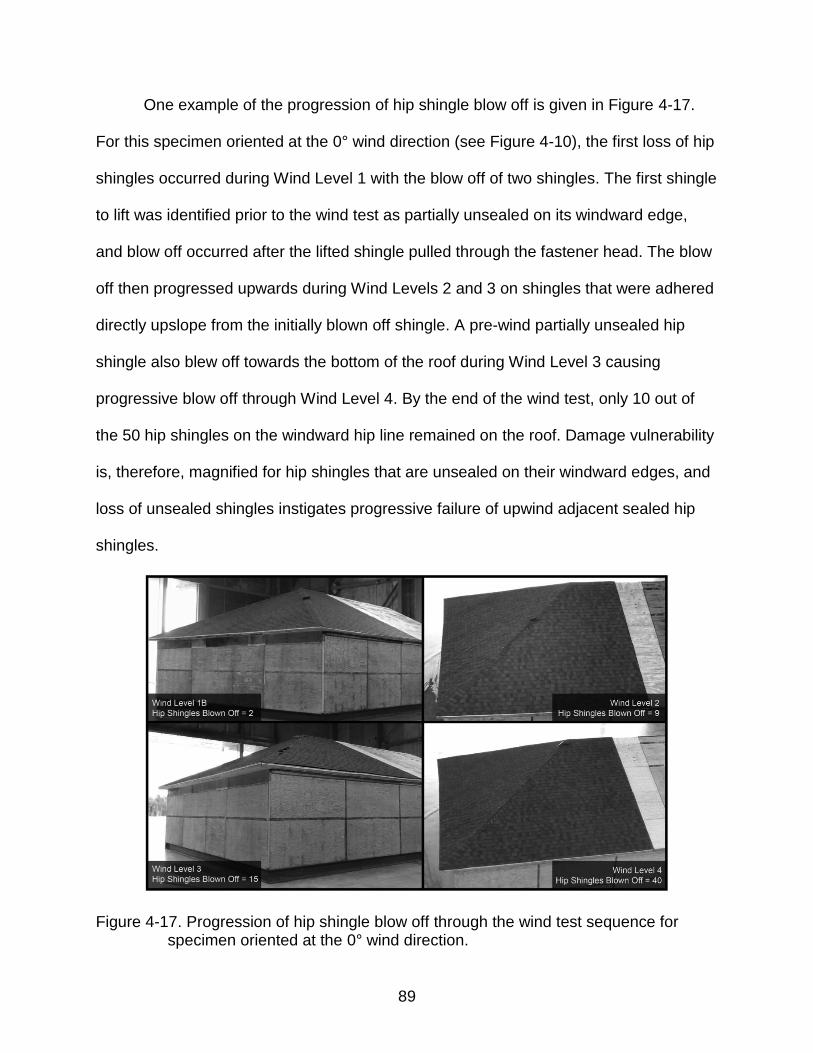
89
One example of the progression of hip shingle blow off is given in Figure 4-17.
For this specimen oriented at the 0° wind direction (see Figure 4-10), the first loss of hip
shingles occurred during Wind Level 1 with the blow off of two shingles. The first shingle
to lift was identified prior to the wind test as partially unsealed on its windward edge,
and blow off occurred after the lifted shingle pulled through the fastener head. The blow
off then progressed upwards during Wind Levels 2 and 3 on shingles that were adhered
directly upslope from the initially blown off shingle. A pre-wind partially unsealed hip
shingle also blew off towards the bottom of the roof during Wind Level 3 causing
progressive blow off through Wind Level 4. By the end of the wind test, only 10 out of
the 50 hip shingles on the windward hip line remained on the roof. Damage vulnerability
is, therefore, magnified for hip shingles that are unsealed on their windward edges, and
loss of unsealed shingles instigates progressive failure of upwind adjacent sealed hip
shingles.
Figure 4-17. Progression of hip shingle blow off through the wind test sequence for specimen oriented at the 0° wind direction.
90
Discussion
The results of the two studies demonstrate that unsealed asphalt shingles
installed on the field, hip, and ridge locations of residential buildings are prone to
unsealing over time, and that the unsealed condition increases the vulnerability of
shingles to wind damage. As part of this research, 30 roofs in Florida and Texas were
surveyed for unsealed shingles. All roofs contained unsealed shingles with occurrence
of unsealing reaching 86% of the total amount of installed shingles. The quantity of
unsealed shingles installed in the field of the roof generally increased with roof age,
whereas the quantity of unsealed hip and ridge shingles showed no discernible
relationship to roof age.
When unsealed shingles were observed in the field of the roof, more than 99% of
the shingles were unsealed along a partial length of their sealant strip line. The plane of
fracture where unsealed – cohesively in the sealant strip – and location of unsealing
were consistent in the partially unsealed shingles, indicating a systematic failure of the
sealant strip to remain adhered. The specific cause is unknown, but the observed
increase in the total amount of unsealed field shingles with a roof’s in-service age
indicates that the effects of natural aging (Berdhal et al., 2008) influence the partial
unsealing of field shingles. Blow off patterns of shingle roofs in previous hurricanes
were similar to the spatial patterns that result from partially unsealed field shingles, and
experimental results from the wind tests performed at the IBHS Research Center
demonstrate that the wind vulnerability of partially unsealed field shingles is greater than
that of sealed shingles. Further work remains to identify the specific mechanism(s) that
cause unsealing. This knowledge is critical for the development of appropriate retrofit
91
guidelines for existing shingle roofs and for future asphalt shingle design,
manufacturing, and installation.
For hip and ridge shingles, the installation technique combined with improperly
placed nails in the sealant strip line are the most likely factors causing partial unsealing
at the edge of the shingle. In the wind tests at the IBHS Research Center, blow off of hip
shingles initiated from the lifting of pre-existing partially unsealed hip shingles, then
progressed up the roof slope. Retrofit solutions to seal the edges of hip and ridge
shingles are available in FEMA (2012), but further work is necessary to quantify the
long-term durability and increased wind performance of the proposed retrofit.
92
CHAPTER 5 WIND RESISTANCE OF NATURALLY AND ARTIFICIALLY AGED ASPHALT
SHINGLES
This chapter details two interrelated studies that measured the bond strength and
resultant failure modes of naturally and artificially aged asphalt shingles. Results
provide knowledge on the expected performance of fully adhered shingles in-service
and the predictive capabilities of the ASTM D7158 (ASTM 2011c) and ASTM D6381
(ASTM 2008b) test methods for asphalt shingle wind resistance. In the first study,
asphalt shingle specimens were artificially aged using two techniques and wind uplift
resistance was measured in a portion of the population at discrete intervals during
aging. In the second study, wind uplift resistance was measure in situ on shingle roofs
installed on four Florida homes with more than nine years of service. A literature review
of aging effects on asphalt shingles is presented first, followed by the research
objectives and study results. The chapter concludes with a discussion of the combined
results.
Aging of Asphalt Shingles
In-service asphalt shingles are exposed to diurnal cycles of temperature and sunlight,
fluctuations in humidity, intermittent rainfall, and wind (Berdahl et al. 2008). Changes in
the shingle’s constitutive materials in response to this environmental exposure are
referred to as aging. Prior research on shingle aging has primarily focused on the
shingle’s coating asphalt, while other materials in the shingle have received less
attention.
Reprinted with permission from Dixon, C.R., Masters, F.J., Prevatt, D.O., and Gurley, K.R. (2013b). “Wind uplift resistance of artifically and naturally aged asphalt shingles.” Journal of Architectural Engineering. [Article Submitted for Review]
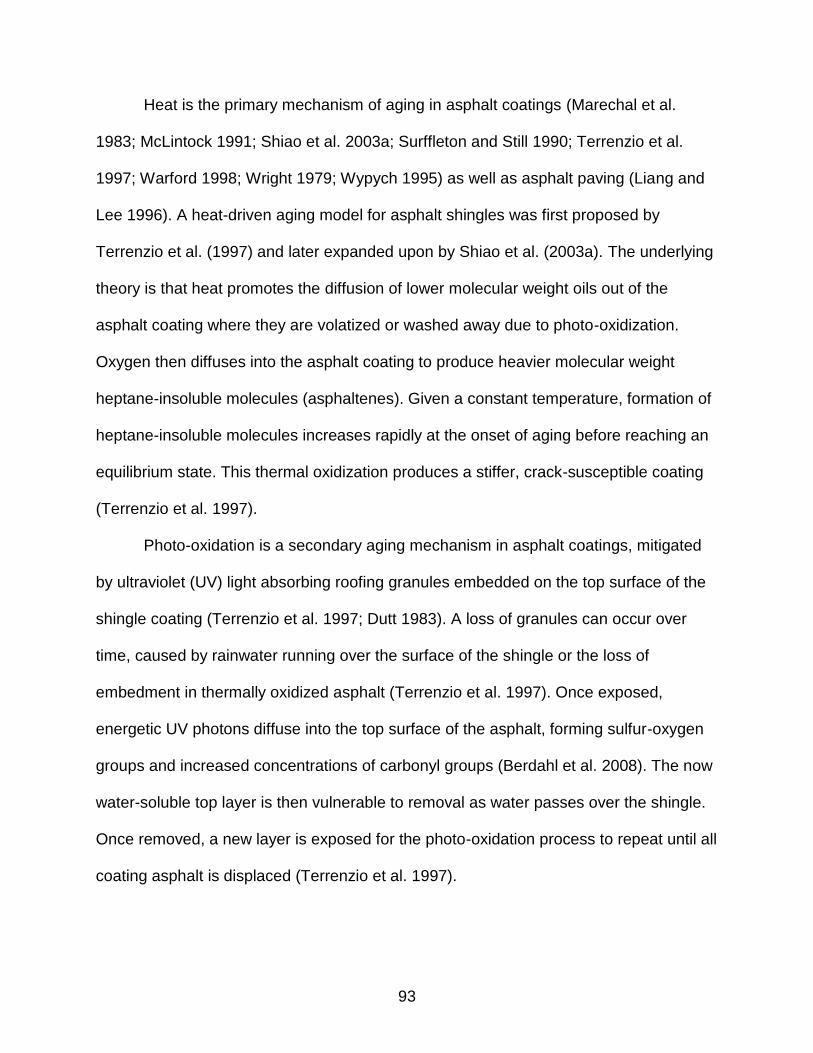
93
Heat is the primary mechanism of aging in asphalt coatings (Marechal et al.
1983; McLintock 1991; Shiao et al. 2003a; Surffleton and Still 1990; Terrenzio et al.
1997; Warford 1998; Wright 1979; Wypych 1995) as well as asphalt paving (Liang and
Lee 1996). A heat-driven aging model for asphalt shingles was first proposed by
Terrenzio et al. (1997) and later expanded upon by Shiao et al. (2003a). The underlying
theory is that heat promotes the diffusion of lower molecular weight oils out of the
asphalt coating where they are volatized or washed away due to photo-oxidization.
Oxygen then diffuses into the asphalt coating to produce heavier molecular weight
heptane-insoluble molecules (asphaltenes). Given a constant temperature, formation of
heptane-insoluble molecules increases rapidly at the onset of aging before reaching an
equilibrium state. This thermal oxidization produces a stiffer, crack-susceptible coating
(Terrenzio et al. 1997).
Photo-oxidation is a secondary aging mechanism in asphalt coatings, mitigated
by ultraviolet (UV) light absorbing roofing granules embedded on the top surface of the
shingle coating (Terrenzio et al. 1997; Dutt 1983). A loss of granules can occur over
time, caused by rainwater running over the surface of the shingle or the loss of
embedment in thermally oxidized asphalt (Terrenzio et al. 1997). Once exposed,
energetic UV photons diffuse into the top surface of the asphalt, forming sulfur-oxygen
groups and increased concentrations of carbonyl groups (Berdahl et al. 2008). The now
water-soluble top layer is then vulnerable to removal as water passes over the shingle.
Once removed, a new layer is exposed for the photo-oxidation process to repeat until all
coating asphalt is displaced (Terrenzio et al. 1997).
94
The wind resistance of the shingle is based upon the weakest element of
cohesive or adhesive strength in or between the constitutive materials in the load path
(Figures 5-1 and 5-2). Although the literature cited widely recognizes that heat and UV
light drive chemical and physical changes in the shingles, the potential effects of these
phenomena on the shingle’s wind uplift resistance are unknown. For example, the
asphalt coating is known to embrittle over exposure time, how does this affect its
cohesive or adhesive strength when subjected to wind uplift? The purpose of this
chapter is to fill this knowledge gap.
Figure 5-1. Wind pressures on shingle roofing.
Figure 5-2. Cross-section view of a shingle’s constitutive materials.
Research Objectives
The overarching objective of this chapter’s two studies was to identify whether
and to what extent aging reduces the bond strength of the sealant strip. The first study
subjected new asphalt shingles to two industry-accepted artificial aging protocols: (a) up
95
to 5376 hr of ASTM D5869-04a (ASTM 2004) dark-oven heat at 70°C (158°F)
(henceforth, Thermal) and (b) up to 3360 hr of ASTM D4799 (ASTM 2008a) continuous
cycles of UV light, heat at 70°C (158°F), and water spray (henceforth, UV-Thermal-
Water). The intent was to initiate a change in the shingle’s chemical and physical
properties, as opposed to a simulation of shingle’s complete service-life. Based upon
results of Terrenzio et al. (1997), use of the Thermal and UV-Thermal-Water protocols,
5376 hr of aging was sufficient to initiate a ~45% increase in the shingle’s asphalt
coating molecular weight and ~150% increase in the shingle’s composite flexural
modulus (i.e., stiffness). Additionally, 5376 hr of aging produced an equivalent change
in asphaltene content to two years of natural aging in Houston, TX. However, the
materials used in the current study were not precisely the same as those used in the
Terrenzio et al. (1997) study.
At discrete intervals during each exposure, the uplift resistance of the sealant
strip composite bond was measured using the ASTM D6381 (ASTM 2008b) mechanical
uplift test, and compared to the baseline mean uplift resistance measured on the new
shingles. Modes of failure in the uplifted shingles were recorded and stratified by
exposure time and type. Total wind uplift resistance across the exposure time was
computed and compared to design wind loads specified in ASTM D7158 (ASTM 2011c).
In the second study, uplift measurements were performed in situ on four shingle
roof systems installed on four Central Florida homes, each with greater than nine years
of natural aging. The total wind resistance of three of the four systems was calculated
via the approach described in Peterka et al. (1997) and compared to their theoretical
design wind loads.
96
Study 1: Wind Uplift Capacity of Asphalt Shingles Subjected to Artificial Aging
Experimental Setup
Shingle specimen specifications
Test specimens were ASTM D7158 Class H (ASTM 2011c) three-tab fiberglass-
reinforced asphalt shingles produced by three manufacturers–henceforth, Products A,
B, and C. Product A was obtained directly from the shingle manufacturer’s plant, while
Products B and C were purchased from a contract supply store. Within each product,
shingles were sourced from the same manufacturing batch to mitigate variability in the
shingle’s asphalt coating and sealant strip chemistry (Shiao et al. 2003b). All shingles
were stored in indoor conditioned space between their time of acquisition and initiation
of testing.
Test specimens were constructed following Section 7 in ASTM D6381 (ASTM
2008b). The number of prepared specimens was even split between Procedure A and
Procedure B. Specimens were cut to their required dimensions (Figure 5-3), then
labeled on the lower surface of the bottom shingle with a unique identification number
corresponding to their product manufacturer, bundle number, shingle number within
each bundle, and specimen number within the individual shingle. The specimen location
in the aging chamber and exposure time prior to mechanical uplift testing were
randomized.
Thermal aging – chamber specifications and protocol
The thermal aging chamber consisted of an Excalibur COM2 forced-air dark oven
[ASTM E145 (ASTM 2011b), Type IIB]. The chamber’s dimensions are 1.8 m (5.9 ft)
high by 0.7 m (2.4 ft) wide by 0.6 m (2.2 ft) deep, and specimens are placed on one of
forty vertically distributed open wire metal racks. Temperature was measured with four
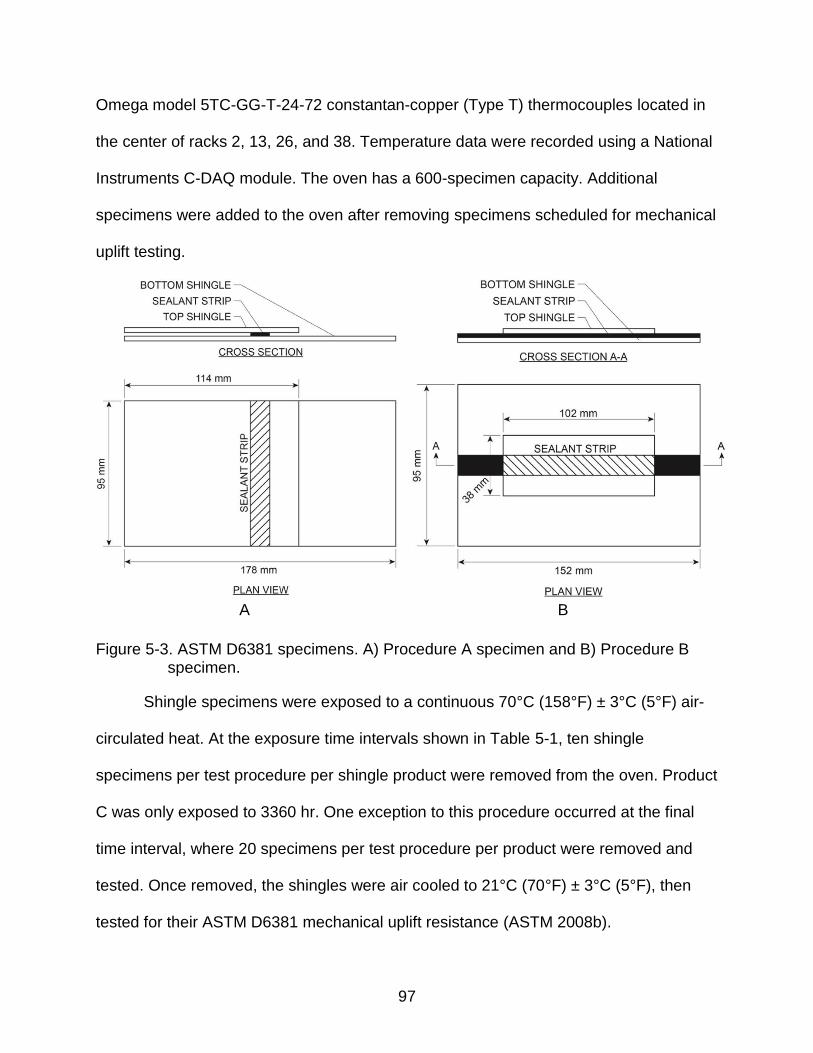
97
Omega model 5TC-GG-T-24-72 constantan-copper (Type T) thermocouples located in
the center of racks 2, 13, 26, and 38. Temperature data were recorded using a National
Instruments C-DAQ module. The oven has a 600-specimen capacity. Additional
specimens were added to the oven after removing specimens scheduled for mechanical
uplift testing.
A B
Figure 5-3. ASTM D6381 specimens. A) Procedure A specimen and B) Procedure B
specimen.
Shingle specimens were exposed to a continuous 70°C (158°F) ± 3°C (5°F) air-
circulated heat. At the exposure time intervals shown in Table 5-1, ten shingle
specimens per test procedure per shingle product were removed from the oven. Product
C was only exposed to 3360 hr. One exception to this procedure occurred at the final
time interval, where 20 specimens per test procedure per product were removed and
tested. Once removed, the shingles were air cooled to 21°C (70°F) ± 3°C (5°F), then
tested for their ASTM D6381 mechanical uplift resistance (ASTM 2008b).
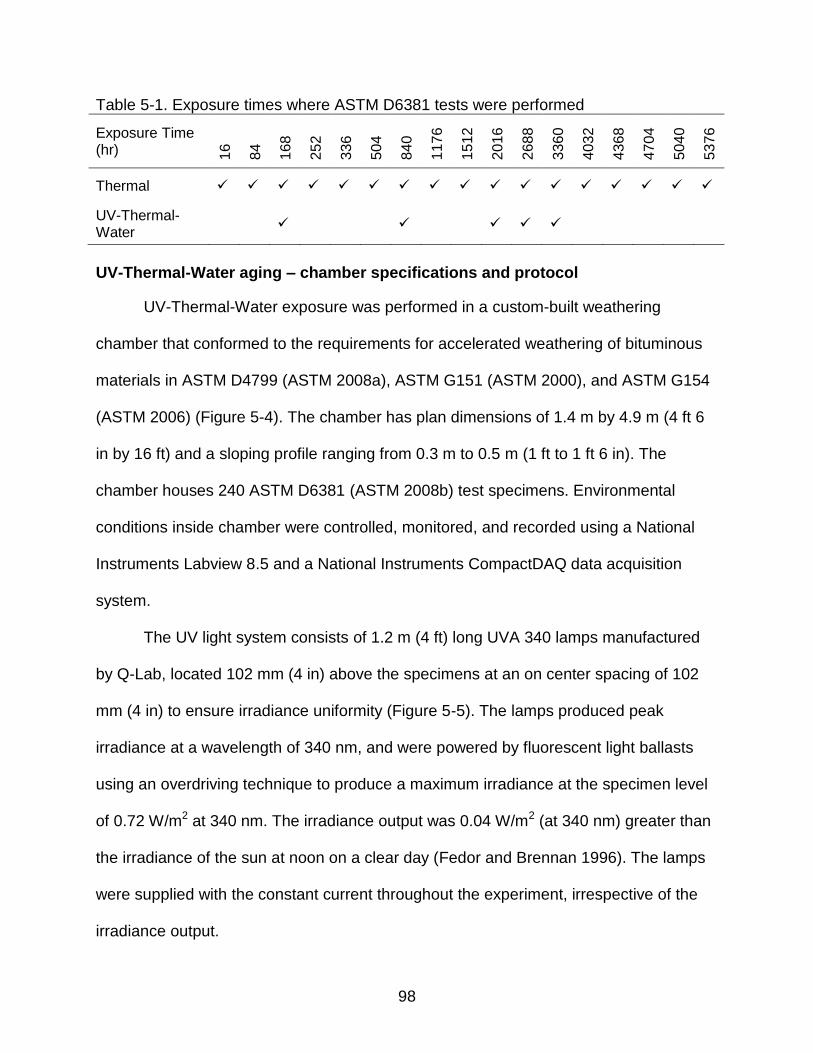
98
Table 5-1. Exposure times where ASTM D6381 tests were performed
Exposure Time (hr) 1
6
84
168
252
336
504
840
1176
1512
2016
2688
3360
4032
4368
4704
5040
5376
Thermal
UV-Thermal-Water
UV-Thermal-Water aging – chamber specifications and protocol
UV-Thermal-Water exposure was performed in a custom-built weathering
chamber that conformed to the requirements for accelerated weathering of bituminous
materials in ASTM D4799 (ASTM 2008a), ASTM G151 (ASTM 2000), and ASTM G154
(ASTM 2006) (Figure 5-4). The chamber has plan dimensions of 1.4 m by 4.9 m (4 ft 6
in by 16 ft) and a sloping profile ranging from 0.3 m to 0.5 m (1 ft to 1 ft 6 in). The
chamber houses 240 ASTM D6381 (ASTM 2008b) test specimens. Environmental
conditions inside chamber were controlled, monitored, and recorded using a National
Instruments Labview 8.5 and a National Instruments CompactDAQ data acquisition
system.
The UV light system consists of 1.2 m (4 ft) long UVA 340 lamps manufactured
by Q-Lab, located 102 mm (4 in) above the specimens at an on center spacing of 102
mm (4 in) to ensure irradiance uniformity (Figure 5-5). The lamps produced peak
irradiance at a wavelength of 340 nm, and were powered by fluorescent light ballasts
using an overdriving technique to produce a maximum irradiance at the specimen level
of 0.72 W/m2 at 340 nm. The irradiance output was 0.04 W/m2 (at 340 nm) greater than
the irradiance of the sun at noon on a clear day (Fedor and Brennan 1996). The lamps
were supplied with the constant current throughout the experiment, irrespective of the
irradiance output.
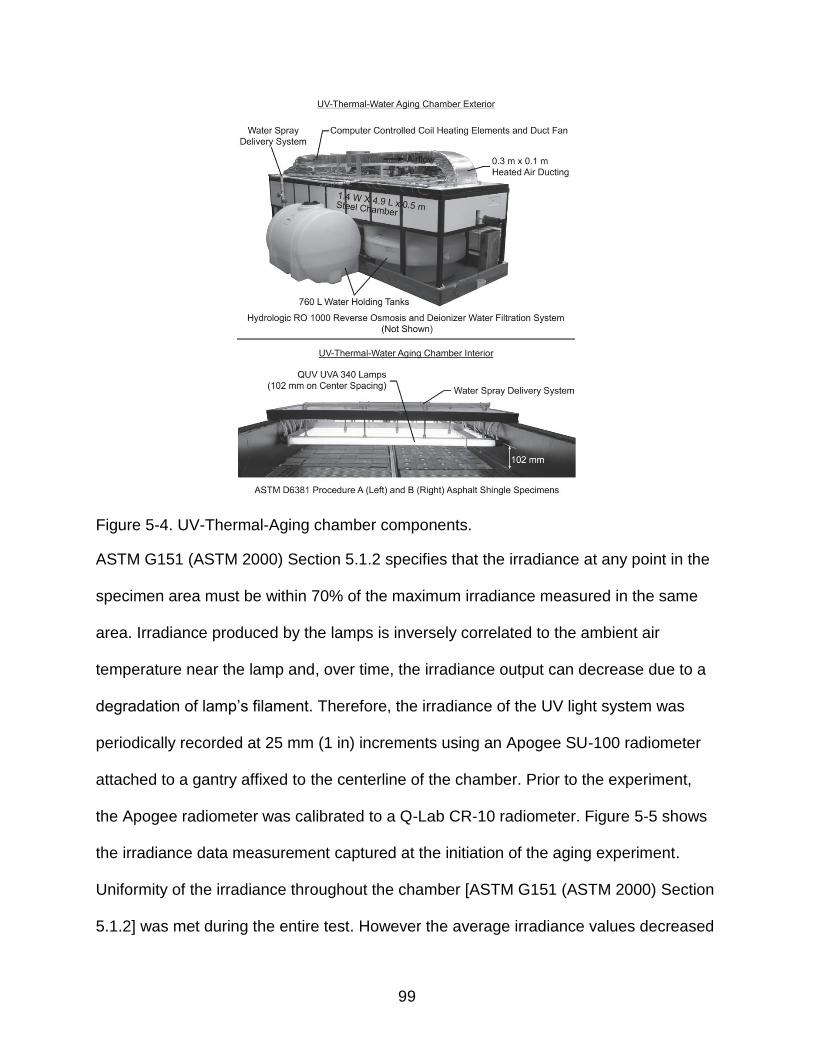
99
Figure 5-4. UV-Thermal-Aging chamber components.
ASTM G151 (ASTM 2000) Section 5.1.2 specifies that the irradiance at any point in the
specimen area must be within 70% of the maximum irradiance measured in the same
area. Irradiance produced by the lamps is inversely correlated to the ambient air
temperature near the lamp and, over time, the irradiance output can decrease due to a
degradation of lamp’s filament. Therefore, the irradiance of the UV light system was
periodically recorded at 25 mm (1 in) increments using an Apogee SU-100 radiometer
attached to a gantry affixed to the centerline of the chamber. Prior to the experiment,
the Apogee radiometer was calibrated to a Q-Lab CR-10 radiometer. Figure 5-5 shows
the irradiance data measurement captured at the initiation of the aging experiment.
Uniformity of the irradiance throughout the chamber [ASTM G151 (ASTM 2000) Section
5.1.2] was met during the entire test. However the average irradiance values decreased
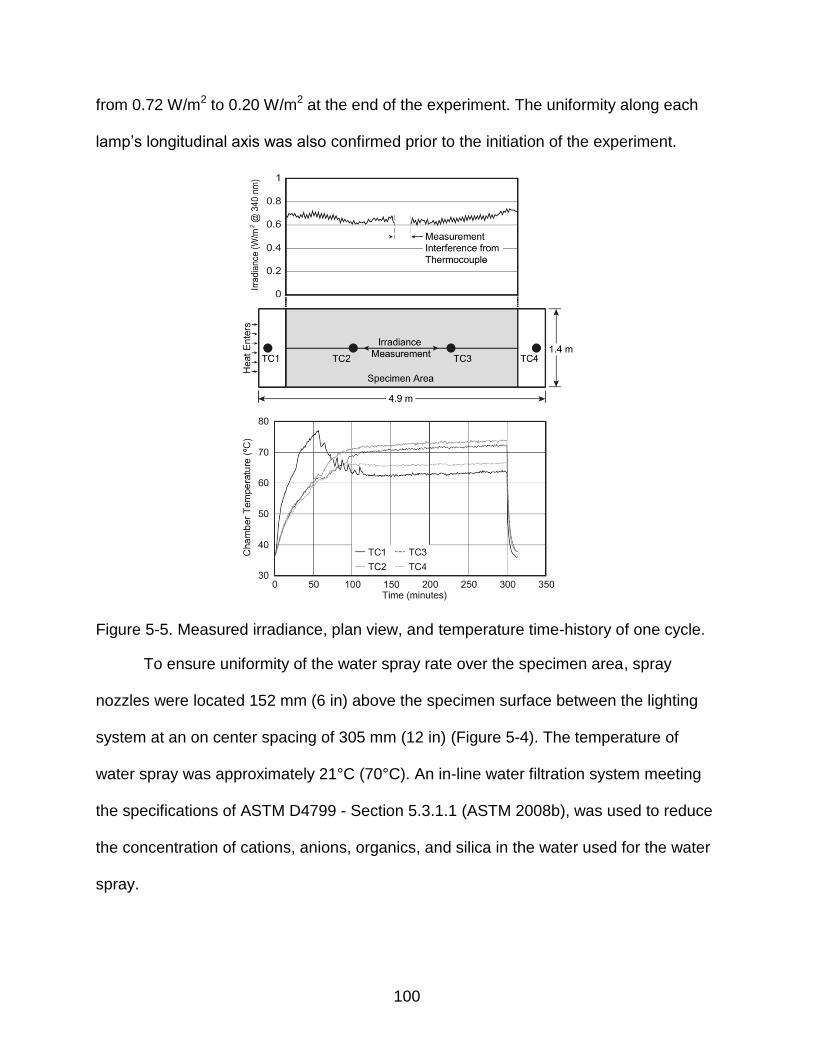
100
from 0.72 W/m2 to 0.20 W/m2 at the end of the experiment. The uniformity along each
lamp’s longitudinal axis was also confirmed prior to the initiation of the experiment.
Figure 5-5. Measured irradiance, plan view, and temperature time-history of one cycle.
To ensure uniformity of the water spray rate over the specimen area, spray
nozzles were located 152 mm (6 in) above the specimen surface between the lighting
system at an on center spacing of 305 mm (12 in) (Figure 5-4). The temperature of
water spray was approximately 21°C (70°C). An in-line water filtration system meeting
the specifications of ASTM D4799 - Section 5.3.1.1 (ASTM 2008b), was used to reduce
the concentration of cations, anions, organics, and silica in the water used for the water
spray.
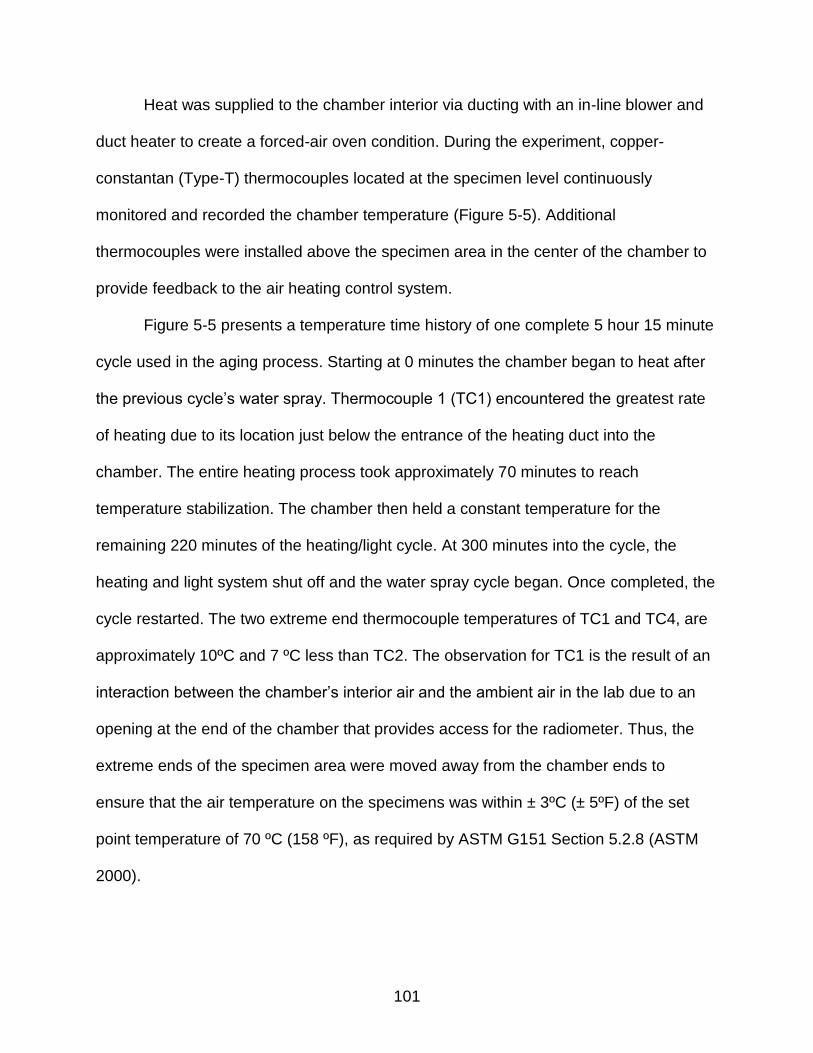
101
Heat was supplied to the chamber interior via ducting with an in-line blower and
duct heater to create a forced-air oven condition. During the experiment, copper-
constantan (Type-T) thermocouples located at the specimen level continuously
monitored and recorded the chamber temperature (Figure 5-5). Additional
thermocouples were installed above the specimen area in the center of the chamber to
provide feedback to the air heating control system.
Figure 5-5 presents a temperature time history of one complete 5 hour 15 minute
cycle used in the aging process. Starting at 0 minutes the chamber began to heat after
the previous cycle’s water spray. Thermocouple 1 (TC1) encountered the greatest rate
of heating due to its location just below the entrance of the heating duct into the
chamber. The entire heating process took approximately 70 minutes to reach
temperature stabilization. The chamber then held a constant temperature for the
remaining 220 minutes of the heating/light cycle. At 300 minutes into the cycle, the
heating and light system shut off and the water spray cycle began. Once completed, the
cycle restarted. The two extreme end thermocouple temperatures of TC1 and TC4, are
approximately 10ºC and 7 ºC less than TC2. The observation for TC1 is the result of an
interaction between the chamber’s interior air and the ambient air in the lab due to an
opening at the end of the chamber that provides access for the radiometer. Thus, the
extreme ends of the specimen area were moved away from the chamber ends to
ensure that the air temperature on the specimens was within ± 3ºC (± 5ºF) of the set
point temperature of 70 ºC (158 ºF), as required by ASTM G151 Section 5.2.8 (ASTM
2000).
102
Due to the capacity limits of the weathering chamber, only Products A and B
were subjected to UV-Thermal-Water exposure. Specimens were conditioned in the
forced air dark oven for 16 hours at 70°C (158°F) ± 3°C (5°F) prior to their UV-Thermal-
Water exposure. This ensured tab seal activation resulting in bonded shingles prior to
their exposure to water spray. Following this, all specimens were inspected by hand for
adhesion, then placed inside the UV-Thermal-Water chamber and exposed to
continuous cycles of five hours of 70°C (158°F) heat with UVA-340 ultraviolet light,
followed by 15 minutes of water spray.
At the times shown in Table 5-1, twenty predetermined shingle specimens per
test procedure per shingle product were removed from the chamber. The entire
specimen inventory could not fit in the chamber at one time; therefore, specimens
scheduled for removal at 168, 2688, and 3360 hr were placed in the chamber first. After
removal of the 168 hr exposure specimens, 2016 hr specimens were placed in the
camber. Following 2016 hr removal, specimens scheduled for 840 hr of exposure were
placed in the chamber. Similar to the thermal exposure procedure, specimens were air
cooled to 21°C (70°F) ± 3°C (5°F) after their removal from the chamber, then tested for
their mechanical uplift resistance – described in the next section.
ASTM D6381 Mechanical Uplift Test Procedure
The ASTM D6381 test method consists of two test procedures (A and B) that
simulate the individual wind loading components of asphalt shingles (ASTM 2008b).
The results of each test (RA and RB) were combined using rational engineering analysis
[per ASTM D7158 (ASTM 2011c)] to generate the total wind uplift resistance, as shown
in Equation 5-1. The force variables shown in the equation represent the windward (FF),
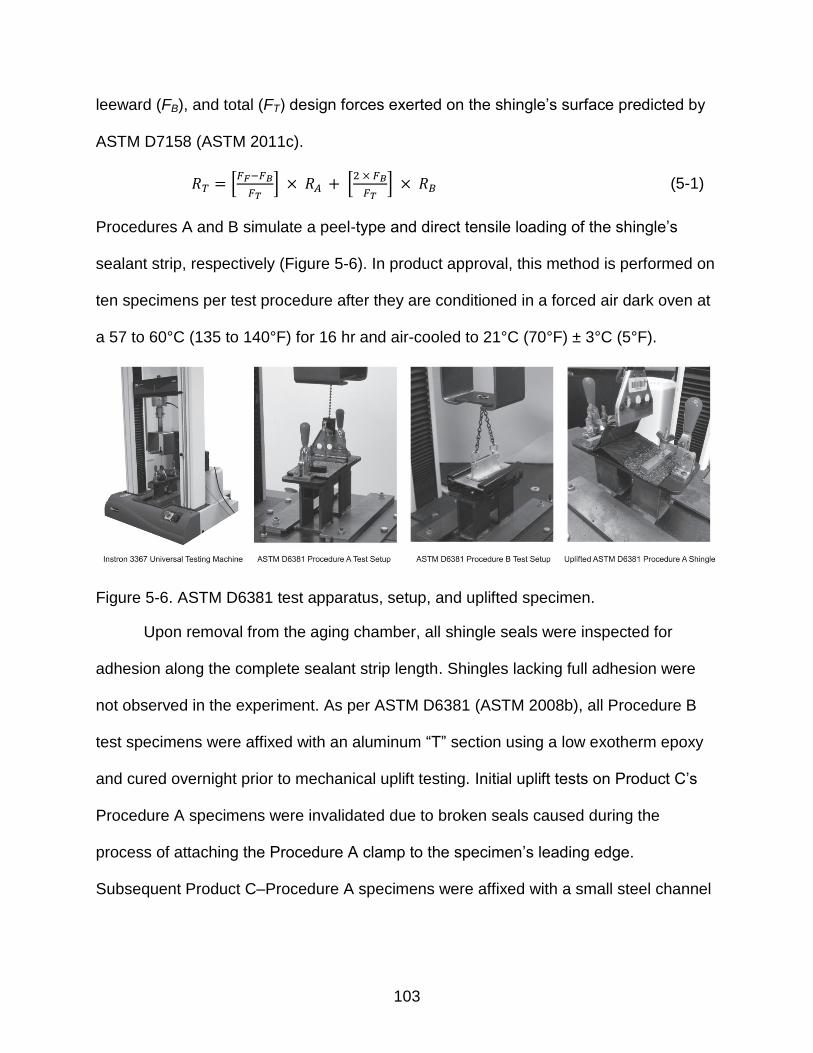
103
leeward (FB), and total (FT) design forces exerted on the shingle’s surface predicted by
ASTM D7158 (ASTM 2011c).
[
] [
] (5-1)
Procedures A and B simulate a peel-type and direct tensile loading of the shingle’s
sealant strip, respectively (Figure 5-6). In product approval, this method is performed on
ten specimens per test procedure after they are conditioned in a forced air dark oven at
a 57 to 60°C (135 to 140°F) for 16 hr and air-cooled to 21°C (70°F) ± 3°C (5°F).
Figure 5-6. ASTM D6381 test apparatus, setup, and uplifted specimen.
Upon removal from the aging chamber, all shingle seals were inspected for
adhesion along the complete sealant strip length. Shingles lacking full adhesion were
not observed in the experiment. As per ASTM D6381 (ASTM 2008b), all Procedure B
test specimens were affixed with an aluminum “T” section using a low exotherm epoxy
and cured overnight prior to mechanical uplift testing. Initial uplift tests on Product C’s
Procedure A specimens were invalidated due to broken seals caused during the
process of attaching the Procedure A clamp to the specimen’s leading edge.
Subsequent Product C–Procedure A specimens were affixed with a small steel channel
104
prior to uplift testing, after ASTM D6381 Section 7.7.3 (ASTM 2008b). It was not
necessary to use the steel channel on Products A and B.
Uplift tests were performed in an air-conditioned laboratory on shingle specimens
with a 21°C (70°F) ± 3°C (5°F) surface temperature. The test apparatus was an Instron
3367 Universal Testing Machine (UTM) set to an ASTM D6381 (ASTM 2008b) specified
constant uplift displacement rate of 127 mm/min (5 in/min). The test stopped when: (a)
the two shingles lost adhesion along a complete length of their sealant strip line or (b)
the instantaneous force measurement was less than 30% of the maximum force
measured during the test. Case (b) frequently occurred when the mode of failure was at
the bottom shingle’s asphalt coating-to-glass mat interface (rightmost photo of Figure 5-
6). Following the test, the operator recorded the peak force applied to the shingle and
the shingle temperature. Uplift resistance of the specimen was defined as the peak
force applied to the shingle during the uplift test. The mode of failure was determined by
an analysis of high-resolution post-test photographs of the specimen’s sealant strip.
Results
ASTM D6381 Procedures A and B uplift resistance
Figures 5-7 through 5-9 present the complete dataset of ASTM D6381 test
results stratified by product, mechanical uplift test procedure, artificial aging protocol,
and exposure time. The mean uplift resistance, one standard deviation, and 95%
confidence interval of the mean are provided. The black dashed boxes surrounding
individual confidence intervals indicate where mean resistance was significantly lower
than mean resistance measured at the 16 hr Thermal exposure period.
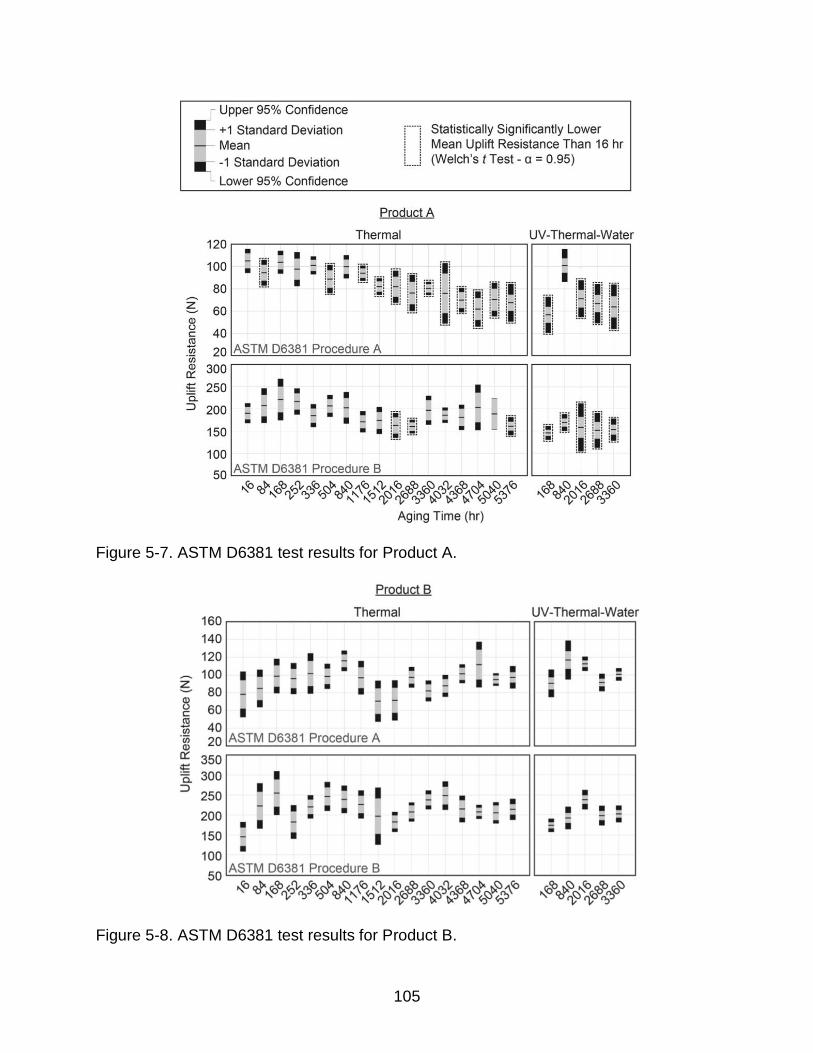
105
Figure 5-7. ASTM D6381 test results for Product A.
Figure 5-8. ASTM D6381 test results for Product B.
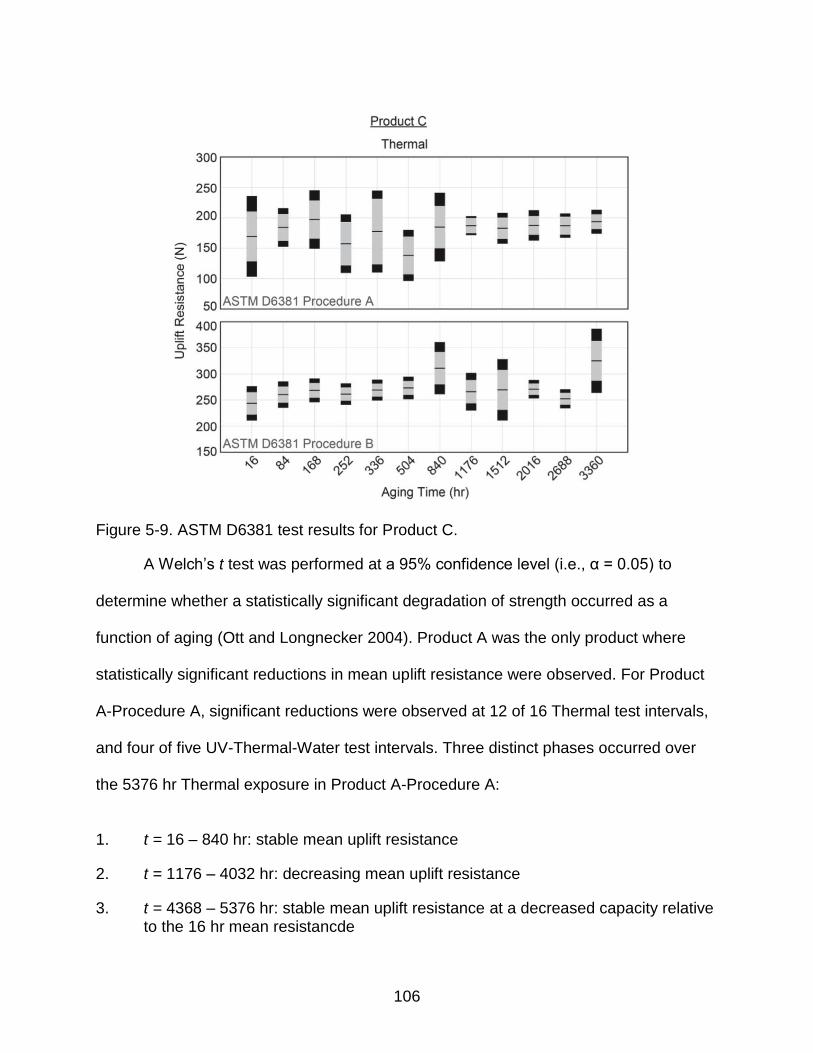
106
Figure 5-9. ASTM D6381 test results for Product C.
A Welch’s t test was performed at a 95% confidence level (i.e., α = 0.05) to
determine whether a statistically significant degradation of strength occurred as a
function of aging (Ott and Longnecker 2004). Product A was the only product where
statistically significant reductions in mean uplift resistance were observed. For Product
A-Procedure A, significant reductions were observed at 12 of 16 Thermal test intervals,
and four of five UV-Thermal-Water test intervals. Three distinct phases occurred over
the 5376 hr Thermal exposure in Product A-Procedure A:
1. t = 16 – 840 hr: stable mean uplift resistance
2. t = 1176 – 4032 hr: decreasing mean uplift resistance
3. t = 4368 – 5376 hr: stable mean uplift resistance at a decreased capacity relative to the 16 hr mean resistancde
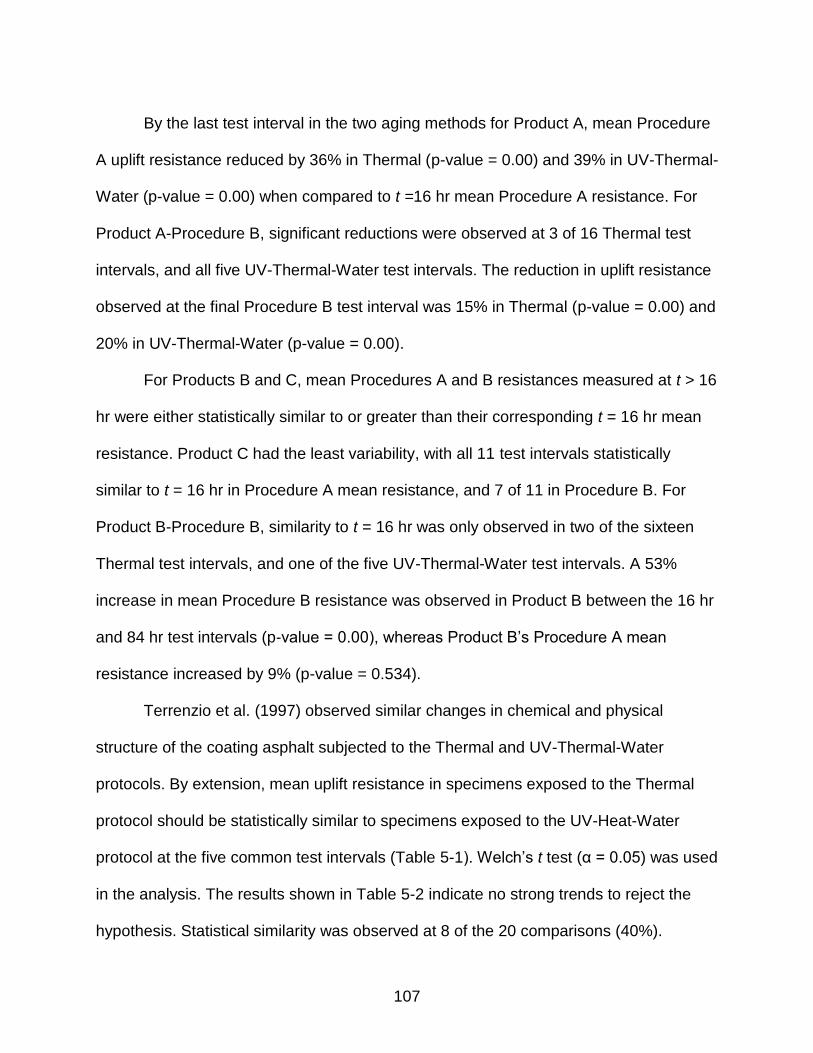
107
By the last test interval in the two aging methods for Product A, mean Procedure
A uplift resistance reduced by 36% in Thermal (p-value = 0.00) and 39% in UV-Thermal-
Water (p-value = 0.00) when compared to t =16 hr mean Procedure A resistance. For
Product A-Procedure B, significant reductions were observed at 3 of 16 Thermal test
intervals, and all five UV-Thermal-Water test intervals. The reduction in uplift resistance
observed at the final Procedure B test interval was 15% in Thermal (p-value = 0.00) and
20% in UV-Thermal-Water (p-value = 0.00).
For Products B and C, mean Procedures A and B resistances measured at t > 16
hr were either statistically similar to or greater than their corresponding t = 16 hr mean
resistance. Product C had the least variability, with all 11 test intervals statistically
similar to t = 16 hr in Procedure A mean resistance, and 7 of 11 in Procedure B. For
Product B-Procedure B, similarity to t = 16 hr was only observed in two of the sixteen
Thermal test intervals, and one of the five UV-Thermal-Water test intervals. A 53%
increase in mean Procedure B resistance was observed in Product B between the 16 hr
and 84 hr test intervals (p-value = 0.00), whereas Product B’s Procedure A mean
resistance increased by 9% (p-value = 0.534).
Terrenzio et al. (1997) observed similar changes in chemical and physical
structure of the coating asphalt subjected to the Thermal and UV-Thermal-Water
protocols. By extension, mean uplift resistance in specimens exposed to the Thermal
protocol should be statistically similar to specimens exposed to the UV-Heat-Water
protocol at the five common test intervals (Table 5-1). Welch’s t test (α = 0.05) was used
in the analysis. The results shown in Table 5-2 indicate no strong trends to reject the
hypothesis. Statistical similarity was observed at 8 of the 20 comparisons (40%).
108
Product B-Procedure B contained the only occurrence of consistent outcome across all
five test intervals –dissimilar (p-values ≤ 0.03).
Table 5-2. Mean resistance in Thermal and UV-Thermal-Water methods
Product ASTM D6381 Test Procedure
Mean Resistance at Common Exposure: Thermal = UV-Thermal-Water? (p-value
1)
168 hr 840 hr 2016 hr 2688 hr 3360 hr
A A No
2 (0.00) Yes (0.81) Yes (0.09) Yes (0.16) No
2 (0.01)
B No2 (0.00) No
2 (0.02) Yes (0.77) Yes (0.43) No
2 (0.01)
B A Yes (0.26) Yes (0.90) No
3 (0.00) Yes (0.19) No
3 (0.00)
B No2 (0.00) No
2 (0.00) No
3 (0.01) No
2 (0.00) No
2 (0.03)
1Welch’s t test (α = 0.05)
2Thermal > UV-Thermal-Water
3Thermal < UV-Thermal-Water
Failure modes in uplifted shingles
Five modes of failure were observed in the mechanically uplifted shingles,
referring to Figure 5-10:
1. Adhesive failure at the bottom shingle asphalt coating-to-glass mat interface 2. Cohesive failure in the sealant strip 3. Adhesive failure at the sealant strip-to-top shingle interface 4. Cohesive failure in the bottom shingle asphalt coating 5. Adhesive failure at the top shingle asphalt coating-to-glass mat interface The majority of tested shingles had more than one mode of failure along a given sealant
strip line. Photographs of each shingle’s failed sealant strip line were visually inspected
to quantify the relative contribution of each failure mode. As shown in top two photos of
Figure 5-10, if a mode contributed to more than half of the sealant strip area, that
particular failure mode was assigned as a ‘dominant’ failure mode in the specimen. All
other failure modes in that particular shingle were ignored. If a ‘dominant’ failure mode
was unable to be determined (i.e., bottom photograph of Figure 5-10), the failure mode
of the shingle was assigned as a ‘mixed-modal’ failure.
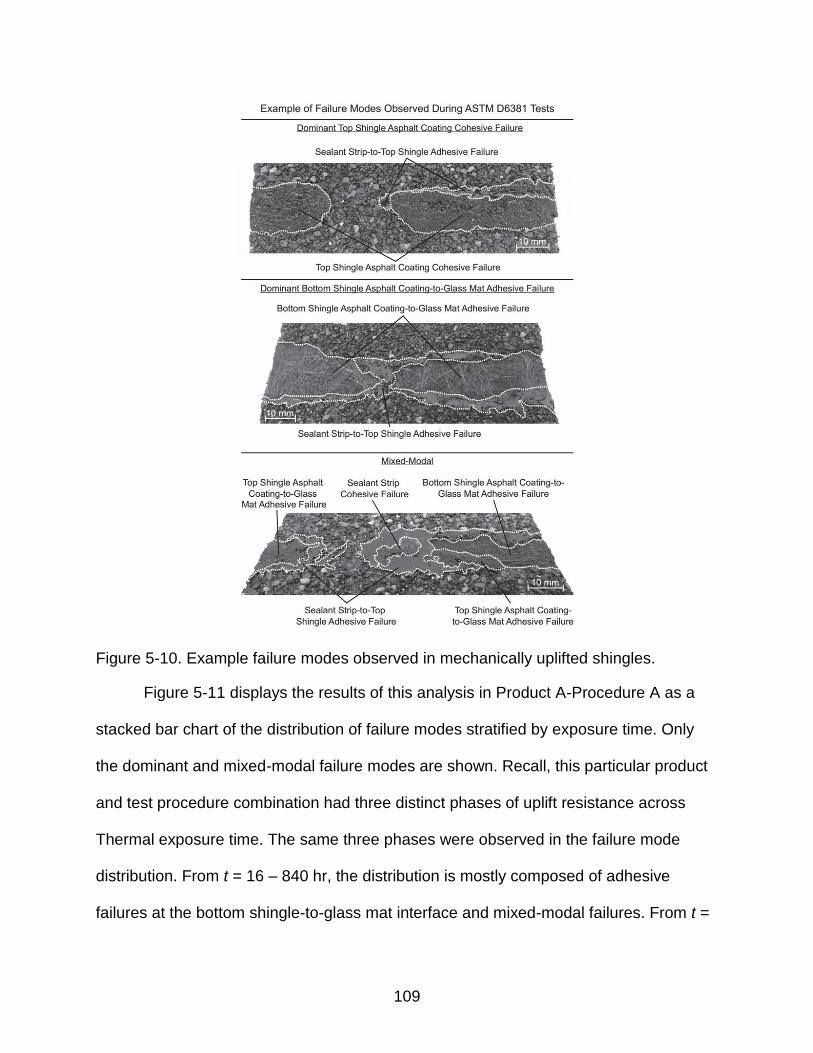
109
Figure 5-10. Example failure modes observed in mechanically uplifted shingles.
Figure 5-11 displays the results of this analysis in Product A-Procedure A as a
stacked bar chart of the distribution of failure modes stratified by exposure time. Only
the dominant and mixed-modal failure modes are shown. Recall, this particular product
and test procedure combination had three distinct phases of uplift resistance across
Thermal exposure time. The same three phases were observed in the failure mode
distribution. From t = 16 – 840 hr, the distribution is mostly composed of adhesive
failures at the bottom shingle-to-glass mat interface and mixed-modal failures. From t =
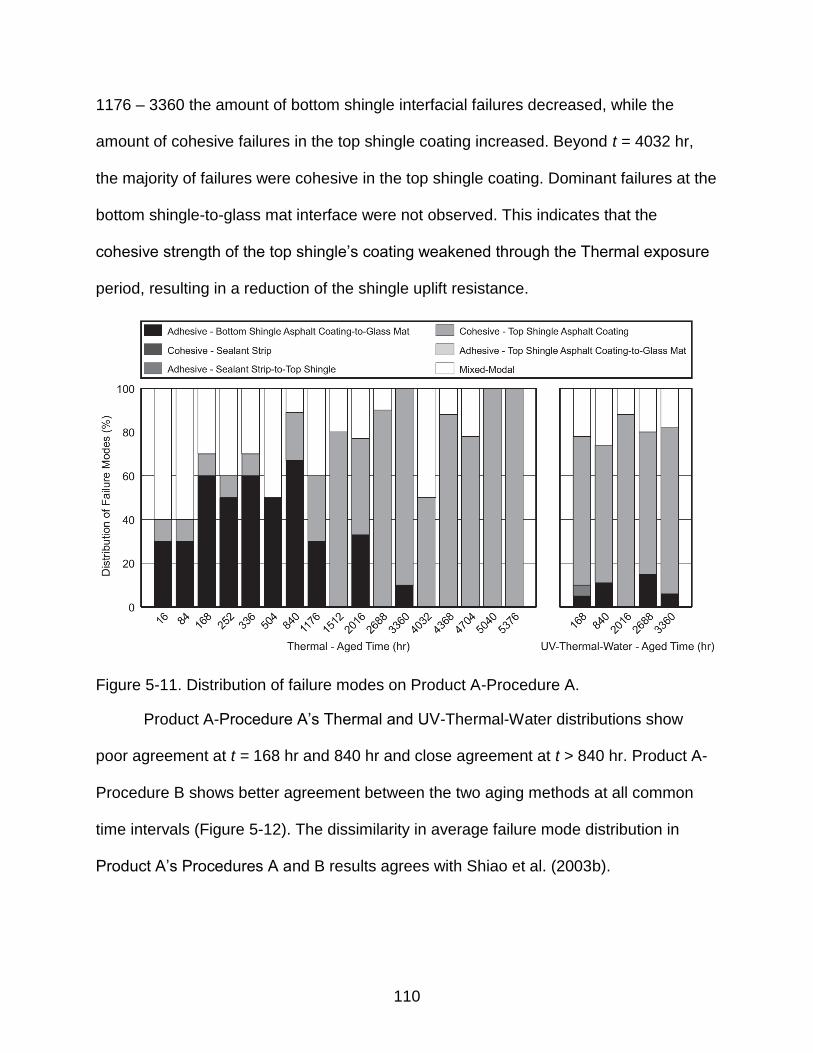
110
1176 – 3360 the amount of bottom shingle interfacial failures decreased, while the
amount of cohesive failures in the top shingle coating increased. Beyond t = 4032 hr,
the majority of failures were cohesive in the top shingle coating. Dominant failures at the
bottom shingle-to-glass mat interface were not observed. This indicates that the
cohesive strength of the top shingle’s coating weakened through the Thermal exposure
period, resulting in a reduction of the shingle uplift resistance.
Figure 5-11. Distribution of failure modes on Product A-Procedure A.
Product A-Procedure A’s Thermal and UV-Thermal-Water distributions show
poor agreement at t = 168 hr and 840 hr and close agreement at t > 840 hr. Product A-
Procedure B shows better agreement between the two aging methods at all common
time intervals (Figure 5-12). The dissimilarity in average failure mode distribution in
Product A’s Procedures A and B results agrees with Shiao et al. (2003b).
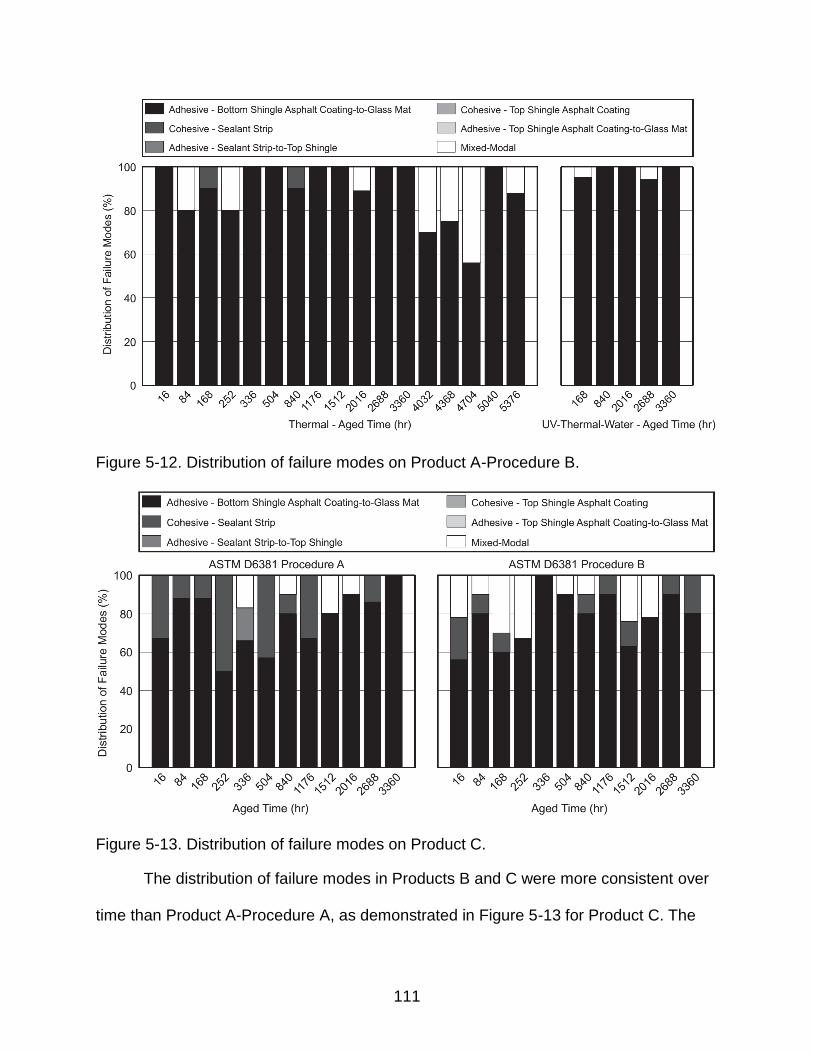
111
Figure 5-12. Distribution of failure modes on Product A-Procedure B.
Figure 5-13. Distribution of failure modes on Product C.
The distribution of failure modes in Products B and C were more consistent over
time than Product A-Procedure A, as demonstrated in Figure 5-13 for Product C. The
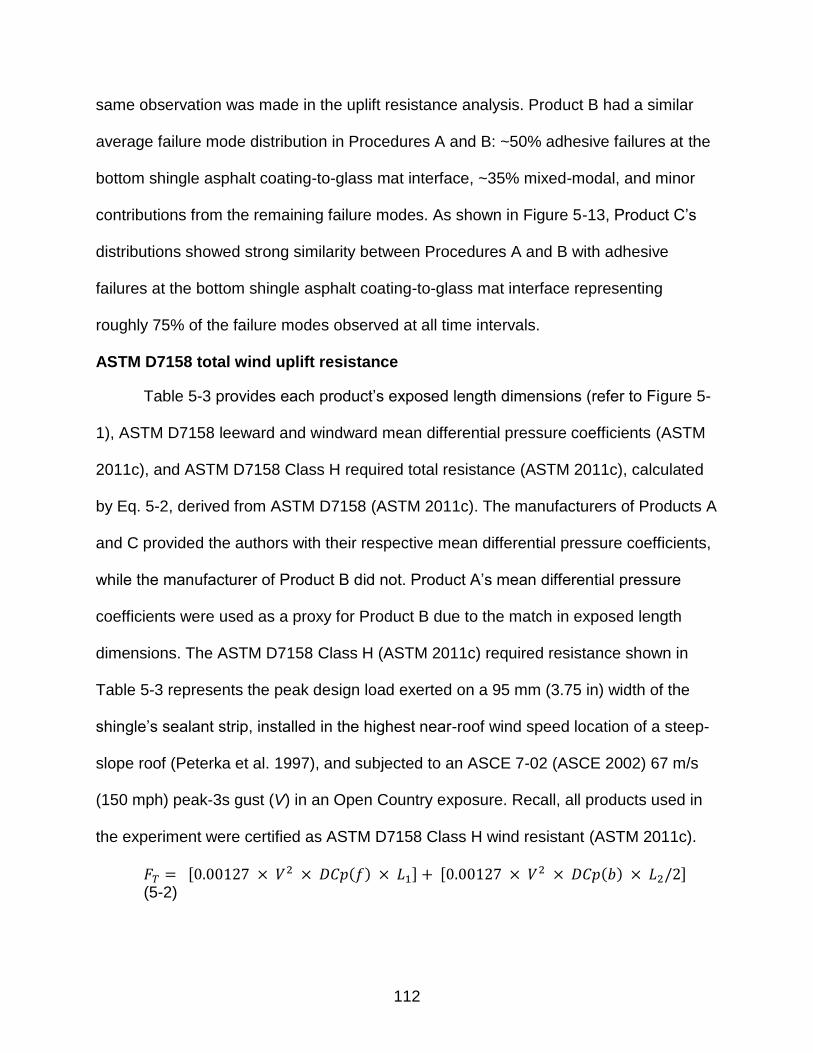
112
same observation was made in the uplift resistance analysis. Product B had a similar
average failure mode distribution in Procedures A and B: ~50% adhesive failures at the
bottom shingle asphalt coating-to-glass mat interface, ~35% mixed-modal, and minor
contributions from the remaining failure modes. As shown in Figure 5-13, Product C’s
distributions showed strong similarity between Procedures A and B with adhesive
failures at the bottom shingle asphalt coating-to-glass mat interface representing
roughly 75% of the failure modes observed at all time intervals.
ASTM D7158 total wind uplift resistance
Table 5-3 provides each product’s exposed length dimensions (refer to Figure 5-
1), ASTM D7158 leeward and windward mean differential pressure coefficients (ASTM
2011c), and ASTM D7158 Class H required total resistance (ASTM 2011c), calculated
by Eq. 5-2, derived from ASTM D7158 (ASTM 2011c). The manufacturers of Products A
and C provided the authors with their respective mean differential pressure coefficients,
while the manufacturer of Product B did not. Product A’s mean differential pressure
coefficients were used as a proxy for Product B due to the match in exposed length
dimensions. The ASTM D7158 Class H (ASTM 2011c) required resistance shown in
Table 5-3 represents the peak design load exerted on a 95 mm (3.75 in) width of the
shingle’s sealant strip, installed in the highest near-roof wind speed location of a steep-
slope roof (Peterka et al. 1997), and subjected to an ASCE 7-02 (ASCE 2002) 67 m/s
(150 mph) peak-3s gust (V) in an Open Country exposure. Recall, all products used in
the experiment were certified as ASTM D7158 Class H wind resistant (ASTM 2011c).
[ ( ) ] [
( ) ] (5-2)
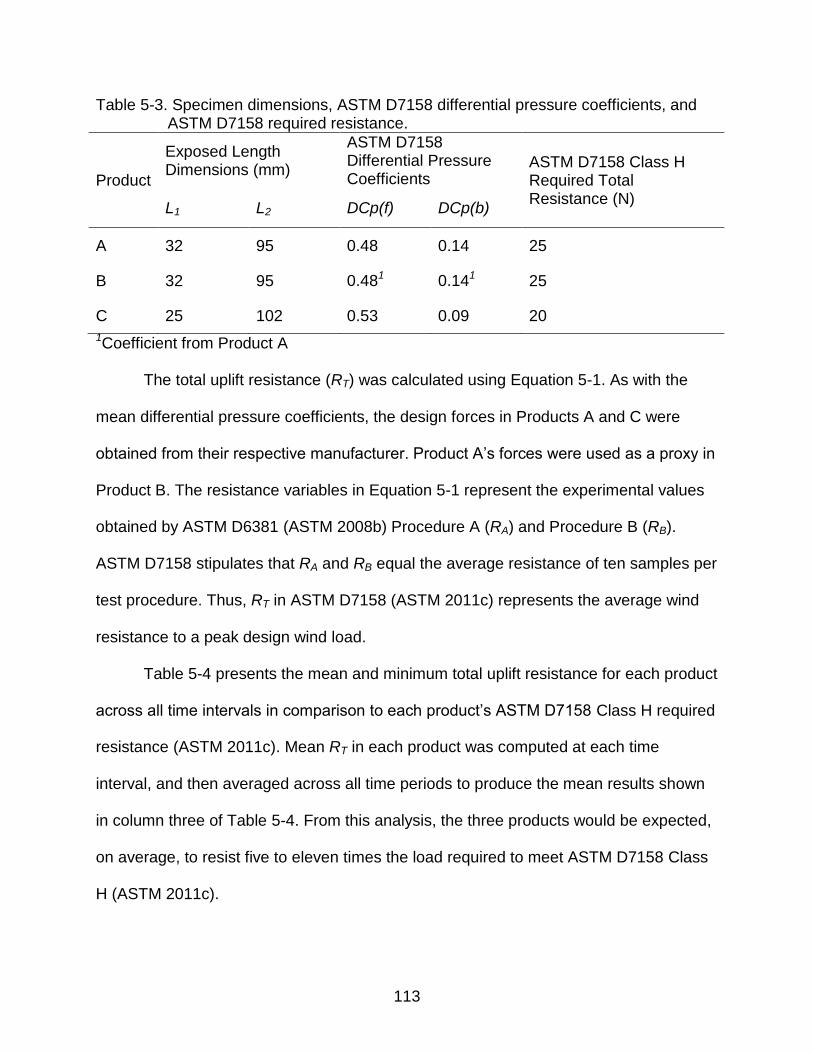
113
Table 5-3. Specimen dimensions, ASTM D7158 differential pressure coefficients, and ASTM D7158 required resistance.
Product
Exposed Length Dimensions (mm)
ASTM D7158 Differential Pressure Coefficients
ASTM D7158 Class H Required Total Resistance (N)
L1 L2 DCp(f) DCp(b)
A 32 95 0.48 0.14 25
B 32 95 0.481 0.141 25
C 25 102 0.53 0.09 20
1Coefficient from Product A
The total uplift resistance (RT) was calculated using Equation 5-1. As with the
mean differential pressure coefficients, the design forces in Products A and C were
obtained from their respective manufacturer. Product A’s forces were used as a proxy in
Product B. The resistance variables in Equation 5-1 represent the experimental values
obtained by ASTM D6381 (ASTM 2008b) Procedure A (RA) and Procedure B (RB).
ASTM D7158 stipulates that RA and RB equal the average resistance of ten samples per
test procedure. Thus, RT in ASTM D7158 (ASTM 2011c) represents the average wind
resistance to a peak design wind load.
Table 5-4 presents the mean and minimum total uplift resistance for each product
across all time intervals in comparison to each product’s ASTM D7158 Class H required
resistance (ASTM 2011c). Mean RT in each product was computed at each time
interval, and then averaged across all time periods to produce the mean results shown
in column three of Table 5-4. From this analysis, the three products would be expected,
on average, to resist five to eleven times the load required to meet ASTM D7158 Class
H (ASTM 2011c).
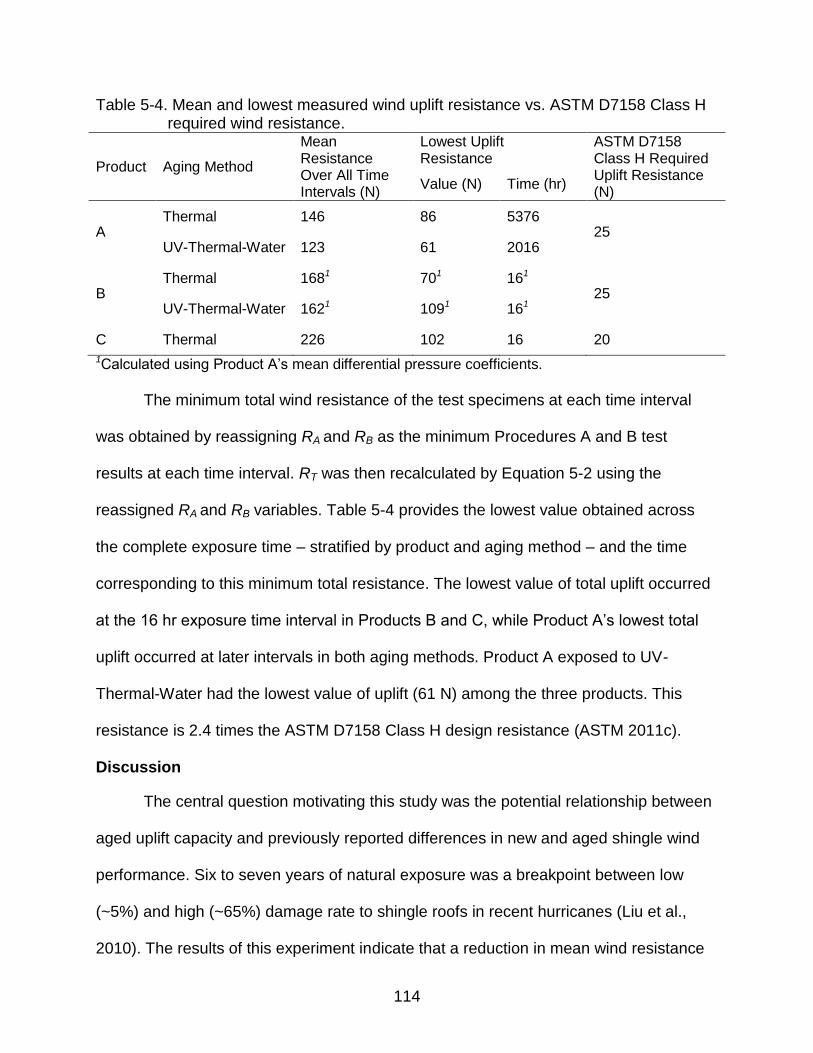
114
Table 5-4. Mean and lowest measured wind uplift resistance vs. ASTM D7158 Class H required wind resistance.
Product Aging Method
Mean Resistance Over All Time Intervals (N)
Lowest Uplift Resistance
ASTM D7158 Class H Required Uplift Resistance (N)
Value (N) Time (hr)
A Thermal 146 86 5376
25 UV-Thermal-Water 123 61 2016
B Thermal 1681 701 161
25 UV-Thermal-Water 1621 1091 161
C Thermal 226 102 16 20
1Calculated using Product A’s mean differential pressure coefficients.
The minimum total wind resistance of the test specimens at each time interval
was obtained by reassigning RA and RB as the minimum Procedures A and B test
results at each time interval. RT was then recalculated by Equation 5-2 using the
reassigned RA and RB variables. Table 5-4 provides the lowest value obtained across
the complete exposure time – stratified by product and aging method – and the time
corresponding to this minimum total resistance. The lowest value of total uplift occurred
at the 16 hr exposure time interval in Products B and C, while Product A’s lowest total
uplift occurred at later intervals in both aging methods. Product A exposed to UV-
Thermal-Water had the lowest value of uplift (61 N) among the three products. This
resistance is 2.4 times the ASTM D7158 Class H design resistance (ASTM 2011c).
Discussion
The central question motivating this study was the potential relationship between
aged uplift capacity and previously reported differences in new and aged shingle wind
performance. Six to seven years of natural exposure was a breakpoint between low
(~5%) and high (~65%) damage rate to shingle roofs in recent hurricanes (Liu et al.,
2010). The results of this experiment indicate that a reduction in mean wind resistance
115
may occur in shingle roofs as result of heat-driven aging. Yet, the capacity of aged
shingles at the reduced resistance exceeds design-level both in a mean and minimum
sense. 5376 hr of Thermal aging was roughly equivalent to two years of natural
exposure in Houston, TX (Terrenzio et al., 1997); therefore it is reasonable to assume
that six years of natural aging was not achieved in either aging protocol.
The most significant finding of the experiment involves the two distinct responses
to artificial aging observed in the three shingle products evaluated. Product A
demonstrated a statistically significant reduction in mean uplift resistance over time.
Conversely, all mean resistance measurements of Products B and C were either
statistically similar or greater than the mean resistance of the baseline new installation
capacity at 16 hr of Thermal exposure. We speculate that variation in strength across
specimens is related to the shingle’s asphalt coating formulation, which was not studied
during these experiments. Further, the wind uplift capacity of all three products at all
time intervals and at all possible combinations of Procedures A and B resistances
exceeded the required capacity to meet ASTM D7158 Class H (ASTM 2011c) – ASCE
7-02 (ASCE 2002) design wind of 67 m/s (150 mph) in open country terrain. The
reduction in the bond strength did not exceed the reserve capacity, which suggests that
increasing the strength requirement may not be warranted. Additional research is
required to determine if this conclusion is extensible to the entire roof system, which is
comprised of thousands of individual shingles.
Failures were most frequently observed either at the interface of the top coating
of the bottom shingle-to-glass mat or cohesively in bottom coating of the top shingle.
Cohesive failures in the sealant strip and interfacial failures at the sealant strip-to-top
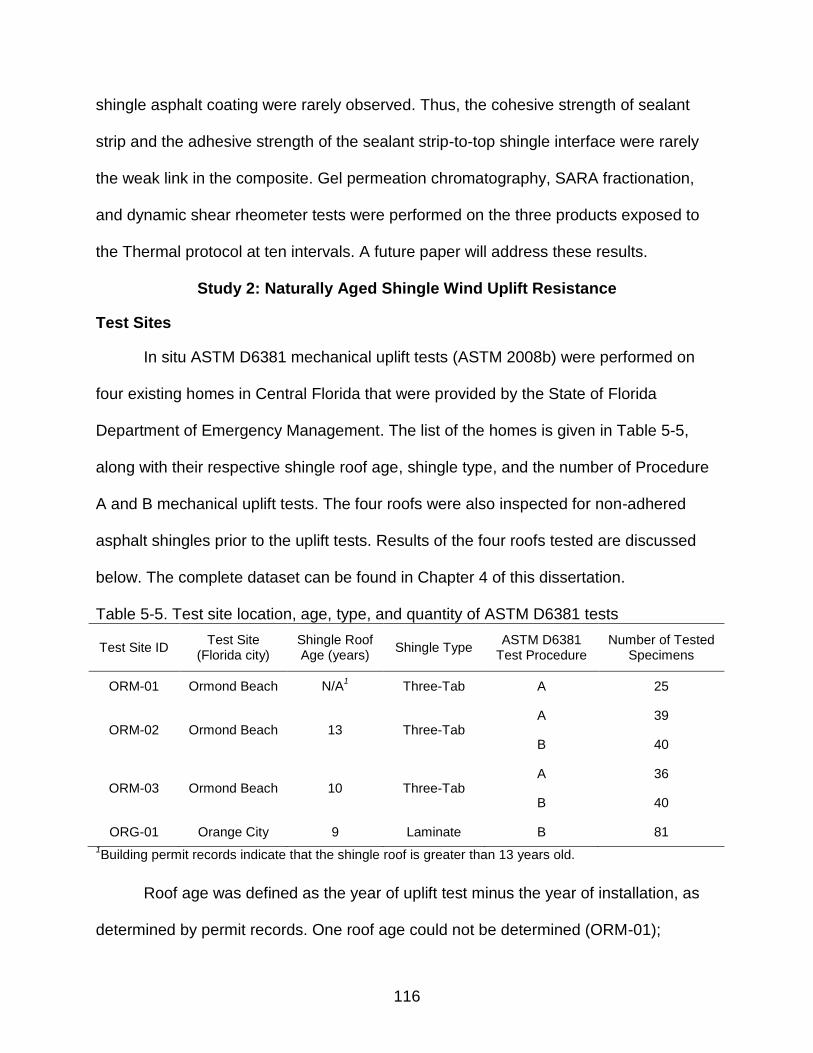
116
shingle asphalt coating were rarely observed. Thus, the cohesive strength of sealant
strip and the adhesive strength of the sealant strip-to-top shingle interface were rarely
the weak link in the composite. Gel permeation chromatography, SARA fractionation,
and dynamic shear rheometer tests were performed on the three products exposed to
the Thermal protocol at ten intervals. A future paper will address these results.
Study 2: Naturally Aged Shingle Wind Uplift Resistance
Test Sites
In situ ASTM D6381 mechanical uplift tests (ASTM 2008b) were performed on
four existing homes in Central Florida that were provided by the State of Florida
Department of Emergency Management. The list of the homes is given in Table 5-5,
along with their respective shingle roof age, shingle type, and the number of Procedure
A and B mechanical uplift tests. The four roofs were also inspected for non-adhered
asphalt shingles prior to the uplift tests. Results of the four roofs tested are discussed
below. The complete dataset can be found in Chapter 4 of this dissertation.
Table 5-5. Test site location, age, type, and quantity of ASTM D6381 tests
Test Site ID Test Site
(Florida city) Shingle Roof Age (years)
Shingle Type ASTM D6381
Test Procedure Number of Tested
Specimens
ORM-01 Ormond Beach N/A1
Three-Tab A 25
ORM-02 Ormond Beach 13 Three-Tab A 39
B 40
ORM-03 Ormond Beach 10 Three-Tab A 36
B 40
ORG-01 Orange City 9 Laminate B 81
1Building permit records indicate that the shingle roof is greater than 13 years old.
Roof age was defined as the year of uplift test minus the year of installation, as
determined by permit records. One roof age could not be determined (ORM-01);
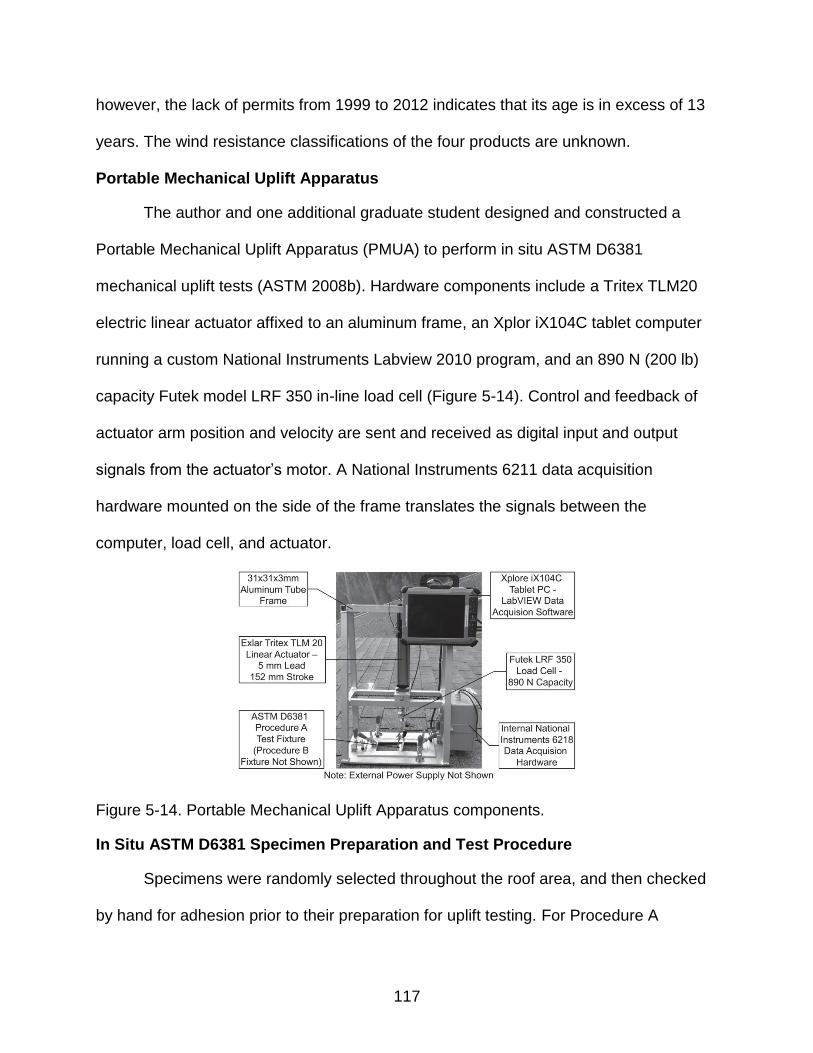
117
however, the lack of permits from 1999 to 2012 indicates that its age is in excess of 13
years. The wind resistance classifications of the four products are unknown.
Portable Mechanical Uplift Apparatus
The author and one additional graduate student designed and constructed a
Portable Mechanical Uplift Apparatus (PMUA) to perform in situ ASTM D6381
mechanical uplift tests (ASTM 2008b). Hardware components include a Tritex TLM20
electric linear actuator affixed to an aluminum frame, an Xplor iX104C tablet computer
running a custom National Instruments Labview 2010 program, and an 890 N (200 lb)
capacity Futek model LRF 350 in-line load cell (Figure 5-14). Control and feedback of
actuator arm position and velocity are sent and received as digital input and output
signals from the actuator’s motor. A National Instruments 6211 data acquisition
hardware mounted on the side of the frame translates the signals between the
computer, load cell, and actuator.
Figure 5-14. Portable Mechanical Uplift Apparatus components.
In Situ ASTM D6381 Specimen Preparation and Test Procedure
Specimens were randomly selected throughout the roof area, and then checked
by hand for adhesion prior to their preparation for uplift testing. For Procedure A
118
specimens, two 114 mm (4.5 in) upslope cuts were made in the upper shingle strip
starting from the leading edge of the shingle’s strip. Additional upslope cuts were made
in the adjacent shingle material to prevent interference between the test clamp and
external shingles during testing. For Procedure B specimens, two 38 mm (1.5 in)
upslope cuts spaced 95 mm (3.75 in) apart were made in the upper shingle starting
from the leading edge of the shingle’s strip. The top portion of the shingle specimen was
then isolated from the surrounding shingle by a 95 mm (3.75 in) horizontal cut to form a
rectangular piece of top shingle with dimensions of 95 mm (3.75 in) wide by 38 mm (1.5
in) long. An ASTM D6381 (ASTM 2008b) specified aluminum tee-shaped section was
adhered on the top shingle and cured overnight prior to uplift testing.
ASTM D6381 Procedures A and B had similar test procedures. First, the PMUA
was placed over the specimen and positioned to align the arm with leading edge of the
shingle (Procedure A) or the aluminum tee (Procedure B). The load cell reading was
then zeroed to account for the self-weight of the clamp (Procedure A) or hook and
chains (Procedure B). As with the thermal aging experiment, the Procedure A clamp
was affixed to the leading edge of the specimen, while, in Procedure B, one hook was
placed on either side of the aluminum tee. The mechanical uplift test was then initiated
using the ASTM D6381 (ASTM 2008b) specified 2.11 mm/s (0.083 in/s) constant
displacement rate, and uplift ceased once the specimen lost adhesion. Personnel then
visually inspected and recorded the failure mode of the test specimen along with the
maximum force produced during the test.
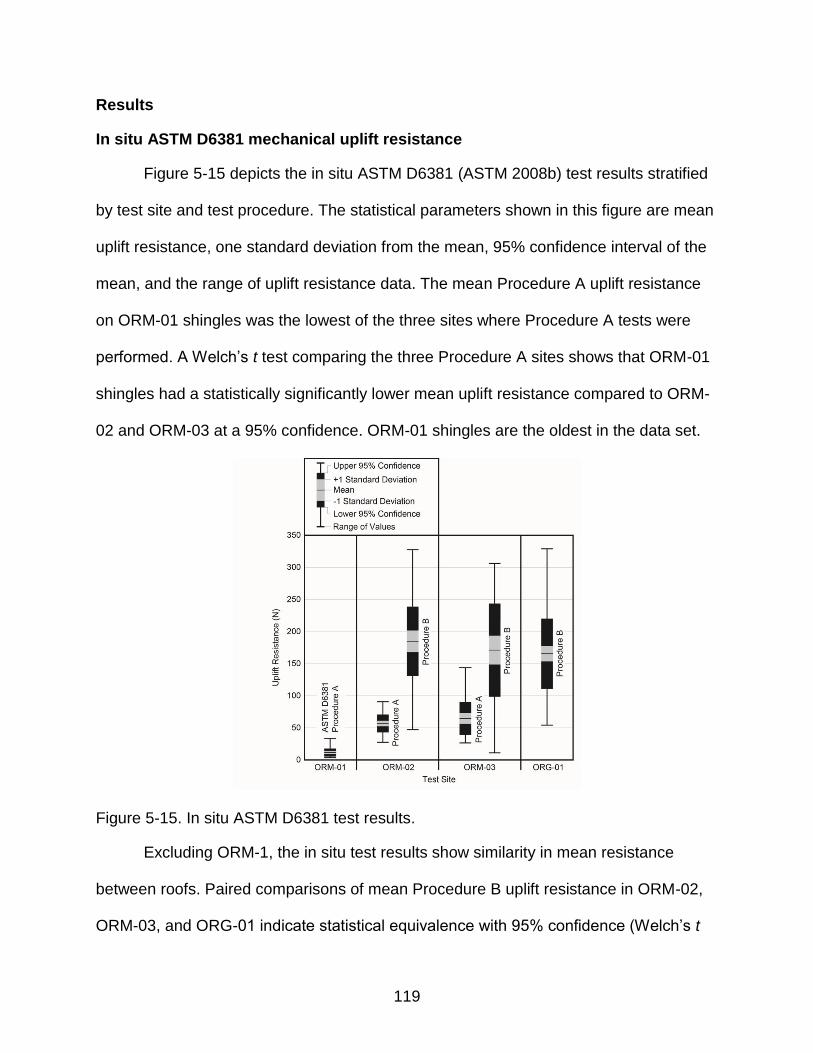
119
Results
In situ ASTM D6381 mechanical uplift resistance
Figure 5-15 depicts the in situ ASTM D6381 (ASTM 2008b) test results stratified
by test site and test procedure. The statistical parameters shown in this figure are mean
uplift resistance, one standard deviation from the mean, 95% confidence interval of the
mean, and the range of uplift resistance data. The mean Procedure A uplift resistance
on ORM-01 shingles was the lowest of the three sites where Procedure A tests were
performed. A Welch’s t test comparing the three Procedure A sites shows that ORM-01
shingles had a statistically significantly lower mean uplift resistance compared to ORM-
02 and ORM-03 at a 95% confidence. ORM-01 shingles are the oldest in the data set.
Figure 5-15. In situ ASTM D6381 test results.
Excluding ORM-1, the in situ test results show similarity in mean resistance
between roofs. Paired comparisons of mean Procedure B uplift resistance in ORM-02,
ORM-03, and ORG-01 indicate statistical equivalence with 95% confidence (Welch’s t
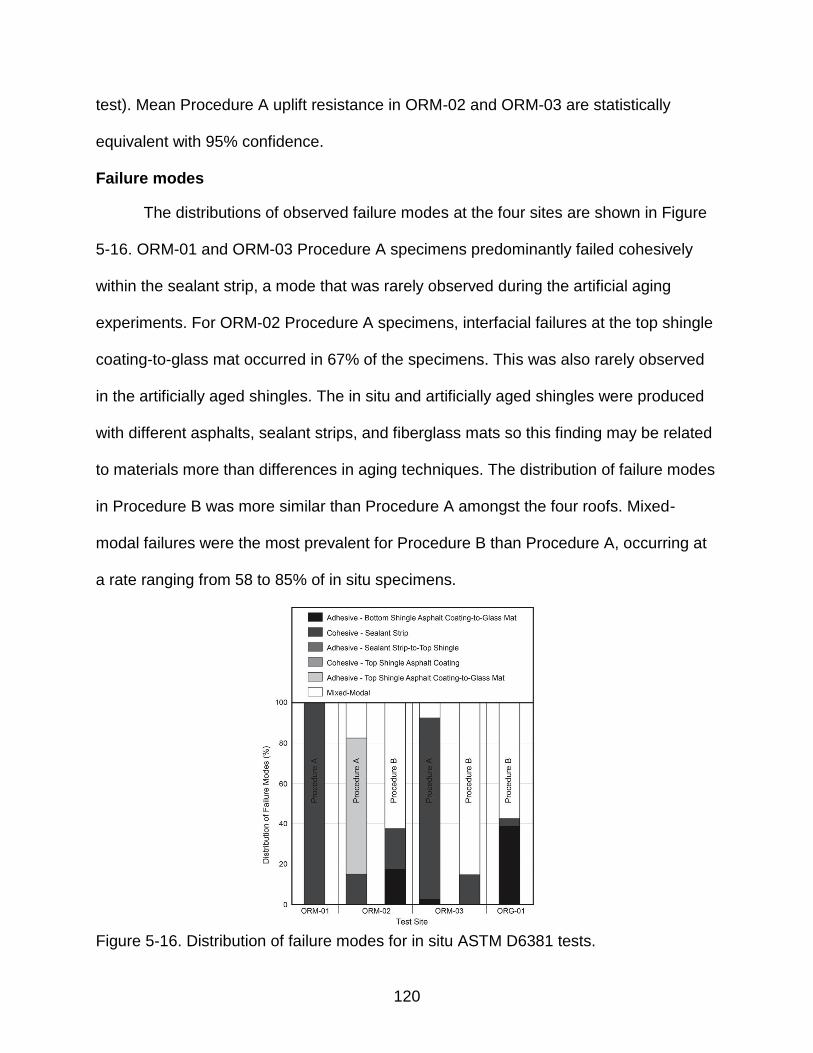
120
test). Mean Procedure A uplift resistance in ORM-02 and ORM-03 are statistically
equivalent with 95% confidence.
Failure modes
The distributions of observed failure modes at the four sites are shown in Figure
5-16. ORM-01 and ORM-03 Procedure A specimens predominantly failed cohesively
within the sealant strip, a mode that was rarely observed during the artificial aging
experiments. For ORM-02 Procedure A specimens, interfacial failures at the top shingle
coating-to-glass mat occurred in 67% of the specimens. This was also rarely observed
in the artificially aged shingles. The in situ and artificially aged shingles were produced
with different asphalts, sealant strips, and fiberglass mats so this finding may be related
to materials more than differences in aging techniques. The distribution of failure modes
in Procedure B was more similar than Procedure A amongst the four roofs. Mixed-
modal failures were the most prevalent for Procedure B than Procedure A, occurring at
a rate ranging from 58 to 85% of in situ specimens.
Figure 5-16. Distribution of failure modes for in situ ASTM D6381 tests.
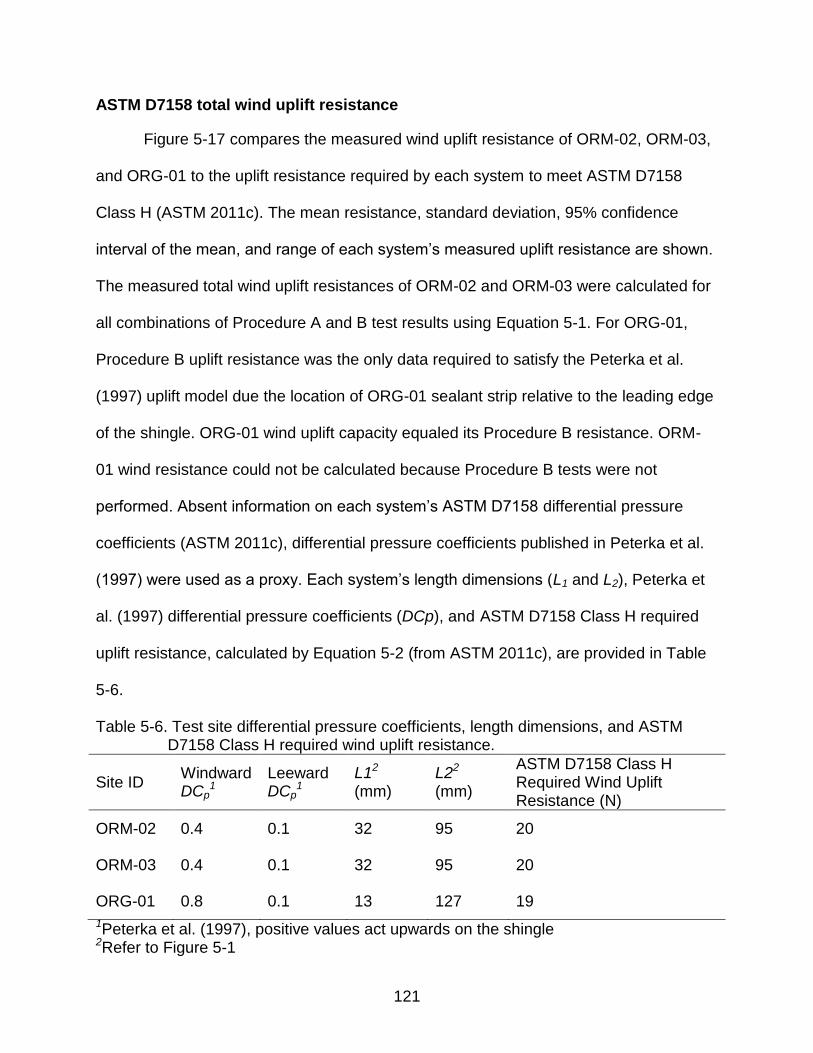
121
ASTM D7158 total wind uplift resistance
Figure 5-17 compares the measured wind uplift resistance of ORM-02, ORM-03,
and ORG-01 to the uplift resistance required by each system to meet ASTM D7158
Class H (ASTM 2011c). The mean resistance, standard deviation, 95% confidence
interval of the mean, and range of each system’s measured uplift resistance are shown.
The measured total wind uplift resistances of ORM-02 and ORM-03 were calculated for
all combinations of Procedure A and B test results using Equation 5-1. For ORG-01,
Procedure B uplift resistance was the only data required to satisfy the Peterka et al.
(1997) uplift model due the location of ORG-01 sealant strip relative to the leading edge
of the shingle. ORG-01 wind uplift capacity equaled its Procedure B resistance. ORM-
01 wind resistance could not be calculated because Procedure B tests were not
performed. Absent information on each system’s ASTM D7158 differential pressure
coefficients (ASTM 2011c), differential pressure coefficients published in Peterka et al.
(1997) were used as a proxy. Each system’s length dimensions (L1 and L2), Peterka et
al. (1997) differential pressure coefficients (DCp), and ASTM D7158 Class H required
uplift resistance, calculated by Equation 5-2 (from ASTM 2011c), are provided in Table
5-6.
Table 5-6. Test site differential pressure coefficients, length dimensions, and ASTM D7158 Class H required wind uplift resistance.
Site ID Windward DCp
1 Leeward DCp
1 L12 (mm)
L22
(mm)
ASTM D7158 Class H Required Wind Uplift Resistance (N)
ORM-02 0.4 0.1 32 95 20
ORM-03 0.4 0.1 32 95 20
ORG-01 0.8 0.1 13 127 19
1Peterka et al. (1997), positive values act upwards on the shingle 2Refer to Figure 5-1
122
ORM-03 contained the only combination of Procedure A and B resistance (18 N)
below ASTM D7158 Class H resistance (20 N) (Figure 5-16). All other combinations of
Procedure A and B uplift resistance on ORM-03 and all combinations on ORM-02 and
ORG-01 would be expected to resist an ASCE 7-02 (ASCE 2002) design 3 s wind
speed of 150 mph in Open Country exposure. The measured mean wind resistances of
ORM-02 and ORM-03 were six times greater than ASTM D7158 Class H required
(ASTM 2011c), while ORG-01’s mean measured resistance was eight times greater
than ASTM D7158 Class H required (ASTM 2011c).
Figure 5-17. Wind resistance of naturally aged shingles vs. ASTM D7158 Class H
required resistance.
Discussion
The dataset of naturally aged homes represents a small sampling of the
residential building stock, however these results strongly suggest that individual
shingles exposed outdoors for more than nine years have sufficient residual capacity to
resist the highest design wind loads. This finding only applies to shingles with fully
123
adhered sealant strips, however. Another experiment conducted on these roofs reveals
a significant problem with the consistency of sealant strip adhesion along the complete
length of the shingle’s leading edge.
The four roofs were surveyed by hand for the presence of adhesion on all
shingles installed in the field, hip, and ridge locations of the roofs. Only those with full
adhesion were mechanically tested for uplift capacity. On three of the four homes,
shingles were found without sealant strip adhesion along a partial length of their leading
edge (i.e., partially unsealed). The consistent location of unseal and failure mode where
unsealed indicate a systematic failure of the sealant strip. Partially unsealed shingles
were found on 7.7% of ORM-01’s shingles, 5.1% of ORM-03’s shingles, and 6.3% of
ORG-01’s shingles. The full dataset on this unsealed shingle study (Chapter 4)
consisted of 27 inspected roofs in Florida, ranging in age from two months to over
twenty years. Many had a significant portion of their shingles partially unsealed. The
most extreme case was a roof with over 86% of its shingles lacking full adhesion.
Significantly, partially unsealed shingles were only found on Florida roofs with greater
than six years of natural exposure, aligning with the performance breakpoint reported in
Liu et al. (2010).
Discussion of Combined Results
The experimental objective was to identify whether and to what extent aging
reduces the wind uplift capacity of fully sealed asphalt shingles. For the first
experimental investigation, new ASTM D7158 Class H (ASTM 2011c) three-tab shingles
from three different manufacturers were artificially aged by two methods, and wind uplift
resistance was quantified in a sample of the population at pre-determined exposure
times. For the second experimental investigation, wind uplift resistance was measured
124
in situ on four shingled roofs in Central Florida exposed to natural aging for more than
nine years. Significant finding are detailed below.
1. Weather-induced reductions in uplift resistance cannot be ruled out as a potential contributor in wind damage to shingle roofing, however this study found high uplift resistance in naturally and artificially aged shingles relative to design-level load. Reduced uplift resistance caused by aging appears to be a secondary contributor. The major conclusion is that shingles with fully adhered sealant strips provide excellent long-term resistance to uplift loads.
2. In its current form, ASTM D7158’s scope (ASTM 2011c) is limited to the resistance of new (non-aged) shingle products to design-level wind force. Given the results of the first experiment, the resistance measured on a new shingle should not be extrapolated to resistance once in-service and weathered. Additional exposure times are recommended beyond the 16 hr condition time currently specified in ASTM D7158 to improve the predictive capabilities of ASTM D7158 (ASTM 2011c).
Chapter 4 of this dissertation presents a more likely primary contributor to shingle
roof wind damage, i.e. the existence of partially unsealed shingles prior to wind. The
study demonstrated that (a) partially unsealed shingles have a significant reduction in
uplift capacity, and (b) their observed occurrence is a significant percentage of the total
roof cover that becomes more prominent with age.
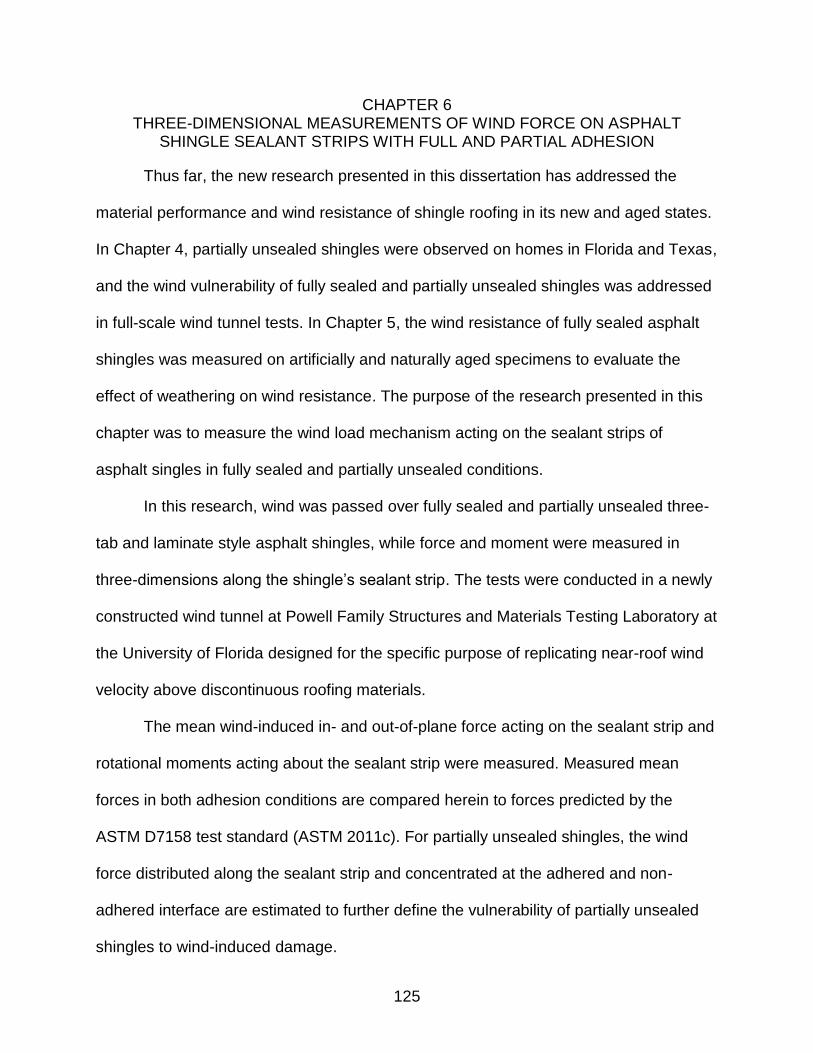
125
CHAPTER 6 THREE-DIMENSIONAL MEASUREMENTS OF WIND FORCE ON ASPHALT
SHINGLE SEALANT STRIPS WITH FULL AND PARTIAL ADHESION
Thus far, the new research presented in this dissertation has addressed the
material performance and wind resistance of shingle roofing in its new and aged states.
In Chapter 4, partially unsealed shingles were observed on homes in Florida and Texas,
and the wind vulnerability of fully sealed and partially unsealed shingles was addressed
in full-scale wind tunnel tests. In Chapter 5, the wind resistance of fully sealed asphalt
shingles was measured on artificially and naturally aged specimens to evaluate the
effect of weathering on wind resistance. The purpose of the research presented in this
chapter was to measure the wind load mechanism acting on the sealant strips of
asphalt singles in fully sealed and partially unsealed conditions.
In this research, wind was passed over fully sealed and partially unsealed three-
tab and laminate style asphalt shingles, while force and moment were measured in
three-dimensions along the shingle’s sealant strip. The tests were conducted in a newly
constructed wind tunnel at Powell Family Structures and Materials Testing Laboratory at
the University of Florida designed for the specific purpose of replicating near-roof wind
velocity above discontinuous roofing materials.
The mean wind-induced in- and out-of-plane force acting on the sealant strip and
rotational moments acting about the sealant strip were measured. Measured mean
forces in both adhesion conditions are compared herein to forces predicted by the
ASTM D7158 test standard (ASTM 2011c). For partially unsealed shingles, the wind
force distributed along the sealant strip and concentrated at the adhered and non-
adhered interface are estimated to further define the vulnerability of partially unsealed
shingles to wind-induced damage.
126
Knowledge Gaps
Wind Load Model and Load Path
The distribution of wind-induced uplift pressure and resultant force on an asphalt
shingle – as described by the Peterka et al. (1997) wind load model – is shown in cross-
section in Figure 6-1. Pressures PF and PB arise from the interaction of near-roof wind
on the vertical projection of the shingle’s leading edge. Wind flow normal to the shingle’s
leading edge is the only direction considered in the model. Net uplift pressure is
uniformly applied over the width of the shingle (cross-flow) and on the flow-wise lengths
L1 and L2 with magnitude PF and PB. Magnitude and location of the net force vectors (FF
and FB in Figure 6-1) are, therefore, a function of L1 and L2, the width of interest, and the
applied pressure (PF and PB).
Figure 6-1. Wind pressures on shingle roofing.
One gap in knowledge in the Peterka et al. (1997) model is the magnitude of in-
and out-of-plane wind force acting on the sealant strip. Measurements of wind-induced
force have, to the author’s knowledge, never been captured on the sealant strip. Due to
the positioning of the sealant strip relative to the pressure distribution, the model
assumes wind uplift pressure is completely transferred through the sealant strip and into
the downslope fasteners.
127
For adhesives such as the sealant strip, resistance varies as a function of applied
force (Gay and Leiber 1999), thus, an accurate representation of force acting on the
strip is require for accurate prediction of its resistance. This was exemplified in Chapter
5 where peel strength of the sealant strip was approximately one-half its tensile
strength. Shiao et al. (2003a) found similar results using the same ASTM D6381 test
method (ASTM 2008b) on non-aged three-tab and laminate shingles.
Equations 6-1 and 6-2 are used within ASTM D7158 (ASTM 2011c) to calculate
the wind resistance of an asphalt shingle product (RT). The shingle’s mean resistance to
ASTM D6381 Procedures A (peel - RA) and B (tensile – RB) mechanical uplift testing are
weighted by the product’s windward (FF) and leeward (FB) forces at design-level wind
conditions. The forces are a calculated using the differential pressure coefficients
measured on the product during an ASTM D7158 (ASTM 2011c) wind test and the
exposure lengths L1 and L2 (see Figure 6-1). If FF > FB, Equation 6-1 is used, while FF
< FB requires Equation 6-2.
[
] [
] (6-1)
[
] [
] (6-2)
Equations 6-1 and 6-2 provide an estimate of the amount of peel and tensile
force exerted on the sealant strip in design-level wind velocity. The corresponding peel
(RA) and tensile (RB) uplift resistance are each weighted by the relative contribution of
FF and FB acting on the sealant strip then summed to form the overall wind resistance of
sealant strip. To understand the equations meaning, one could say that FF is the only
force that exists. Thus, using Equation 6-1, peel resistance (RA) is the only contributing
uplift resistance in the total uplift resistance of the shingle (RT). The same is true if only
128
leeward force (FB) is exerted on the shingle (Equation 6-2). From Peterka et al. (1997),
standard three-tab and laminate shingles have a mixture of windward and leeward wind
forces so total uplift resistance is most often a mixture of peel and tensile resistance.
The measurements of in- and out-of-plane wind force on the shingle’s sealant
strip made in this research expand the knowledge base with respect to the reaction
forces developed on the primary wind load path of asphalt shingles. Ultimately, a better
understanding of reaction forces will improve the predictive capabilities of standard test
methods either through new measurement techniques or modifications to existing
design equations.
Partially Unsealed Shingles
The second knowledge gap relates to the wind-induced force on partially
unsealed shingles. Chapter 3 identified partially unsealed shingles as a potentially
significant contributor to wind damage in shingle roofing. One significant finding from the
research was the performance gap between fully and partially unsealed shingles
subjected to equivalent wind speeds. From this work, two failure mechanisms
contributing to the vulnerability of partially unsealed shingles to wind-induced damage
are proposed, both caused by the lifting of the unsealed portion of the shingle. First, an
increased distributed load on the adhered length of the sealant strip arises from
increased bottom surface wind pressurization. Second, a concentrated force is applied
at the interface of the adhered and non-adhered portions of the sealant strip as wind
force is exerted on the lifted section of shingle, acting as a peel force on the sealant
strip at the interface. The research presented in the chapter places actual values related
to the two proposed mechanisms. The research addresses vulnerability by comparing
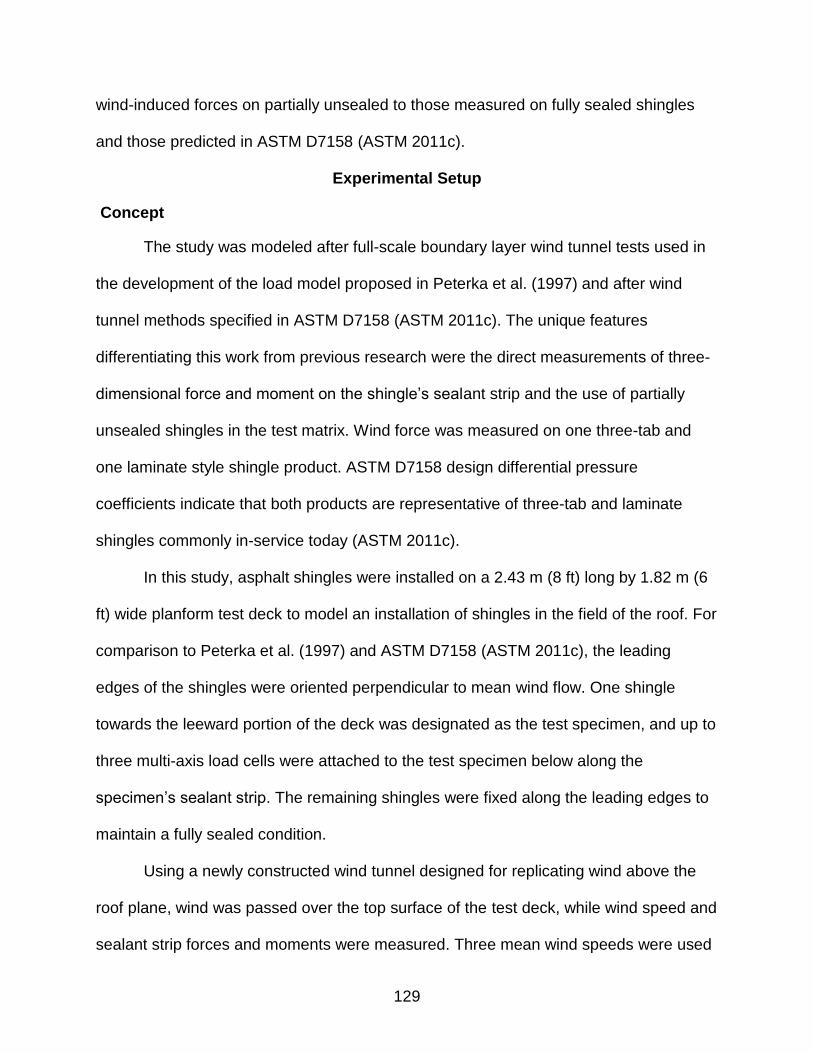
129
wind-induced forces on partially unsealed to those measured on fully sealed shingles
and those predicted in ASTM D7158 (ASTM 2011c).
Experimental Setup
Concept
The study was modeled after full-scale boundary layer wind tunnel tests used in
the development of the load model proposed in Peterka et al. (1997) and after wind
tunnel methods specified in ASTM D7158 (ASTM 2011c). The unique features
differentiating this work from previous research were the direct measurements of three-
dimensional force and moment on the shingle’s sealant strip and the use of partially
unsealed shingles in the test matrix. Wind force was measured on one three-tab and
one laminate style shingle product. ASTM D7158 design differential pressure
coefficients indicate that both products are representative of three-tab and laminate
shingles commonly in-service today (ASTM 2011c).
In this study, asphalt shingles were installed on a 2.43 m (8 ft) long by 1.82 m (6
ft) wide planform test deck to model an installation of shingles in the field of the roof. For
comparison to Peterka et al. (1997) and ASTM D7158 (ASTM 2011c), the leading
edges of the shingles were oriented perpendicular to mean wind flow. One shingle
towards the leeward portion of the deck was designated as the test specimen, and up to
three multi-axis load cells were attached to the test specimen below along the
specimen’s sealant strip. The remaining shingles were fixed along the leading edges to
maintain a fully sealed condition.
Using a newly constructed wind tunnel designed for replicating wind above the
roof plane, wind was passed over the top surface of the test deck, while wind speed and
sealant strip forces and moments were measured. Three mean wind speeds were used
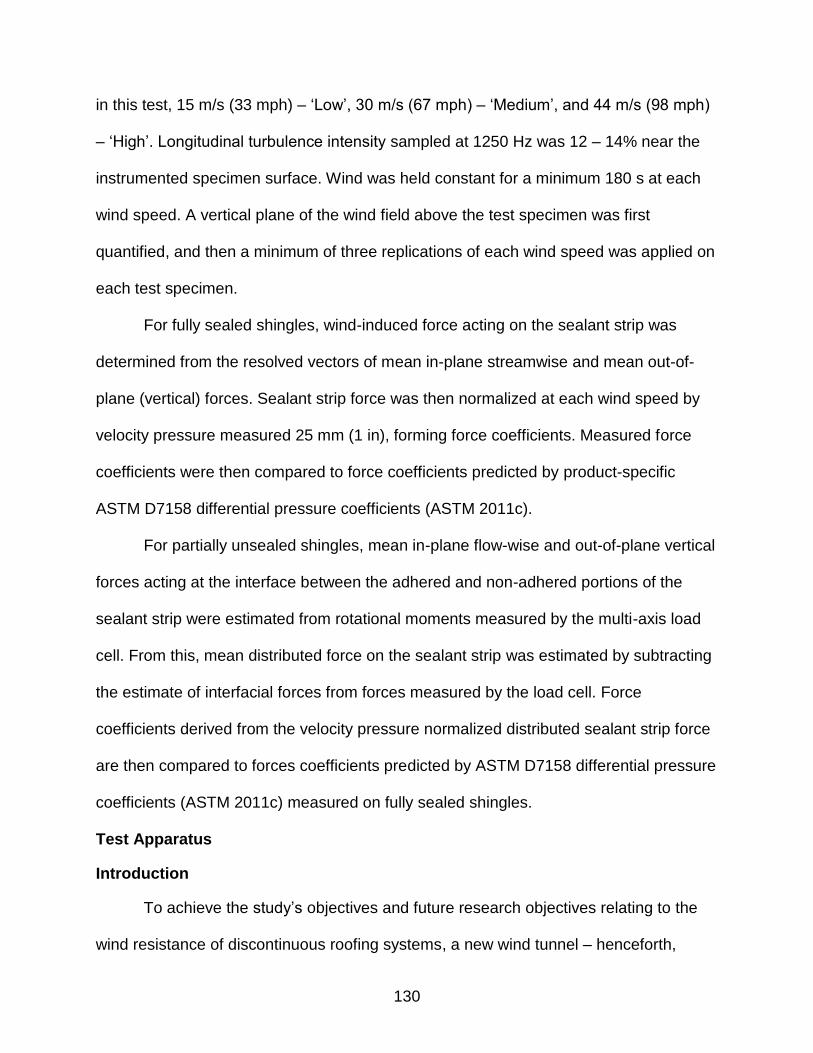
130
in this test, 15 m/s (33 mph) – ‘Low’, 30 m/s (67 mph) – ‘Medium’, and 44 m/s (98 mph)
– ‘High’. Longitudinal turbulence intensity sampled at 1250 Hz was 12 – 14% near the
instrumented specimen surface. Wind was held constant for a minimum 180 s at each
wind speed. A vertical plane of the wind field above the test specimen was first
quantified, and then a minimum of three replications of each wind speed was applied on
each test specimen.
For fully sealed shingles, wind-induced force acting on the sealant strip was
determined from the resolved vectors of mean in-plane streamwise and mean out-of-
plane (vertical) forces. Sealant strip force was then normalized at each wind speed by
velocity pressure measured 25 mm (1 in), forming force coefficients. Measured force
coefficients were then compared to force coefficients predicted by product-specific
ASTM D7158 differential pressure coefficients (ASTM 2011c).
For partially unsealed shingles, mean in-plane flow-wise and out-of-plane vertical
forces acting at the interface between the adhered and non-adhered portions of the
sealant strip were estimated from rotational moments measured by the multi-axis load
cell. From this, mean distributed force on the sealant strip was estimated by subtracting
the estimate of interfacial forces from forces measured by the load cell. Force
coefficients derived from the velocity pressure normalized distributed sealant strip force
are then compared to forces coefficients predicted by ASTM D7158 differential pressure
coefficients (ASTM 2011c) measured on fully sealed shingles.
Test Apparatus
Introduction
To achieve the study’s objectives and future research objectives relating to the
wind resistance of discontinuous roofing systems, a new wind tunnel – henceforth,
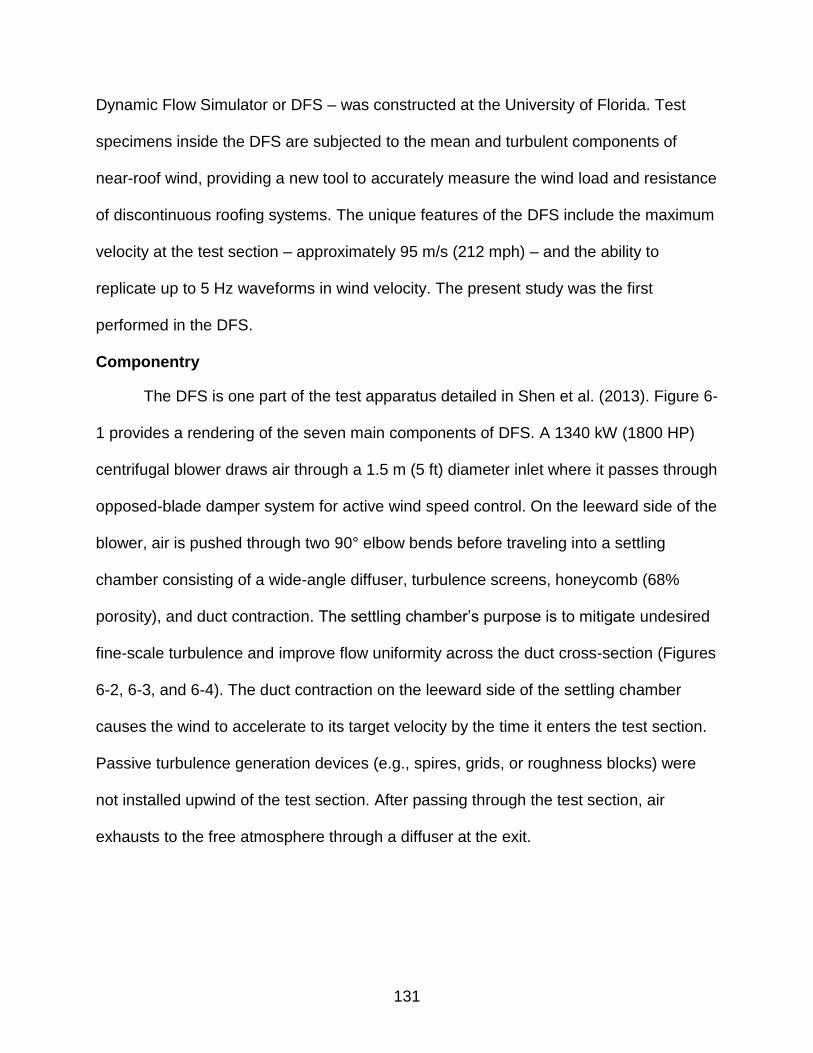
131
Dynamic Flow Simulator or DFS – was constructed at the University of Florida. Test
specimens inside the DFS are subjected to the mean and turbulent components of
near-roof wind, providing a new tool to accurately measure the wind load and resistance
of discontinuous roofing systems. The unique features of the DFS include the maximum
velocity at the test section – approximately 95 m/s (212 mph) – and the ability to
replicate up to 5 Hz waveforms in wind velocity. The present study was the first
performed in the DFS.
Componentry
The DFS is one part of the test apparatus detailed in Shen et al. (2013). Figure 6-
1 provides a rendering of the seven main components of DFS. A 1340 kW (1800 HP)
centrifugal blower draws air through a 1.5 m (5 ft) diameter inlet where it passes through
opposed-blade damper system for active wind speed control. On the leeward side of the
blower, air is pushed through two 90° elbow bends before traveling into a settling
chamber consisting of a wide-angle diffuser, turbulence screens, honeycomb (68%
porosity), and duct contraction. The settling chamber’s purpose is to mitigate undesired
fine-scale turbulence and improve flow uniformity across the duct cross-section (Figures
6-2, 6-3, and 6-4). The duct contraction on the leeward side of the settling chamber
causes the wind to accelerate to its target velocity by the time it enters the test section.
Passive turbulence generation devices (e.g., spires, grids, or roughness blocks) were
not installed upwind of the test section. After passing through the test section, air
exhausts to the free atmosphere through a diffuser at the exit.
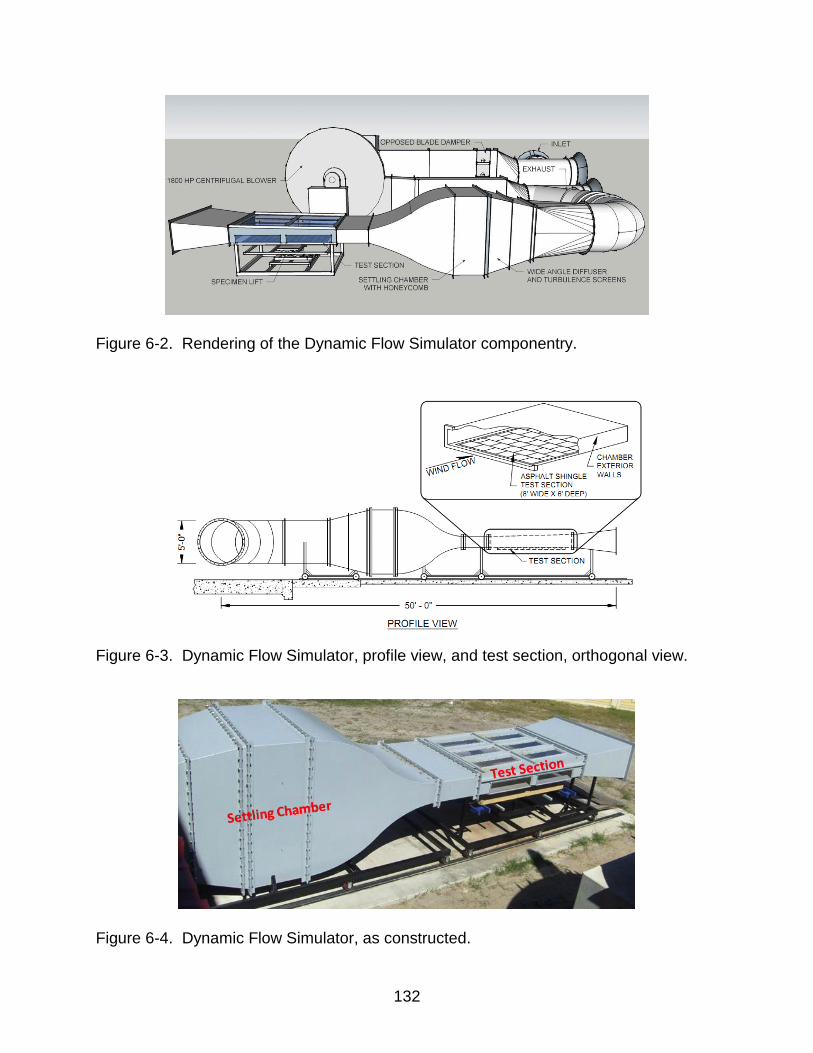
132
Figure 6-2. Rendering of the Dynamic Flow Simulator componentry.
Figure 6-3. Dynamic Flow Simulator, profile view, and test section, orthogonal view.
Figure 6-4. Dynamic Flow Simulator, as constructed.
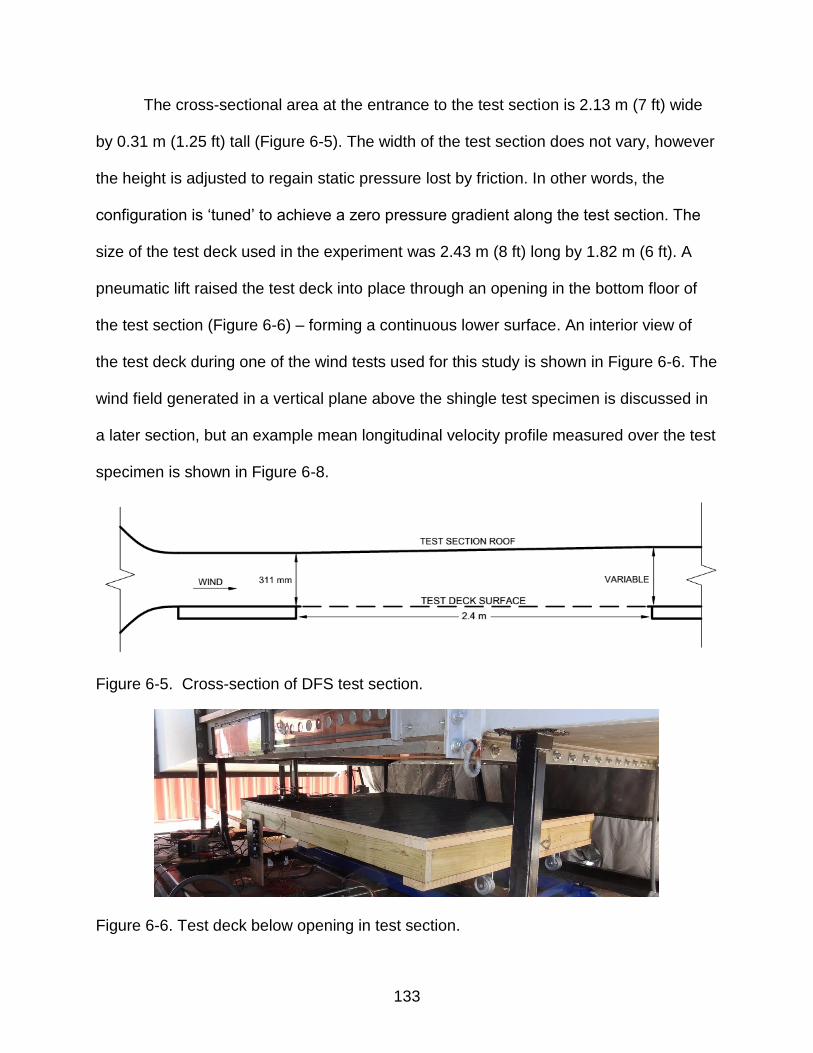
133
The cross-sectional area at the entrance to the test section is 2.13 m (7 ft) wide
by 0.31 m (1.25 ft) tall (Figure 6-5). The width of the test section does not vary, however
the height is adjusted to regain static pressure lost by friction. In other words, the
configuration is ‘tuned’ to achieve a zero pressure gradient along the test section. The
size of the test deck used in the experiment was 2.43 m (8 ft) long by 1.82 m (6 ft). A
pneumatic lift raised the test deck into place through an opening in the bottom floor of
the test section (Figure 6-6) – forming a continuous lower surface. An interior view of
the test deck during one of the wind tests used for this study is shown in Figure 6-6. The
wind field generated in a vertical plane above the shingle test specimen is discussed in
a later section, but an example mean longitudinal velocity profile measured over the test
specimen is shown in Figure 6-8.
Figure 6-5. Cross-section of DFS test section.
Figure 6-6. Test deck below opening in test section.
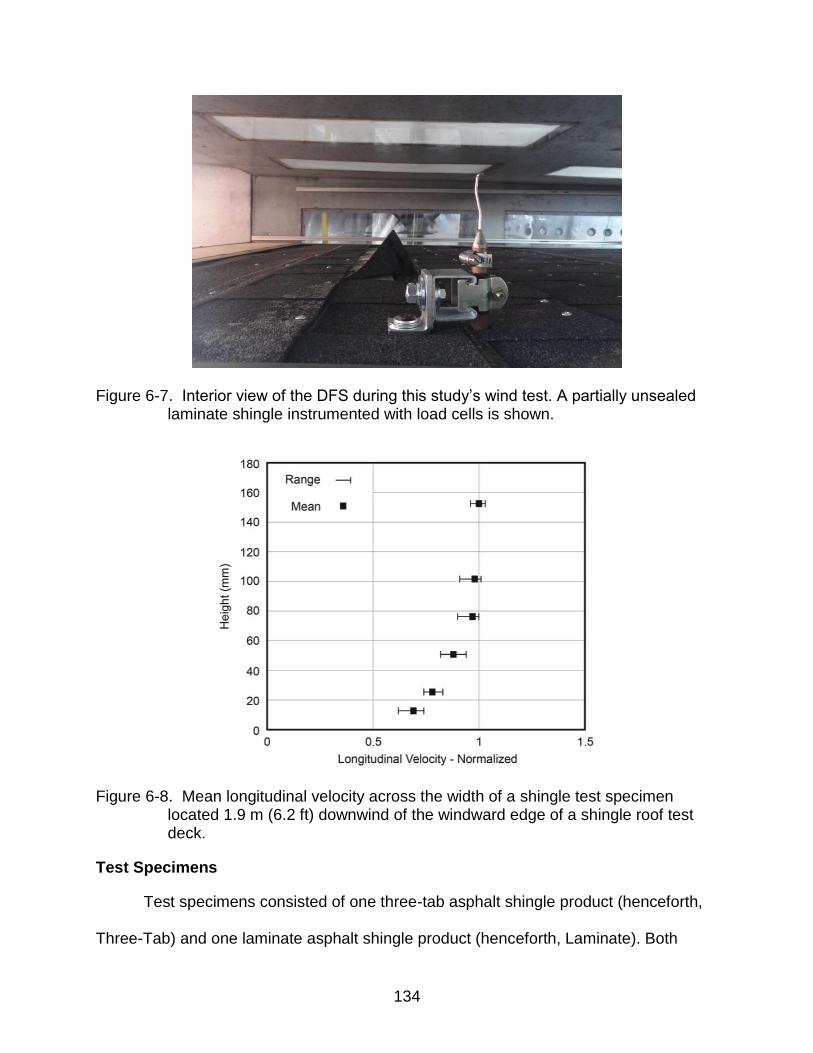
134
Figure 6-7. Interior view of the DFS during this study’s wind test. A partially unsealed laminate shingle instrumented with load cells is shown.
Figure 6-8. Mean longitudinal velocity across the width of a shingle test specimen located 1.9 m (6.2 ft) downwind of the windward edge of a shingle roof test deck.
Test Specimens
Test specimens consisted of one three-tab asphalt shingle product (henceforth,
Three-Tab) and one laminate asphalt shingle product (henceforth, Laminate). Both
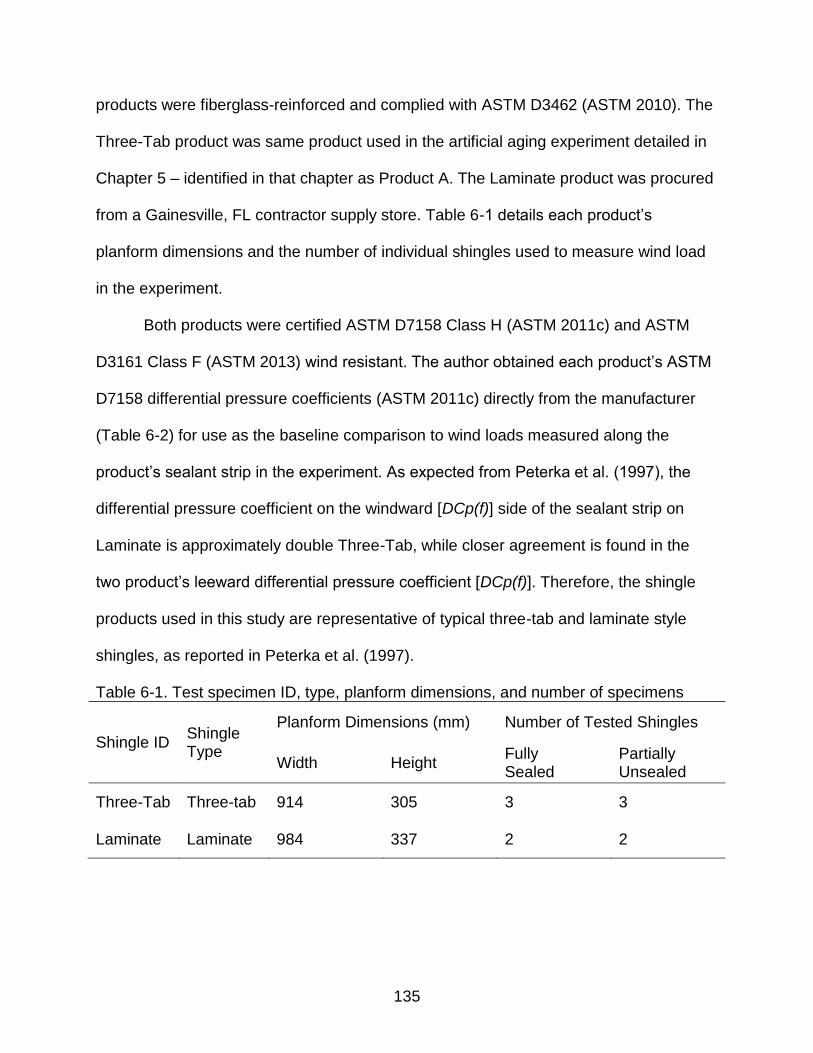
135
products were fiberglass-reinforced and complied with ASTM D3462 (ASTM 2010). The
Three-Tab product was same product used in the artificial aging experiment detailed in
Chapter 5 – identified in that chapter as Product A. The Laminate product was procured
from a Gainesville, FL contractor supply store. Table 6-1 details each product’s
planform dimensions and the number of individual shingles used to measure wind load
in the experiment.
Both products were certified ASTM D7158 Class H (ASTM 2011c) and ASTM
D3161 Class F (ASTM 2013) wind resistant. The author obtained each product’s ASTM
D7158 differential pressure coefficients (ASTM 2011c) directly from the manufacturer
(Table 6-2) for use as the baseline comparison to wind loads measured along the
product’s sealant strip in the experiment. As expected from Peterka et al. (1997), the
differential pressure coefficient on the windward [DCp(f)] side of the sealant strip on
Laminate is approximately double Three-Tab, while closer agreement is found in the
two product’s leeward differential pressure coefficient [DCp(f)]. Therefore, the shingle
products used in this study are representative of typical three-tab and laminate style
shingles, as reported in Peterka et al. (1997).
Table 6-1. Test specimen ID, type, planform dimensions, and number of specimens
Shingle ID Shingle Type
Planform Dimensions (mm) Number of Tested Shingles
Width Height Fully Sealed
Partially Unsealed
Three-Tab Three-tab 914 305 3 3
Laminate Laminate 984 337 2 2
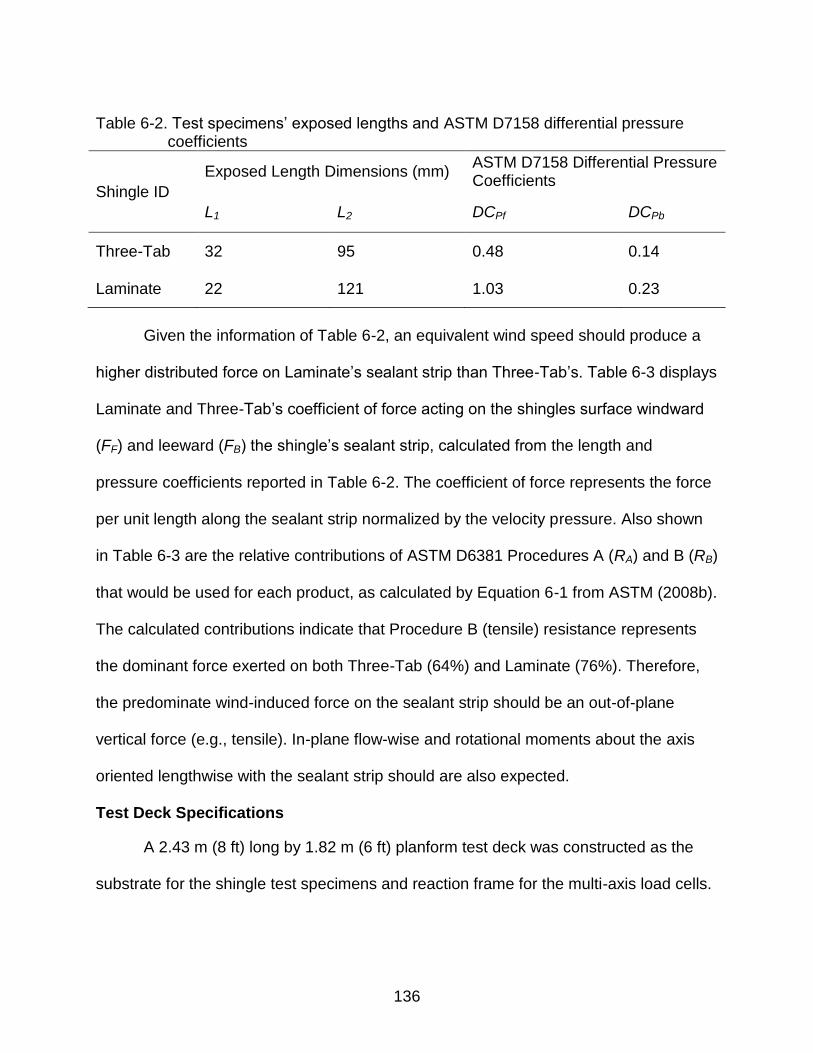
136
Table 6-2. Test specimens’ exposed lengths and ASTM D7158 differential pressure
coefficients
Shingle ID
Exposed Length Dimensions (mm) ASTM D7158 Differential Pressure Coefficients
L1 L2 DCPf DCPb
Three-Tab 32 95 0.48 0.14
Laminate 22 121 1.03 0.23
Given the information of Table 6-2, an equivalent wind speed should produce a
higher distributed force on Laminate’s sealant strip than Three-Tab’s. Table 6-3 displays
Laminate and Three-Tab’s coefficient of force acting on the shingles surface windward
(FF) and leeward (FB) the shingle’s sealant strip, calculated from the length and
pressure coefficients reported in Table 6-2. The coefficient of force represents the force
per unit length along the sealant strip normalized by the velocity pressure. Also shown
in Table 6-3 are the relative contributions of ASTM D6381 Procedures A (RA) and B (RB)
that would be used for each product, as calculated by Equation 6-1 from ASTM (2008b).
The calculated contributions indicate that Procedure B (tensile) resistance represents
the dominant force exerted on both Three-Tab (64%) and Laminate (76%). Therefore,
the predominate wind-induced force on the sealant strip should be an out-of-plane
vertical force (e.g., tensile). In-plane flow-wise and rotational moments about the axis
oriented lengthwise with the sealant strip should are also expected.
Test Deck Specifications
A 2.43 m (8 ft) long by 1.82 m (6 ft) planform test deck was constructed as the
substrate for the shingle test specimens and reaction frame for the multi-axis load cells.
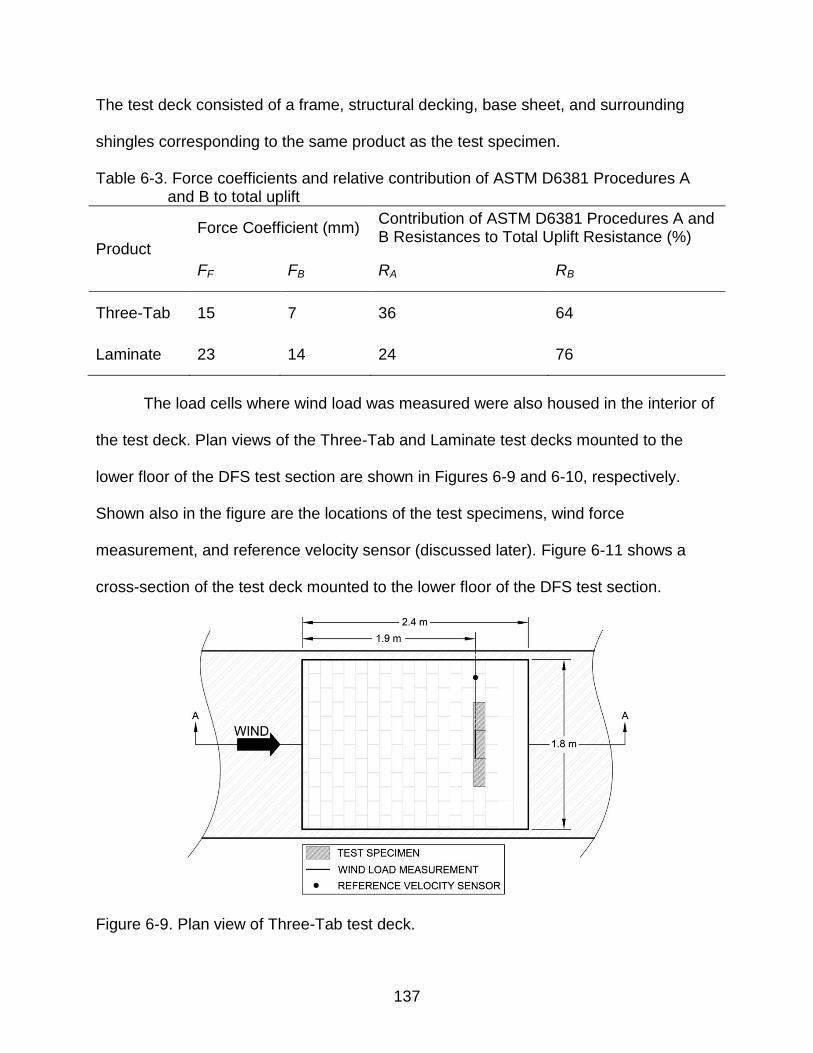
137
The test deck consisted of a frame, structural decking, base sheet, and surrounding
shingles corresponding to the same product as the test specimen.
Table 6-3. Force coefficients and relative contribution of ASTM D6381 Procedures A and B to total uplift
Product
Force Coefficient (mm) Contribution of ASTM D6381 Procedures A and B Resistances to Total Uplift Resistance (%)
FF FB RA RB
Three-Tab 15 7 36 64
Laminate 23 14 24 76
The load cells where wind load was measured were also housed in the interior of
the test deck. Plan views of the Three-Tab and Laminate test decks mounted to the
lower floor of the DFS test section are shown in Figures 6-9 and 6-10, respectively.
Shown also in the figure are the locations of the test specimens, wind force
measurement, and reference velocity sensor (discussed later). Figure 6-11 shows a
cross-section of the test deck mounted to the lower floor of the DFS test section.
Figure 6-9. Plan view of Three-Tab test deck.
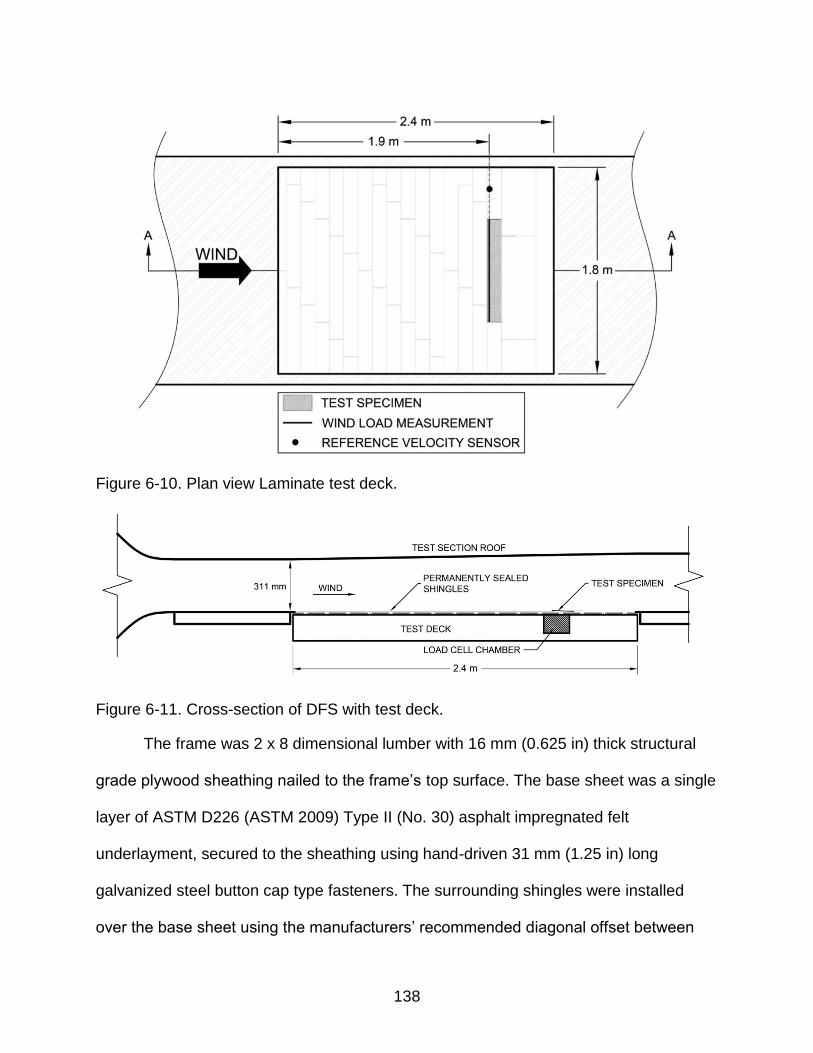
138
Figure 6-10. Plan view Laminate test deck.
Figure 6-11. Cross-section of DFS with test deck.
The frame was 2 x 8 dimensional lumber with 16 mm (0.625 in) thick structural
grade plywood sheathing nailed to the frame’s top surface. The base sheet was a single
layer of ASTM D226 (ASTM 2009) Type II (No. 30) asphalt impregnated felt
underlayment, secured to the sheathing using hand-driven 31 mm (1.25 in) long
galvanized steel button cap type fasteners. The surrounding shingles were installed
over the base sheet using the manufacturers’ recommended diagonal offset between
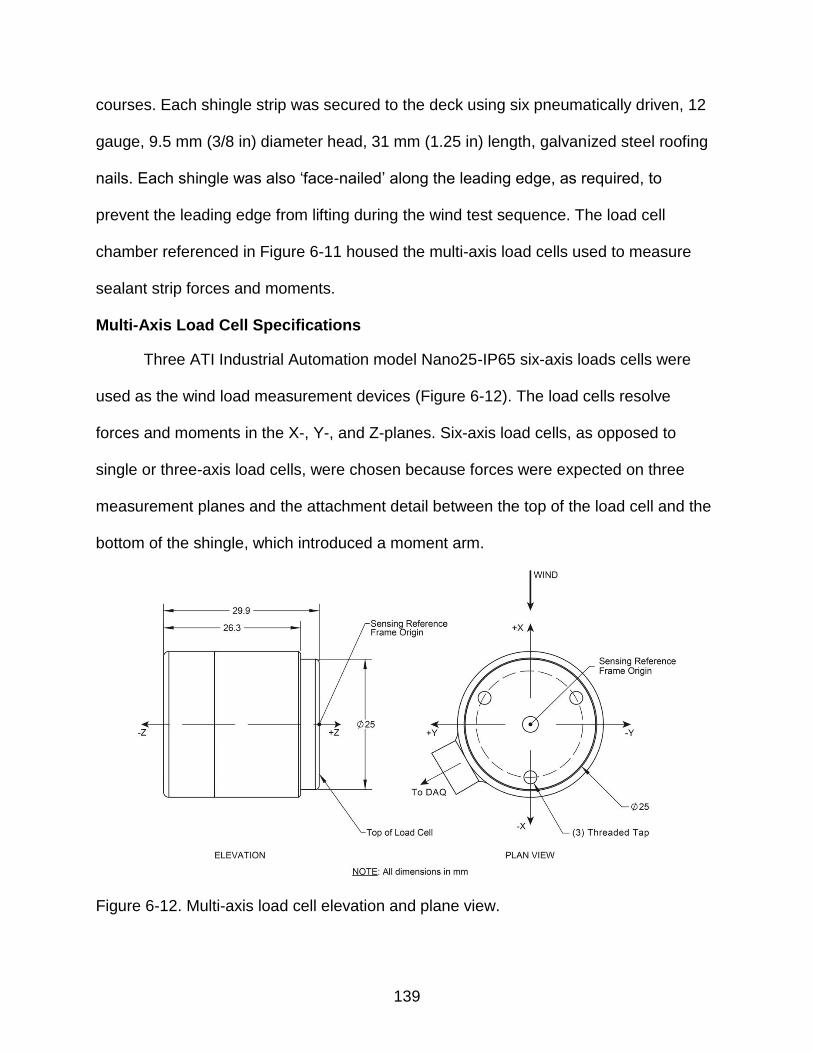
139
courses. Each shingle strip was secured to the deck using six pneumatically driven, 12
gauge, 9.5 mm (3/8 in) diameter head, 31 mm (1.25 in) length, galvanized steel roofing
nails. Each shingle was also ‘face-nailed’ along the leading edge, as required, to
prevent the leading edge from lifting during the wind test sequence. The load cell
chamber referenced in Figure 6-11 housed the multi-axis load cells used to measure
sealant strip forces and moments.
Multi-Axis Load Cell Specifications
Three ATI Industrial Automation model Nano25-IP65 six-axis loads cells were
used as the wind load measurement devices (Figure 6-12). The load cells resolve
forces and moments in the X-, Y-, and Z-planes. Six-axis load cells, as opposed to
single or three-axis load cells, were chosen because forces were expected on three
measurement planes and the attachment detail between the top of the load cell and the
bottom of the shingle, which introduced a moment arm.
Figure 6-12. Multi-axis load cell elevation and plane view.
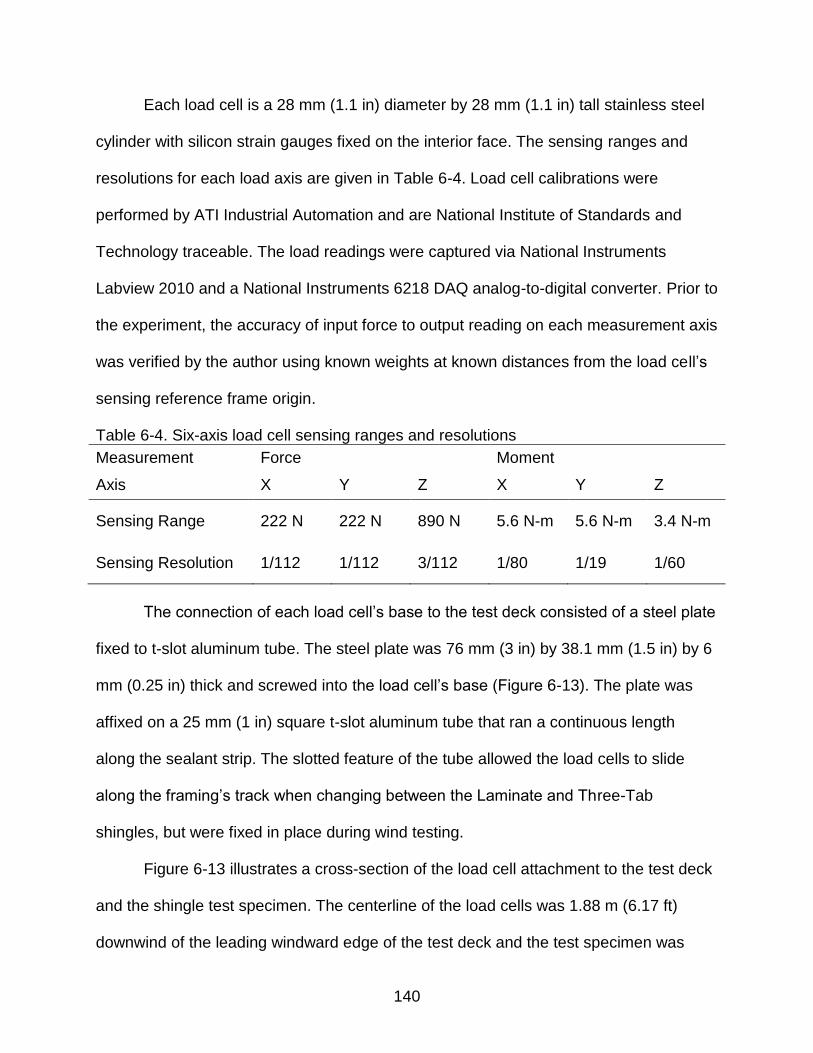
140
Each load cell is a 28 mm (1.1 in) diameter by 28 mm (1.1 in) tall stainless steel
cylinder with silicon strain gauges fixed on the interior face. The sensing ranges and
resolutions for each load axis are given in Table 6-4. Load cell calibrations were
performed by ATI Industrial Automation and are National Institute of Standards and
Technology traceable. The load readings were captured via National Instruments
Labview 2010 and a National Instruments 6218 DAQ analog-to-digital converter. Prior to
the experiment, the accuracy of input force to output reading on each measurement axis
was verified by the author using known weights at known distances from the load cell’s
sensing reference frame origin.
Table 6-4. Six-axis load cell sensing ranges and resolutions
Measurement Force Moment
Axis X Y Z X Y Z
Sensing Range 222 N 222 N 890 N 5.6 N-m 5.6 N-m 3.4 N-m
Sensing Resolution 1/112 1/112 3/112 1/80 1/19 1/60
The connection of each load cell’s base to the test deck consisted of a steel plate
fixed to t-slot aluminum tube. The steel plate was 76 mm (3 in) by 38.1 mm (1.5 in) by 6
mm (0.25 in) thick and screwed into the load cell’s base (Figure 6-13). The plate was
affixed on a 25 mm (1 in) square t-slot aluminum tube that ran a continuous length
along the sealant strip. The slotted feature of the tube allowed the load cells to slide
along the framing’s track when changing between the Laminate and Three-Tab
shingles, but were fixed in place during wind testing.
Figure 6-13 illustrates a cross-section of the load cell attachment to the test deck
and the shingle test specimen. The centerline of the load cells was 1.88 m (6.17 ft)
downwind of the leading windward edge of the test deck and the test specimen was
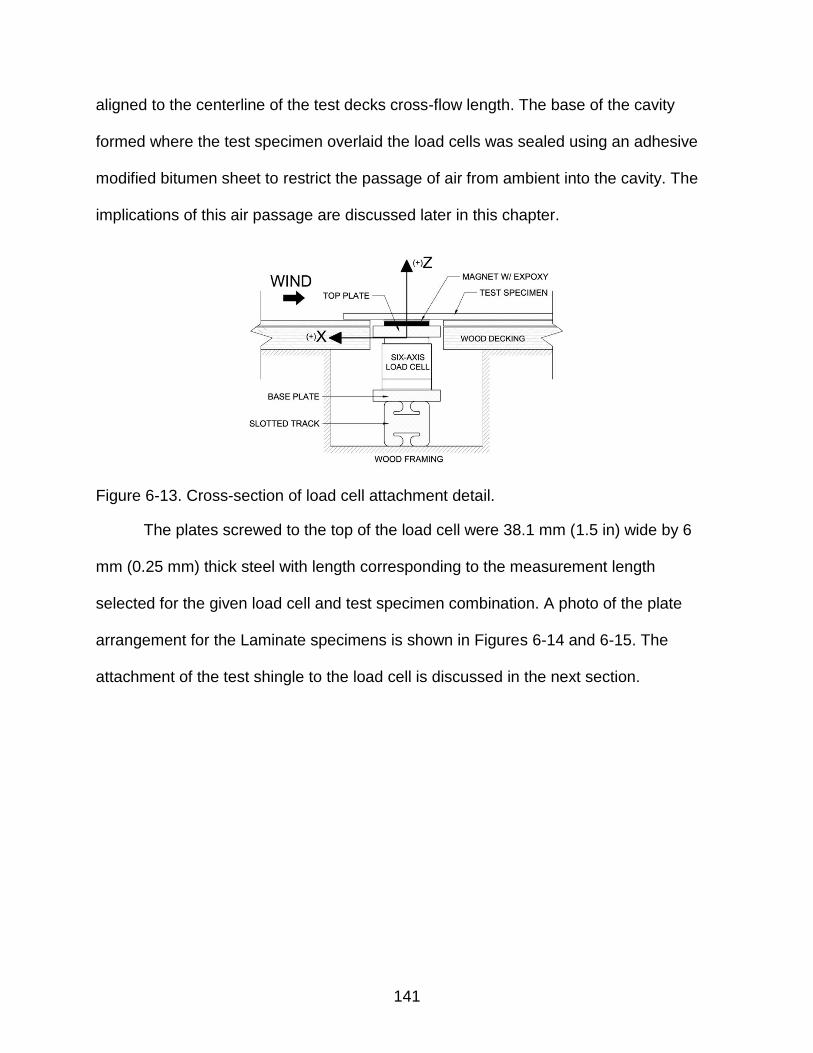
141
aligned to the centerline of the test decks cross-flow length. The base of the cavity
formed where the test specimen overlaid the load cells was sealed using an adhesive
modified bitumen sheet to restrict the passage of air from ambient into the cavity. The
implications of this air passage are discussed later in this chapter.
Figure 6-13. Cross-section of load cell attachment detail.
The plates screwed to the top of the load cell were 38.1 mm (1.5 in) wide by 6
mm (0.25 mm) thick steel with length corresponding to the measurement length
selected for the given load cell and test specimen combination. A photo of the plate
arrangement for the Laminate specimens is shown in Figures 6-14 and 6-15. The
attachment of the test shingle to the load cell is discussed in the next section.
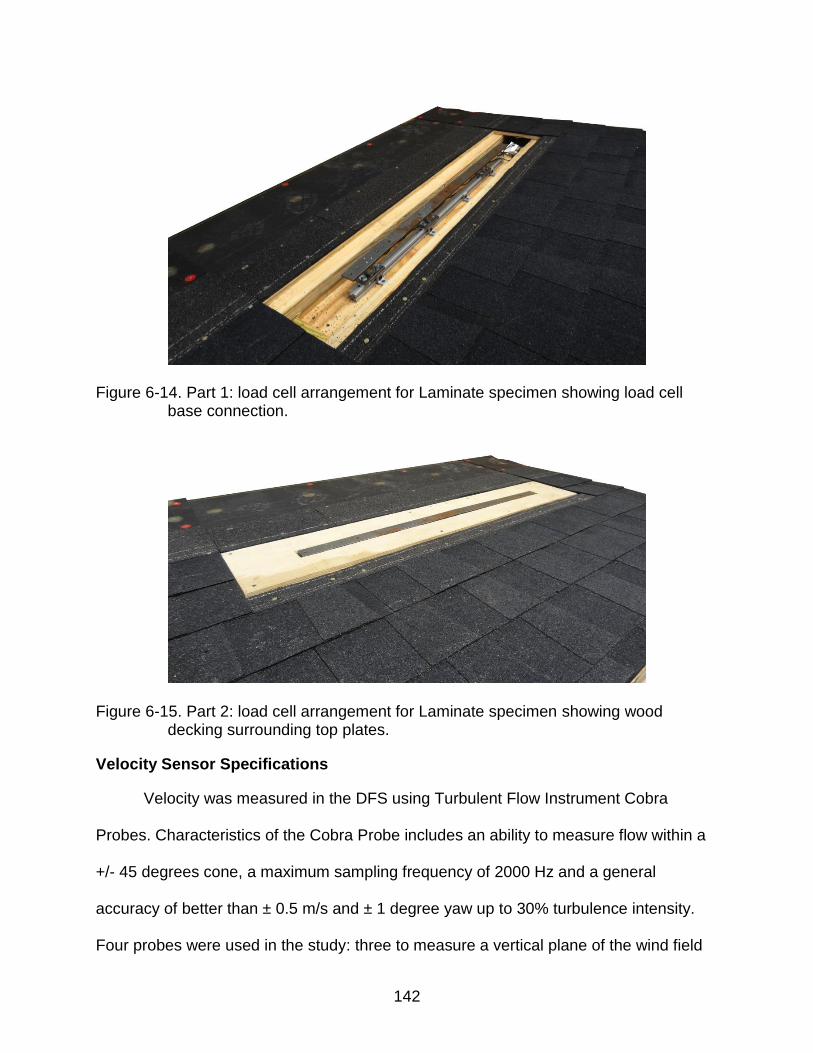
142
Figure 6-14. Part 1: load cell arrangement for Laminate specimen showing load cell base connection.
Figure 6-15. Part 2: load cell arrangement for Laminate specimen showing wood decking surrounding top plates.
Velocity Sensor Specifications
Velocity was measured in the DFS using Turbulent Flow Instrument Cobra
Probes. Characteristics of the Cobra Probe includes an ability to measure flow within a
+/- 45 degrees cone, a maximum sampling frequency of 2000 Hz and a general
accuracy of better than ± 0.5 m/s and ± 1 degree yaw up to 30% turbulence intensity.
Four probes were used in the study: three to measure a vertical plane of the wind field
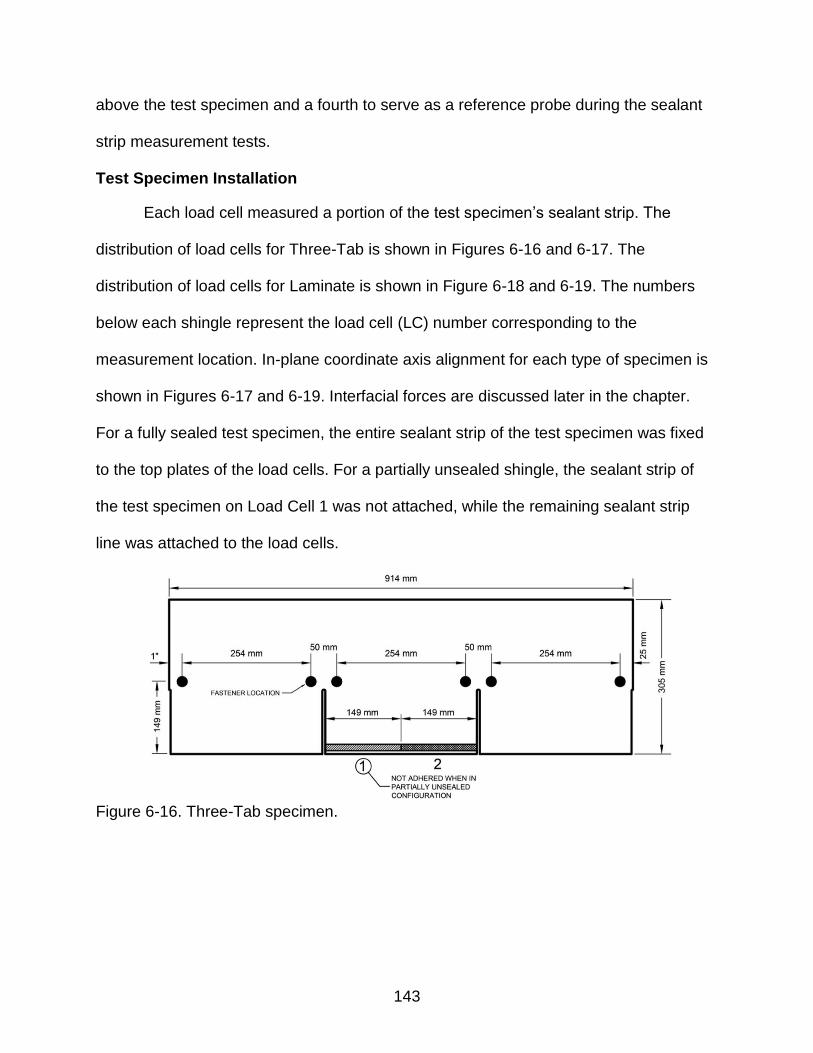
143
above the test specimen and a fourth to serve as a reference probe during the sealant
strip measurement tests.
Test Specimen Installation
Each load cell measured a portion of the test specimen’s sealant strip. The
distribution of load cells for Three-Tab is shown in Figures 6-16 and 6-17. The
distribution of load cells for Laminate is shown in Figure 6-18 and 6-19. The numbers
below each shingle represent the load cell (LC) number corresponding to the
measurement location. In-plane coordinate axis alignment for each type of specimen is
shown in Figures 6-17 and 6-19. Interfacial forces are discussed later in the chapter.
For a fully sealed test specimen, the entire sealant strip of the test specimen was fixed
to the top plates of the load cells. For a partially unsealed shingle, the sealant strip of
the test specimen on Load Cell 1 was not attached, while the remaining sealant strip
line was attached to the load cells.
Figure 6-16. Three-Tab specimen.
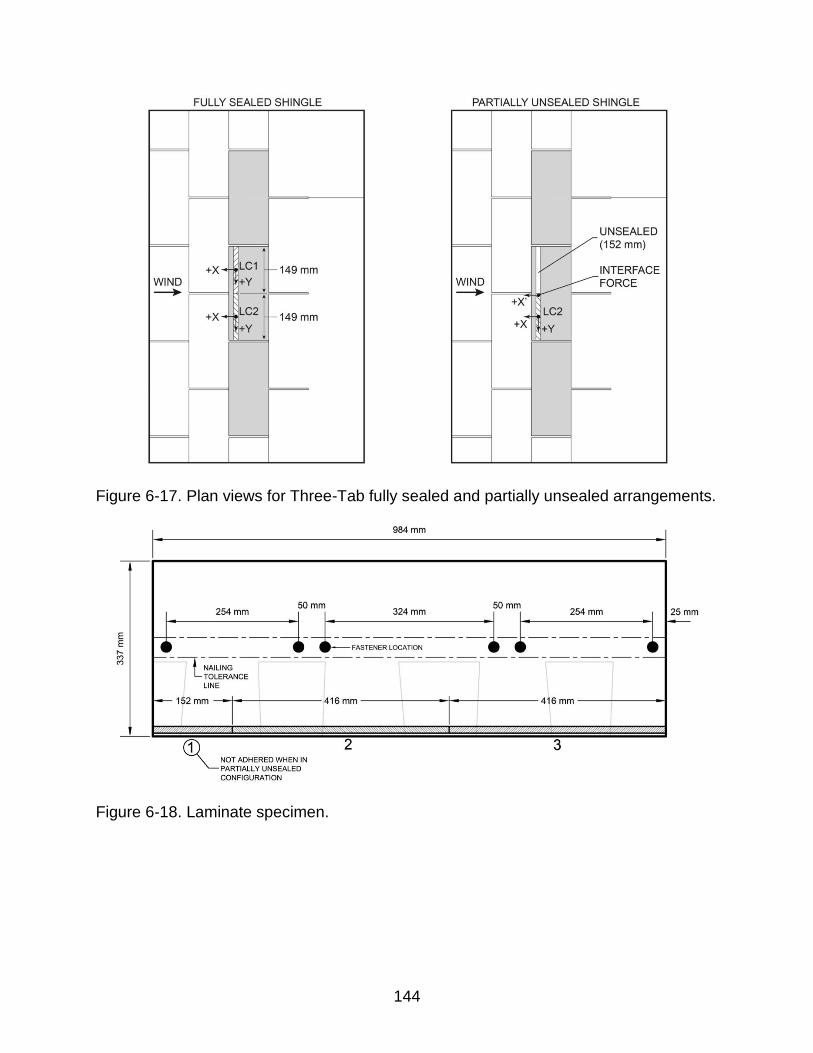
144
Figure 6-17. Plan views for Three-Tab fully sealed and partially unsealed arrangements.
Figure 6-18. Laminate specimen.
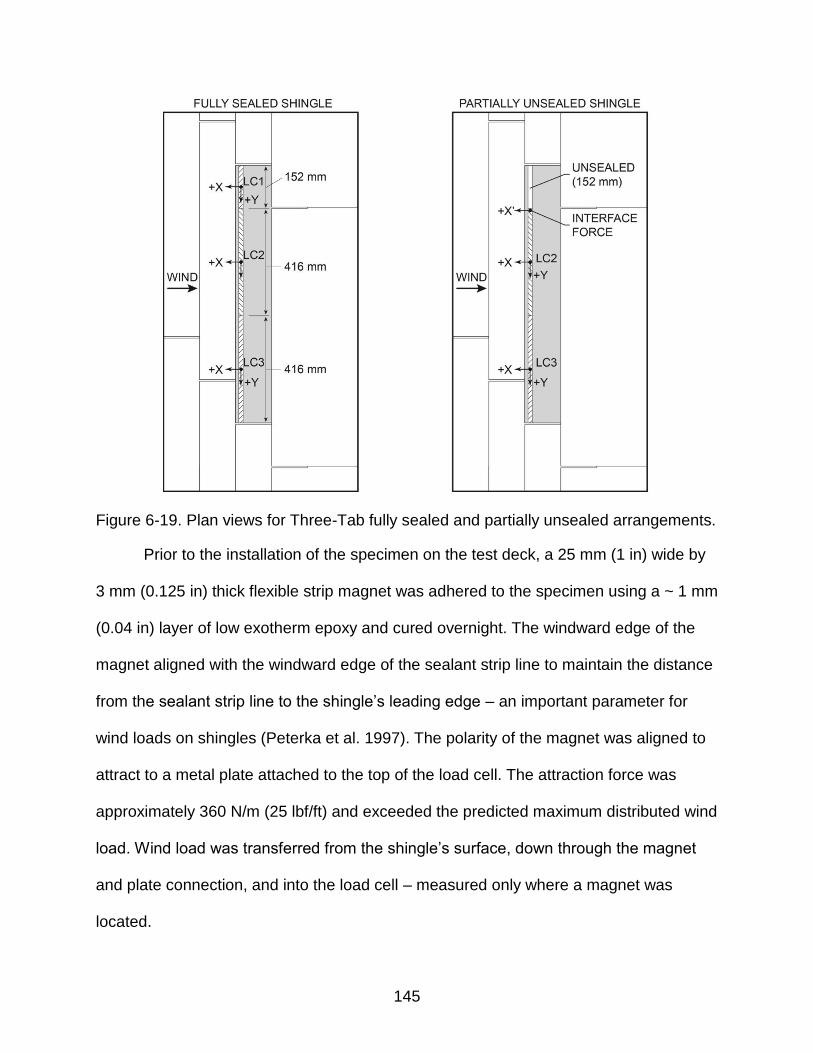
145
Figure 6-19. Plan views for Three-Tab fully sealed and partially unsealed arrangements.
Prior to the installation of the specimen on the test deck, a 25 mm (1 in) wide by
3 mm (0.125 in) thick flexible strip magnet was adhered to the specimen using a ~ 1 mm
(0.04 in) layer of low exotherm epoxy and cured overnight. The windward edge of the
magnet aligned with the windward edge of the sealant strip line to maintain the distance
from the sealant strip line to the shingle’s leading edge – an important parameter for
wind loads on shingles (Peterka et al. 1997). The polarity of the magnet was aligned to
attract to a metal plate attached to the top of the load cell. The attraction force was
approximately 360 N/m (25 lbf/ft) and exceeded the predicted maximum distributed wind
load. Wind load was transferred from the shingle’s surface, down through the magnet
and plate connection, and into the load cell – measured only where a magnet was
located.
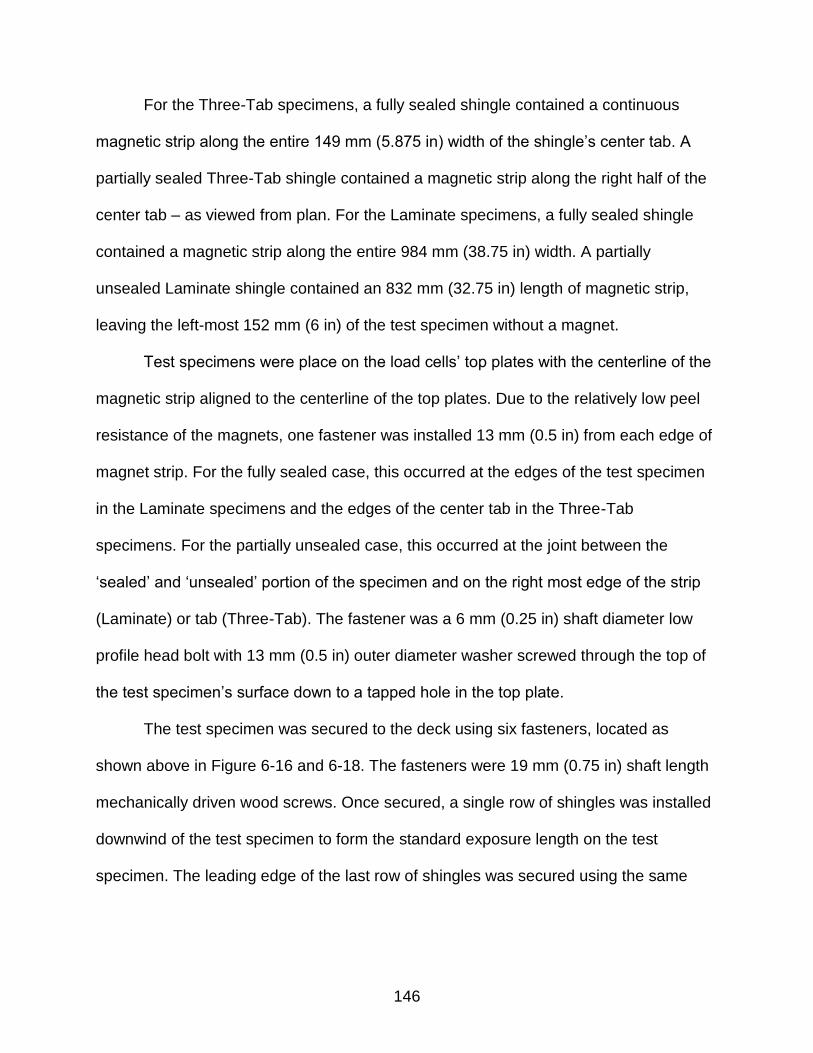
146
For the Three-Tab specimens, a fully sealed shingle contained a continuous
magnetic strip along the entire 149 mm (5.875 in) width of the shingle’s center tab. A
partially sealed Three-Tab shingle contained a magnetic strip along the right half of the
center tab – as viewed from plan. For the Laminate specimens, a fully sealed shingle
contained a magnetic strip along the entire 984 mm (38.75 in) width. A partially
unsealed Laminate shingle contained an 832 mm (32.75 in) length of magnetic strip,
leaving the left-most 152 mm (6 in) of the test specimen without a magnet.
Test specimens were place on the load cells’ top plates with the centerline of the
magnetic strip aligned to the centerline of the top plates. Due to the relatively low peel
resistance of the magnets, one fastener was installed 13 mm (0.5 in) from each edge of
magnet strip. For the fully sealed case, this occurred at the edges of the test specimen
in the Laminate specimens and the edges of the center tab in the Three-Tab
specimens. For the partially unsealed case, this occurred at the joint between the
‘sealed’ and ‘unsealed’ portion of the specimen and on the right most edge of the strip
(Laminate) or tab (Three-Tab). The fastener was a 6 mm (0.25 in) shaft diameter low
profile head bolt with 13 mm (0.5 in) outer diameter washer screwed through the top of
the test specimen’s surface down to a tapped hole in the top plate.
The test specimen was secured to the deck using six fasteners, located as
shown above in Figure 6-16 and 6-18. The fasteners were 19 mm (0.75 in) shaft length
mechanically driven wood screws. Once secured, a single row of shingles was installed
downwind of the test specimen to form the standard exposure length on the test
specimen. The leading edge of the last row of shingles was secured using the same
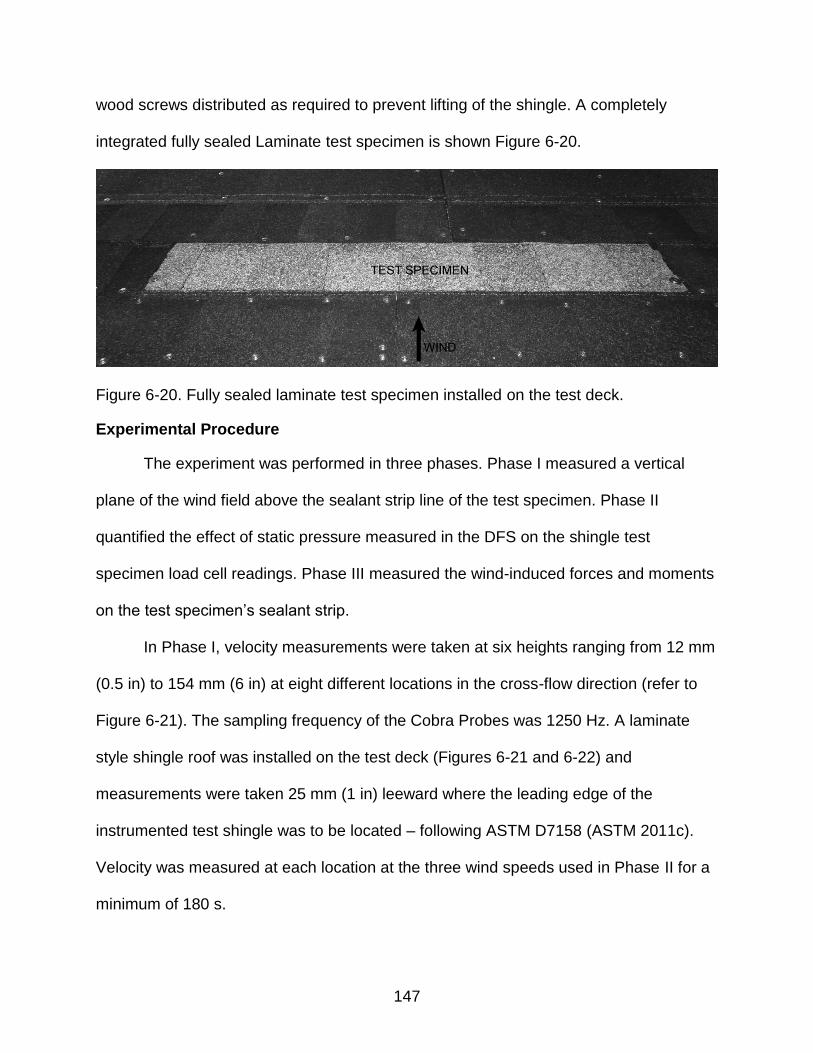
147
wood screws distributed as required to prevent lifting of the shingle. A completely
integrated fully sealed Laminate test specimen is shown Figure 6-20.
Figure 6-20. Fully sealed laminate test specimen installed on the test deck.
Experimental Procedure
The experiment was performed in three phases. Phase I measured a vertical
plane of the wind field above the sealant strip line of the test specimen. Phase II
quantified the effect of static pressure measured in the DFS on the shingle test
specimen load cell readings. Phase III measured the wind-induced forces and moments
on the test specimen’s sealant strip.
In Phase I, velocity measurements were taken at six heights ranging from 12 mm
(0.5 in) to 154 mm (6 in) at eight different locations in the cross-flow direction (refer to
Figure 6-21). The sampling frequency of the Cobra Probes was 1250 Hz. A laminate
style shingle roof was installed on the test deck (Figures 6-21 and 6-22) and
measurements were taken 25 mm (1 in) leeward where the leading edge of the
instrumented test shingle was to be located – following ASTM D7158 (ASTM 2011c).
Velocity was measured at each location at the three wind speeds used in Phase II for a
minimum of 180 s.
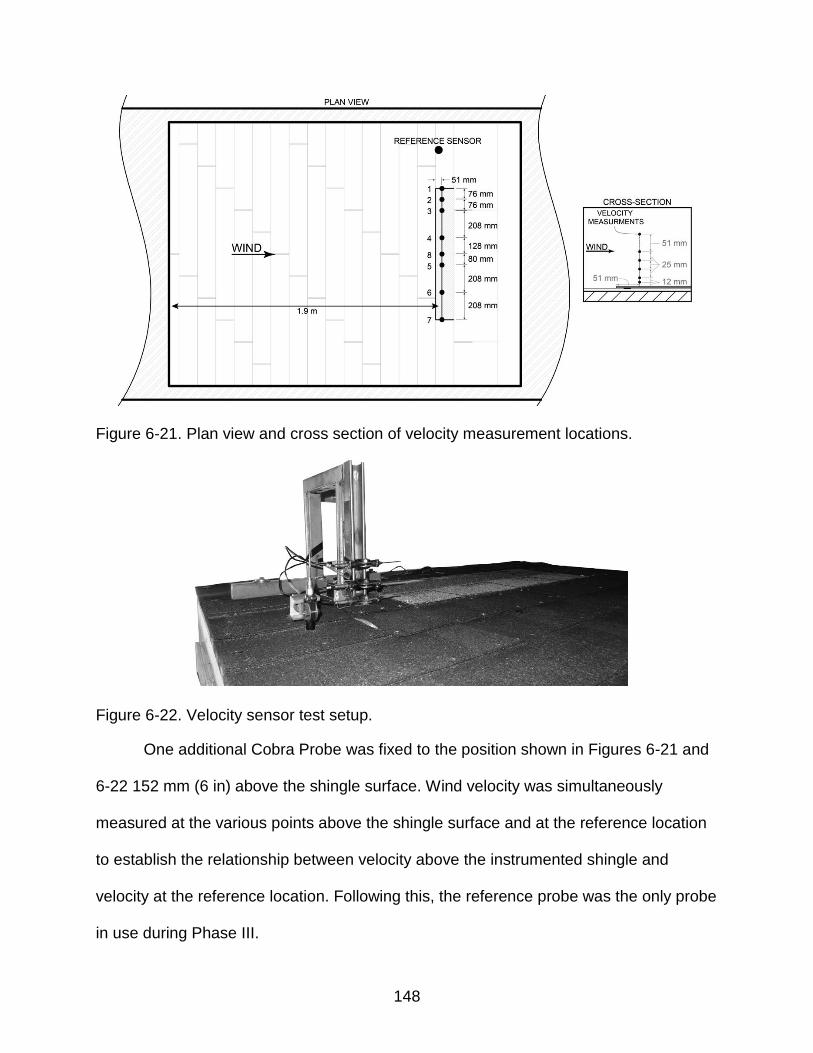
148
Figure 6-21. Plan view and cross section of velocity measurement locations.
Figure 6-22. Velocity sensor test setup.
One additional Cobra Probe was fixed to the position shown in Figures 6-21 and
6-22 152 mm (6 in) above the shingle surface. Wind velocity was simultaneously
measured at the various points above the shingle surface and at the reference location
to establish the relationship between velocity above the instrumented shingle and
velocity at the reference location. Following this, the reference probe was the only probe
in use during Phase III.

149
In Phase II, the pressure difference measured between the ambient and interior
of the test section during Phase I was replicated on the shingle test specimen using a
Pressure Loading Actuator affixed to a chamber over the test specimen. Forces and
moments measured by the load cell were related to static pressure in the chamber.
In Phase III, wind was passed across the test specimen for a minimum of 180 s,
while velocity at the reference location and sealant strip force were measured
simultaneously. Test specimens were subjected, sequentially, to the Low, Medium, and
High wind speeds with a 30 s period of ~3 m/s (7 mph) wind between each speed. Five
cycles of the Low/Medium/High sequence were used on the each Laminate specimen,
while three cycles were used for each Three-Tab specimen.
Results
Phase I: Wind Field Above the Test Specimen
Mean longitudinal velocity
Vertical profiles of mean longitudinal velocity shown Figures 6-23 through 6-25
with each figure representing one wind speed. As expected, a boundary layer above the
specimen is present in all mean longitudinal velocity profiles. Recall, the most critical
parameter for the wind loading of shingles is the mean longitudinal velocity measured
25 mm (1 in) above the shingle’s surface (Peterka et al. 1997). For this study, mean
longitudinal velocity measured across the specimen’s width at 25 mm (1 in) above the
specimen varied by ±0.7 m/s in the Low speed (15 m/s), ±1.6 m/s in the Medium speed
(30 m/s), and ±2.1 m/s in the High speed (44 m/s).
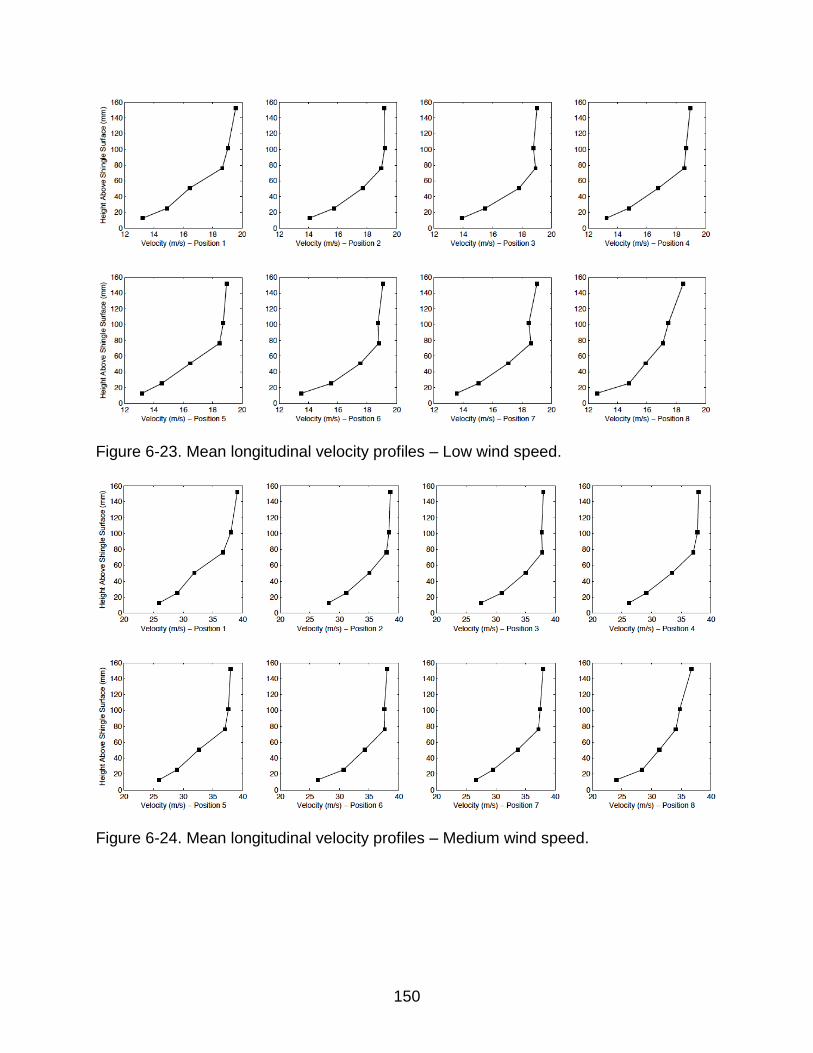
150
Figure 6-23. Mean longitudinal velocity profiles – Low wind speed.
Figure 6-24. Mean longitudinal velocity profiles – Medium wind speed.
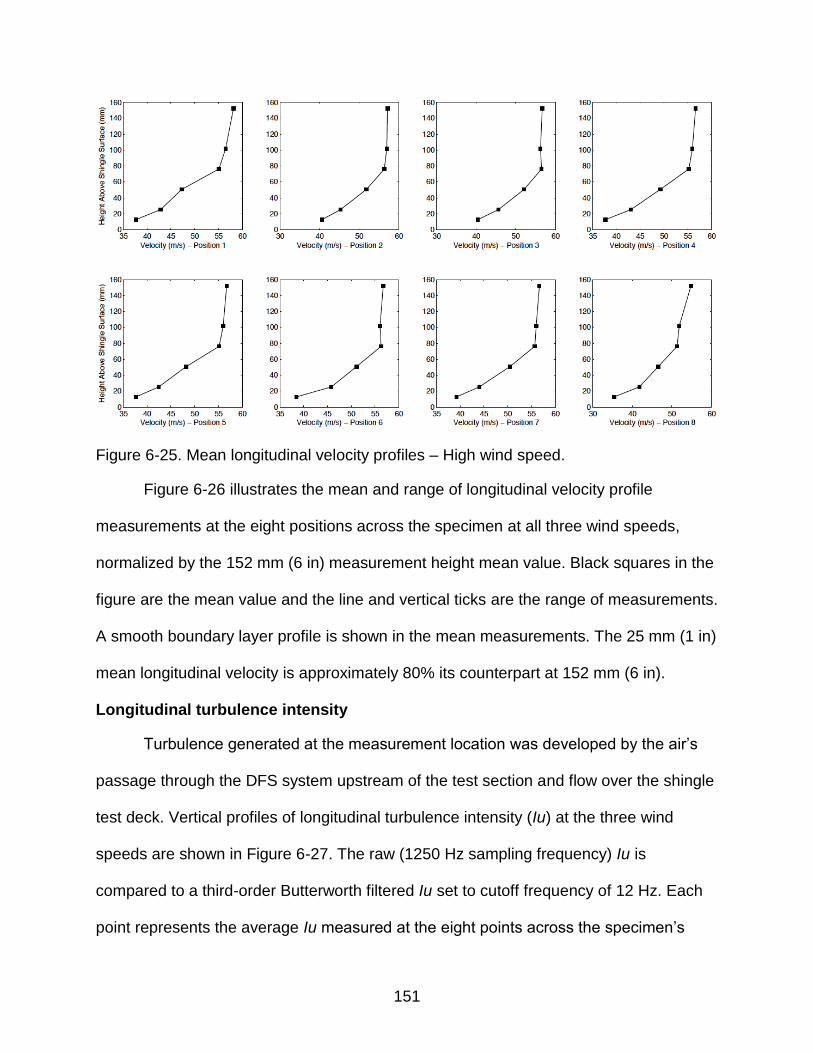
151
Figure 6-25. Mean longitudinal velocity profiles – High wind speed.
Figure 6-26 illustrates the mean and range of longitudinal velocity profile
measurements at the eight positions across the specimen at all three wind speeds,
normalized by the 152 mm (6 in) measurement height mean value. Black squares in the
figure are the mean value and the line and vertical ticks are the range of measurements.
A smooth boundary layer profile is shown in the mean measurements. The 25 mm (1 in)
mean longitudinal velocity is approximately 80% its counterpart at 152 mm (6 in).
Longitudinal turbulence intensity
Turbulence generated at the measurement location was developed by the air’s
passage through the DFS system upstream of the test section and flow over the shingle
test deck. Vertical profiles of longitudinal turbulence intensity (Iu) at the three wind
speeds are shown in Figure 6-27. The raw (1250 Hz sampling frequency) Iu is
compared to a third-order Butterworth filtered Iu set to cutoff frequency of 12 Hz. Each
point represents the average Iu measured at the eight points across the specimen’s
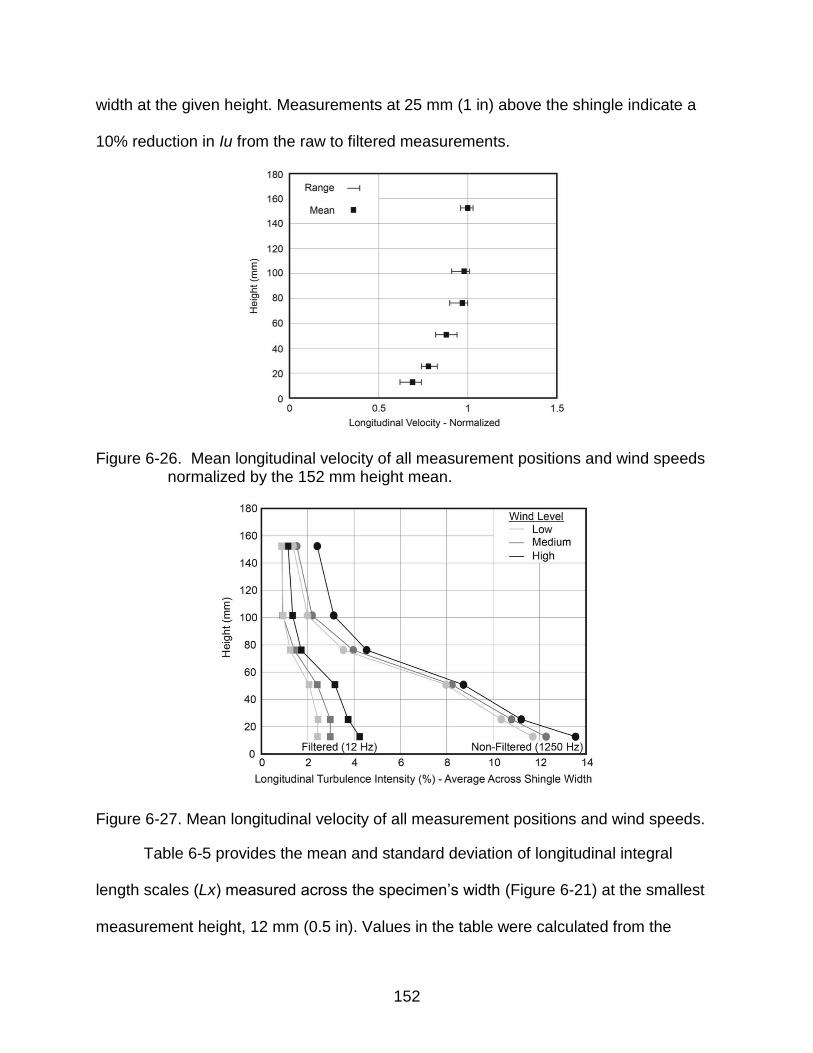
152
width at the given height. Measurements at 25 mm (1 in) above the shingle indicate a
10% reduction in Iu from the raw to filtered measurements.
Figure 6-26. Mean longitudinal velocity of all measurement positions and wind speeds normalized by the 152 mm height mean.
Figure 6-27. Mean longitudinal velocity of all measurement positions and wind speeds.
Table 6-5 provides the mean and standard deviation of longitudinal integral
length scales (Lx) measured across the specimen’s width (Figure 6-21) at the smallest
measurement height, 12 mm (0.5 in). Values in the table were calculated from the
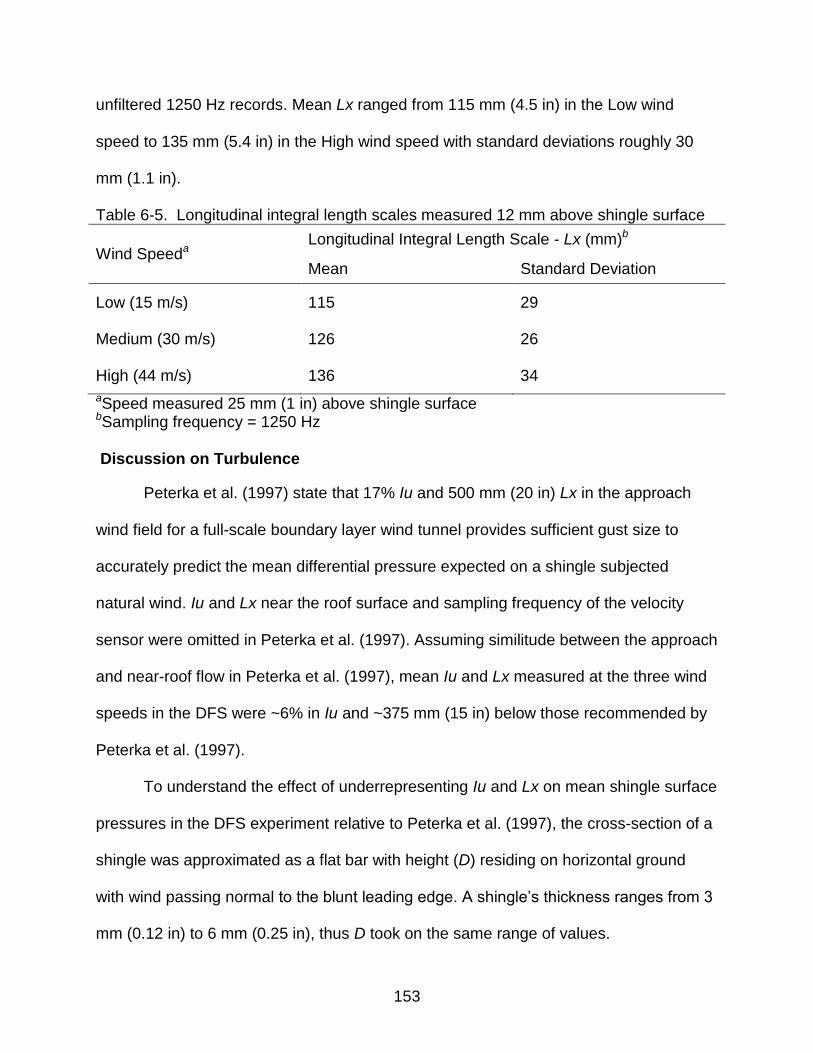
153
unfiltered 1250 Hz records. Mean Lx ranged from 115 mm (4.5 in) in the Low wind
speed to 135 mm (5.4 in) in the High wind speed with standard deviations roughly 30
mm (1.1 in).
Table 6-5. Longitudinal integral length scales measured 12 mm above shingle surface
Wind Speeda Longitudinal Integral Length Scale - Lx (mm)b
Mean Standard Deviation
Low (15 m/s) 115 29
Medium (30 m/s) 126 26
High (44 m/s) 136 34
aSpeed measured 25 mm (1 in) above shingle surface bSampling frequency = 1250 Hz Discussion on Turbulence
Peterka et al. (1997) state that 17% Iu and 500 mm (20 in) Lx in the approach
wind field for a full-scale boundary layer wind tunnel provides sufficient gust size to
accurately predict the mean differential pressure expected on a shingle subjected
natural wind. Iu and Lx near the roof surface and sampling frequency of the velocity
sensor were omitted in Peterka et al. (1997). Assuming similitude between the approach
and near-roof flow in Peterka et al. (1997), mean Iu and Lx measured at the three wind
speeds in the DFS were ~6% in Iu and ~375 mm (15 in) below those recommended by
Peterka et al. (1997).
To understand the effect of underrepresenting Iu and Lx on mean shingle surface
pressures in the DFS experiment relative to Peterka et al. (1997), the cross-section of a
shingle was approximated as a flat bar with height (D) residing on horizontal ground
with wind passing normal to the blunt leading edge. A shingle’s thickness ranges from 3
mm (0.12 in) to 6 mm (0.25 in), thus D took on the same range of values.
154
Setting Lx equivalent to the average value shown in Table 6-4 [126 mm (5 in)]
produced an Lx/D ratio of 21 to 42. Values of Lx/D from Peterka et al. (1997) range from
83 to 167. From Li and Melbourne (1999), Lx/D ratios greater than 12 at equivalent Iu
produce similar mean surface pressure distributions due to the reduced influence of
length scales on mean flows over bluff bodies. Thus, underrepresenting Lx in the
present study is not expected to have an effect on mean pressure distribution on the
shingle surface. Li and Melbourne (1999) do, however, demonstrate that a reduction in
Iu reduces the magnitude of mean pressures nearest the leading edge of the bluff body
(e.g., shingle). Mean force on the leading edge measured in this study may be lower
than those predicted by the Peterka et al. (1997) load model.
A further question pertains to the equivalence between the turbulence structure
of the present study and that in the ASTM D7158 test method (ASTM 2011c).
Longitudinal turbulence intensity at the test section of an ASTM D7158 shingle deck is
unknown (ASTM 2011c), although the method incorporates a turbulence generation grid
at the fan exit and roughness strips upwind of test section. Future work should address
this knowledge gap.
Static Pressure
The average static pressure between the test section and ambient 25 mm (1 in)
above the test specimen was -100, -400, and -800 Pa (-0.01, -0.06, and -0.12 PSI) for
the three wind speed levels, respectively. Thus, during wind testing, an upward
pressure was exerted on the underside of test deck exposed to the ambient pressure.
Recall from Figure 6-12, the load cells were fixed to the test specimen below in a cavity
formed in the test section. If ambient air freely entered the cavity, it would produce an
upward pressure on the test specimen’s bottom surface. Knowing this, the cavity was
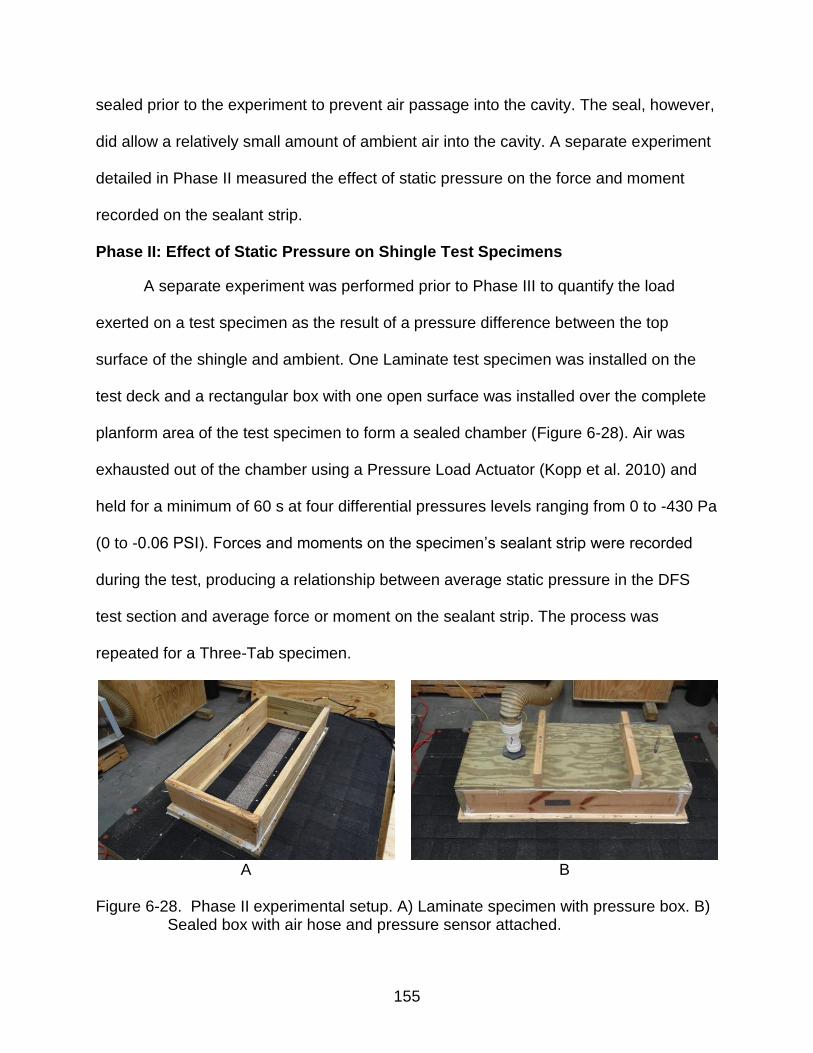
155
sealed prior to the experiment to prevent air passage into the cavity. The seal, however,
did allow a relatively small amount of ambient air into the cavity. A separate experiment
detailed in Phase II measured the effect of static pressure on the force and moment
recorded on the sealant strip.
Phase II: Effect of Static Pressure on Shingle Test Specimens
A separate experiment was performed prior to Phase III to quantify the load
exerted on a test specimen as the result of a pressure difference between the top
surface of the shingle and ambient. One Laminate test specimen was installed on the
test deck and a rectangular box with one open surface was installed over the complete
planform area of the test specimen to form a sealed chamber (Figure 6-28). Air was
exhausted out of the chamber using a Pressure Load Actuator (Kopp et al. 2010) and
held for a minimum of 60 s at four differential pressures levels ranging from 0 to -430 Pa
(0 to -0.06 PSI). Forces and moments on the specimen’s sealant strip were recorded
during the test, producing a relationship between average static pressure in the DFS
test section and average force or moment on the sealant strip. The process was
repeated for a Three-Tab specimen.
A B
Figure 6-28. Phase II experimental setup. A) Laminate specimen with pressure box. B)
Sealed box with air hose and pressure sensor attached.
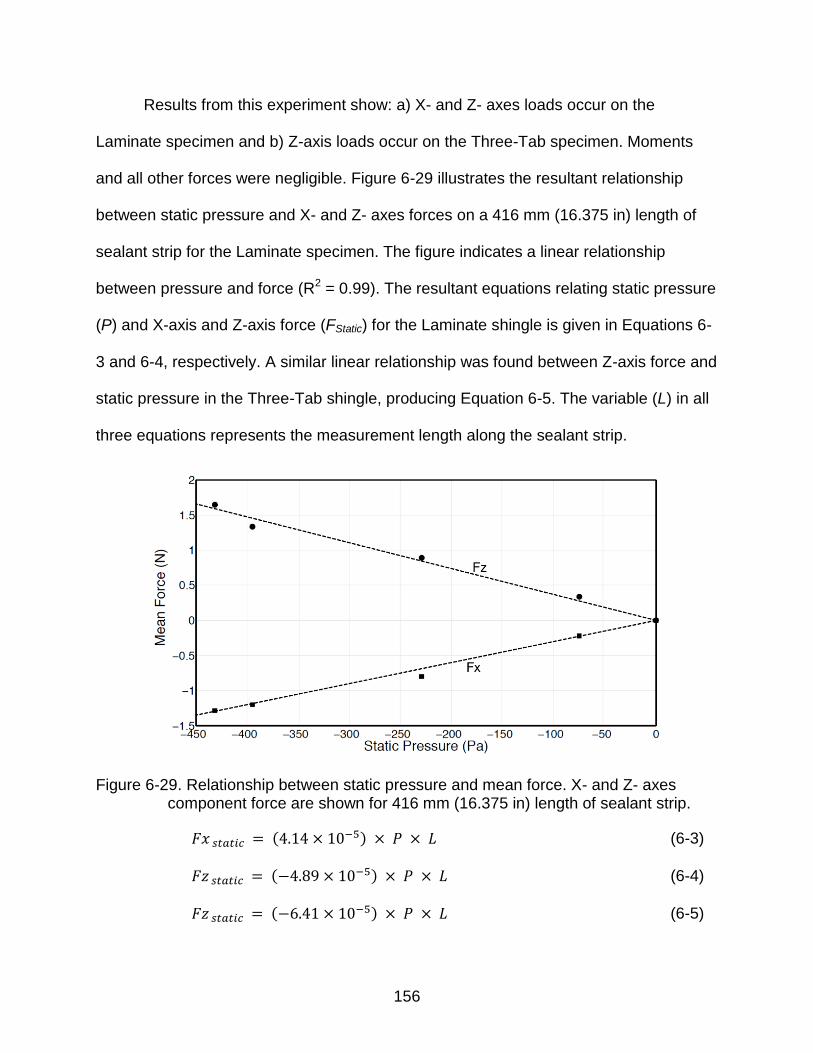
156
Results from this experiment show: a) X- and Z- axes loads occur on the
Laminate specimen and b) Z-axis loads occur on the Three-Tab specimen. Moments
and all other forces were negligible. Figure 6-29 illustrates the resultant relationship
between static pressure and X- and Z- axes forces on a 416 mm (16.375 in) length of
sealant strip for the Laminate specimen. The figure indicates a linear relationship
between pressure and force (R2 = 0.99). The resultant equations relating static pressure
(P) and X-axis and Z-axis force (FStatic) for the Laminate shingle is given in Equations 6-
3 and 6-4, respectively. A similar linear relationship was found between Z-axis force and
static pressure in the Three-Tab shingle, producing Equation 6-5. The variable (L) in all
three equations represents the measurement length along the sealant strip.
Figure 6-29. Relationship between static pressure and mean force. X- and Z- axes component force are shown for 416 mm (16.375 in) length of sealant strip.
( ) (6-3)
( ) (6-4)
( ) (6-5)
157
Phase III: Wind-Induced Forces and Moments on the Shingle’s Sealant Strip
Data processing
Sealant strip forces and moments measured during Phase III of the study were
processed to the final force and moment data reported below using the procedure
outline in this section.
Raw 100 Hz sampled load cell records were first digitally low-pass filtered using
a third-order Butterworth filter set to a 12 Hz cutoff frequency. Figure 6-29 shows a time-
history comparing the raw and filtered signals for uplift (+ Z-axis) on a fully sealed
Lamainate specimen. Next, force and moment data were visually inspected as time-
history plots in Matlab 2009b software. The goal was to identify: a) the typical forces
and moments in the sealant strip as wind passes over the shingle, and b) where
temperature changes in the load cell’s body may have affected the output forces and
moments. The load cells do not have internal temperature. The temperature of the air
passing over the deck in the DFS during wind testing was greater than ambient at all
times; therefore, the load cells exhibited temperature-induced changes in early wind
speed tests. Conversely, later tests showed no effects from temperature – likely due to
the equilibrium reached between the load cell’s body and air in DFS.
Figures 6-30 and 6-31 provide a comparison between the typical force time-
histories on the Z-axes for outputs that were (Figure 6-31) and were not affected (Figure
6-30) by temperature. The records where temperature-induced changes were not
observed show a constant mean force on all three axes during the constant speed wind
test. The records where temperature-induced changes were observed show a non-
constant mean force during the constant wind speed test. During this time, the load
cell’s body was heated – causing an expansion in the load cells body – producing a
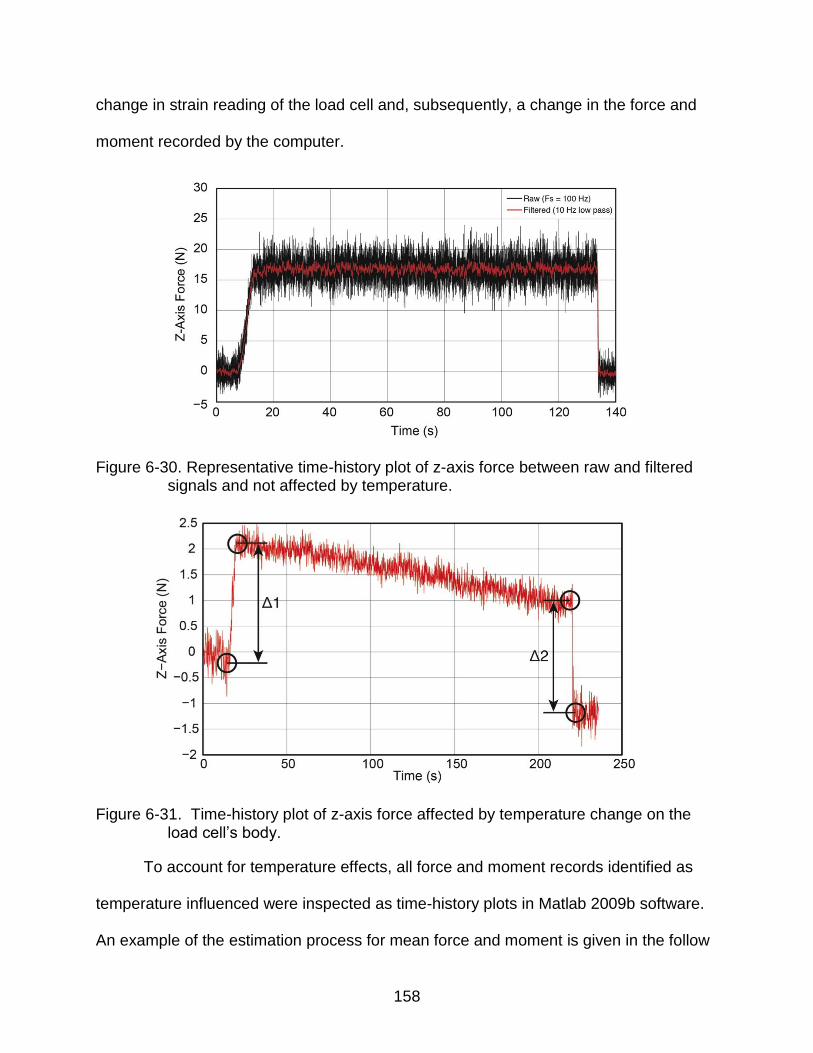
158
change in strain reading of the load cell and, subsequently, a change in the force and
moment recorded by the computer.
Figure 6-30. Representative time-history plot of z-axis force between raw and filtered signals and not affected by temperature.
Figure 6-31. Time-history plot of z-axis force affected by temperature change on the load cell’s body.
To account for temperature effects, all force and moment records identified as
temperature influenced were inspected as time-history plots in Matlab 2009b software.
An example of the estimation process for mean force and moment is given in the follow
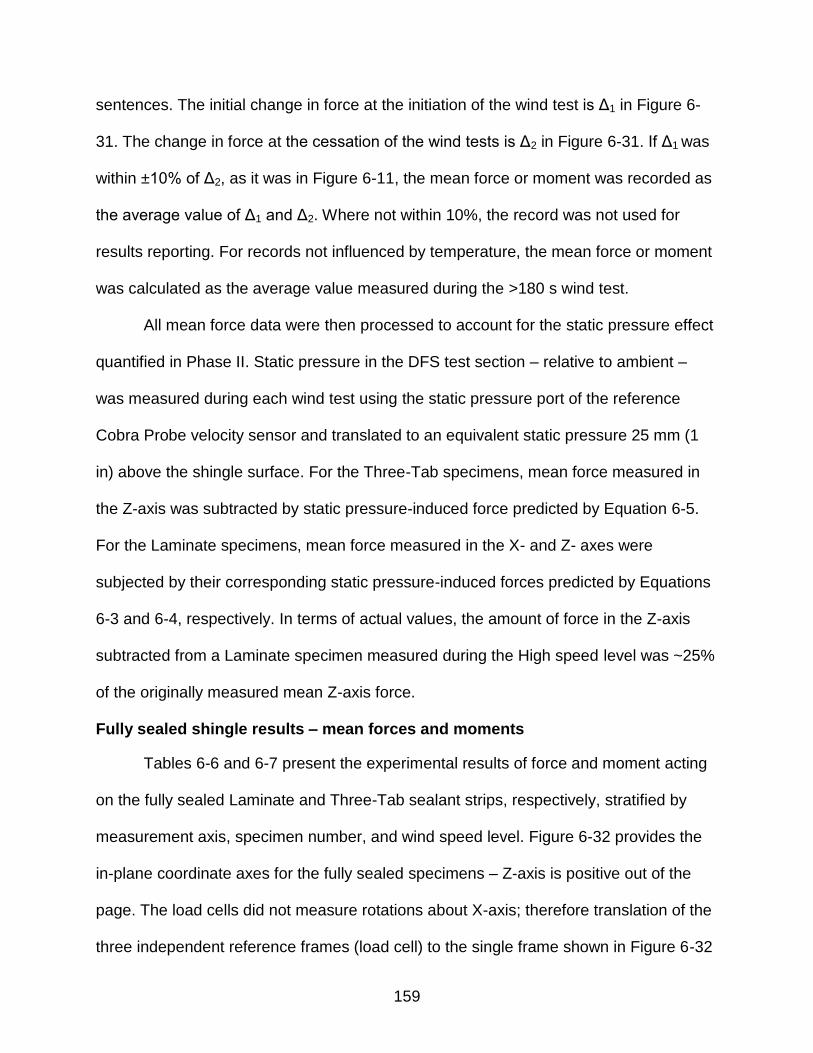
159
sentences. The initial change in force at the initiation of the wind test is Δ1 in Figure 6-
31. The change in force at the cessation of the wind tests is Δ2 in Figure 6-31. If Δ1 was
within ±10% of Δ2, as it was in Figure 6-11, the mean force or moment was recorded as
the average value of Δ1 and Δ2. Where not within 10%, the record was not used for
results reporting. For records not influenced by temperature, the mean force or moment
was calculated as the average value measured during the >180 s wind test.
All mean force data were then processed to account for the static pressure effect
quantified in Phase II. Static pressure in the DFS test section – relative to ambient –
was measured during each wind test using the static pressure port of the reference
Cobra Probe velocity sensor and translated to an equivalent static pressure 25 mm (1
in) above the shingle surface. For the Three-Tab specimens, mean force measured in
the Z-axis was subtracted by static pressure-induced force predicted by Equation 6-5.
For the Laminate specimens, mean force measured in the X- and Z- axes were
subjected by their corresponding static pressure-induced forces predicted by Equations
6-3 and 6-4, respectively. In terms of actual values, the amount of force in the Z-axis
subtracted from a Laminate specimen measured during the High speed level was ~25%
of the originally measured mean Z-axis force.
Fully sealed shingle results – mean forces and moments
Tables 6-6 and 6-7 present the experimental results of force and moment acting
on the fully sealed Laminate and Three-Tab sealant strips, respectively, stratified by
measurement axis, specimen number, and wind speed level. Figure 6-32 provides the
in-plane coordinate axes for the fully sealed specimens – Z-axis is positive out of the
page. The load cells did not measure rotations about X-axis; therefore translation of the
three independent reference frames (load cell) to the single frame shown in Figure 6-32
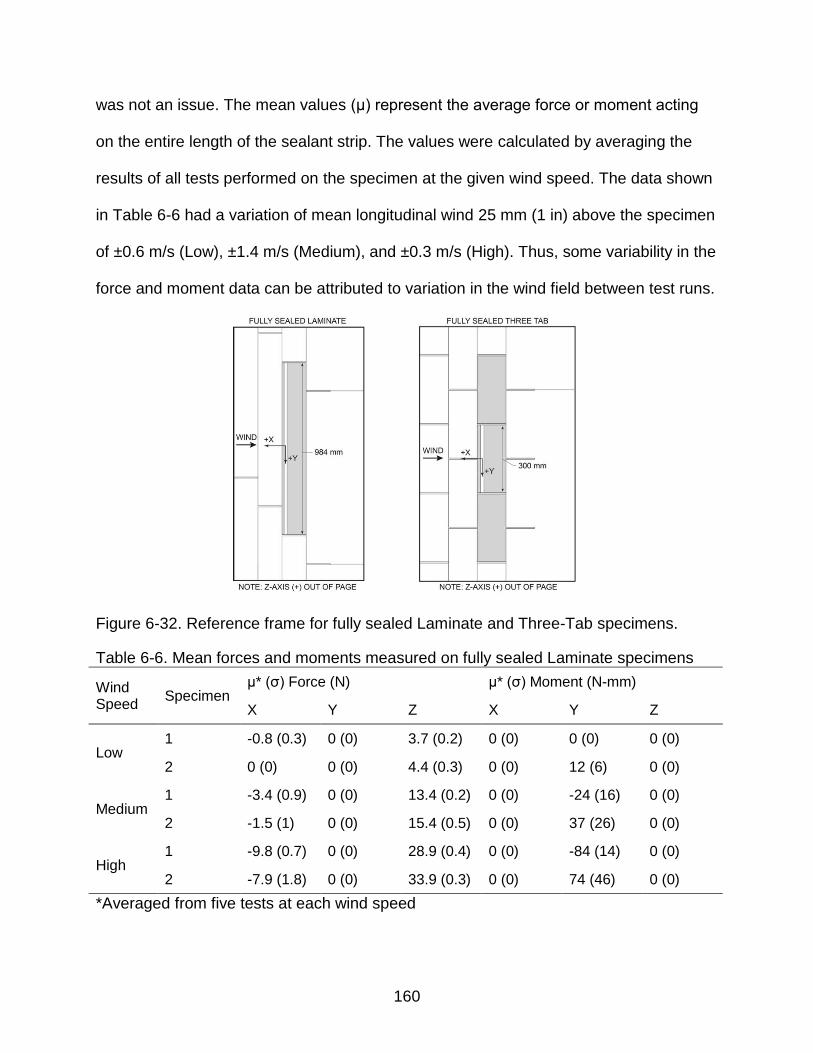
160
was not an issue. The mean values (μ) represent the average force or moment acting
on the entire length of the sealant strip. The values were calculated by averaging the
results of all tests performed on the specimen at the given wind speed. The data shown
in Table 6-6 had a variation of mean longitudinal wind 25 mm (1 in) above the specimen
of ±0.6 m/s (Low), ±1.4 m/s (Medium), and ±0.3 m/s (High). Thus, some variability in the
force and moment data can be attributed to variation in the wind field between test runs.
Figure 6-32. Reference frame for fully sealed Laminate and Three-Tab specimens.
Table 6-6. Mean forces and moments measured on fully sealed Laminate specimens
Wind Speed
Specimen μ* (σ) Force (N) μ* (σ) Moment (N-mm)
X Y Z X Y Z
Low 1 -0.8 (0.3) 0 (0) 3.7 (0.2) 0 (0) 0 (0) 0 (0)
2 0 (0) 0 (0) 4.4 (0.3) 0 (0) 12 (6) 0 (0)
Medium 1 -3.4 (0.9) 0 (0) 13.4 (0.2) 0 (0) -24 (16) 0 (0)
2 -1.5 (1) 0 (0) 15.4 (0.5) 0 (0) 37 (26) 0 (0)
High 1 -9.8 (0.7) 0 (0) 28.9 (0.4) 0 (0) -84 (14) 0 (0)
2 -7.9 (1.8) 0 (0) 33.9 (0.3) 0 (0) 74 (46) 0 (0)
*Averaged from five tests at each wind speed
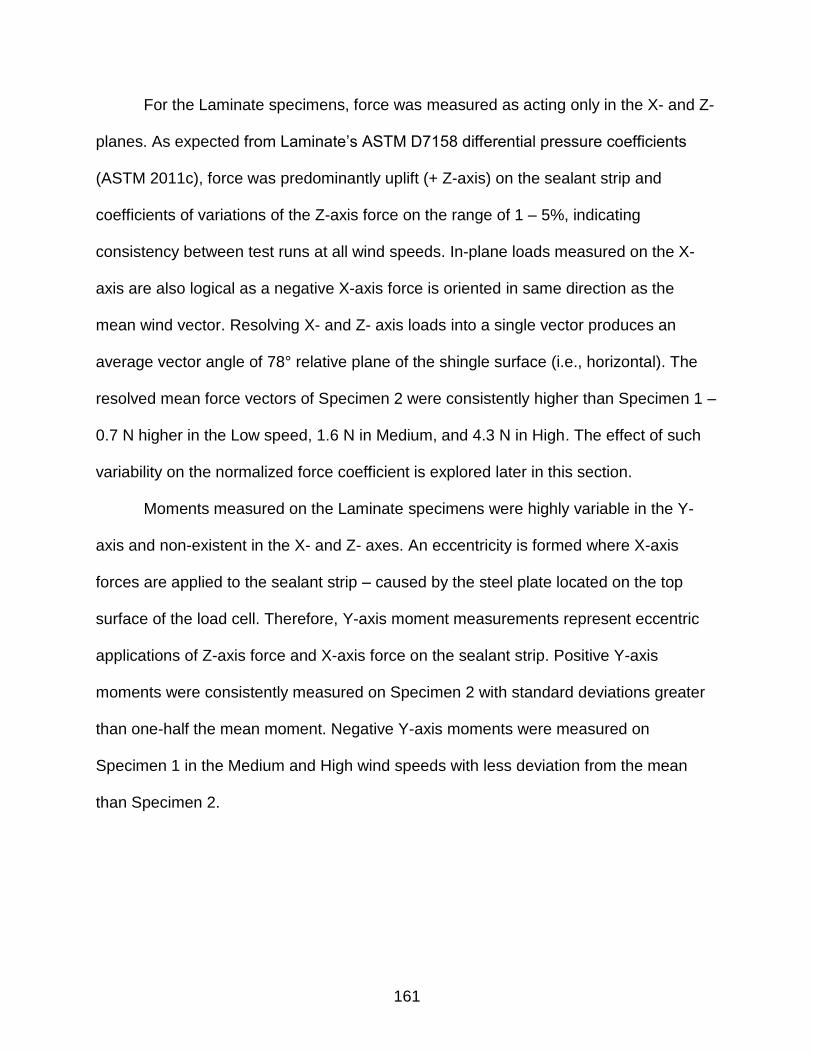
161
For the Laminate specimens, force was measured as acting only in the X- and Z-
planes. As expected from Laminate’s ASTM D7158 differential pressure coefficients
(ASTM 2011c), force was predominantly uplift (+ Z-axis) on the sealant strip and
coefficients of variations of the Z-axis force on the range of 1 – 5%, indicating
consistency between test runs at all wind speeds. In-plane loads measured on the X-
axis are also logical as a negative X-axis force is oriented in same direction as the
mean wind vector. Resolving X- and Z- axis loads into a single vector produces an
average vector angle of 78° relative plane of the shingle surface (i.e., horizontal). The
resolved mean force vectors of Specimen 2 were consistently higher than Specimen 1 –
0.7 N higher in the Low speed, 1.6 N in Medium, and 4.3 N in High. The effect of such
variability on the normalized force coefficient is explored later in this section.
Moments measured on the Laminate specimens were highly variable in the Y-
axis and non-existent in the X- and Z- axes. An eccentricity is formed where X-axis
forces are applied to the sealant strip – caused by the steel plate located on the top
surface of the load cell. Therefore, Y-axis moment measurements represent eccentric
applications of Z-axis force and X-axis force on the sealant strip. Positive Y-axis
moments were consistently measured on Specimen 2 with standard deviations greater
than one-half the mean moment. Negative Y-axis moments were measured on
Specimen 1 in the Medium and High wind speeds with less deviation from the mean
than Specimen 2.
162
Table 6-7. Mean forces and moments measured on fully sealed Three-Tab specimens
Wind Speed
Specimen μ* (σ) Force (N) μ* (σ) Moment (N-mm)
X Y Z X Y Z
Low
1 -0.2 (0.4) 0 (0) 1 (0.1) 0 (0) -9 (15) 0 (0)
2 0 (0) 0 (0) 0.6 (0.5) 0 (0) 0 (0) 0 (0)
3 0 (0) 0 (0) 1.2 (0.2) 0 (0) 2.4 (4.2) 0 (0)
Medium
1 -0.5 (0.9) 0 (0) 3.1 (0.2) 0 (0) 7 (19) 0 (0)
2 -0.1 (0.2) 0 (0) 3.2 (0.1) 0 (0) 0 (0) 0 (0)
3 0.1 (0.4) 0 (0) 3.1 (0.2) 0 (0) 1.5 (2.6) 0 (0)
High
1 -1.5 (2.5) 0 (0) 6.2 (0) 0 (0) 2 (42) 0 (0)
2 0 (0) 0 (0) 7.6 (0.1) 0 (0) 20.5 (4.1) 0 (0)
3 0 (0) 0 (0) 6.3 (0.1) 0 (0) 1.5 (2.6) 0 (0)
*Averaged from three tests at each wind speed
For the Three-Tab specimens, forces were only measured on the X- and Z-axes
(Table 6-7). A greater proportion of force was measured as uplift (Z-axis) on the Three-
Tab specimens than the Laminate. Comparisons of mean to standard deviation in Z-
axis forces indicate consistency in Z-axis measurements between runs (COV = 1 –
16%), similar to the Laminate specimens. With the exception of the outlier X-axis
measurement of Specimen 3 during the Medium wind speed, the average angle of the
X- and Z-axes force vector was 86° relative to the plane of the shingle surface. The
average total force vectors of Specimens 1, 2 and 3 equate to 1.0±0.4 N in the Low
speed, 3.1±0.3 N in the Medium speed, and 6.8±0.8 N in the High speed. Similar with
the Laminate specimens, moments measured on the Three-Tab specimens were highly
variable on Y-axis and non-existent on the X- and Z-axes.
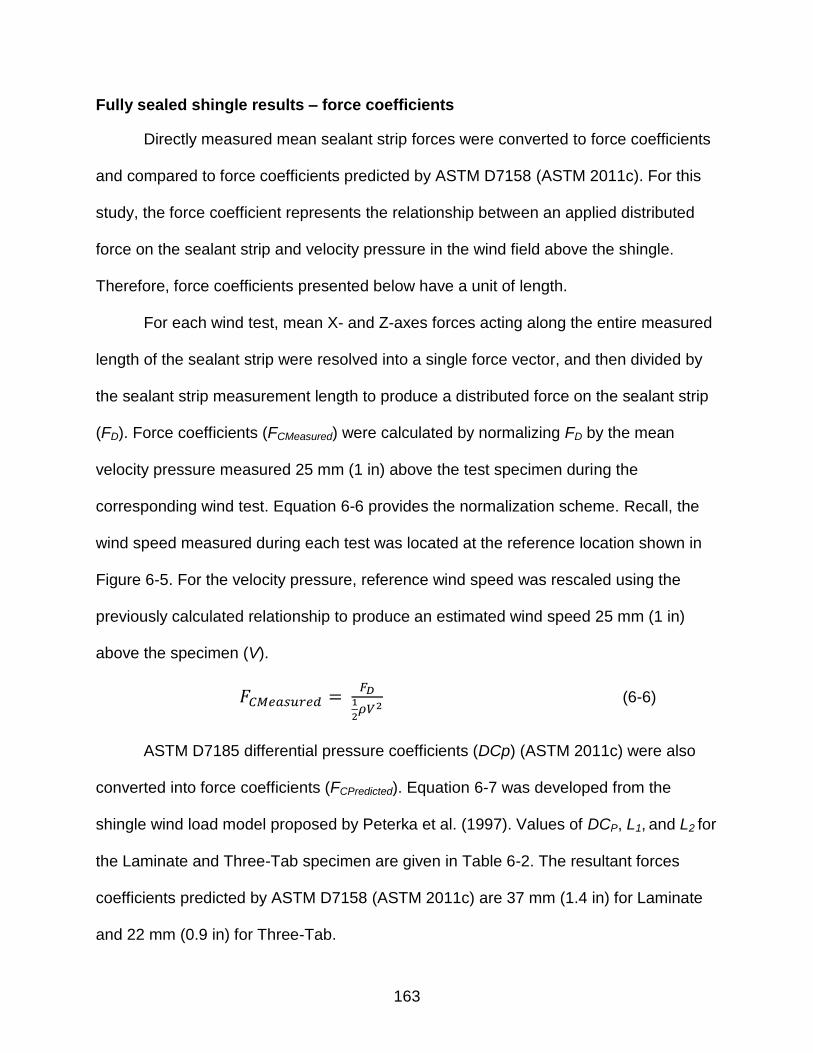
163
Fully sealed shingle results – force coefficients
Directly measured mean sealant strip forces were converted to force coefficients
and compared to force coefficients predicted by ASTM D7158 (ASTM 2011c). For this
study, the force coefficient represents the relationship between an applied distributed
force on the sealant strip and velocity pressure in the wind field above the shingle.
Therefore, force coefficients presented below have a unit of length.
For each wind test, mean X- and Z-axes forces acting along the entire measured
length of the sealant strip were resolved into a single force vector, and then divided by
the sealant strip measurement length to produce a distributed force on the sealant strip
(FD). Force coefficients (FCMeasured) were calculated by normalizing FD by the mean
velocity pressure measured 25 mm (1 in) above the test specimen during the
corresponding wind test. Equation 6-6 provides the normalization scheme. Recall, the
wind speed measured during each test was located at the reference location shown in
Figure 6-5. For the velocity pressure, reference wind speed was rescaled using the
previously calculated relationship to produce an estimated wind speed 25 mm (1 in)
above the specimen (V).
(6-6)
ASTM D7185 differential pressure coefficients (DCp) (ASTM 2011c) were also
converted into force coefficients (FCPredicted). Equation 6-7 was developed from the
shingle wind load model proposed by Peterka et al. (1997). Values of DCP, L1, and L2 for
the Laminate and Three-Tab specimen are given in Table 6-2. The resultant forces
coefficients predicted by ASTM D7158 (ASTM 2011c) are 37 mm (1.4 in) for Laminate
and 22 mm (0.9 in) for Three-Tab.
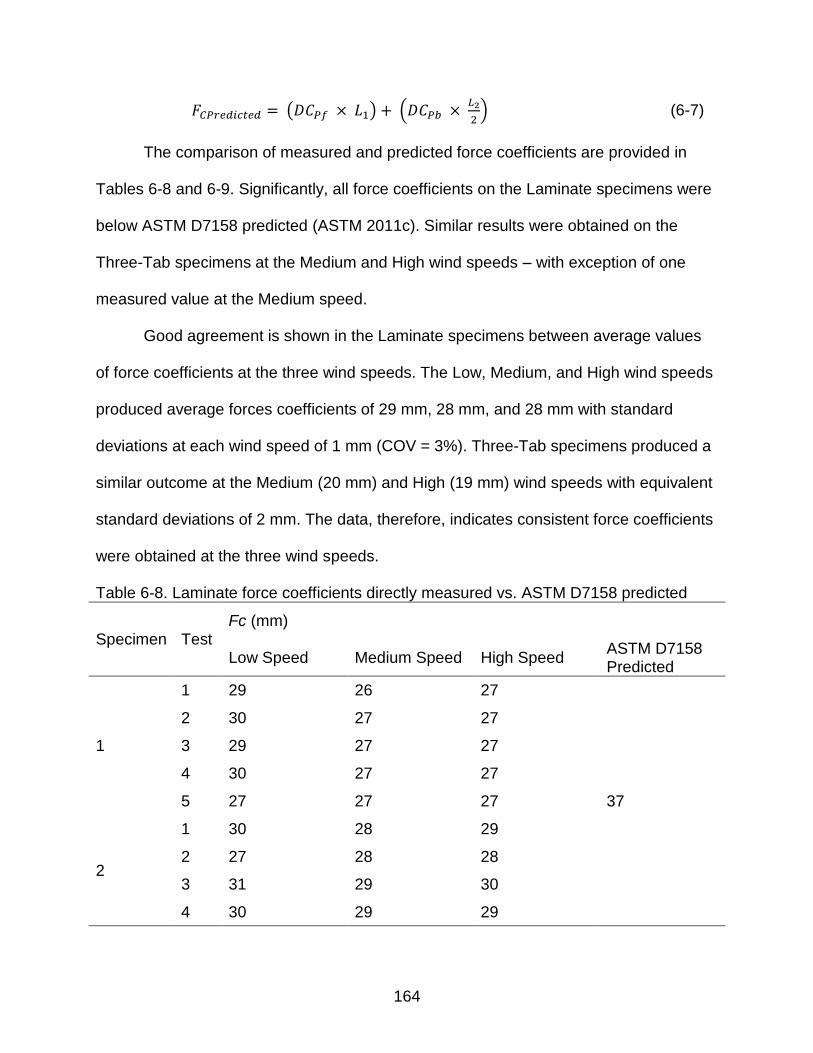
164
( ) (
) (6-7)
The comparison of measured and predicted force coefficients are provided in
Tables 6-8 and 6-9. Significantly, all force coefficients on the Laminate specimens were
below ASTM D7158 predicted (ASTM 2011c). Similar results were obtained on the
Three-Tab specimens at the Medium and High wind speeds – with exception of one
measured value at the Medium speed.
Good agreement is shown in the Laminate specimens between average values
of force coefficients at the three wind speeds. The Low, Medium, and High wind speeds
produced average forces coefficients of 29 mm, 28 mm, and 28 mm with standard
deviations at each wind speed of 1 mm (COV = 3%). Three-Tab specimens produced a
similar outcome at the Medium (20 mm) and High (19 mm) wind speeds with equivalent
standard deviations of 2 mm. The data, therefore, indicates consistent force coefficients
were obtained at the three wind speeds.
Table 6-8. Laminate force coefficients directly measured vs. ASTM D7158 predicted
Specimen Test Fc (mm)
Low Speed Medium Speed High Speed ASTM D7158 Predicted
1
1 29 26 27
37
2 30 27 27
3 29 27 27
4 30 27 27
5 27 27 27
2
1 30 28 29
2 27 28 28
3 31 29 30
4 30 29 29
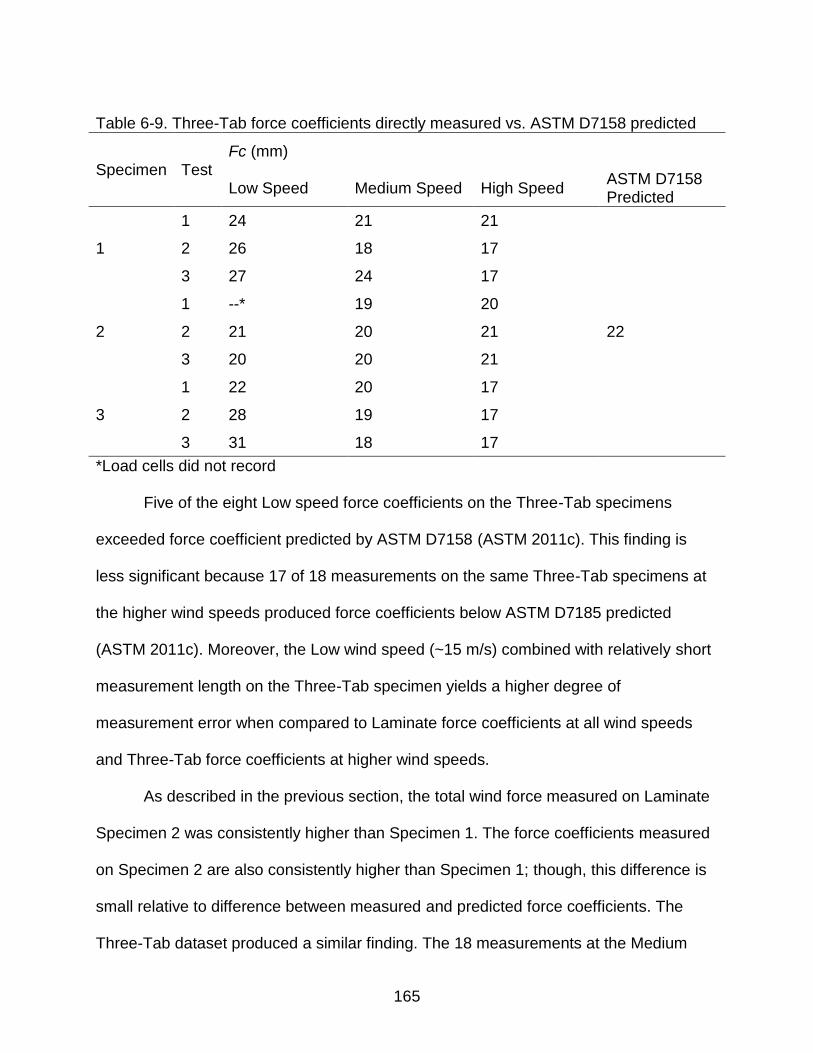
165
Table 6-9. Three-Tab force coefficients directly measured vs. ASTM D7158 predicted
Specimen Test Fc (mm)
Low Speed Medium Speed High Speed ASTM D7158 Predicted
1
1 24 21 21
22
2 26 18 17
3 27 24 17
2
1 --* 19 20
2 21 20 21
3 20 20 21
3
1 22 20 17
2 28 19 17
3 31 18 17
*Load cells did not record
Five of the eight Low speed force coefficients on the Three-Tab specimens
exceeded force coefficient predicted by ASTM D7158 (ASTM 2011c). This finding is
less significant because 17 of 18 measurements on the same Three-Tab specimens at
the higher wind speeds produced force coefficients below ASTM D7185 predicted
(ASTM 2011c). Moreover, the Low wind speed (~15 m/s) combined with relatively short
measurement length on the Three-Tab specimen yields a higher degree of
measurement error when compared to Laminate force coefficients at all wind speeds
and Three-Tab force coefficients at higher wind speeds.
As described in the previous section, the total wind force measured on Laminate
Specimen 2 was consistently higher than Specimen 1. The force coefficients measured
on Specimen 2 are also consistently higher than Specimen 1; though, this difference is
small relative to difference between measured and predicted force coefficients. The
Three-Tab dataset produced a similar finding. The 18 measurements at the Medium
166
and High wind speeds yielded a 10% coefficient of variation about the overall mean
force coefficient calculated at the Medium and High wind speeds (19.2 mm). Thus, force
coefficients do not appear to be heavily influenced individual test specimen. Additional
specimens are necessary to strengthen this conclusion.
As expected from the ASTM D7158 differential pressure coefficients stated for
each shingle type (ASTM 2011c), the Three-Tab specimens produced lower average
force coefficients than the Laminate at all three wind speeds. This demonstrates that the
directly measured results align with the load mechanism proposed by Peterka et al.
(1997). Figure 3-7 indicates that peak pressures exerted on a shingle change as a
function of approach wind direction; therefore, the reader is cautioned from
extrapolating this finding to wind passed over the shingle’s surface in other directions.
The differences between measured and predicted likely relate to the method for
measuring differential pressure coefficient measurement in ASTM D7158 (ASTM
2011c). Recall from Chapter 3, ASTM D7158 uses fully sealed shingles with artificially
raised leading edges that equal the vertical displacement estimated in a design-level
wind speed. Wind speeds at the ASTM D7158 Class H design-level are lower than
those used in this study (ASTM 2011c); therefore, the differential pressure coefficients
measured in ASTM D7158 are higher than those likely achieved in this study.
Partially unsealed shingle results – measured forces and moments
Tables 6-10 and 6-11 present the force and moment acting on the partially
sealed Laminate and Three-Tab sealant strips, respectively, stratified by measurement
axis, specimen number, and wind speed level. The mean values (μ) represent the
average force or moment acting on the adhered length of the sealant strip. Therefore,
the values are not directly comparable to the forces and moments of the fully sealed
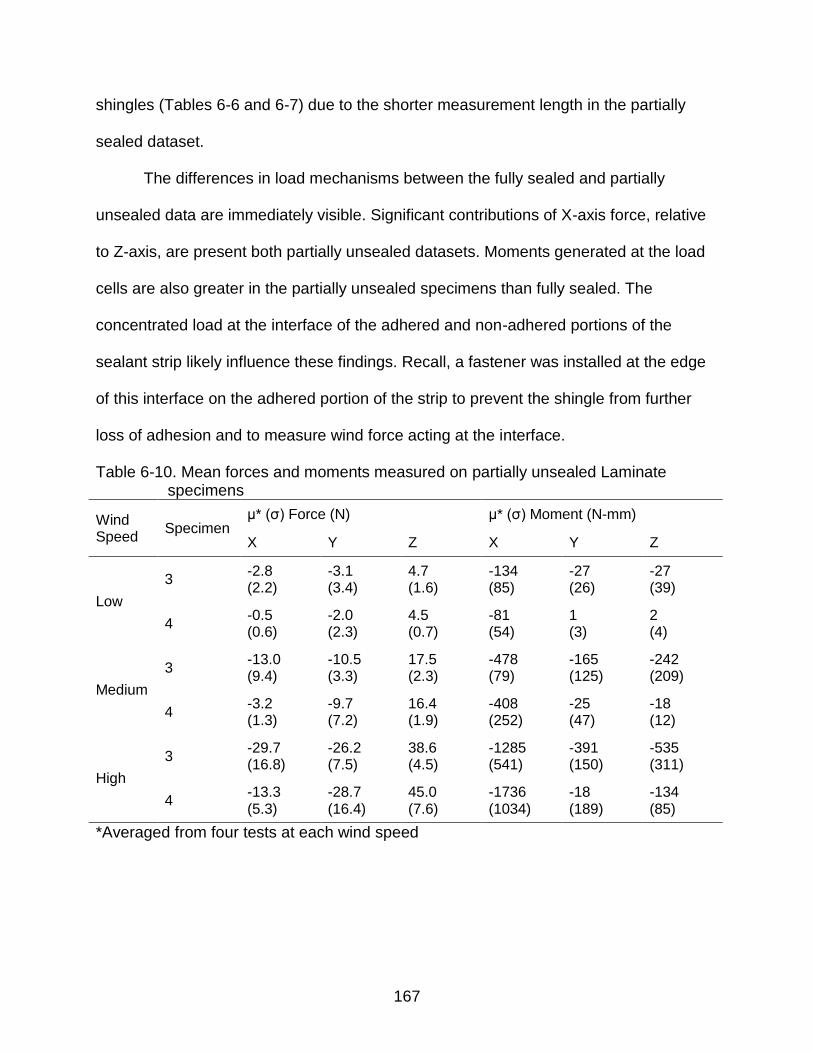
167
shingles (Tables 6-6 and 6-7) due to the shorter measurement length in the partially
sealed dataset.
The differences in load mechanisms between the fully sealed and partially
unsealed data are immediately visible. Significant contributions of X-axis force, relative
to Z-axis, are present both partially unsealed datasets. Moments generated at the load
cells are also greater in the partially unsealed specimens than fully sealed. The
concentrated load at the interface of the adhered and non-adhered portions of the
sealant strip likely influence these findings. Recall, a fastener was installed at the edge
of this interface on the adhered portion of the strip to prevent the shingle from further
loss of adhesion and to measure wind force acting at the interface.
Table 6-10. Mean forces and moments measured on partially unsealed Laminate specimens
Wind Speed
Specimen μ* (σ) Force (N) μ* (σ) Moment (N-mm)
X Y Z X Y Z
Low
3 -2.8 (2.2)
-3.1 (3.4)
4.7 (1.6)
-134 (85)
-27 (26)
-27 (39)
4 -0.5 (0.6)
-2.0 (2.3)
4.5 (0.7)
-81 (54)
1 (3)
2 (4)
Medium
3 -13.0 (9.4)
-10.5 (3.3)
17.5 (2.3)
-478 (79)
-165 (125)
-242 (209)
4 -3.2 (1.3)
-9.7 (7.2)
16.4 (1.9)
-408 (252)
-25 (47)
-18 (12)
High
3 -29.7 (16.8)
-26.2 (7.5)
38.6 (4.5)
-1285 (541)
-391 (150)
-535 (311)
4 -13.3 (5.3)
-28.7 (16.4)
45.0 (7.6)
-1736 (1034)
-18 (189)
-134 (85)
*Averaged from four tests at each wind speed
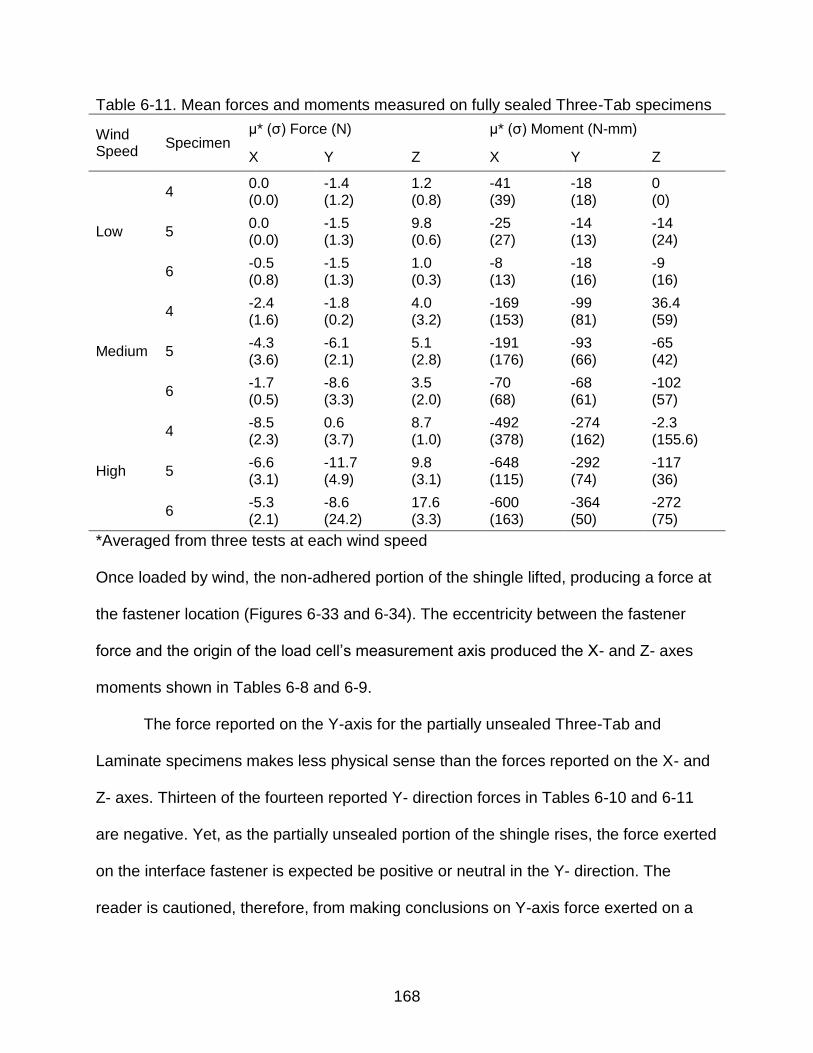
168
Table 6-11. Mean forces and moments measured on fully sealed Three-Tab specimens
Wind Speed
Specimen μ* (σ) Force (N) μ* (σ) Moment (N-mm)
X Y Z X Y Z
Low
4 0.0 (0.0)
-1.4 (1.2)
1.2 (0.8)
-41 (39)
-18 (18)
0 (0)
5 0.0 (0.0)
-1.5 (1.3)
9.8 (0.6)
-25 (27)
-14 (13)
-14 (24)
6 -0.5 (0.8)
-1.5 (1.3)
1.0 (0.3)
-8 (13)
-18 (16)
-9 (16)
Medium
4 -2.4 (1.6)
-1.8 (0.2)
4.0 (3.2)
-169 (153)
-99 (81)
36.4 (59)
5 -4.3 (3.6)
-6.1 (2.1)
5.1 (2.8)
-191 (176)
-93 (66)
-65 (42)
6 -1.7 (0.5)
-8.6 (3.3)
3.5 (2.0)
-70 (68)
-68 (61)
-102 (57)
High
4 -8.5 (2.3)
0.6 (3.7)
8.7 (1.0)
-492 (378)
-274 (162)
-2.3 (155.6)
5 -6.6 (3.1)
-11.7 (4.9)
9.8 (3.1)
-648 (115)
-292 (74)
-117 (36)
6 -5.3 (2.1)
-8.6 (24.2)
17.6 (3.3)
-600 (163)
-364 (50)
-272 (75)
*Averaged from three tests at each wind speed Once loaded by wind, the non-adhered portion of the shingle lifted, producing a force at
the fastener location (Figures 6-33 and 6-34). The eccentricity between the fastener
force and the origin of the load cell’s measurement axis produced the X- and Z- axes
moments shown in Tables 6-8 and 6-9.
The force reported on the Y-axis for the partially unsealed Three-Tab and
Laminate specimens makes less physical sense than the forces reported on the X- and
Z- axes. Thirteen of the fourteen reported Y- direction forces in Tables 6-10 and 6-11
are negative. Yet, as the partially unsealed portion of the shingle rises, the force exerted
on the interface fastener is expected be positive or neutral in the Y- direction. The
reader is cautioned, therefore, from making conclusions on Y-axis force exerted on a
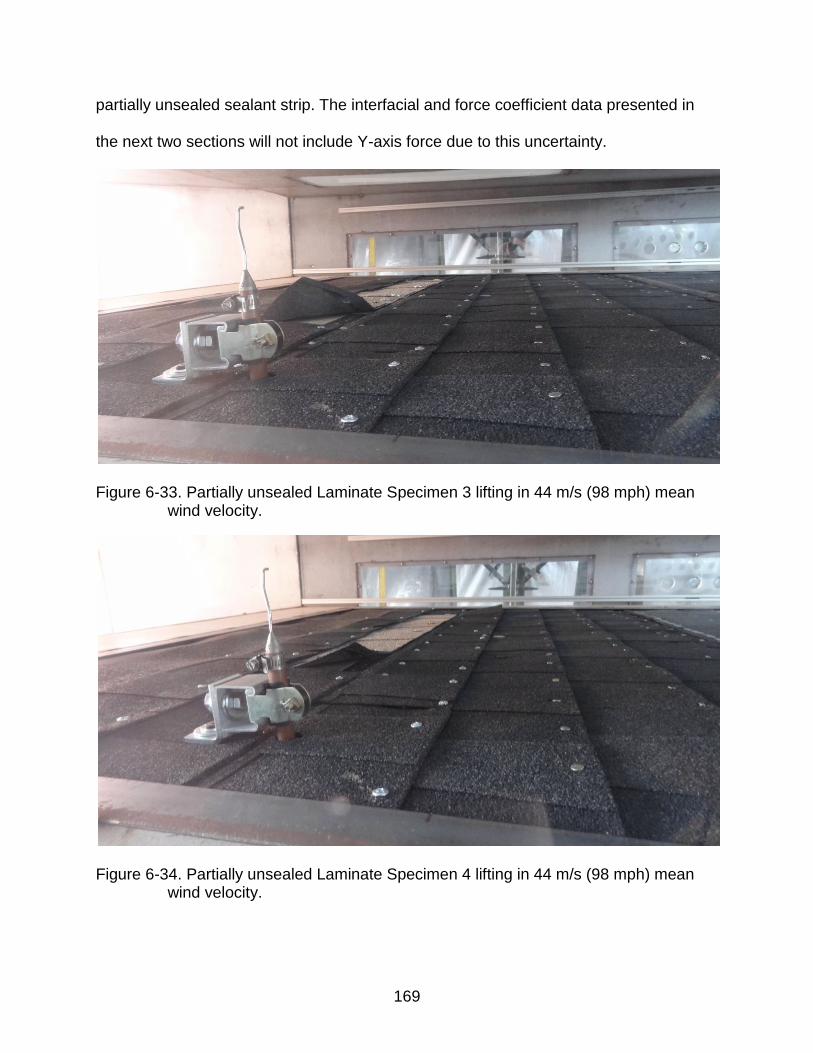
169
partially unsealed sealant strip. The interfacial and force coefficient data presented in
the next two sections will not include Y-axis force due to this uncertainty.
Figure 6-33. Partially unsealed Laminate Specimen 3 lifting in 44 m/s (98 mph) mean wind velocity.
Figure 6-34. Partially unsealed Laminate Specimen 4 lifting in 44 m/s (98 mph) mean
wind velocity.
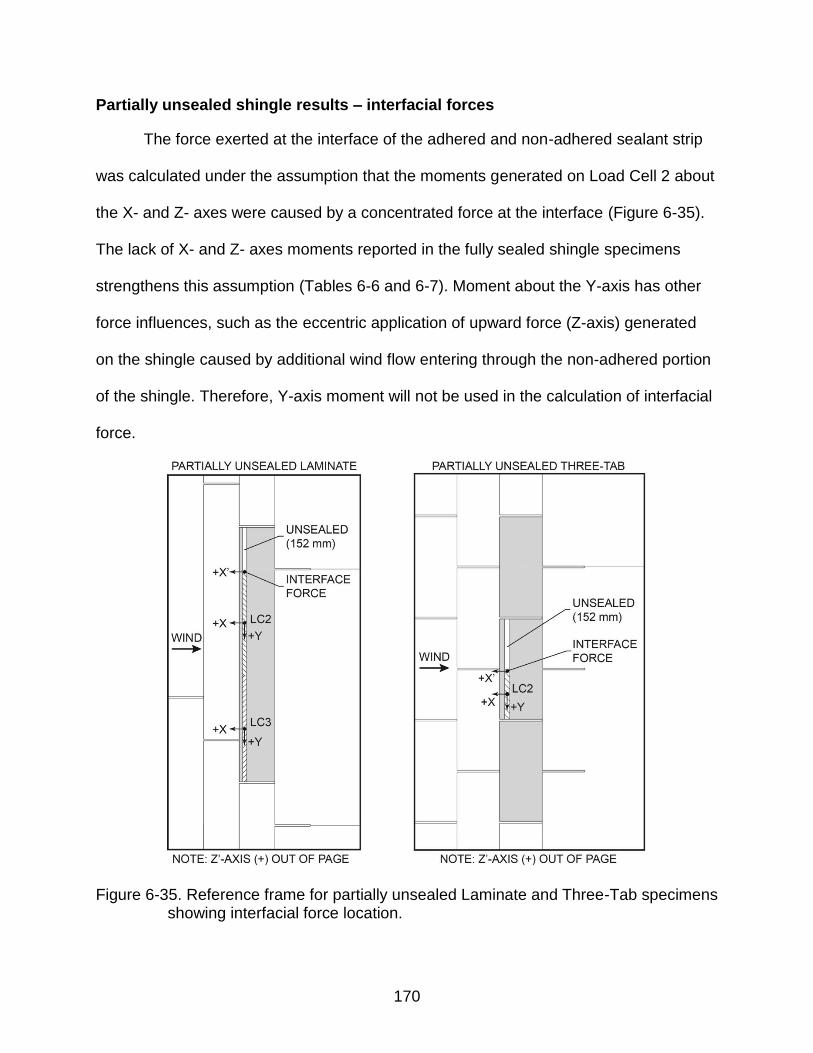
170
Partially unsealed shingle results – interfacial forces
The force exerted at the interface of the adhered and non-adhered sealant strip
was calculated under the assumption that the moments generated on Load Cell 2 about
the X- and Z- axes were caused by a concentrated force at the interface (Figure 6-35).
The lack of X- and Z- axes moments reported in the fully sealed shingle specimens
strengthens this assumption (Tables 6-6 and 6-7). Moment about the Y-axis has other
force influences, such as the eccentric application of upward force (Z-axis) generated
on the shingle caused by additional wind flow entering through the non-adhered portion
of the shingle. Therefore, Y-axis moment will not be used in the calculation of interfacial
force.
Figure 6-35. Reference frame for partially unsealed Laminate and Three-Tab specimens showing interfacial force location.
171
Tables 6-12 through 6-16 summarize the measured mean X- and Z- axes
moments – origin at Load Cell 2 – and the estimate of interface forces on the X’- and Z’-
axes – origin at interface shown in Figure 6-35 – for all tests on the Laminate and
Three-Tab specimens. The analysis confirms that the loss of adhesion along a partial
length of the sealant strip introduces significant wind force at the interface between the
adhered and non-adhered portions of the sealant strip. Reported estimates of interfacial
force make physical sense, as force is consistently reported in the vertical (+Z’) and in-
plane flow-wise (-X’) directions. Given this, the interfacial peel-force mechanism
proposed in the Knowledge Gaps section exists on partially unsealed shingles.
The variability of interfacial forces generated during similar wind speeds is likely
caused by differences in material flexibility. For example, Laminate Specimen 4 was two
times thicker than Laminate Specimen 3, due to the location of the relief pattern used on
Laminate shingles. As wind was passed over the shingles at the High speed, the non-
adhered portion of Specimen 4 was deflected upward, while the more flexible non-
adhered portion of Specimen 3 folded backwards. For Laminate Specimen 3, the High
wind speed (~44 m/s) produced an average X’-axis interface force of -3.7±0.2 N and the
average Z’-axis interface force of 3.9±0.3 N. Conversely, Laminate Specimen 4 at the
High wind speed had an average X’-axis interface force of -1.0±0.1 N and the average
Z’-axis interface force of 10.6±1.7 N. Thus, less total force was exerted at the interface
of the relatively flexible Laminate Specimen 3 in comparison to the more rigid Specimen
4.
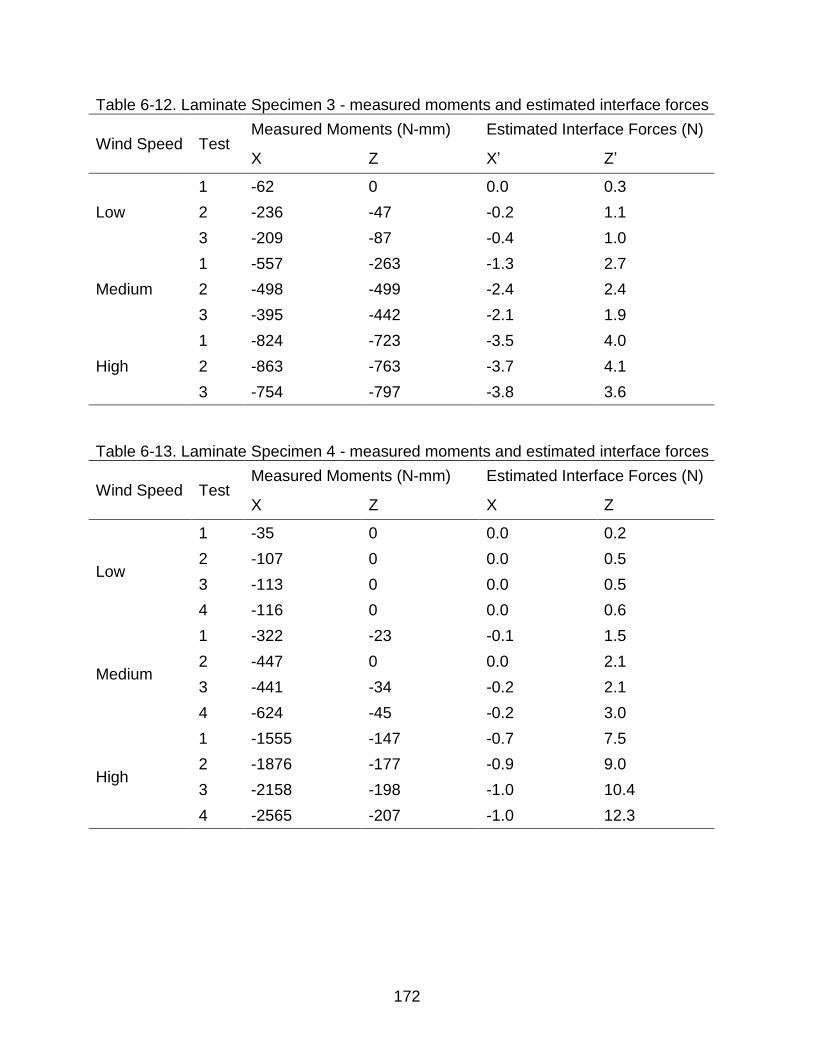
172
Table 6-12. Laminate Specimen 3 - measured moments and estimated interface forces
Wind Speed Test Measured Moments (N-mm) Estimated Interface Forces (N)
X Z X’ Z’
Low
1 -62 0 0.0 0.3
2 -236 -47 -0.2 1.1
3 -209 -87 -0.4 1.0
Medium
1 -557 -263 -1.3 2.7
2 -498 -499 -2.4 2.4
3 -395 -442 -2.1 1.9
High
1 -824 -723 -3.5 4.0
2 -863 -763 -3.7 4.1
3 -754 -797 -3.8 3.6
Table 6-13. Laminate Specimen 4 - measured moments and estimated interface forces
Wind Speed Test Measured Moments (N-mm) Estimated Interface Forces (N)
X Z X Z
Low
1 -35 0 0.0 0.2
2 -107 0 0.0 0.5
3 -113 0 0.0 0.5
4 -116 0 0.0 0.6
Medium
1 -322 -23 -0.1 1.5
2 -447 0 0.0 2.1
3 -441 -34 -0.2 2.1
4 -624 -45 -0.2 3.0
High
1 -1555 -147 -0.7 7.5
2 -1876 -177 -0.9 9.0
3 -2158 -198 -1.0 10.4
4 -2565 -207 -1.0 12.3
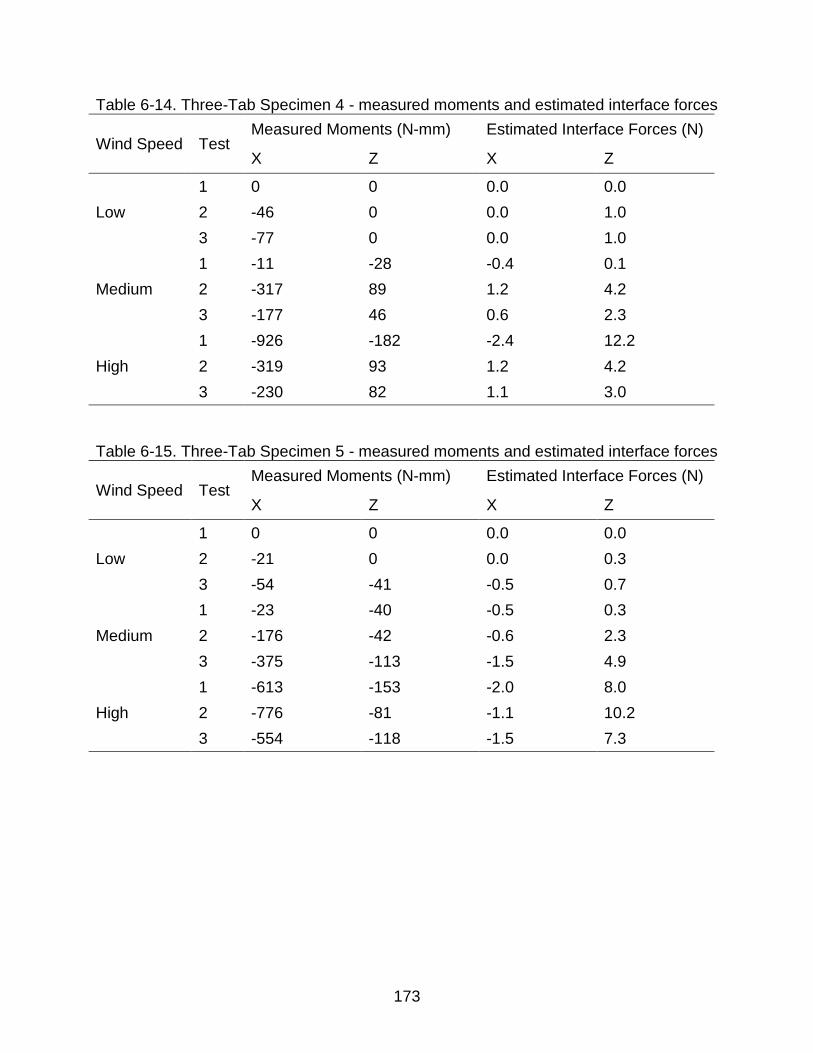
173
Table 6-14. Three-Tab Specimen 4 - measured moments and estimated interface forces
Wind Speed Test Measured Moments (N-mm) Estimated Interface Forces (N)
X Z X Z
Low
1 0 0 0.0 0.0
2 -46 0 0.0 1.0
3 -77 0 0.0 1.0
Medium
1 -11 -28 -0.4 0.1
2 -317 89 1.2 4.2
3 -177 46 0.6 2.3
High
1 -926 -182 -2.4 12.2
2 -319 93 1.2 4.2
3 -230 82 1.1 3.0
Table 6-15. Three-Tab Specimen 5 - measured moments and estimated interface forces
Wind Speed Test Measured Moments (N-mm) Estimated Interface Forces (N)
X Z X Z
Low
1 0 0 0.0 0.0
2 -21 0 0.0 0.3
3 -54 -41 -0.5 0.7
Medium
1 -23 -40 -0.5 0.3
2 -176 -42 -0.6 2.3
3 -375 -113 -1.5 4.9
High
1 -613 -153 -2.0 8.0
2 -776 -81 -1.1 10.2
3 -554 -118 -1.5 7.3
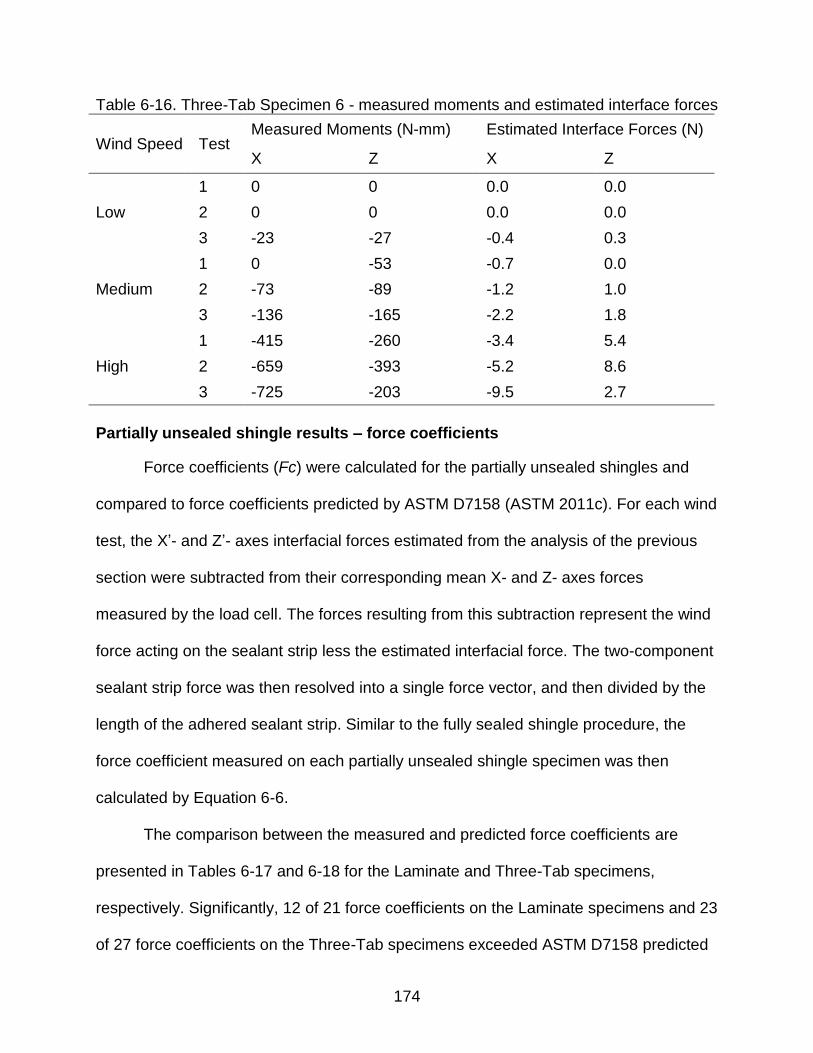
174
Table 6-16. Three-Tab Specimen 6 - measured moments and estimated interface forces
Wind Speed Test Measured Moments (N-mm) Estimated Interface Forces (N)
X Z X Z
Low
1 0 0 0.0 0.0
2 0 0 0.0 0.0
3 -23 -27 -0.4 0.3
Medium
1 0 -53 -0.7 0.0
2 -73 -89 -1.2 1.0
3 -136 -165 -2.2 1.8
High
1 -415 -260 -3.4 5.4
2 -659 -393 -5.2 8.6
3 -725 -203 -9.5 2.7
Partially unsealed shingle results – force coefficients
Force coefficients (Fc) were calculated for the partially unsealed shingles and
compared to force coefficients predicted by ASTM D7158 (ASTM 2011c). For each wind
test, the X’- and Z’- axes interfacial forces estimated from the analysis of the previous
section were subtracted from their corresponding mean X- and Z- axes forces
measured by the load cell. The forces resulting from this subtraction represent the wind
force acting on the sealant strip less the estimated interfacial force. The two-component
sealant strip force was then resolved into a single force vector, and then divided by the
length of the adhered sealant strip. Similar to the fully sealed shingle procedure, the
force coefficient measured on each partially unsealed shingle specimen was then
calculated by Equation 6-6.
The comparison between the measured and predicted force coefficients are
presented in Tables 6-17 and 6-18 for the Laminate and Three-Tab specimens,
respectively. Significantly, 12 of 21 force coefficients on the Laminate specimens and 23
of 27 force coefficients on the Three-Tab specimens exceeded ASTM D7158 predicted
175
force coefficients (ASTM 2011c). Laminate Specimen 1 produced the most consistent
results, showing the distributed forces exerted on the sealant strip at the Medium and
High wind speeds were, on average, 44% higher than predicted by ASTM D7158
(ASTM 2011c) for a fully sealed Laminate shingle.
Test 1 on Laminate Specimen 3 exemplifies the mechanism driving the increase
in distributed force. For this case, the non-adhered portion of the shingle remained
horizontal during the Low wind speed test. During the Medium wind test, the non-
adhered portion lifted, allowing wind to enter underside of the test specimen leeward the
sealant strip where pressure then developed on the underside of the test specimen. The
resultant force coefficients, therefore, increased from 16 mm during the Low wind speed
test to 58 mm in the High wind speed test.
More confidence can be given to the Laminate force coefficients than Three-Tab.
The average Laminate specimen force coefficients at each wind speed were 28 mm
(Low wind speed), 37 mm (Medium wind speed), and 53 mm (High wind speed).
Laminate standard deviations at each wind speed were 13 mm, 12 mm, 6 mm. Contrast
this with the Three-Tab specimens, where average force coefficients measured at the
three wind speeds were 39 mm (Low wind speed), 43 mm (Medium wind speed), and
51 mm (High wind speed). Yet, standard deviations were 19 mm (Low wind speed), 29
mm (Medium wind speed), and 22 mm (High wind speed). One potential source of
variability in the Three-Tab dataset comes from the subtraction of interfacial forces
during the computation of force coefficients. The magnitude of interfacial forces relative
to the magnitude of the total force exerted on the sealant strip was higher in the Three-
Tab specimens than the magnitude relativities in the Laminate specimens. Thus,
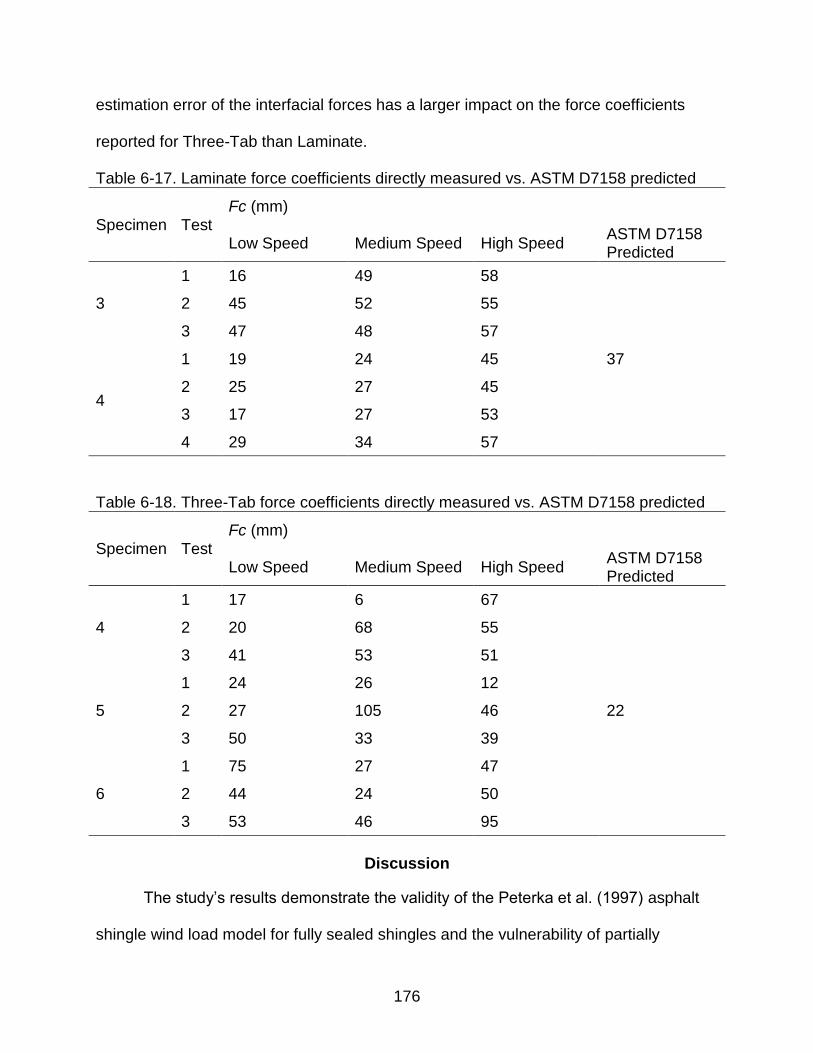
176
estimation error of the interfacial forces has a larger impact on the force coefficients
reported for Three-Tab than Laminate.
Table 6-17. Laminate force coefficients directly measured vs. ASTM D7158 predicted
Specimen Test Fc (mm)
Low Speed Medium Speed High Speed ASTM D7158 Predicted
3
1 16 49 58
37
2 45 52 55
3 47 48 57
4
1 19 24 45
2 25 27 45
3 17 27 53
4 29 34 57
Table 6-18. Three-Tab force coefficients directly measured vs. ASTM D7158 predicted
Specimen Test Fc (mm)
Low Speed Medium Speed High Speed ASTM D7158 Predicted
4
1 17 6 67
22
2 20 68 55
3 41 53 51
5
1 24 26 12
2 27 105 46
3 50 33 39
6
1 75 27 47
2 44 24 50
3 53 46 95
Discussion
The study’s results demonstrate the validity of the Peterka et al. (1997) asphalt
shingle wind load model for fully sealed shingles and the vulnerability of partially
177
unsealed shingles in wind. For fully sealed shingles, the average force coefficient
measured on the Laminate specimens were 23% lower than predicted by ASTM D7158
(ASTM 2011c), while the average force coefficient measured on the Three-Tab
specimens at the Medium and High wind speeds were 12% lower than predicted.
Moreover, as predicted by the Peterka et al. (1997) load model, the average force
coefficients measured on the fully sealed Laminate specimens were greater than Three-
Tab.
The conservatism of ASTM D7158 displayed in this study is expected, as
instrumented test specimens in ASTM D7158 contain artificially raised leading edges
corresponding to the tip deflection at design-level wind speed (ASTM 2011c). This, in
turn, leads to differential pressure coefficients reported in ASTM D7158 (ASTM 2011c)
that are higher than what would be expected at lower wind speeds used in this study.
The reader is cautioned from extrapolating the present study’s results to all directions of
wind. As shown in Figure 3-7, peak differential pressures exerted on an instrumented
shingle installed on a test home varied as a function of wind direction. Furthermore, the
peak differential pressure measured on the shingle did not align with the wind direction
used in this study. Additional work is recommended to measure sealant strip wind force
at other wind directions.
The second major finding of this study is the further confirmation of the
vulnerability of partially unsealed shingles in wind. As was demonstrated in Chapter 4
and shown in the present study, two damaging mechanisms occur in wind for shingles
with a partial loss of adhesion. First, a measurable force is exerted at the interface
between the adhered and non-adhered portions of the sealant strip. Interfacial force
178
was estimated in this study in the flow-wise and vertical directions. Results indicate
interfacial force exists in both planes. Second, the distributed force exerted on the
adhered portion remaining on the sealant strip increases – triggered by the vertical
deflection of the unsealed portion of the shingle. Once deflected, wind flow enters the
underside of the shingle, pressurizing the shingle’s bottom surface. Significantly, the
distributed force measured on the partially unsealed Laminate specimens at the High
wind speed was 41% greater than predicted by ASTM D7158 for a fully sealed shingle
(ASTM 2011c).
Significant Findings
In this study, the force and moment on a shingle’s sealant strip was directly
measured in three-dimensions as wind was passed over shingle test specimens. Wind
was oriented perpendicular to the specimen’s leading edge. Test specimens included
one three-tab style shingle (Three-Tab) and one laminate style shingle (Laminate). Two
adhesion conditions were tested: (1) adhered along a complete length of sealant strip
(fully sealed) and (2) adhered along a partial length of sealant strip (partially unsealed).
The length and location where not adhered in condition (2) matched the length and
location of partially unsealed shingles identified in Chapter 4. Three objectives were
achieved with this research.
First, the load exerted on a fully sealed shingle’s sealant strip is predominantly
vertical with minor contributions of force in-plane with the sealant strip in the flow-wise
direction. The average resolved force vector was 78° from horizontal on Laminate and
86° from horizontal on Three-Tab. The load exerted on the adhered portion of a
partially unsealed shingle sealant strips is characterized by an increased contribution of
179
force in-plane in the streamwise direction. Additionally, a force is exerted on the sealant
strip at the interface of the adhered and non-adhered portions of the sealant strip.
Vertical and in-plane flow-wise forces were measured at this interface.
Second, measured values of total force on the test specimen’s sealant strip
length were compared to total forces predicted by the ASTM D7158 shingle wind design
standard (ASTM 2011c). Results demonstrate that ASTM D7158 (ASTM 2011c) and the
underlying Peterka et al. (1997) load model are conservative in sealant strip force
prediction for shingles with full adhesion along their length. The average force
measured on Laminate was 23% lower than predicted by ASTM D7158 (ASTM 2011c),
while the average force on Three-Tab at the two highest mean wind speeds used in the
study was 12% lower than predicted by ASTM D7158 (ASTM 2011c). However, results
demonstrate that ASTM D7158 test standard (ASTM 2011c) is not conservative when
predicting the distributed force exerted on partially unsealed shingles. For example, the
average distributed force exerted on the partially unsealed Laminate specimens in
approximately 44 m/s wind was 44% higher than the distributed force predicted by
ASTM D7158 (ASTM 2011c). The increased load is caused by the vertical deflection of
the unsealed portion shingle allowing wind flow into the underside of the shingle.
Third, the effect of changes in mean wind speed on induced loads through the
sealant strip was quantified by passing wind over the specimens at three mean speeds
(15 m/s, 30 m/s, and 44 m/s). Measured distributed sealant strip forces were normalized
by wind velocity 25 mm above the test specimen to produce a coefficient of force
independent of wind speed. For the fully sealed Laminate specimens, the three wind
speeds produced average forces coefficients of 29 mm, 28 mm, and 28 mm with
180
standard deviations at each wind speed of 1 mm. Three-Tab specimens produced a
similar outcome at the 30 m/s (20 mm) and 44 m/s (19 mm) wind speeds with
equivalent standard deviations of 2 mm. The data, therefore, indicates consistent force
coefficients were obtained at the three wind speeds.
The results of the present study and Chapter 4 demonstrate that partially
unsealed shingles exist on current homes in the residential building stock and that such
homes are more vulnerable to wind damage than homes without partially unsealed
shingles. Two damage mechanisms are proposed for partially unsealed asphalt
shingles subjected to wind. The first mechanism involves the application of force at the
interface between the adhered and non-adhered portions of the sealant strip. The
second mechanism involves the increased distributed load exerted on the sealant strip
caused by the pressurization of shingle’s bottom surface, leeward the sealant strip.
181
CHAPTER 7 CONCLUSIONS AND RECOMMENDATIONS
The research presented in this dissertation focuses on the identification of
mechanisms initiating the continued failure of asphalt shingle roof systems in wind. The
mechanisms evaluated in this research are described below with analysis based on the
findings from the five studies comprising this dissertation. Recommendations for future
research on the wind resistance of shingle roofing and other discontinuous roofing
materials are provided.
Conclusions on the Causes of Wind Damaged Asphalt Shingle Roofing
Partially Unsealed Shingles
The most significant and unexpected finding from this research is the occurrence
and wind vulnerability of partially unsealed shingles installed in the field, hip, and ridge
locations of the roof. Based upon the findings developed from this dissertation’s
research, there is a high degree of confidence that partially unsealed shingles installed
in the field, hip and ridge locations of the roof contribute significantly to the wind
damage of asphalt shingle roofs.
As part of this research, thirty homes were surveyed in Florida and Texas for
unsealed asphalt shingles. Twenty-two of the homes (73%) contained partially unsealed
shingles in the field locations of the roofs. All roofs surveyed Florida roofs had partially
unsealed hip or ridge shingles. Partially unsealed shingles observed in the field
locations of the roofs had systematic locations of unseal (see Figures 4-2 and 4-3) and
failure mode where unsealed (cohesive fracture in the sealant strip). Partially unsealed
shingles in the hip and ridge locations were also systematic, but their mode of failure
182
where unsealed was different from those in the field of the roof (adhesive failure
between the sealant strip and overlying hip or ridge shingle).
The cause of partially unsealed shingles in the field of the roof was not fully
identified in this research; though, long-term weathering effects, as opposed to wind,
are the likely cause. First, the failure mode of partially unsealed shingles indicates that
shingles were fully adhered prior to the loss of adhesion. Second, a statistically
significant difference in the mean total quantity of unsealed shingles was established
between roofs with ages 0-6 and those 7-13 and 14-20. Thus, the total quantity of
partially unsealed shingles on a given roof increased with roof age. Third, H*Wind
analysis of historical tropical cyclone-induced gust wind speeds on each survey roof
indicated that peak near-roof speeds were below wind speeds used in historical product
approval tests. Future work related to the identification of specific mechanisms causing
partially unsealed shingles in the field of the roof are given in the recommendations
section.
The vulnerability of partially unsealed shingles installed in the field of the roof to
wind damage was demonstrated in two studies detailed in this dissertation. First, 17 full-
scale asphalt shingle roof systems were subjected to a turbulent boundary layer wind
flow with speeds up to 54 m/s. Prior to the test, roofs were surveyed for unsealed
shingles and, where unsealed, location on the roof was recorded. Wind test results
showed that all damage in the field of the roof initiated from shingles that were found
unsealed prior to the wind test or lifted shingles at eave and rake roof locations. Fully
sealed shingles remained fully sealed and undamaged in all tests, unless damaged by
183
adjacent pre-wind unsealed or lifted eave and rake shingles. Damage to the pre-wind
unsealed shingles consisted of blow off, folding, and tearing.
A second study measured the wind force exerted on sealant strip of partially
unsealed three-tab and laminate-style asphalt shingles. Two load conditions were
measured on the partially unsealed shingles that likely contribute to an increased
vulnerability to wind damage. First, a concentrated force was measured at the interface
between the adhered and non-adhered portions of the sealant strip. This force existed
in the vertical and in-plane flow-wise directions. Second, the distributed force on the
adhered portion of the sealant strip was measured as greater than measurements on
specimens with complete adhesion along their leading edge length and distributed force
predicted by ASTM D7158 (ASTM 2011c).
For shingles on hip and ridge locations, a relationship between age and the
amount of unsealed hip and ridge shingles was not established from the survey results.
The findings of this research indicate that unsealed hip and ridge shingles are caused
by folding the shingle over the hip or ridge line during installation. Post-hurricane
damage reports from the past decade have found similar adhesion issues with hip and
ridge shingles.
Partially unsealed hip and ridge shingles were found on eight hip roof specimens
used as part of the full-scale experiment described above. Blow off of hip shingles
occurred on all eight roofs. Significantly, blow off on all hip roofs initiated from the lifting
and subsequent blow off of pre-wind partially unsealed shingles.
Effect of Aging on Wind Resistance
Two studies detailed in this dissertation were devoted to the measurement of
wind resistance of asphalt shingles exposed to weathering. The findings of this research
184
indicate that weather-induced reductions in uplift resistance cannot be ruled out as a
potential contributor in wind damage to shingle roofing. However, its contribution to
historical wind damage is not as likely as partially unsealed shingles naturally occurring
on the roof. Supporting analysis is provide below and recommendations for strengthen
this conclusion are provided in the recommendations section.
Weather-induced reductions cannot be ruled out because a statistically
significant reduction in mean ASTM D6381 uplift resistance (ASTM 2008b) was
observed between non-aged and artificially aged shingles in one of the three products
used in the research. For the same product where significant reductions were observed,
the predominate mode of failure in the uplifted shingles also changed throughout the
exposure time. This finding is tempered, though, due to the response of other two
products evaluated in the artificial aging study. Statistically similar or significant
increases in mean ASTM D6381 Procedures A and B uplift resistance (ASTM 2008b)
were found in the two products when the non-aged and artificially aged specimens were
compared.
Significantly, the mean and minimum ASTM D7158 wind resistance (ASTM
2011c) of all three artificially aged products at all exposure time intervals in both artificial
methods exceeded the wind resistance required to meet the most stringent ASTM
D7158 wind resistance classification (H) (ASTM 2011c). The second study performed
as part of this research topic addressed the wind resistance of four asphalt shingle roofs
exposed to over nine years of natural weathering. Similar to the findings of the artificial
study, the naturally aged roofs had sufficient uplift capacity to meet an ASTM D7158
185
Class H (ASTM 2011c), as estimated from differential pressure coefficients reported in
Peterka et al. (1997).
ASTM D7158 and the Load Model for Asphalt Shingles
ASTM D7158 (ASTM 2011c) is the most commonly used asphalt shingle wind
resistance metric in industry, product approval (e.g., Miami-Dade), and building codes
(e.g., International Residential Code). The work presented in this dissertation and in
companion document by the author (Dixon et al., 2013) represents the first independent
study of ASTM D7158 (ASTM 2011c) and the load model underpinning the test method
(Peterka et al., 1997). Conclusions presented below are positive in regards to the
accuracy of ASTM D7158, though, they should not be regarded as a full validation of
ASTM D7158 and the load model.
Results from this initial work indicate ASTM D7158 (ASTM 2011c) produces an
accurate and potentially conservative portrayal of peak wind speeds above a common
shingle roof and wind-induced forces on the shingle’s sealant strip (i.e., the wind load
path). Distribution of peak wind speeds measured in full-scale 25 mm (1 in) above a
6:12 single-story building in the IBHS Research Center aligned with those collected in
model-scale presented in Cochran et al. (1999) and Peterka et al. (1997). Dixon et al.
(2013a) found an upper bound ratio of peak near-roof wind velocity to mean approach
velocity of 2.5, equivalent to the bound value proposed by Cochran et al. (1999) and
Peterka et al. (1997). More importantly, the 2.5 factor serves as the gust factor for near
roof wind speeds in ASTM D7158 (ASTM 2011c). In other words, peak wind speeds
critical to the definition of wind forces on asphalt shingles appear accurate for simple
shaped roof systems.
186
The second major finding from this work – reported in Chapter 6 – indicates
ASTM D7158 (ASTM 2011c) produces a conservative estimate of distributed wind force
acting on the sealant strip of a fully sealed common three-tab and laminate asphalt
shingles. Moreover, this research measured a force mechanism acting on the sealant
strip similar to that predicted by ASTM D7158 (ASTM 2011c). Thus, the magnitude and
application of wind force acting on a fully sealed asphalt shingle appears accurately
defined within ASTM D7158 (ASTM 2011c).
The research conducted by the author represents the first step towards a better
understanding of wind loads on shingle roofing. The initial work addressed the accuracy
of ASTM D7158 (ASTM 2011c) within the scope defined by the test methods underlying
load model proposed in Peterka et al. (1997). That is, wind over a common shape
building with flow oriented normal to the shingle’s leading edge. Wind directions other
than normal to the leading edge were not addressed herein, but are recommended in
future work based upon findings of peak pressures on shingle roofing occurring in wind
roughly parallel to the leading edge, as reported in Peterka et al. (1997). Additional work
also remains on wind speeds over complex roof shapes common to modern homes.
ASTM D7158 Design Methodology
For shingles in the field of the roof, ASTM D7158 (ASTM 2011c) classifies wind
resistance based upon a mean ASTM D6381 (ASTM 2008b) wind uplift resistance (20
specimens) to a peak design-level wind force. As shown in Chapter 5, the resistance of
the shingle’s sealant strip has a particular (and undefined to date) distribution about its
mean. The question that remains is whether mean resistance in comparison to peak
force produces an acceptable definition of resistance in a shingle roof system.
Moreover, resistance at hip, ridge, eave, and rake locations on the roof are not
187
considered in ASTM D7158. Repeated observations of wind damage at these locations
found in this research and in post-hurricane damage reports motivate the incorporation
of all system components in wind resistance classification process. A unified method for
system resistance and a precise definition of acceptable performance based upon a
Load and Resistance Factored Design methodology is recommended.
Eave and Rake
Eave and rake shingles are among the most common forms of wind damage to
asphalt shingle roofing. Installation error is most frequently cited cause in post-hurricane
reports. The wind resistance of eave and rake edge details was assessed in this
research as part of the full-scale wind tunnel study at the IBHS Research Center.
Results were discussed briefly in Chapter 4 and are expand upon in Dixon et al. (2013).
Eave and rake shingle pull-through at attachment points were observed on nearly
all roofs evaluated at IBHS. This was typically initiated by installation error (i.e., nails
placed outside of manufacturer specification). However, edge details are prescriptively
specified by shingle manufacturers and/or local building codes, rather than directly
evaluated through performance testing methods (e.g., ASTM, UL, etc.). It is therefore
difficult to assess proper installation guidelines for rake and eave attachment details.
‘Enhanced’ edge details, such as the addition of asphalt roof cement along the rake and
eave, are available, but, to the author’s knowledge, their performance has not been
measured.
Recommendations for Future Research
The findings culled from this research strongly indicate that without action, loss of
shingle roof coverings will continue as the leading cause of residential property damage
in hurricane winds. The most significant opportunity for risk reduction identified from this
188
research involves partially unsealed shingles in the field, hip, and ridge locations. Two
parallel efforts must take place to abate their occurrence. First, identify the cause of
partially unsealed shingles. Second, develop reliable retrofit techniques for existing
roofs containing partially unsealed shingles.
For shingles in the field of the roof, natural weathering is the most likely source of
partial unsealing. Marshall et al.’s (2010) proposition of long-term expansion and
contraction in the shingle system is a starting place for future research. Part of this work
should include an improved understanding of the long-term properties of the shingle’s
constitutive elements. Emphasis should be placed on the sealant strip, as the mode of
failure in partially unsealed field shingles was a cohesive fracture in the sealant strip.
For partially unsealed hip and ridge shingles, future research should focus on
installation methods and new products that increase the likelihood of adhesion on the
downslope edge of the shingle.
Retrofit techniques for unsealed field, hip, and ridge shingles are given in FEMA
P-499 (2012). The technique involves the application of asphalt roofing cement in 25
mm (1 in) dollops along the leading edges of unsealed asphalt shingles. Large-scale
implementation is questioned due to known blistering effects when excessive
application occurs.
189
LIST OF REFERENCES
Abraham, H. (1920). Asphalts and Allied Substances, D. Van Nostrand Company, New York, Ny.
Applied Research Associates. (2008). 2008 Florida Residential Wind Loss Mitigation
Study, Florida Office of Insurance Regulation, Tallahassee, Fl. ARMA (2006). Asphalt Roofing Residential Manual, The Asphalt Roofing Manufacturers
Association, Washington, D.C. ARMA (2011). The Bitumen Roofing Industry – A Global Perspecitve, The Asphalt
Roofing Manufactuers Association, Washington, D.C. ASCE (2002). “ASCE standard, mimimum design loads for buildings and other
structures.” ASCE 7-02, Reston, Va. ASCE (2005). “ASCE standard, mimimum design loads for buildings and other
structures.” ASCE 7-05, Reston, Va. ASCE (2010). “ASCE standard, mimimum design loads for buildings and other
structures.” ASCE 7-10, Reston, Va. ASTM. (2000). “Standard practice for exposing nonmetallic materials in accelerated test
devices that use laboratory light sources.” G151-00, West Conshohocken, Pa. ASTM. (2004). “Standard practice for dark oven heat exposure of bituminous materials.”
D5869-04, West Conshohocken, Pa. ASTM. (2006). “Standard practice for operating fluorescent light apparatus for uv
exposure of nonmetallic materials.” G154-06, West Conshohocken, Pa. ASTM. (2008a). “Standard practice for accelerated weathering test conditions and
procedures for biduminous materials (fluorescent uv, water spray, and condensation method).” D4799-08, West Conshohocken, Pa.
ASTM. (2008b). “Standard test method for measurement of asphalt shingles mechanical
uplift resistance.” D6381-08, West Conshohocken, Pa. ASTM. (2009). “Standard specification for asphalt-saturated organic felt used in roofing
and waterproofing.” D226-09, West Conshohocken, Pa. ASTM. (2010). “Standard specification for asphalt shingles made from glass felt and
surfaced with mineral granules.” D3462-10a, West Conshohocken, Pa. ASTM. (2011a). “Standard specification for asphalt-saturated organic felt underlayment
used in steep slope roofing.” D4869-05(2011)e1, West Conshohocken, Pa.
190
ASTM. (2011b). “Standard specification for gravity-convection and forced-ventilation
ovens.” E145-94(2011), West Conshohocken, Pa. ASTM. (2011c). “Standard test method for wind resistance of asphalt shingles (uplift
force/uplift resistance method).” D7158-11, West Conshohocken, Pa. ASTM. (2013). “Standard test method for wind-resistance of asphalt shingles (fan-
induced method).” D3161-13, West Conshohocken, Pa. Benjamin, I.A. and Bono, J. A. (1969). “Wind-resistance tests of roof shingles and roof
assemblies.” ASTM Special Technical Publication 409. Berdahl, P., Akbari, H., Levinson, R. and Miller, W.A. (2008). “Weathering of roofing
materials - an overview.” Construction and Building Materials, 22, 423-433. Blake, E.G. (1925). Roof Coverings: Their Manufacture and Application, Van Nostrand
Co., New York, Ny. Cash, C. (1995). “Asphalt roofing shingles.” 11th Conference on Roofing Technology,
Gaithersburg, Md. CertainTeed (2007). CertainTeed Shingle Applicator’s Manual, CertainTeed
Corporation, Blue Bell, Pa. Cochran L., Peterka J.A., and Derickson, R. (1999). “Roof surface wind speed
distributions on low-rise buildings.” Architectural Science Review, 42(3), 151-160. Cullen, W. (1960). “Wind resistance of asphalt shingle roofing.” Fall Conferences of the
Building Research Institute, National Academy of Sciences, Washington D.C., 33-42.
Cullen, W. (1992). “The evolution of asphalt shingles: survival of the fittest?”
Professional Roofing Magazine, R4 - R8. Cullen, W. (1993). “Research and performance experience of asphalt shingles.”
10th Conference on Roofing Technology, Gathersburg, Md, 6-12. Davenport, G. (1961). “The spectrum of horizontal gustiness near the ground in high
winds.” Quarterly Journal of the Royal Meteorological Society, 87, 194. Dixon, C.R., Masters, F.J., Prevatt, D.O., and Gurley, K.R. (2012). “An historical
perspective on the wind resistance of asphalt shingles.” RCI Interface, (5), 4-14.
191
Dixon, C.R., Masters, F.J., Prevatt, D.O., and Gurley, K.R. (2013a). “SERRI project: investigation of the wind resistance of asphalt shingle roof coverings – Phase II.” SERRI Report 02-90100, Southeast Region Resarch Initiative.
Dixon, C.R., Masters, F.J., Prevatt, D.O., and Gurley, K.R. (2013b). “Wind uplift
resistance of artifically and naturally aged asphalt shingles.” Journal of Architectural Engineering. [Article Submitted for Review]
Dixon, C.R., Masters, F.J., Prevatt, D.O., Gurley, K.R., Brown, T.M., and Peterka, J.A.
(2013c). “The influence of unsealing on the wind resistance of asphalt shingles.” Journal of Wind Engineering and Industrial Aerodynamics. [Article Submitted for Review]
Durst, C.S. (1960). “Wind speeds over short periods of time.” Meteorological Magazine,
80, 181-187. Dutt, O. (1986). “Mineral granules: optimal grading for maximum protection of roofing.”
Durability of Building Materials, 3, 213-223. ESDU (1983). Data Item 83045 Strong Winds in the Atmospheric Boundary Layer Part
2: Discrete Gust Speeds, Engineering Science Data Unit. ESDU (2002). Data Item 82026 Strong Winds in the Atmospheric Boundary Layer Part
1: Hourly-Mean Wind Speeds, Engineering Science Data Unit. Fedor, G.R., Brennan, P.J. (1996). “Comparison between natural weathering and
fluorescent UV exposures: UVA-340 test results.” Durability Testing of Non-Metallic Materials, (1294), 91-105.
FEMA (2005a). “Summary report on building performance: 2004 hurricane season.”
FEMA 490, Federal Emergency Management Agency, Washington, D.C. FEMA (2005b). “Hurricane Charley in Florida.” FEMA 488, Federal Emergency
Management Agency, Washington, D.C. FEMA (2006). “Summary report on building performance: hurricane Katrina.” FEMA
548. Federal Emergency Management Agency, Washington, D.C. FEMA (2009). ”Hurricane Ike in Texas and Louisiana.” FEMA P-757, Federal
Emergency Management Agency, Washington, D.C. FEMA (2011). “Coastal construction manual: principles and practices of planning, siting,
designing, constructing, and maintaining residential buildings in coastal areas (4th ed.)” FEMA P-55, Federal Emergency Management Agency, Washington, D.C.
192
FEMA (2012). “Home builder’s guide to coastal construction.” FEMA P-499. Federal Emergency Management Agency, Washington, D.C.
Florida Building Comission (2010) Florida Building Code, Florida Building Comission,
Tallahassee, Fl. Fronapfel, E.L. (2006). “The ‘winds of change’ in asphalt shingle specification and
application”. RCI Interface, 9, 40-46. Galea, S., Nandi, A., and Vlahov, D. (2005). “The edpidemiology of post-traumatic
stress disorder after disasters.” Epidemiologic Reviews, 27, 78-91. Gay, C. and Leibler, L. (1999). “On stickness.” Physics Today, 52(11), 48-52. Greenfeld, S.H. (1969). Performance of Roofing Felts Made with Asplund Fibers,
National Bureau of Standards, Washington, D.C. Gurley, K.R. and Masters, F.J. (2011). “Post 2004 hurricane field survey of residential
building performance.” Nat. Hazards Rev., 12(4), 177-183. Hahn, L.T., Roodvoets, D.L., and Rhodes, K.D. (2004). “New shingle wind resistance
test standards.” RCI Interface Magazine, 7, 36-42. Hamid, S.S., Pinelli, J.P., Chen, S., and Gurley, K.R. (2011). “Catastrophe model-based
assessment of hurricane risk and estimates of potential insured losses for the state of Florida.” Nat. Hazards Rev., 12, 171-176.
IBHS (2009). Hurricane Ike: Natures’s Forces vs. Structural Strength, Insurance
Institute for Business & Home Safety, Tampa, Fl. Kaimal, J.C., Wyngaard, J.C., Izumi, Y., and Cote, O.R. (1972). “Special characteristics
of surface-layer turbulence.” Quarterly Journal of the Royal Meteorological Society, 98, 563-589.
Levine, J.N., Esnard, A., and Sapat, A. (2007). “Population displacement dilemmas due
to catastrophic disasters.” Journal of Planning Literature, 22(1), 3-15. Li, Q.S., and Melbourne, W.H. (1999). “The effects of large-scale turbulence on
pressure fluctuations in separated and reattached flows.” J. Wind Eng. And Ind. Aerodyn., 83, 159-169.
Liang, R.Y. and Lee, S. (1996). “Short-term and long-term aging behavior of rubber
modified asphalt paving mixture.” Journal of the Transportation Research Board, 1530, 11-17.
193
Liu, Z., Pogorzelski, H., Masters, F.M., Tezak, S., and Reinhold, T.A. (2010). “Surviving nature's fury: performance of asphalt shingle roofs in the real world.” RCI Interface Magazine, RCI.
Malarkey, G. (2001). “The history of asphalt shingles.” RCI Interface, 4, 5-9. Malmstad, J., Scheiffin, K. and Elsner, J. (2009). “Florida hurricanes and damage
costs.” Southeastern Geographer, 49(2), 108-131. Marechal, J., Ghaleb, G., and Bonnet, D. (1983). Aging of Waterproofing Coatings
Made From SBS Elastomeric Asphalt, CTSB Studies and Research. Marshall, T.P., Morrison, S.J., Herzog, R.F., and Green, J.R. (2010). “Wind effects on
asphalt shingles.” 29th Conference on Hurricanes and Tropical Meteorology, Tucson, Az.
Masters, F.J., Vickery, P.J., Bacon, P., and Rappaport, E.N. (2010). “Toward objective,
standardized intensity estimates from surface wind speed observations.” Bulletin of the American Meteorlogical Society, 91, 1665-1682.
McLintock, M. (1991). “Roof color choice not black and white.” Contractors Guide, (4),
48-49. Mitchell, C.M., Esnard, A., and Sapat, A. (2012). “Hurricane events, population
displacement, and sheltering provision in the United States.” Nat. Hazards Rev., 13(2), 151-160.
National Science Board. (2007). "Hurricane warning: the critical need for a national
hurricane research initiative." National Science Board of the National Science Foundation, Arlington, VA.
Nichols, T. (2010). “A stronger bond.” Professional Roofing Magazine. Noone, M.J. and Blanchard, W.K. (1993). “Asphalt shingles – a century of success and
improvement.” 10th Conference on Roofing Technology, Gathersburg, Md, 23-33. Ott, R. L. and Longnecker, M.T. (2004). A First Course in Statistical Methods,
Brooks/Cole, Belmont, Ca. Parker, D., Sherwin, J. (1998). "Comparative summer attic thermal performance of six
roof constructions." The 1998 ASHRAE Annual Meeting, Toronto, Canada. Peterka, J.A. and Cermak, J.E. (1983). Rpt. Wind-Tunnel Study of Wind Resistance of
Roofing Shingles, Colorado State University, Fort Collins, Co.
194
Peterka, J.A., Cermak, J.E., Cochran, L.S., Cochran, B.C., Hosoya, N., Derickson, R.G., Jones, J., and Metz, B. (1997). “Wind uplift model for asphalt shingles.” Journal of Architectural Engineering, 3(4), 147-155.
Peterka, J.A., Cermak, J.E. and Hosoya, A. (1983). Rpt. Wind-Tunnel Study of Wind
Pressures on Roofing Shingles, Colorado State University, Fort Collins, Co. Peterka, J.A. and Esterday, J. (2000). Development of a Shingle Uplift Coefficient Test
Standard, Cermak Peterka Petersen, Fort Collins, Co. Powell, M.D., Houston, S.H., Amat, L.R., and Morisseau-Leroy, N. (1998). “The HRD
real-time hurricane wind analysis system.” J. Wind Eng. and Ind. Aerodyn., 77, 53-64.
Rickborn, T.W., (1992). “Aerial photo interpretation of the damage to structures caused
by hurricane Hugo.” Masters thesis, Clemson University, Clemson, Sc. RICOWI (2006). Hurricanes Charley and Ivan Investigation Report, Roofing Industry
Committee on Weather Issues, Powder Springs, Ga. RICOWI (2007). Hurricane Katrina Investigation Report, Roofing Industry Committee on
Weather Issues, Powder Springs, Ga. Robertson, R.E. (1991). Chemical properties of asphalt and their relationship to
pavement performance, Strategic Highway Research Program, Washington, D.C..
Schaack, K. (2006a). “The underlying facts: product types, standard, and characteristics
of underlayments.” RCI Interface, 2, 20-28. Schaack, K. (2006b). “Industry guidelines and recommendations for underlayments.”
RCI Interface, 4, 37-46. Shaw, D.E. (1991). “ARMA's new approach for evaluation of asphalt shingle wind
resistance.” 1991 International Symposium on Roofing Technology, Gaithersburg, Md.
Shen, S.Y., Masters, F.J., Upjohn II, H. (2013). “Recent advancements in full-scale
simulation of dynamic wind and pressure effects on full-scale buildings.” 12th Americas Conference on Wind Engineering, Seattle, Wa.
Shiao, M.L., Nester, D.A., and Terrenzio, L.A. (2003a). “On the kinetics of thermal loads
for accelerated aging.” Roofing Research and Standards Development, 5, 119-135.
195
Shiao, M.L., Snyder, R.A., Livsey, R.D., and Kalkanoglu, H.M. (2003b). “Measuring uplift resistance of asphalt shingles.” Roofing Research and Standards Development, 5, 3-18.
Shuffleton, J.D. and Still, M. (1990). “Fiberglass shingles: how fast do thy age?” RSI,
(5), 44-48. Smith, T.L. (1995). “Improving wind performance of asphalt shingles: Lessons Learned
from Hurricane Andrew.” 11th Conference on Roofing Technology, Gaithersburg, Md, 39-48.
Smith, T.L. and McDonald, J. (1990). “Roof wind damage mitigation: lessons from
Hugo.” Professional Roofing Magazine. Smith, T.L. and Millen, M. (1999). “Influence of nail locations on wind resistance of
unsealed asphalt shingles.” North American Conference on Roofing Technology. Snoke, H.R. (1941). Asphalt-Prepared Roll Roofings and Shingles, National Bureau of
Standards, Washington, D.C.. Sparks, P.R., Schiff, S.D., and Reinhold, T.A. (1994). “Wind damage to envelopes of
houses and consequent insurance losses.” J. of Wind Eng. and Ind. Aerodyn. 53(1-2), 145-155.
Strahan, J.L. (1947). Asphalt Roofing and Accessories: A Discussion Covering the
Manufacture, Selection and Application of Asphalt Roofing Products, Asphalt Roofing Industry Bureau.
Terrenzio, L.A., Harrison, J.W., Nester, D.A. and Shiao, M.L. (1997). “Natural vs.
artificial aging: use of diffusion theory to model asphalt and fiberglass-reinfoced shingle performance.” Fourth International Symposium on Roofing Technology, Gaithersburg, Md.
Texas Department of Wind Insurance. (2011). “Asphalt shingle products that conform to
the 2008 International Residential Code (IRC) and 2006 International Building Code (IBC), as modified with Texas Revisions.” <http://www.tdi.texas.gov/wind/documents/asphltshnglslst.pdf > (Oct 3, 2013).
UL (1995). “Wind resistance for prepared roof covering materials.” Standard UL 997,
Northbrook, Ill. UL (2003). “Test methods for wind resistant asphalt shingles with sealed tabs.”
Standard UL 2390, Northbrook, Ill. US Census Bureau. (2007). "2007 population estimates." <http://factfinder.census.gov>
(Sept. 16, 2009).
196
von Karman, T. (1948). “Progress in the statistical theory of turbulence.” Proceedings of
the National Academies of Sciences, 34(11), 530-539. Warford, M. (1988). “What aging does to roofing materials.” Roofer, (7), 12-16. Wright, J.R. (1979). “Weathering: theoretical and practical aspects of asphalt durability.”
Bituminous Materials: Asphalts, Tars, and Pitches, 249-306. Wypych, G. (1995). Handbook of Materials Weathering 2nd ed, William Andrew
Publishing, New York, Ny. Yildirim, Y. (2007). “Polymer modified asphalt binders.” Construction and Building
Materials, 21, 66-72.
197
BIOGRAPHICAL SKETCH
Craig R. Dixon received his undergraduate degree in civil engineering in the fall
of 2008 from the University of Florida, and in the fall of 2009 he joined Dr. David O.
Prevatt’s wind engineering research group at the University of Florida as a research
assistant. During his undergraduate work, Mr. Dixon spend six summers interning for
Gale Associates in Orlando, FL, performing roof observation and roof assessment
studies. Mr. Dixon’s work as a research assistant included investigations on the wind
resistance of wood roof sheathing, standing-seam metal roofing, and asphalt shingles.
Mr. Dixon received his Ph.D. from the University of Florida in the fall of 2013.