• 2012 americas school of mines metal and mineral production mining and money 4 ore direct to...
TRANSCRIPT

2012 Americas School of Mines
W Scott DunbarUniversity of British Columbia
• www.pwc.com
Basics of Mining and Mineral Processing
Agenda
Geological Concepts
Mining Methods
Mineral Processing Methods
Mine Waste Management
Mining and Money
A Future of Mining
PwCPwC
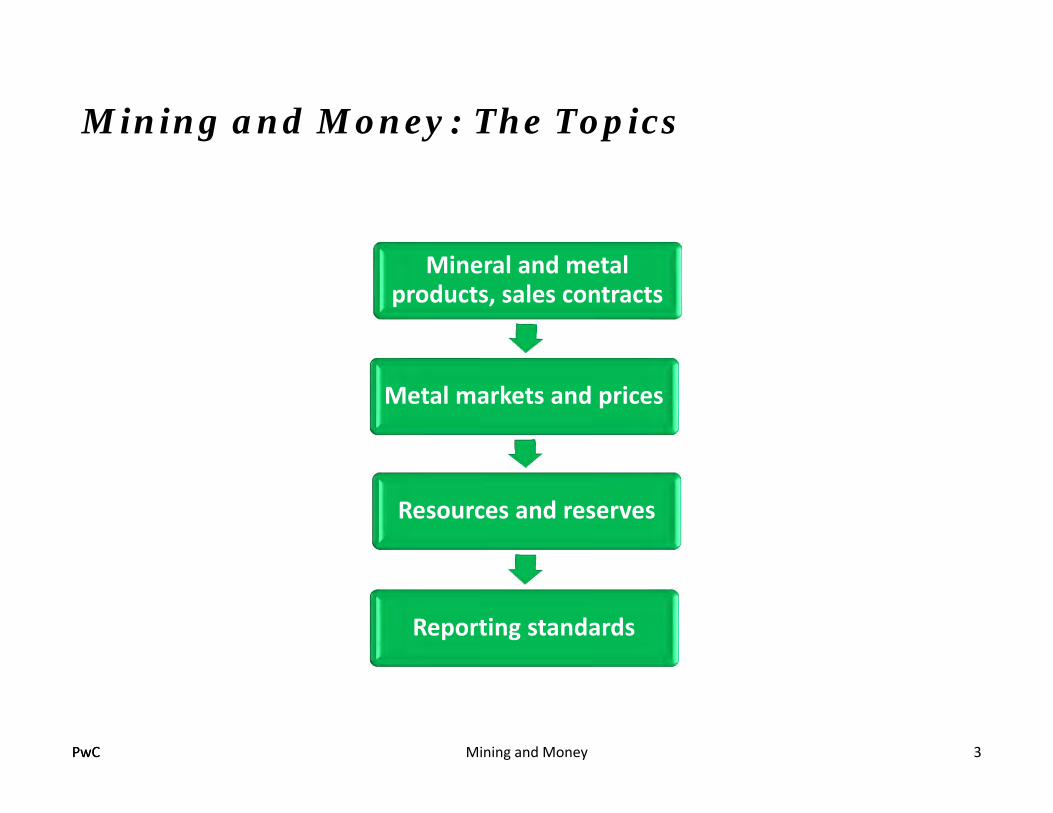
Mining and Money: The Topics
Mineral and metal products, sales contracts
Metal markets and prices
Resources and reserves
Reporting standards
Mining and Money 3
PwCPwC
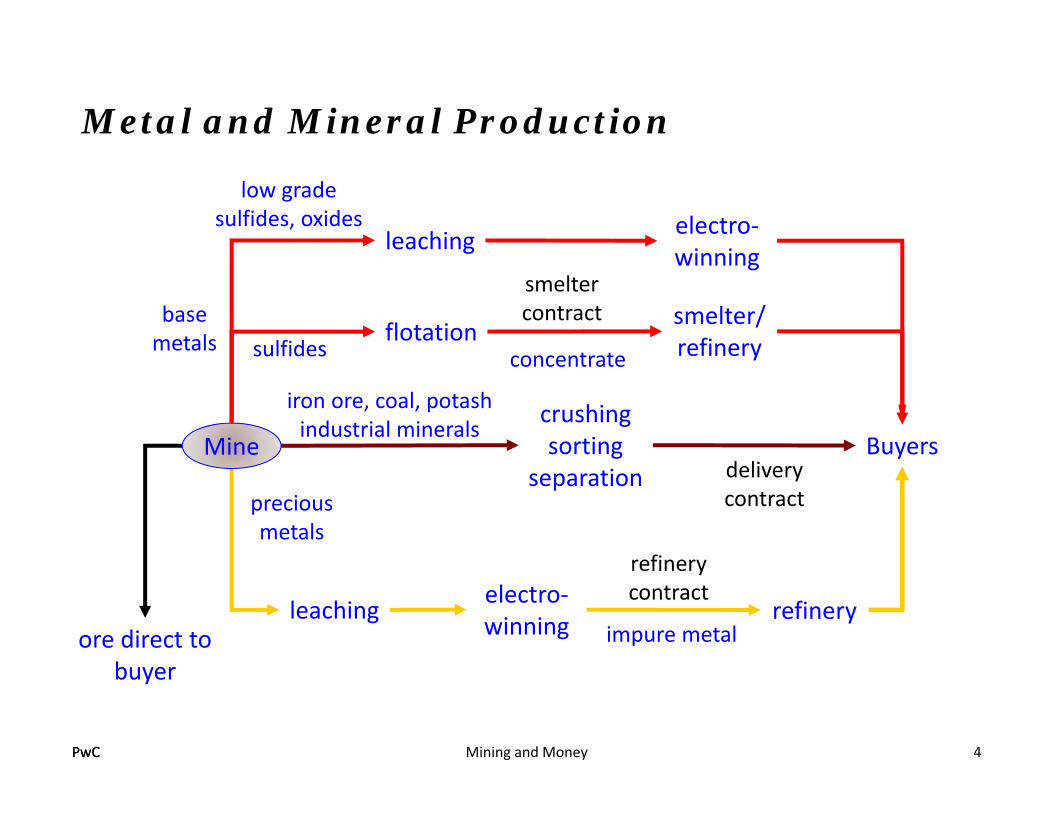
Metal and Mineral Production
Mining and Money 4
ore direct to buyer
smelter/refinery
Buyers
refinery
smelter contract
refinery contract
flotationconcentrate
precious metals
impure metalleaching
crushing sorting
separation
iron ore, coal, potash industrial minerals
delivery contract
Mine
base metals
leaching
sulfides
electro‐winning
electro‐winning
low grade sulfides, oxides

PwC
Notes: Metals and Mineral Production
A mill at a base metal mine typically uses flotation to produce a concentrate that has a concentrationof 20‐40% of a primary metal. Copper concentrates are typically 25‐30%. The concentrate istransported to a smelter/refinery complex where pure metal is made. Unless the mining companyowns the smelter/refinery, the sale of concentrate is governed by a smelter contract. The concentratemight be processed by pressure leaching and electro‐winning to form pure metal.
The mill at a precious metal mine uses leaching and electro‐winning to produce an impure metalproduct which must be refined to produce pure metal (99.99% pure) The impure metal at a gold mineis called doré, a mixture of 60‐90% gold and other metals, often silver. Unless the mining companyowns the refinery, the sale of the impure metal is governed by a refinery contract.
Iron ore, potash and industrial minerals typically require some form of separation technology toproduce a desired product. Flotation is used to obtain fertilizer grade potassium chloride and toseparate fine coal. Grinders, cyclones, and magnetic separation methods are used to produce iron oreproducts. The processed ore is shipped to a buyer under terms of a delivery contract which specifiesthe delivery times of required quantities and the required grades.
In some rare cases, the ore from a mine is so rich, it is shipped directly to a smelter or refinery. Forsome time the ore from the Eskay Creek mine in British Columbia was shipped by train tosmelter/refineries in Quebec or Japan.
Mining and Money 5

PwCPwC
Smelter contracts
Concentrate 25‐30% Cu
Freight costs, insurance ,etc
Orebody<1% Cu Anode copper
95‐98% CuTreatment charges (TC) and penalties
Cathode copper
>99.9% CuRefinery
charges (RC)
At Mine Return (AMR)
Net Smelter Return (NSR)
Credits for precious and other metals
Mining and Money 6

PwC
Notes: Smelter contracts
A smelter contract contains details concerning:•how the mine will be paid for the principal metal in its concentrate,•how the mine will be credited for other desirable metals in the concentrate (e.g., by‐productssuch as gold),•what penalties will be applied for materials that affect the performance of the smelter (e.g.,antimony, bismuth, moisture)•how the delivery is to be made, and•the manner in which check assays of the concentrate will be done.
The payment received by the mine is often called the Net Smelter Return (NSR). The mine is usuallyresponsible for transportation, insurance, and agents’ costs (realization costs). These costs aresubtracted from the net smelter return to obtain the At Mine Return (AMR). The AMR can be as littleas 60% of the value of the metal shipped to the smelter.
A simple mass balance between ore and concentrate can be used to determine how many tons of oreare needed to produce one ton of concentrate:
K tons grade g recovery r = 1 ton grade GGiven the concentrate grade G, the ore grade g, and the metal recovery r, K can be computed. Forexample: g = 0.5%, r = 92%, G = 28% gives K = 60.9 tons.
Mining and Money 7
PwCPwC
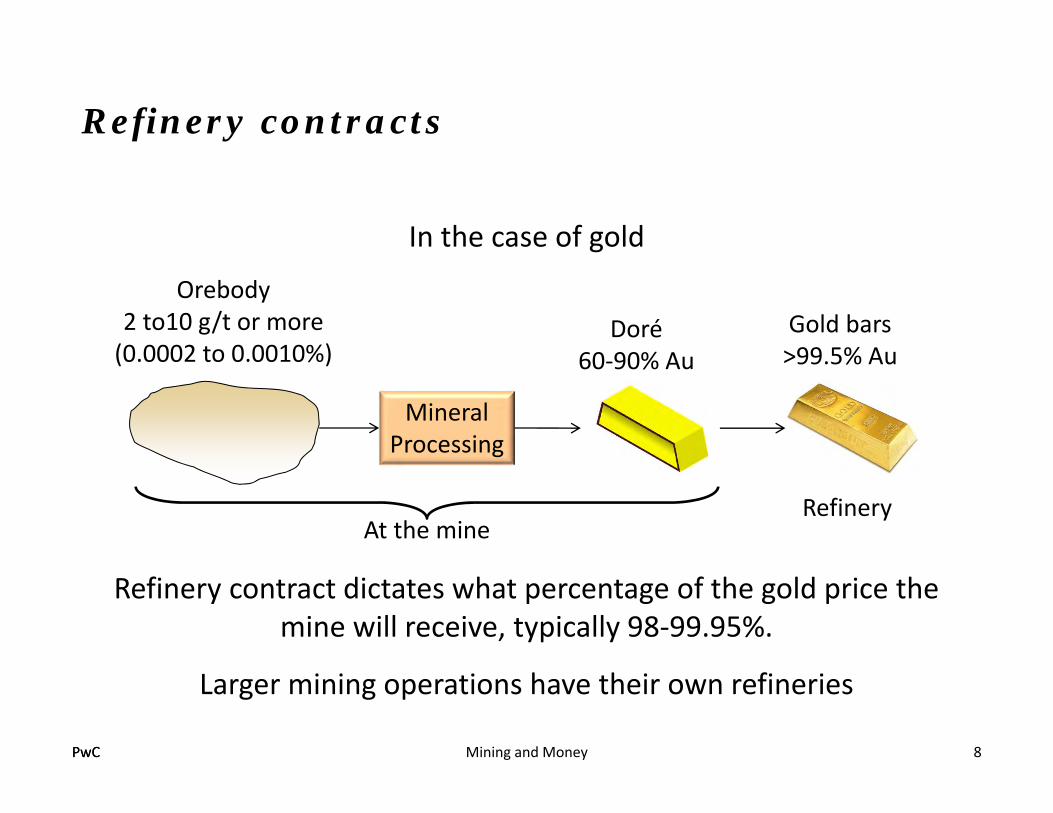
Refinery contracts
Orebody2 to10 g/t or more(0.0002 to 0.0010%)
MineralProcessing
In the case of gold
RefineryAt the mine
Refinery contract dictates what percentage of the gold price the mine will receive, typically 98‐99.95%.
Larger mining operations have their own refineries
Gold bars >99.5% Au
Mining and Money 8
Doré60‐90% Au

PwC
Notes: Refinery contracts
Typical terms of a gold refinery contract are:A treatment charge of $0.80 to $1.20 per oz, depending on current market conditionsThe refinery typically pays the mine for 98% to 99.95% of the gold contained in thedoré, depending on market conditions.Penalties are applied for deleterious elements such as iron, lead, tellurium and nickel.The refinery will pay between 95% and 99% of the silver content of the doré.
The complexity of refinery contracts lies in the procedures established for weighing andassaying. Security measures, delivery dates, disposition of refinery waste, andtransportation of the gold are all dealt with in a refinery contract.
Mining and Money 9
PwC
By-products and Co-products
• By‐product• secondary metal produced in the mining and processing of another metal
• usually not important to the viability of mine
• e.g. gold/silver in copper concentrate
• Co‐products• metals that are mined and produced together
• important to the viability of a mine
• e.g. lead and zinc usually produced together
Mining and Money 10
From an accounting perspective, this distinction does not exist.

PwC
Notes: By-products and Co-products
Prices can determine whether a metal is a by‐product or co‐product. For example, in aperiod of high metal prices, each metal could be considered a co‐product (or simply aproduct). During periods of low metal prices, the gold in a copper concentrate may beimportant to the viability of the mine. Mines with poly‐metallic ores (e.g., Myra Falls)sometimes call themselves different types of mine depending on prices.
Current accounting rules (GAAP) specify that revenue from by‐products and co‐products bestated as a line item for each individual product. Costs for production of a particular by‐product or co‐product cannot be used to reduce overall operating costs. Thus, by‐productgold credit for a copper concentrate cannot be used to reduce the operating cost of acopper mine. Essentially the new accounting rules eliminate the distinction between by‐products and co‐products.
Before the current accounting rules were established, in some cases the high prices of a by‐product caused operating costs to become negative, clearly not representative of theactual conditions.
Mining and Money 11

PwCPwC
Negative costs?
Mining and Money 12
This kind of statement is unrepresentative:
“... mining a variety of metals reduces XXX's cost per ounce of silverto less than nothing or a negative cost. The other metals pay foreverything and make lots of profit, so the silver is free.”

PwCPwC
Metal equivalents
Mining and Money 13
Expressing the quantity of metal in the deposit in terms of the more abundant metal (main metal) in the deposit
Common in polymetallic mines
Value of all metals in groundMain metal equivalent grade
Unit value of main metal
Ignores two things:grade variations within depositprice (value) changes
both vary with time
See example on notes slide
PwC
Notes: Metal equivalents
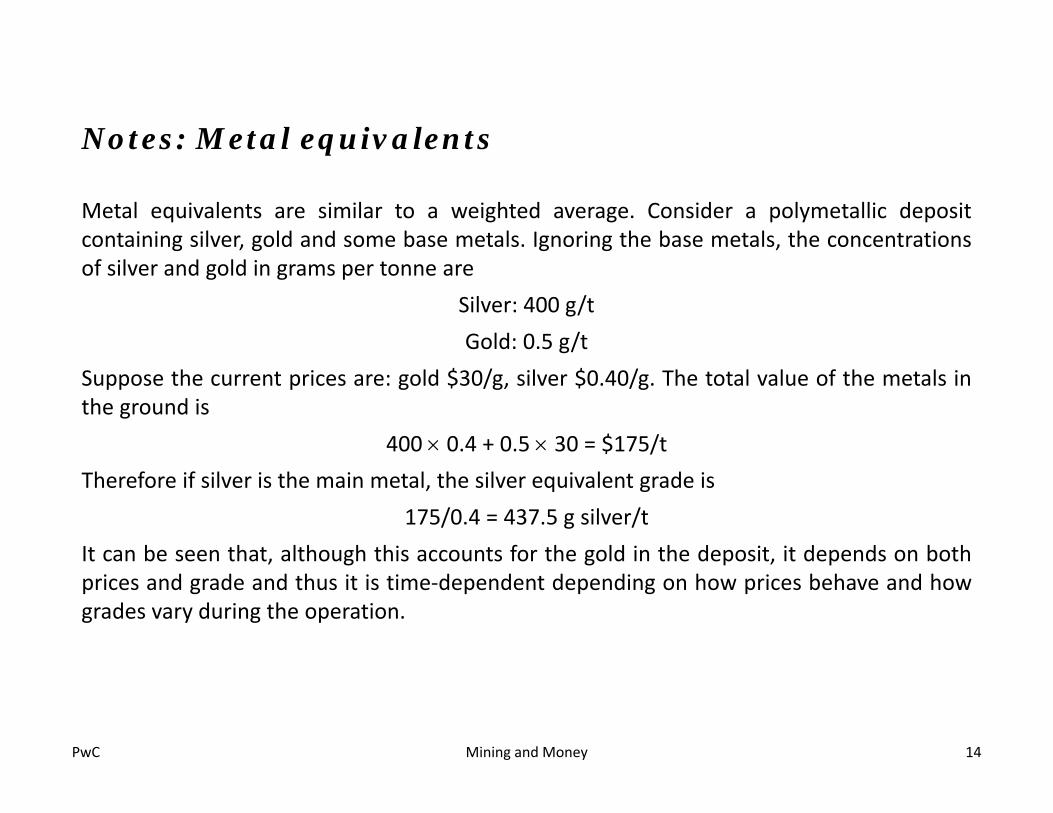
Metal equivalents are similar to a weighted average. Consider a polymetallic depositcontaining silver, gold and some base metals. Ignoring the base metals, the concentrationsof silver and gold in grams per tonne are
Silver: 400 g/tGold: 0.5 g/t
Suppose the current prices are: gold $30/g, silver $0.40/g. The total value of the metals inthe ground is
400 0.4 + 0.5 30 = $175/tTherefore if silver is the main metal, the silver equivalent grade is
175/0.4 = 437.5 g silver/tIt can be seen that, although this accounts for the gold in the deposit, it depends on bothprices and grade and thus it is time‐dependent depending on how prices behave and howgrades vary during the operation.
Mining and Money 14
PwC
How metal prices are determined
• Producer Prices• producers set price• common for industrial minerals
• Negotiated Prices• pricing determined by direct negotiation between buyer and seller• prices may be linked to commodity exchange prices• long‐term contracts for metals or concentrates
• Independent Pricing• Commodity Exchanges
• London Metals Exchange (LME)• CME Group (includes COMEX and NYMEX exchanges)
Mining and Money 15
PwC
Notes: How metal prices are determined
Mining and Money 16
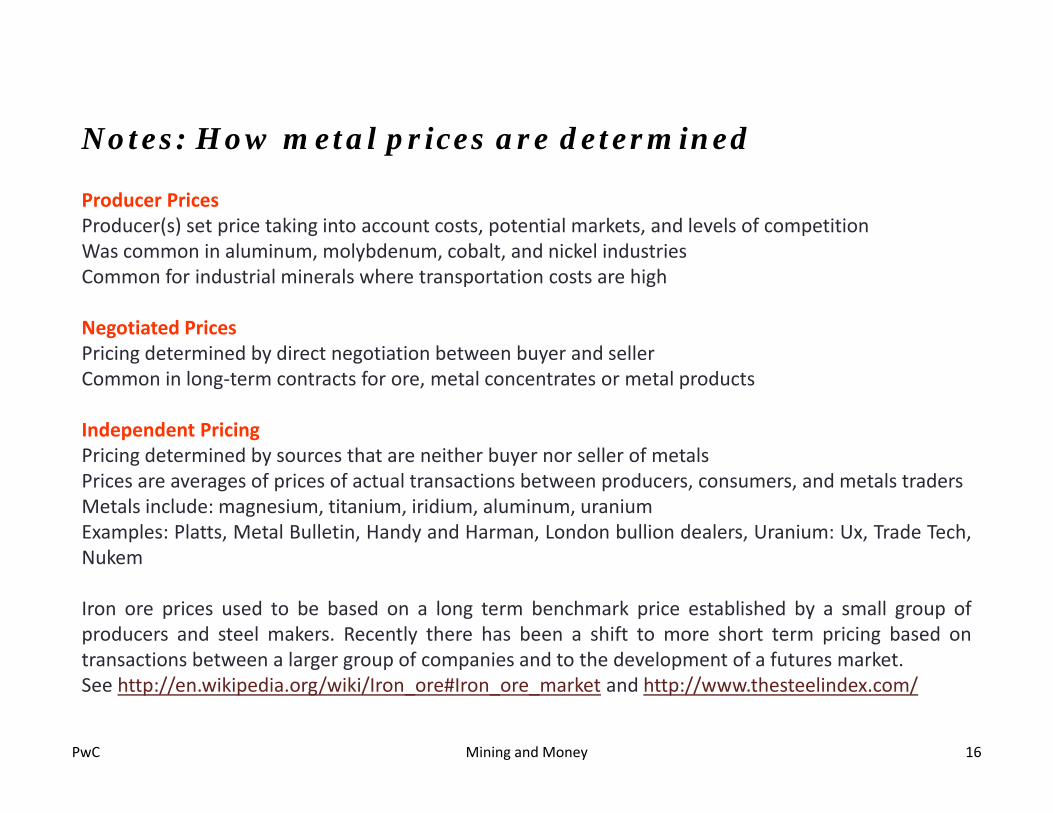
Producer PricesProducer(s) set price taking into account costs, potential markets, and levels of competitionWas common in aluminum, molybdenum, cobalt, and nickel industriesCommon for industrial minerals where transportation costs are high
Negotiated PricesPricing determined by direct negotiation between buyer and sellerCommon in long‐term contracts for ore, metal concentrates or metal products
Independent PricingPricing determined by sources that are neither buyer nor seller of metalsPrices are averages of prices of actual transactions between producers, consumers, and metals tradersMetals include: magnesium, titanium, iridium, aluminum, uraniumExamples: Platts, Metal Bulletin, Handy and Harman, London bullion dealers, Uranium: Ux, Trade Tech,Nukem
Iron ore prices used to be based on a long term benchmark price established by a small group ofproducers and steel makers. Recently there has been a shift to more short term pricing based ontransactions between a larger group of companies and to the development of a futures market.See http://en.wikipedia.org/wiki/Iron_ore#Iron_ore_market and http://www.thesteelindex.com/
PwCPwC
Precious Metals Markets
Examples of independent pricing
London Bullion Market Association (LBMA)London Platinum and Palladium Market (LPPM)
Members meet twice daily to review offers from worldwide sources to buy and sell these metals
Results averaged and announced as the official AM and PM “fixings” for each of the metals.
Mining and Money 17

PwC
Notes: Precious Metals Markets
The London Bullion Market and the London Platinum and Palladium Market are “over‐the‐counter” markets where prices are determined by a group of member dealers based ontrades in precious metals that occur around the world. The procedures for price fixings aredescribed at the websites shown:
www.lbma.org.uk/london_faq_fixings.htmwww.lppm.org.uk/pgm_fixing_hist.html
Most of the members of these markets are major international banks or bullion dealers andrefiners.
Mining and Money 18

PwCPwC
Commodity Exchange Pricing
Prices determined by transactions of dealers who are representatives of metal buyers, sellers, and metal traders
Spot (present) or forward (in future) prices are set
The “ring” at LME
CME Group trades inSilverGold
CopperPlatinumPalladium
Steel products
LME trades inAluminumCobaltCopper
MolybdenumLeadNickelTinZinc
Steel products
Mining and Money 19

PwC
Notes: Commodity Exchange Pricing
Mining and Money 20
LME – London Metal Exchange www.lme.co.ukCME Group – www.cmegroup.com/trading/metals/
Prices at these exchanges are determined by a continuous auction carried betweenmember dealers acting on behalf of their customers, the companies they represent, orthemselves. The auction is done by open outcry. See www.lme.co.uk/pricing.asp.Information about metals trading at CME may be found at links on the above CME website..Both CME and LME engage in e‐trading of metals.

PwCPwC
Gold Prices and Inflation?
Mining and Money 21
0
200
400
600
800
1000
1200
1400
1970
1975
1980
1985
1990
1995
2000
2005
2010
0
2
4
6
8
10
12
14
16 Annual change in CPI
Annu
al change in CPI (%
)
Oil price increases
Central bankgold sales
Gold Price
Gold Price (US$/oz)
Recession
Market uncertainty
TerrorismWar
Gold prices: www.lbma.org.ukCPI indices: http://stats.bls.gov/cpi/#tables
PwC
Notes: Gold Prices and Inflation?
Until about 1990, there seems to be a correlation between inflation and gold price.However, after 1990 the correlation is not as good. In the late 1990s, central banks beganselling their gold supply so that gold price decreased even though inflation increased.Hedging of gold by gold producers during the same period effectively increased the supplybecause hedging is effectively selling gold that is not yet mined; however, producers havedecreased hedging activity since about 2000. Terrorist activities in 2001‐2002 may havecaused investors to protect the value of their portfolios with gold causing an increase inprice.
The more recent price increase is large and cannot be explained by the increase in inflationor by the need for portfolio protection. Other forces such as sovereign debt and the level ofeconomic uncertainty may be at work.
Mining and Money 22
PwCPwC
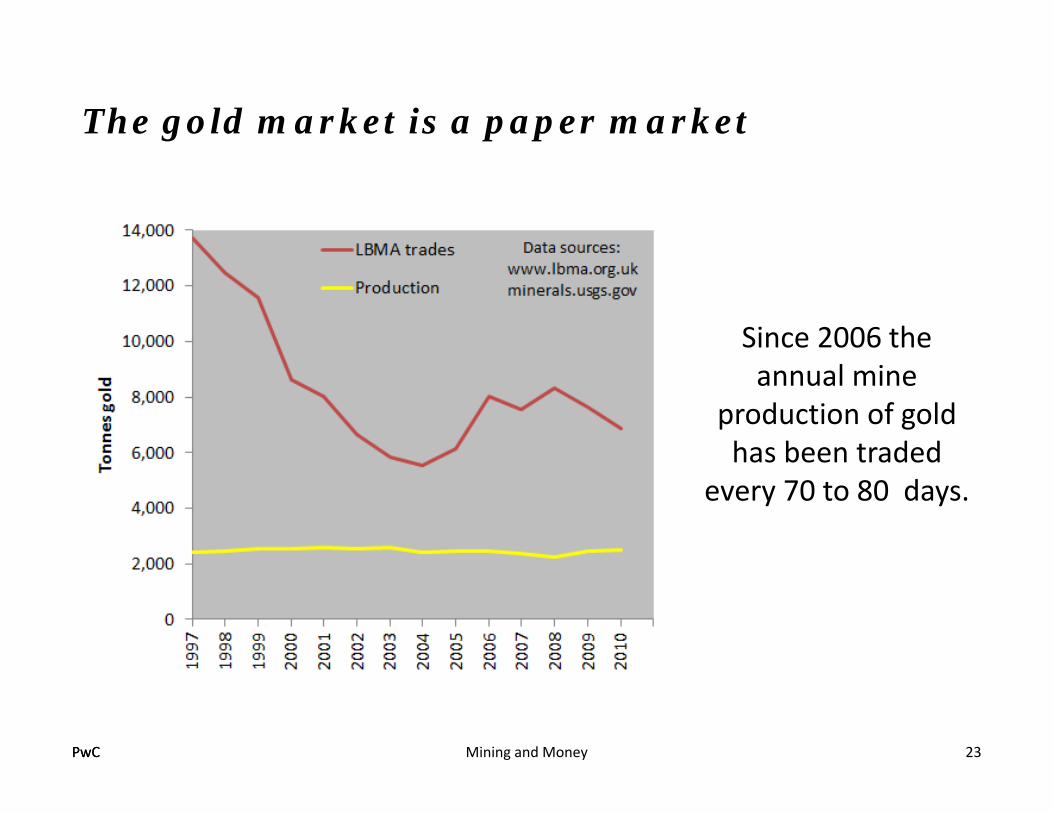
The gold market is a paper market
Mining and Money 23
Since 2006 the annual mine
production of gold has been traded
every 70 to 80 days.

PwC
Notes: The gold market Is a paper market
The London Bullion Market trading volume is mainly composed of the purchase of largelots of gold by central banks and financial institutions. One motivation for this type oftrading is that central banks lend gold at interest rates which are lower than typical loaninterest rates in order to achieve a return on their assets. This encourages borrowing goldfrom central banks, selling it and investing the proceeds at a higher rate. The physical goldmay or may not be returned as the lending contract can be continued indefinitely.
These kinds of trades recur such that since 2006 the annual mine production of gold hasbeen traded every 70 to 80 days. Although there is gold available somewhere in the worldto back up these trades, buying the gold in the open market involves credit and/or financialrisk and there is production risk associated with obtaining gold from a mine. Hence theterm “paper market”.
The paper market for gold investment constitutes a fundamental aspect of the gold market.It is believed by some that transactions in the paper market, a representation of thedemand for investment in gold, affect the price of gold more than physical transactions.http://en.wikipedia.org/wiki/London_bullion_market
Mining and Money 24
PwCPwC
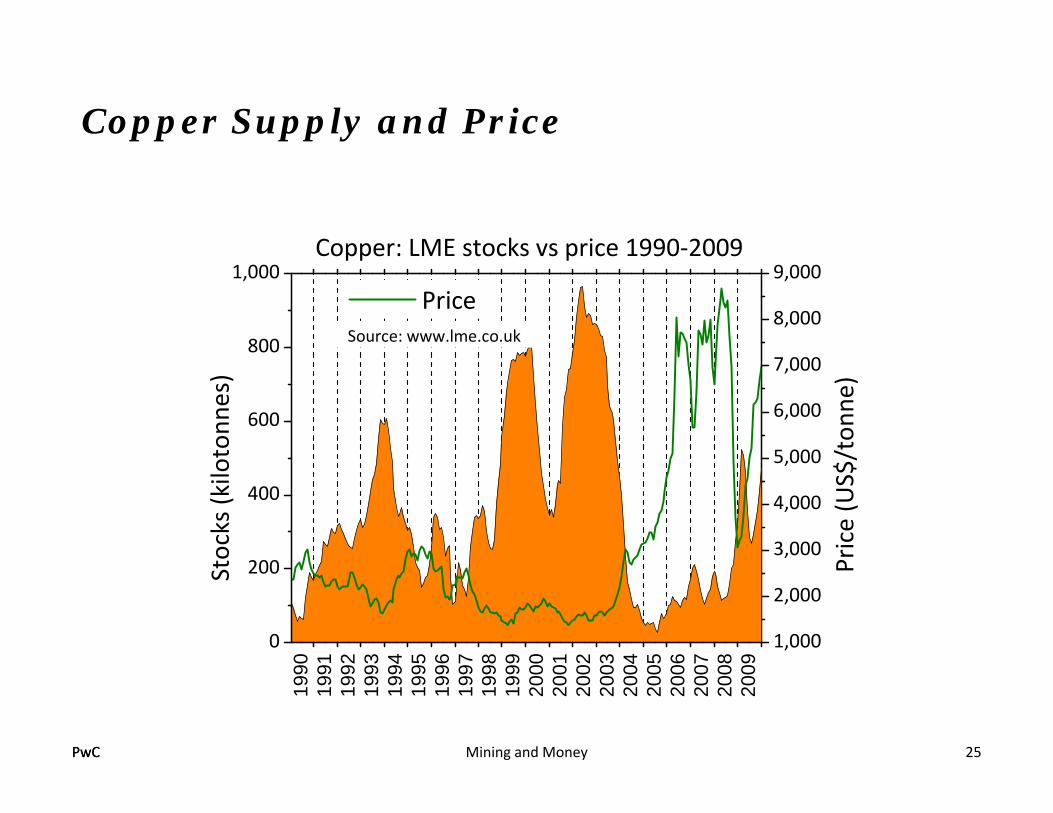
Copper Supply and Price
Mining and Money 25
1,000
2,000
3,000
4,000
5,000
6,000
7,000
8,000
9,00019
9019
9119
9219
9319
9419
9519
9619
9719
9819
9920
0020
0120
0220
0320
0420
0520
0620
0720
0820
09
0
200
400
600
800
1,000
Source: www.lme.co.uk
Stocks (kilotonn
es)
Price
Copper: LME stocks vs price 1990‐2009
Price (US$/ton
ne)

PwC
Notes: Copper Supply and Price
Commodity exchanges have warehouses where a physical supply of a metal is stored. Inthis case the copper supply is the total available for purchase in these warehouses on aparticular day. Traders know this supply and also know of any constraints on supply (egsmelter or mine shutdowns) Thus they know as much as possible about the market and bidor ask a price on that basis.
The correlation coefficient between copper stocks and price is ‐0.76, almost completelyanti‐correlated. Similar results for other base metals.
From these data, an empirical relationship between supply and price can be determined.Predictions of supply can be made using macro‐economic factors. The empiricalrelationship between supply and price can then be used to predict future price from futurepredicted supply. Results are generally good.
Mining and Money 26
PwCPwC
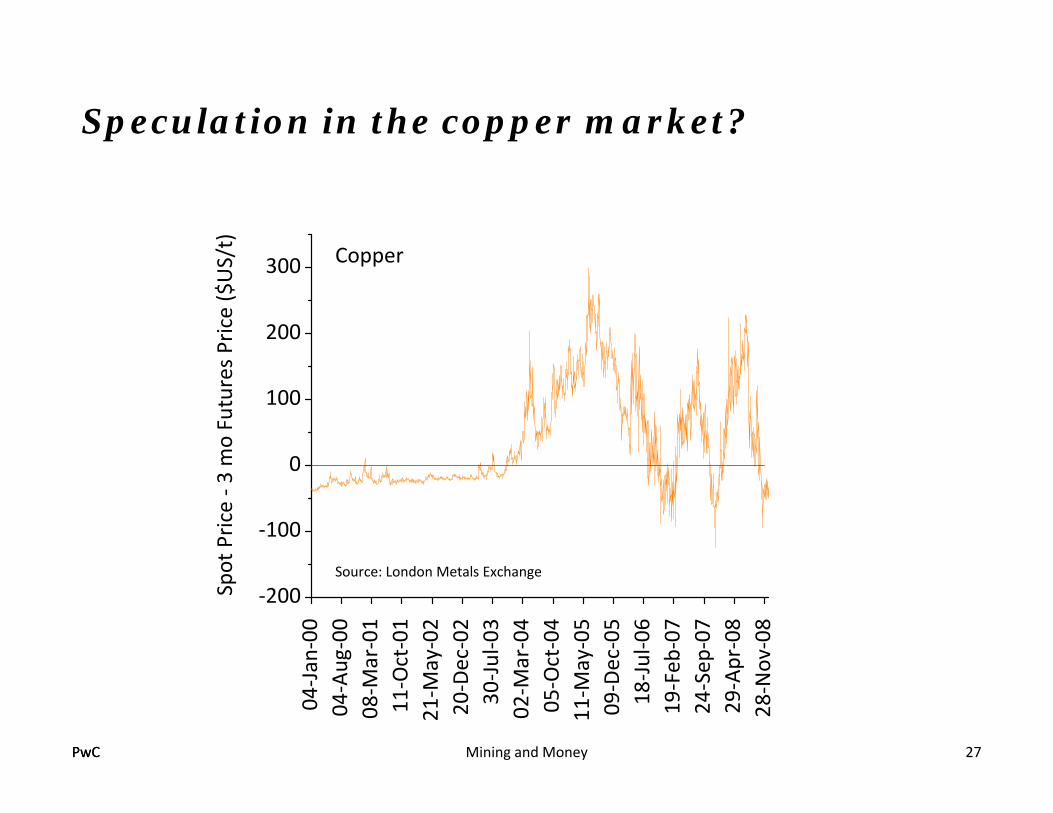
Speculation in the copper market?
Mining and Money 27
04‐Ja
n‐00
04‐Aug
‐00
08‐M
ar‐01
11‐Oct‐01
21‐M
ay‐02
20‐Dec‐02
30‐Ju
l‐03
02‐M
ar‐04
05‐Oct‐04
11‐M
ay‐05
09‐Dec‐05
18‐Ju
l‐06
19‐Feb
‐07
24‐Sep
‐07
29‐Apr‐08
28‐Nov‐08
‐200
‐100
0
100
200
300
Spot Price ‐ 3
mo Futures Price ($US/t)
Source: London Metals Exchange
Copper

PwC
Notes: Speculation in the copper market
Backwardation is a situation in which the price of a commodity for future delivery is lower than thespot price or, more generally, a far future delivery price is lower than a nearer future delivery price.Backwardation is a premium representing what a buyer is willing to pay for the immediate delivery ofthe commodity. The difference [Spot Price – 3 month Futures price] would be an indication of thispremium.
The plot of this difference for copper between 2000 and 2008 shows that until about the end of 2003there was little to no premium associated with immediate delivery of copper. Then there was asignificant premium and some rather wild changes.
The simple explanations for the increase in premium are the increase in demand for copper in Chinaand India and supply interruptions caused by strikes at copper mines in Chile, Peru and Mexico whichput pressure on copper supplies so that manufacturers pay more to assure delivery now rather thanlater. However, the wild changes in the premium suggest to some that the market is being influencedby speculators who have the ability to enter and exit the copper market depending on their investmentgoals. Their trades typically involve large volumes of copper which have an influence on spot price.Essentially the copper market is becoming a financial market, much like a stock exchange, whichintroduces an unknown element to the market.
Mining and Money 28

PwCPwC
But all prices go up
Cost of equipment continues to rise regardless of changes in metal prices
As measured by Producer Price Indices
1970
1975
1980
1985
1990
1995
2000
2005
2010
0
20
40
60
80
100
120
140
160
180
200
220
Prod
ucer Price Inde
x
Metals and Metal Products Construction Machinery and Equipment
Source: www.bls.gov/PPI/#tables
Mining and Money 29

PwCPwC
Cutoff Grade
Mining and Money 30
Reserves must be extracted economically:
Price Grade Recovery > Total Costs
For equality
Total costs usually include all the costs of mining, processing, and overheads. What overheads and howto attribute them is an interesting question. Should annualized capital costs be included?
Total costsCutoff grade (CoG) =
Price Recovery
If grade < CoG it’s waste (but it might be stockpiled)A Net Smelter Return or Net Refinery Return may also be defined for
a block of oreIf Return < Costs it’s waste
PwCPwC
How much is in the ground
Mining and Money 31
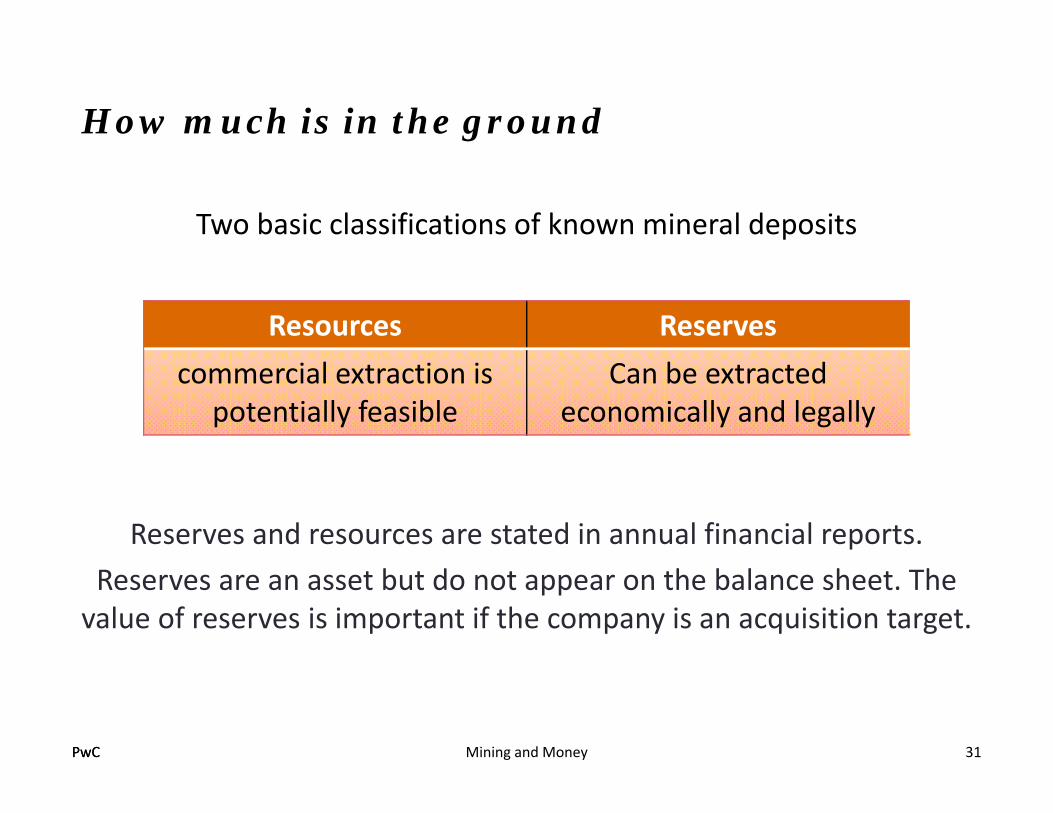
Two basic classifications of known mineral deposits
Resources Reservescommercial extraction is
potentially feasibleCan be extracted
economically and legally
Reserves and resources are stated in annual financial reports.Reserves are an asset but do not appear on the balance sheet. The value of reserves is important if the company is an acquisition target.

PwC
In 1989 the Australasian Joint Ore Reserves Committee (JORC) issued the Code for Reporting of MineralResources and Ore Reserves following some notable “misstatements” in mineral property valuationreports in Australia. The code can be downloaded from www.jorc.org. Various other codes based onJORC have since been developed and are used by regulatory and legal authorities as standards formethods of reserve and resource estimation:
VALMIN: (1995, revised 2005), Australian Institute of Mining and Metallurgy (AusIMM). The VALMINCode is obligatory for reports relating to mineral and petroleum assets and is supported by otherentities, including the Australian Stock Exchange, the Australian Securities and InvestmentCommission, the Institute of Chartered Accountants in Australia, and the Australian Institute ofCompany Directors. Download from http://www.mica.org.au/ Click on codes link.
National Instrument 43‐101: (Dec 30, 2005) NI 43‐101 was formulated by the Canadian SecuritiesAdministrators (CSA), an umbrella association of Provincial Securities Commissions across Canada.Download from http://www.ccpg.ca/guidelines/index.html
CIMVAL: (February 2003) Standards and Guidelines for Valuation of Mineral Properties wasformulated by a special committee of the Canadian Institute of Mining and Metallurgy. Thissupplements NI 43‐101. Download from www.cim.org/committees/CIMVal_Final_standards.pdf
US Securities & Exchange Commission, 2007. Industry Guides, “Industry Guide 7”, available athttp://www.sec.gov/about/forms/industryguides.pdf, pp 34‐37.
Notes: How much is in the ground?
Mining and Money 32
PwCPwC
Resources to Reserves
Mining and Money 33
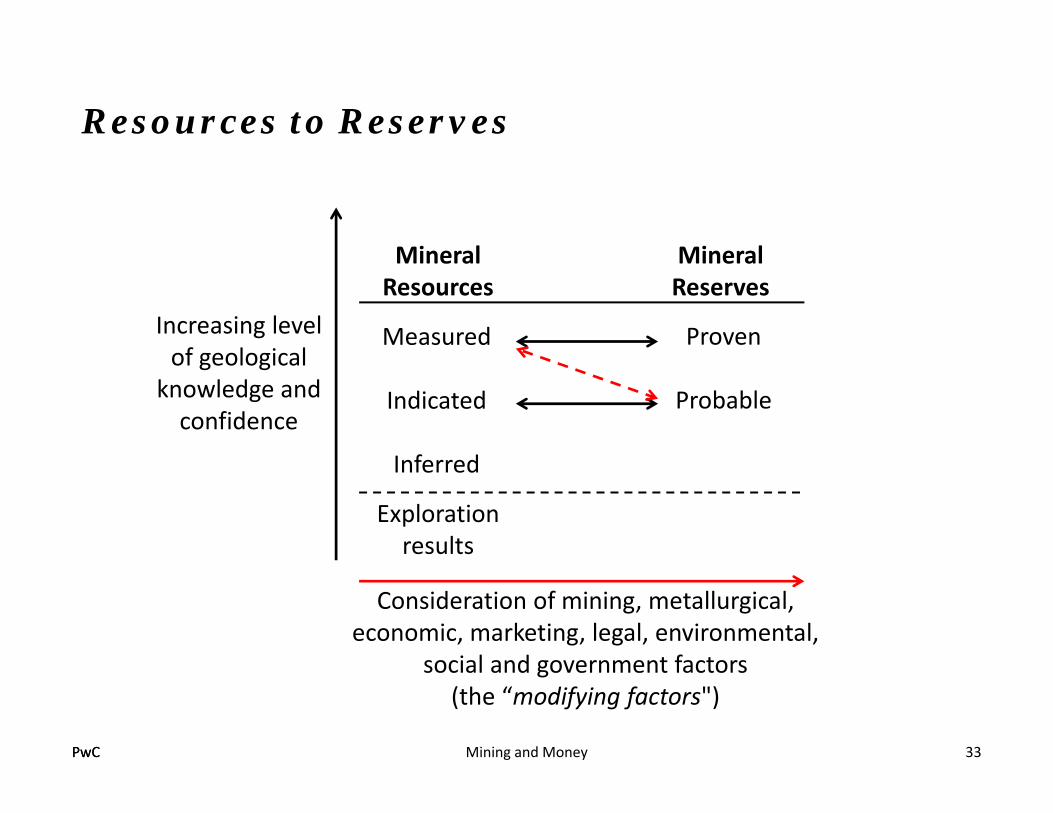
Exploration results
Mineral Resources
Mineral Reserves
Measured
Indicated
Inferred
Increasing level of geological
knowledge and confidence
Consideration of mining, metallurgical, economic, marketing, legal, environmental,
social and government factors (the “modifying factors")
Proven
Probable

PwC
Notes: Resources to Reserves
One way to describe the difference between resources and reserves isResources are reported as in situ estimates of mineralization (e.g., “The grade in this drill core is x%.”)Reserves are reported as masses with a particular grade distribution that can be mined (e.g., “There are X tonsof reserves with an average grade of y%”)
Note the need for geological knowledge to go from indicated to measured resources or from probable to provenreserves. Several modifying factors cause resources to become reserves. Reserves cannot be estimated from inferredresources.
Measured resources often become probable reserves even though geological knowledge does not decrease. Forexample, the drill hole spacing may not be sufficient to classify the reserves as proven, but a few modifying factorsmay be established or assumed. For this reason, some think that probable reserves should be moved down tobecome aligned with measured resources.
Estimation of reserves involves considerable technical difficulties and uncertainty. Among the considerations are:the distribution of grade in the resourcethe portion of the mineral resource that can be extracted when allowance is made for dilution and recoverymetal pricesproduction costschanges in technology
Information concerning the first two items tends to increase as the mine is developed. The last three items canchange during the life of the mine and it is not uncommon to see reserve estimates change as a result.
Mining and Money 34
PwCPwC
Same mineralized mass
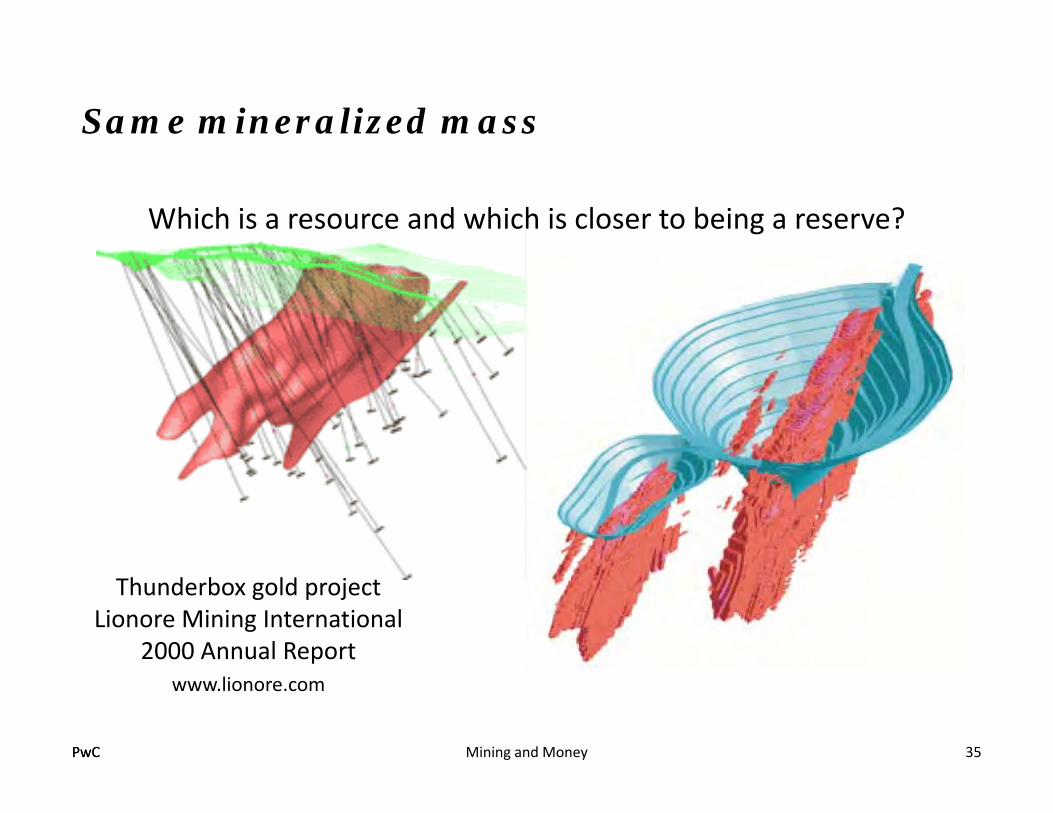
Thunderbox gold projectLionore Mining International
2000 Annual Reportwww.lionore.com
Which is a resource and which is closer to being a reserve?
Mining and Money 35
PwC
Notes: Same mineralized mass
On the left is a measured resource because the outline of the orebody has beendetermined by estimation from measurements (assays) in boreholes. On the right is anopen pit mine design. If the design is feasible, then at least a few of the modifying factorshave been taken into account and the orebody is a reserve. Most likely it is a probablereserve since there may not be enough drillhole data to prove that the orebody is asshown. A “bankable” feasibility study would have to prove the reserves by means of furtherdrilling on a finer grid (“infill drilling”)
Mining and Money 36

PwCPwC
From paper to pit – Thunderbox pit in 2006
www.lionore.com
Mining and Money 37
PwCPwC
Questions
#2Construction of the Galore Creek project in northwestern BritishColumbia was halted in 2007 due to high construction costs.
At that time were the minerals in the ground at the mine resources or reserves?
#1Drilling at the proposed Prosperity mine south of Williams Lake,British Columbia defined a resource of 1.0 billion tonnes. A feasibilitystudy indicated a mine life of 20 to 33 years at a capital cost of~$800M. Environmental approvals were needed but not obtained.
Could the resource ever have been considered a reserve?
Mining and Money 38
PwCPwC
Some things accountants do (in their offices)
Mining and Money 39
Depreciation schedules for assets
Rehabilitation and reclamation costs
Assessment of asset impairment
Each involves uncertaintyEach depends on an estimate of mine life and/or the available ore
(reserves or resources)
PwC
Notes: Reclamation and closure costs
Mining and Money 40
On the balance sheet in the year of recognition:Liability: PV(R&C costs)
Annually on the income statement:Depreciation expense: PV(R&C costs) / Mine Life
The reclamation and closure costs might include:Removal of plant and other facilitiesRestoration, rehabilitation and other environmental liabilities
There are several uncertainties in estimation of R&C costs:Length of time required to treat acid drainage or mine waste waterWhether reclamation/rehabilitation methods will be effectiveChanges to closure costs as a result of changes to an operation
PV(R&C costs) is a function of mine life. Mine life depends on ore available which is also uncertain andmay vary over time.
The relevant accounting standards are:IAS 37: Provisions, Contingent Liabilities, and Contingent Assets (similar to UK standard FRS 12)SFAS 143: Accounting for Asset Retirement ObligationsCICA Handbook Section 3110: Asset Retirement Obligations

PwC
Notes: Asset impairment
Mining and Money 41
Future cash inflows may be affected by such things as changes in future costs, difficult or unstableground conditions, damage such as flooding, tailings dam failure, etc., and difficulties or delays withdevelopment or expansion. These are “physical” impairment of assets. Economic impairment might becaused by decreases in grade or the amount of ore and decreases in metal prices i.e., what was orebecomes rock.
Depreciation expense is computed on a unit‐of‐production basis:Depreciation rate = (Acquisition cost – Residual value)/Estimated production
Depreciation expense = Depreciation rate Units producedUndepreciated value = Acquisition cost – Depreciation expense
Only proven and probable reserves are used in calculating the estimated production of a mine. Thisaffects estimates of the depreciation rate.
Each of the factors involved in determining impairment interact. For example, if the estimatedproduction decreases because reserves decrease, the depreciation rate increases. However, if the unitsproduced decrease for other reasons, the depreciation expense might remain the same.The relevant standards are:
IAS 36: Impairment of AssetsFASB 144: Accounting for the Impairment or Disposal of Long‐Lived AssetsCICA Handbook, Section 3063: Impairment of Long‐lived Assets
PwCPwC
How to estimate mineral resources
Map and sample deposit (e.g., drillholes)
Use appropriate estimation technique (determined by geologist)
Geological interpretation done by geologist whocarries out the estimationdecides whether resource is inferred, indicated, or measured
Reporting standards (discussed later) do not specify the estimation method to be used nor the procedures for use of any method
Mining and Money 42

PwCPwC
Resource estimation – two examples
Possible underestimation
Possible overestimation
Mining and Money 43
PwC
Notes: Resource Estimation – two examples
Two possible orebody configurations are shown. The data from the drillholes would be thesame for both configurations. Assuming continuity between each drillhole may lead to overor under‐estimation of the resource depending on the configuration. Possibly the only wayto resolve the interpretation of the data is to drill more holes (so‐called “infill” drilling) Anexperienced geologist is required to interpret the available data.
Mining and Money 44

PwCPwC
Minto Project,Yukon Territories
Capstone Mining CorporationChalcopyrite and bornitemineralization9 Mt ore with average grades:
1.78% copper0.62 g/t gold7.3 g/t silver
7 year mine life
Source: Technical Report (NI 43‐101) for the Minto Project, Hatch Associates, August 2006
Mining and Money 45

PwCPwC
Minto Project: N-S Geological Cross-section
Continuity is assumed between drillholes
Mining and Money 46

PwCPwC
Minto ProjectResource Estimate
From inferred to indicated to measured
Shape of resource dictated by geological cross‐section
Mining and Money 47
PwC
Notes: Minto Project Resource Estimate
The resource estimate is classified into inferred, indicated and measured. The measuredresource is the area where the most drill hole data are available while the inferred andindicated resources are in areas with fewer drill holes.The extent and orientation of the inferred and indicated resources are suggested by thegeological cross‐section which shows a northerly‐southerly orientation of themineralization. Thus, for example, the inferred and indicated resources circled with thedashed red line is oriented as shown even though there is only one drill hole at the centerof the indicated resource. Note that no continuity is assumed between these resources andthe other resources to the east.
Source: Technical Report (NI 43‐101) for the Minto Project, Hatch Associates, August 2006
Mining and Money 48

PwCPwC
A quote defining a distinction
From Teck Cominco 2006 Annual Report, p. 110 in reference toHighland Valley Copper:
Reserves have been drill defined at 60 to 115 meter [197‐377ft] centres and resources at 125 meter [410 ft] centres.
Mining and Money 49
PwC
Notes: A quote defining a distinction
The transition from probable to proven reserves depends on geological informationobtained from drillholes. Consider the quote from Teck Cominco 2006 Annual Report, p.110 in reference to Highland Valley Copper:
Reserves have been drill defined at 60 to 115 meter [197‐377 ft] centres and resourcesat 125 meter [410 ft] centres.
Note that at Highland Valley, all reserves are proven and all resources are indicated.
At the Bagdad mine different drillhole spacings are used to establish estimates of probableand proven reserves of concentrator ore. For probable reserves, it is 440 ft whereas forproven reserves it is 190 ft. (Phelps Dodge 2005 Annual Report, p. 16) Different spacingsare used for leach ore and the spacings change depending on the characteristics of theorebody.
For proven reserves the drill spacing to define reserves at Highland Valley is greater thanthat at Bagdad. There is no specific drill spacing that defines reserves – it depends partly onthe geological environment and partly on the physical conditions at a mine.
Mining and Money 50

PwCPwC
National Instrument 43-101 (NI 43-101)
Rules developed by Canadian Securities Administrators (CSA) togovern how issuers of shares in a mining company disclosescientific and technical information about mineral projects to thepublic
Applies to:oral statementswritten documents (eg feasibility studies)websites
Requires that all disclosure be supervised by or advised by a“qualified person” (QP)
Mining and Money 51

PwC
Notes: National Instrument 43-101 (NI 43-101)
Copies of NI 43‐101 can be found athttp://www.ccpg.ca/profprac/index.php?lang=en&subpg=natguidelines
A “qualified person” is responsible for the content of any technical report or disclosure ofscientific information concerning mineral projects. The QP must be independent of theowner of the mineral project and must have demonstrable experience and competence inthe preparation or evaluation of information and data related to mineral projects.A qualified person is an individual whoa) is an engineer or geoscientist with at least five years of experience in mineral
exploration, mine development or operation or mineral project assessment, or anycombination of these;
b) has experience relevant to the subject matter of the mineral project and the technicalreport; and
c) is in good standing with a professional association and, in the case of a foreignassociation listed in Appendix A, has the corresponding designation in Appendix A
See Appendix A in NI 43‐101 for foreign designations recognized.
Mining and Money 52

PwCPwC
Feasibility Studies
Comprehensive documents usually carried out by consultingengineering companies
Cost: $100k to >$1M‐$4M depending on level of detail, time
NI 43‐101 defines two types:Pre‐feasibility study – makes reasonable assumptions aboutrelevant factorsFeasibility study – all factors considered in sufficient detail toallow a decision on financing project
Mining and Money 53

PwC
Notes: Feasibility Studies
Pre‐feasibility study (aka “Preliminary Feasibility Study”)a comprehensive study of the viability of a mineral project that has advanced to a stage where themining method, in the case of underground mining, or the pit configuration, in the case of an open pit,has been established and an effective method of mineral processing has been determined, andincludes a financial analysis based on reasonable assumptions of technical, engineering, legal,operating, economic, social, and environmental factors and the evaluation of other relevant factorswhich are sufficient for a qualified person, acting reasonably, to determine if all or part of the mineralresource may be classified as a mineral reserve
Feasibility studya comprehensive study of a mineral deposit in which all geological, engineering, legal, operating,economic, social, environmental and other relevant factors are considered in sufficient detail that itcould reasonably serve as the basis for a final decision by a financial institution to finance thedevelopment of the deposit for mineral production
Note: financial institution or a mining company. Sometimes the adjective “bankable” is used but thiscan only be decided by a bank or lending institution.
See www.sedar.com to download copies of feasibility studies or technical reports from publiccompanies.
Mining and Money 54

PwC
The need for reporting standards
Actual cases of information withheld in direct conflict with NI 43‐101 or similar:
• Significant parts of orebody are difficult to process – poor recovery
• Large water‐bearing fault intersects orebody
• Local groups do not want mine
• Legislation may change economic viability
• 7% royalty paid to numbered company owned by CEO and three directors on board of six
Mining and Money 55
PwCPwC
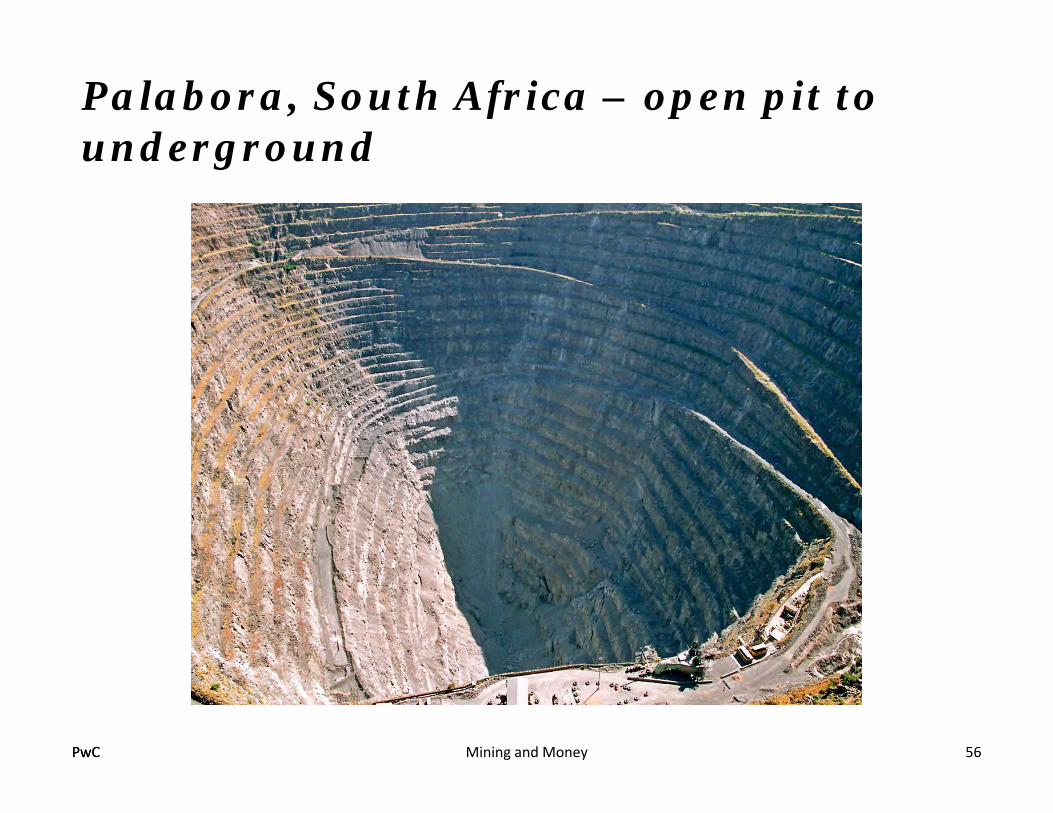
Palabora, South Africa – open pit to underground
Mining and Money 56
PwCPwC
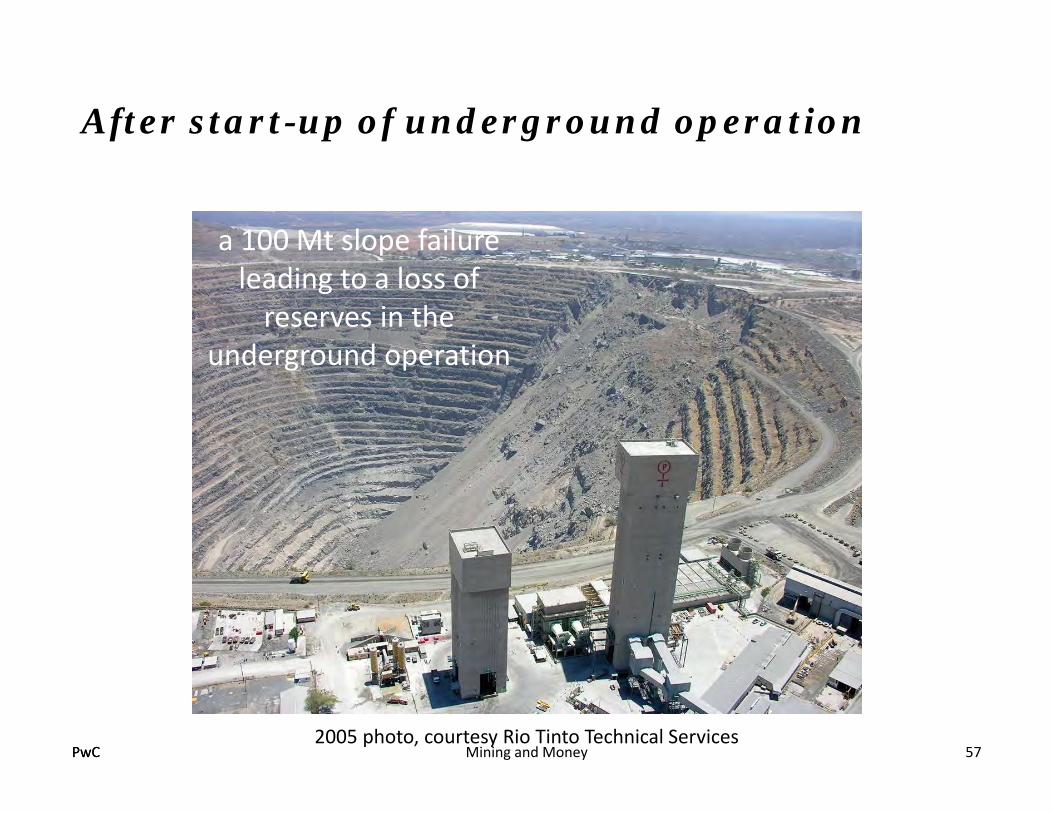
After start-up of underground operation
Mining and Money 57
a 100 Mt slope failure leading to a loss of reserves in the
underground operation
2005 photo, courtesy Rio Tinto Technical Services

PwC
Notes: After start-up of underground operation
Underground caving began in April 2002. Cave breakthrough to the pit floor is estimated tohave occurred in December 2003. Cracks were then observed in northwest wall and thefailure grew to involve 100Mt over a period of 18 months. Movement and crackingoccurred within 300 m from the pit rim and affected or damaged the following facilities:
haul road and access roadtailings and water supply lineswater supply reservoirrailway line44 KV power line
The failure is composed of waste material and some of it entered the underground mineand diluted the ore. The underground operation was seriously jeopardized as a result.
Source:Moss A, Diachenko S, and Townsend P, 2006 Interaction between the block cave and the pit slopes atPalabora mine, The Journal of The South African Institute of Mining and Metallurgy, 106:479‐484
Mining and Money 58
PwCPwC
But more importantly …
Mining and Money
The slide caused a loss of ore reserves in the undergroundoperation. The slide might have been predicted had there beensufficient geotechnical information.
Grade and tonnage of reserves and resources can be defined withsufficient drillhole data. But reserves imply mining and othertechnical factors have been considered. This raises a question:
Can reserves be defined without geotechnical information?
Likely not, but no standard is available yet.The Large Open Pit Project (http://www.lop.csiro.au/) has developed guidelines for dealing with uncertainty ingeotechnical data. It will be some time before these are incorporated into a standard having the same authority as NI43‐101.
59

PwCPwC
END OF PART 5
Mining and Money 60