© 2006 prentice hall, inc.9 – 1 operations management layout decision © 2006 prentice hall, inc....
TRANSCRIPT
© 2006 Prentice Hall, Inc. 9 – 1
Operations ManagementOperations Management
Layout DecisionLayout Decision
© 2006 Prentice Hall, Inc.
Sesi 6 – Henry Yuliando
© 2006 Prentice Hall, Inc. 9 – 2
Outline
Global Company Profile: McDonald’s
The Strategic Importance Of Layout Decisions
Types of Layout Office Layout
© 2006 Prentice Hall, Inc. 9 – 3
When you complete this chapter, you should be able to:Identify or Define:
Learning Objectives
Fixed-position layout Process-oriented layout Work cells Focused work center Office layout
© 2006 Prentice Hall, Inc. 9 – 4
When you complete this chapter, you should be able to:Identify or Define:
Learning Objectives
Retail layout Warehouse layout Product-oriented layout Assembly-line
© 2006 Prentice Hall, Inc. 9 – 5
When you complete this chapter, you should be able to:Describe or Explain:
Learning Objectives
How to achieve a good layout for the process facility
How to balance production flow in a repetitive or product-oriented facility
© 2006 Prentice Hall, Inc. 9 – 6
Innovations at McDonald’s
Indoor seating (1950s) Drive-through window (1970s) Adding breakfast to the menu
(1980s) Adding play areas (1990s)
Three out of the four are layout decisions!
© 2006 Prentice Hall, Inc. 9 – 7
Fifth major innovation Sandwiches assembled in order Elimination of some steps, shortening
of others No food prepared ahead except patty New bun toasting machine and new
bun formulation Repositioning condiment containers Savings of $100,000,000 per year in
food costs
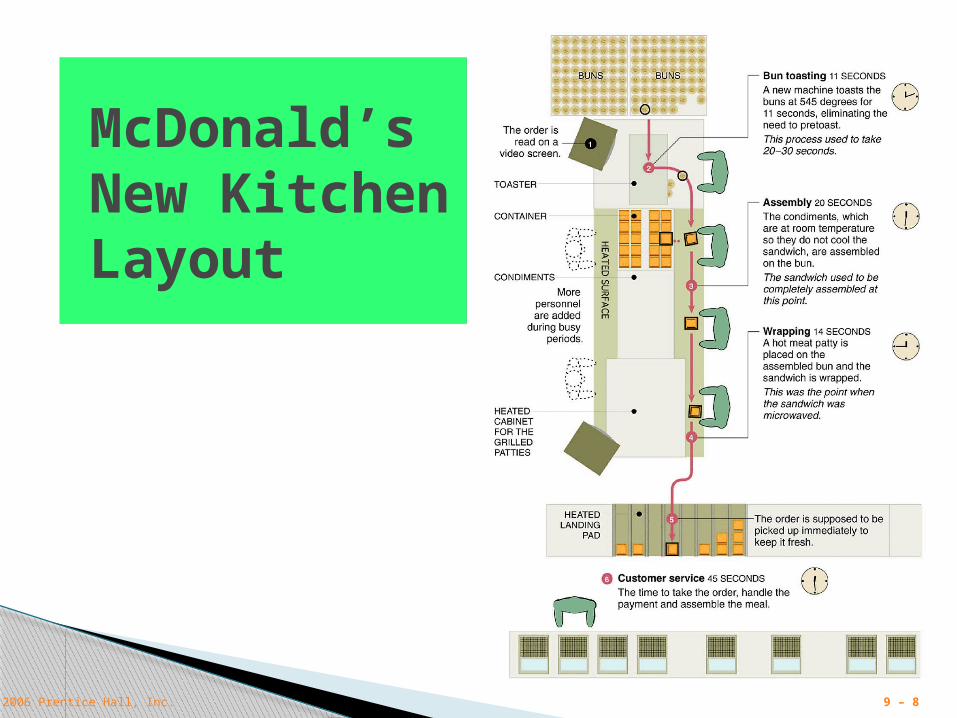
McDonald’s New Kitchen Layout
© 2006 Prentice Hall, Inc. 9 – 8
McDonald’s New Kitchen Layout
© 2006 Prentice Hall, Inc. 9 – 9
Strategic Importance of Layout Decisions
The objective of layout strategy is to develop an economic layout
that will meet the firm’s competitive requirements
© 2006 Prentice Hall, Inc. 9 – 10
Types of Layout
1. Office layout - positions workers, their equipment, and spaces/offices to provide for movement of information
2. Retail layout - allocates shelf space and responds to customer behavior
3. Warehouse layout - addresses trade-offs between space and material handling
© 2006 Prentice Hall, Inc. 9 – 11
Types of Layout
4. Fixed-position layout - addresses the layout requirements of large, bulky projects such as ships and buildings
5. Process-oriented layout - deals with low-volume, high-variety production (also called job shop or intermittent production)
© 2006 Prentice Hall, Inc. 9 – 12
Types of Layout
6. Work cell layout - a special arrangement of machinery and equipment to focus on production of a single product or group of related products
7. Product-oriented layout - seeks the best personnel and machine utilizations in repetitive or continuous production
© 2006 Prentice Hall, Inc. 9 – 13
Good Layouts Consider
1. Material handling equipment
2. Capacity and space requirements
3. Environment and aesthetics
4. Flows of information
5. Cost of moving between various work areas
© 2006 Prentice Hall, Inc. 9 – 14
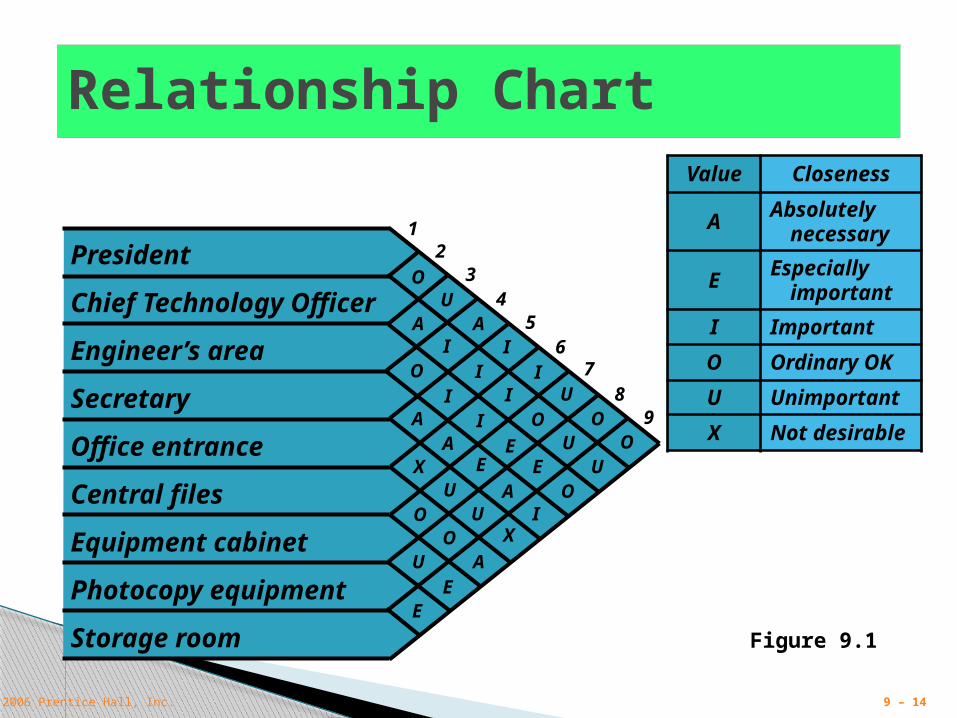
Relationship ChartValue Closeness
A Absolutely necessary
E Especially important
I Important
O Ordinary OK
U Unimportant
X Not desirable
President
Chief Technology Officer
Engineer’s area
Secretary
Office entrance
Central files
Equipment cabinet
Photocopy equipment
Storage room
O
UA
X
O
U
A
I
OA
I
O
U
AI
I
A
UO
AU O
UX
O I
U
OII
I
E
EE
E E
12
34
56
78
9
Figure 9.1
© 2006 Prentice Hall, Inc. 9 – 15
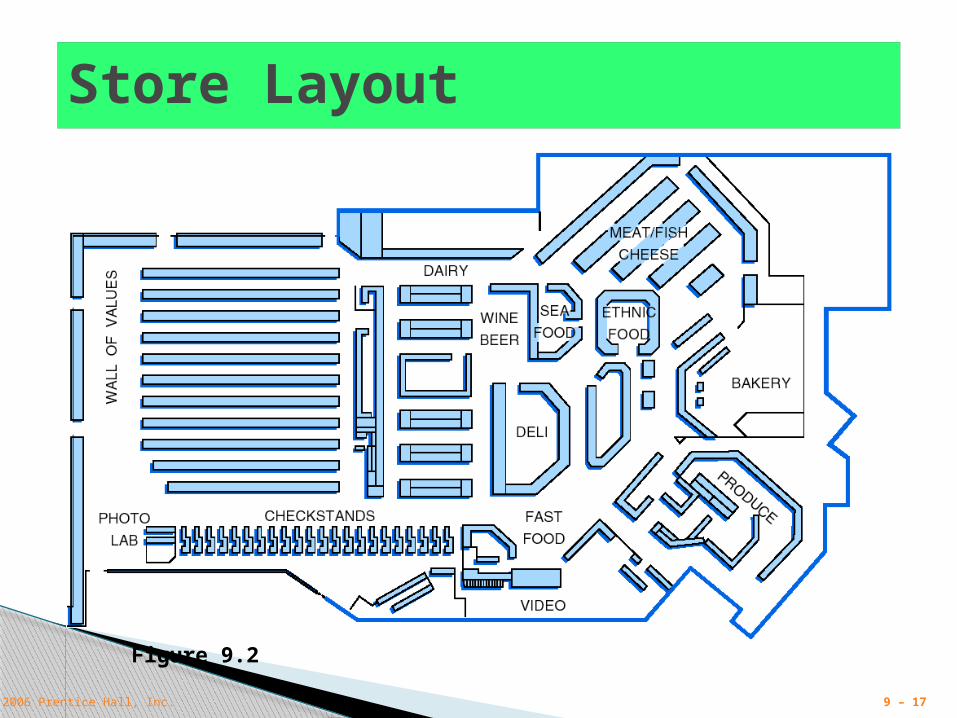
Supermarket Retail Layout
Objective is to maximize profitability per square foot of floor space
Sales and profitability vary directly with customer exposure
© 2006 Prentice Hall, Inc. 9 – 16
Five Helpful Ideas for Supermarket Layout
1. Locate high-draw items around the periphery of the store
2. Use prominent locations for high-impulse and high-margin items
3. Distribute power items to both sides of an aisle and disperse them to increase viewing of other items
4. Use end-aisle locations
5. Convey mission of store through careful positioning of lead-off department
© 2006 Prentice Hall, Inc. 9 – 17
Store Layout
Figure 9.2
© 2006 Prentice Hall, Inc. 9 – 18
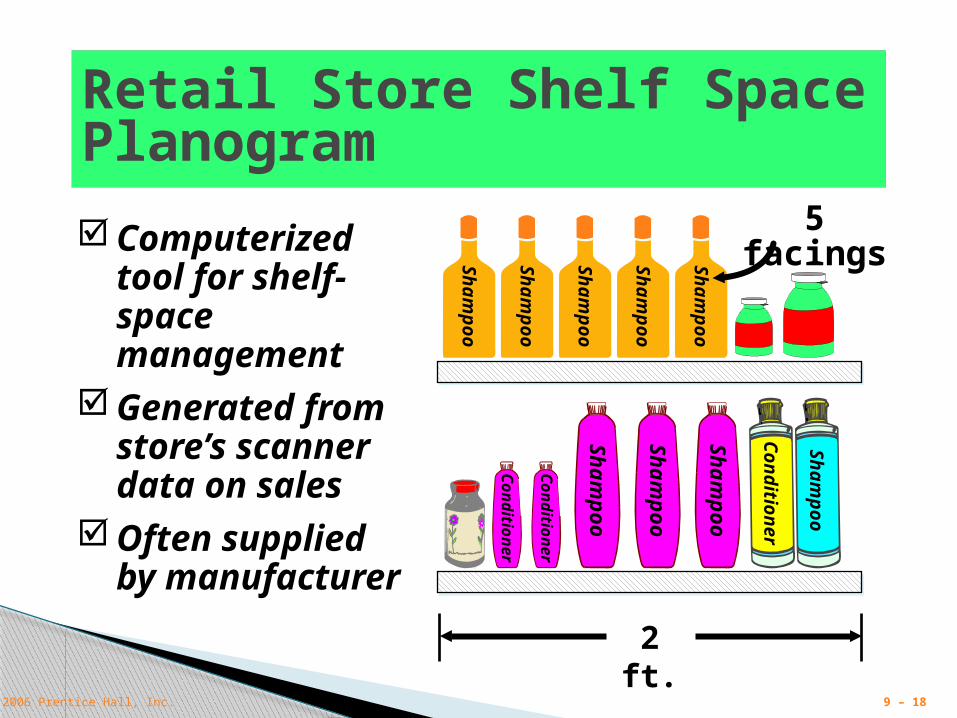
Retail Store Shelf Space Planogram
Computerized tool for shelf-space management
Generated from store’s scanner data on sales
Often supplied by manufacturer
5 facings
Sh
amp
oo
Sh
amp
oo
Sh
amp
oo
Sh
amp
oo
Sh
amp
oo
Co
nd
ition
er
Co
nd
ition
er
Sh
amp
oo
Sh
amp
oo
Sh
amp
oo
Sh
amp
oo
Co
nd
ition
er
2 ft.
© 2006 Prentice Hall, Inc. 9 – 19
Warehousing and Storage Layouts
Objective is to optimize trade-offs between handling costs and costs associated with warehouse space
Maximize the total “cube” of the warehouse – utilize its full volume while maintaining low material handling costs
© 2006 Prentice Hall, Inc. 9 – 20
Warehousing and Storage Layouts
All costs associated with the transaction Incoming transport Storage Finding and moving material Outgoing transport Equipment, people, material, supervision,
insurance, depreciation
Minimize damage and spoilage
Material Handling Costs
© 2006 Prentice Hall, Inc. 9 – 21
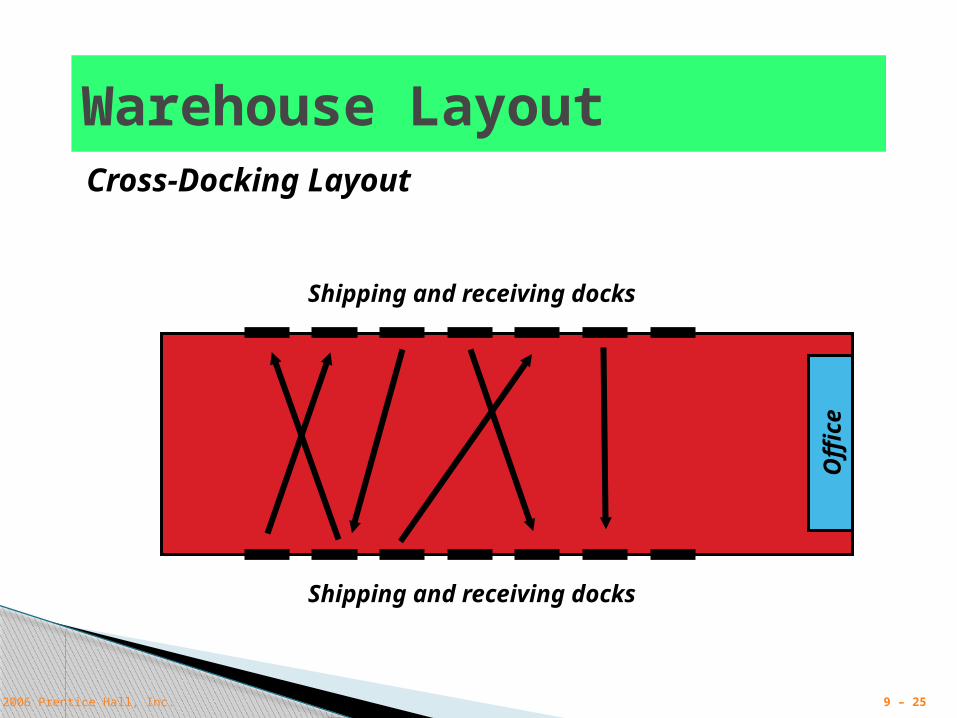
Cross-Docking
Materials are moved directly from receiving to shipping and are not placed in storage in the warehouse
Requires tight scheduling and accurate shipments, typically with bar code identification
© 2006 Prentice Hall, Inc. 9 – 22
Random Stocking
Typically requires automatic identification systems (AISs) and effective information systems
Random assignment of stocking locations allows more efficient use of space
1. Maintain list of open locations
2. Maintain accurate records
3. Sequence items to minimize travel time
4. Combine picking orders
5. Assign classes of items to particular areas
© 2006 Prentice Hall, Inc. 9 – 23
Customization
Value-added activities performed at the warehouse
Enable low cost and rapid response strategies Assembly of components Loading software Repairs Customized labeling and packaging
© 2006 Prentice Hall, Inc. 9 – 24
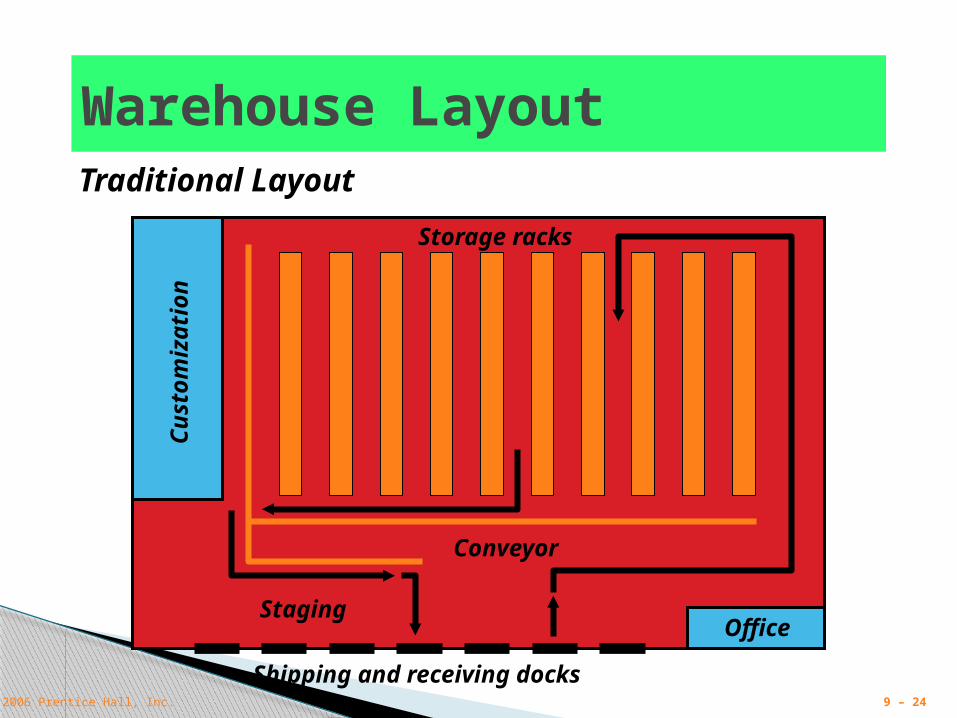
Shipping and receiving docks
Office
Cu
sto
miz
atio
n
Conveyor
Storage racks
Staging
Warehouse LayoutTraditional Layout
© 2006 Prentice Hall, Inc. 9 – 25
Warehouse LayoutCross-Docking Layout
Shipping and receiving docks
Off
ice
Shipping and receiving docks
© 2006 Prentice Hall, Inc. 9 – 26
Fixed-Position Layout
Product remains in one place Workers and equipment come to
site Complicating factors
Limited space at site Different materials required at
different stages of the project Volume of materials needed is
dynamic
© 2006 Prentice Hall, Inc. 9 – 27
Alternative Strategy
As much of the project as possible is completed off-site in a product-
oriented facility
This can significantly improve efficiency but is only possible when
multiple similar units need to be created
© 2006 Prentice Hall, Inc. 9 – 28
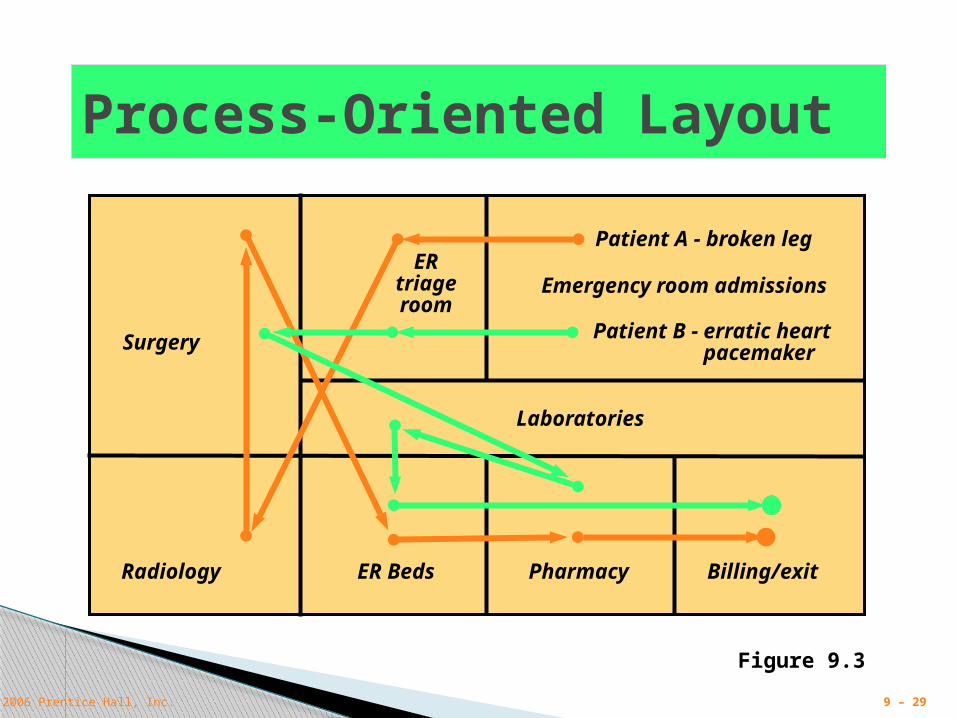
Process-Oriented Layout
Like machines and equipment are grouped together
Flexible and capable of handling a wide variety of products or services
Scheduling can be difficult and setup, material handling, and labor costs can be high
© 2006 Prentice Hall, Inc. 9 – 29
Surgery
Radiology
ER triage room
ER Beds Pharmacy
Emergency room admissions
Billing/exit
Laboratories
Process-Oriented Layout
Patient A - broken leg
Patient B - erratic heart pacemaker
Figure 9.3
© 2006 Prentice Hall, Inc. 9 – 30
Process-Oriented Layout
Arrange work centers so as to minimize the costs of material handling
Basic cost elements areNumber of loads (or people) moving
between centersDistance loads (or people) move
between centers
© 2006 Prentice Hall, Inc. 9 – 31
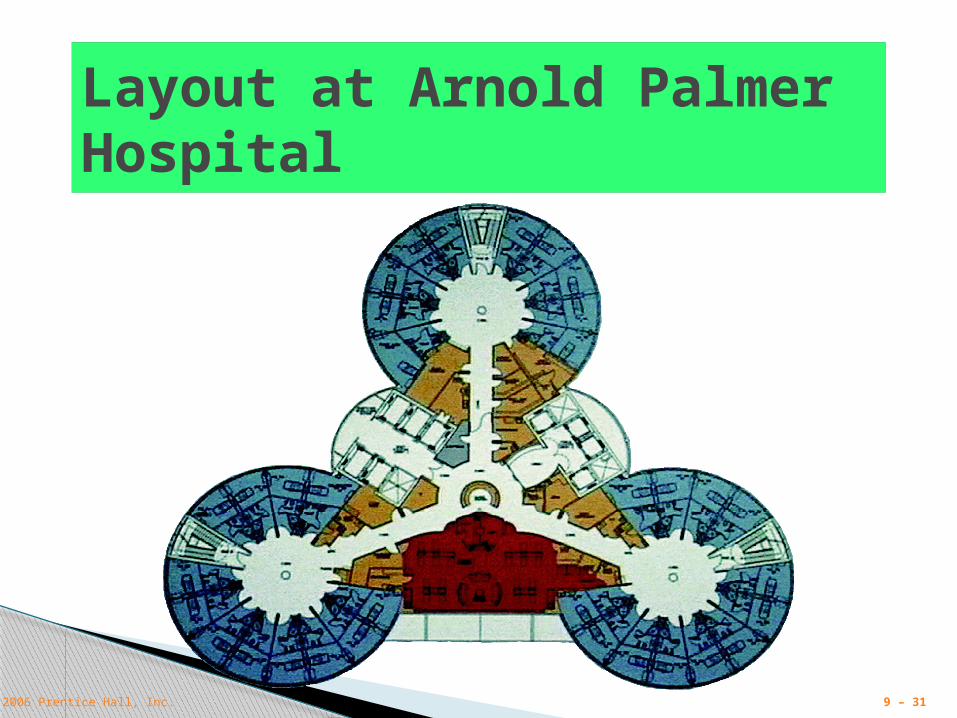
Layout at Arnold Palmer Hospital
© 2006 Prentice Hall, Inc. 9 – 32
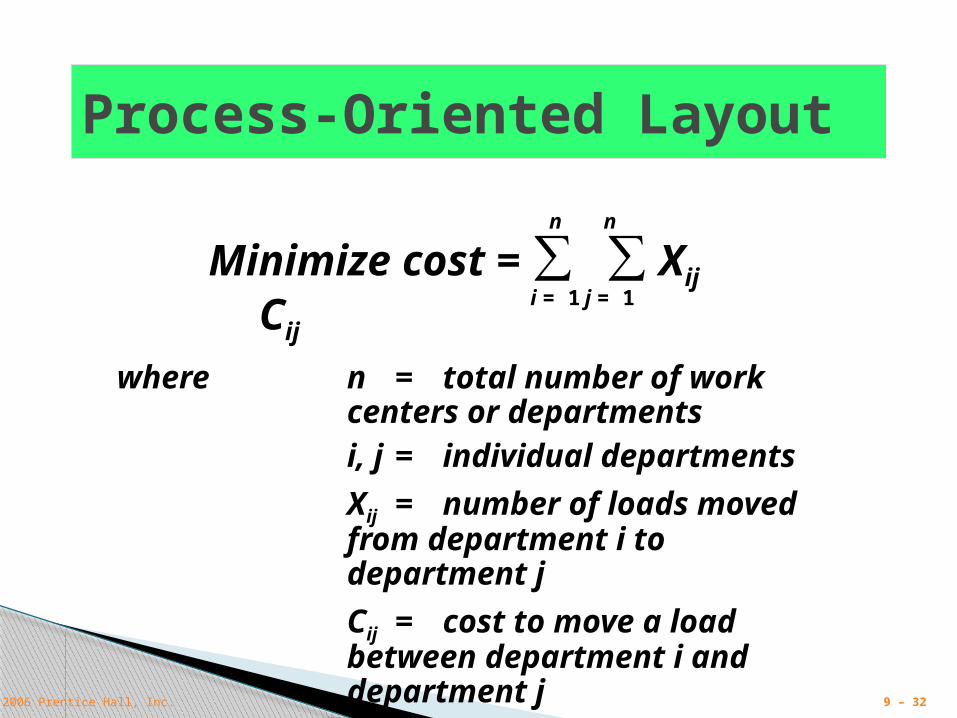
Process-Oriented Layout
Minimize cost = ∑ ∑ Xij Cij
n
i = 1
n
j = 1
where n = total number of work centers or departmentsi, j = individual departments
Xij = number of loads moved from department i to department j
Cij = cost to move a load between department i and department j
© 2006 Prentice Hall, Inc. 9 – 33
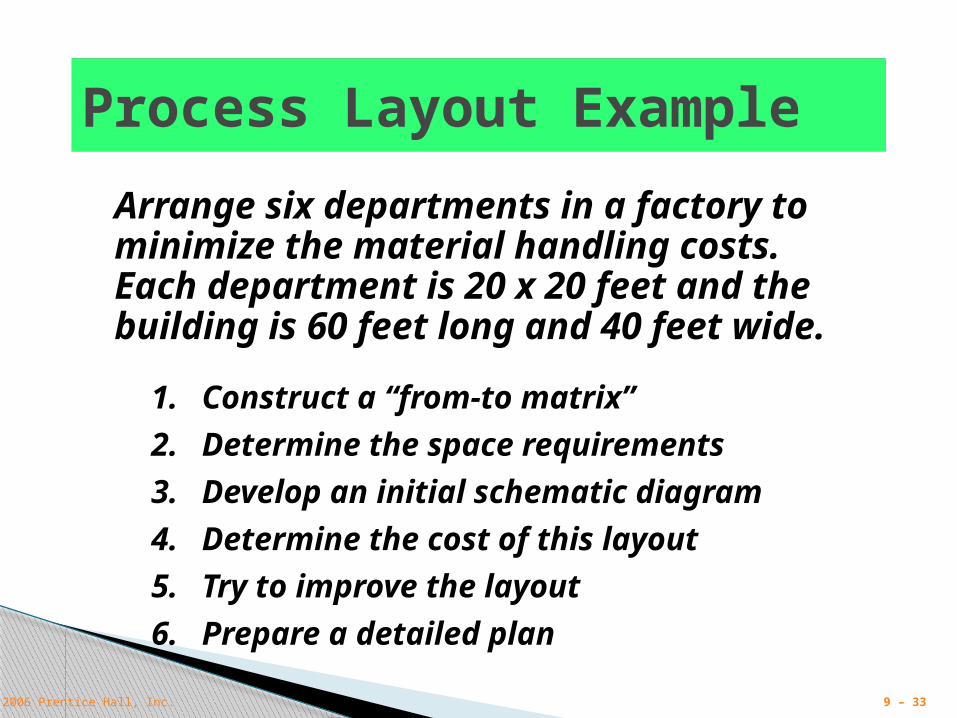
Process Layout Example
1. Construct a “from-to matrix”
2. Determine the space requirements
3. Develop an initial schematic diagram
4. Determine the cost of this layout
5. Try to improve the layout
6. Prepare a detailed plan
Arrange six departments in a factory to minimize the material handling costs. Each department is 20 x 20 feet and the building is 60 feet long and 40 feet wide.
© 2006 Prentice Hall, Inc. 9 – 34
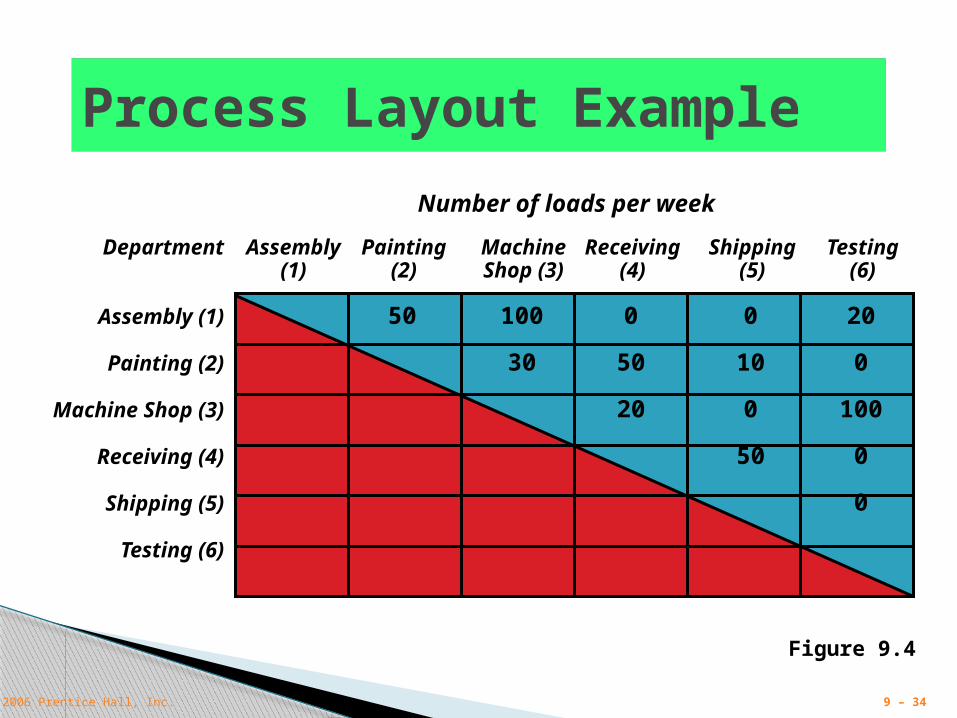
Department Assembly Painting Machine Receiving Shipping Testing(1) (2) Shop (3) (4) (5) (6)
Assembly (1)
Painting (2)
Machine Shop (3)
Receiving (4)
Shipping (5)
Testing (6)
Number of loads per week
50 100 0 0 20
30 50 10 0
20 0 100
50 0
0
Process Layout Example
Figure 9.4
© 2006 Prentice Hall, Inc. 9 – 35
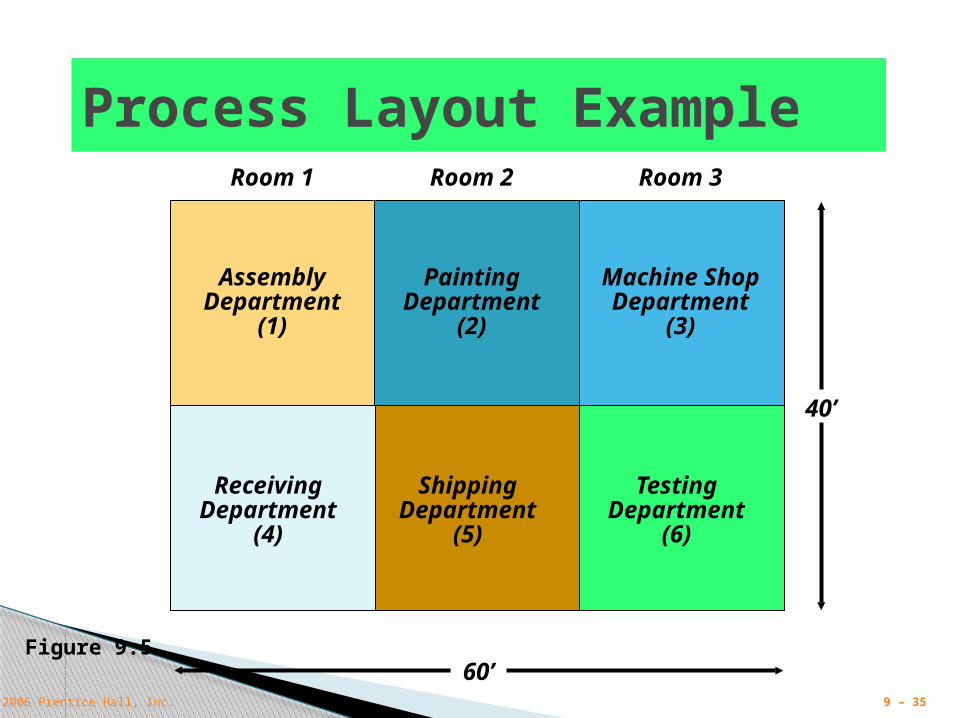
Room 1 Room 2 Room 3
Room 4 Room 5 Room 6
60’
40’
Process Layout Example
Receiving Shipping TestingDepartment Department Department
(4) (5) (6)
Figure 9.5
Assembly Painting Machine ShopDepartment Department Department
(1) (2) (3)
© 2006 Prentice Hall, Inc. 9 – 36
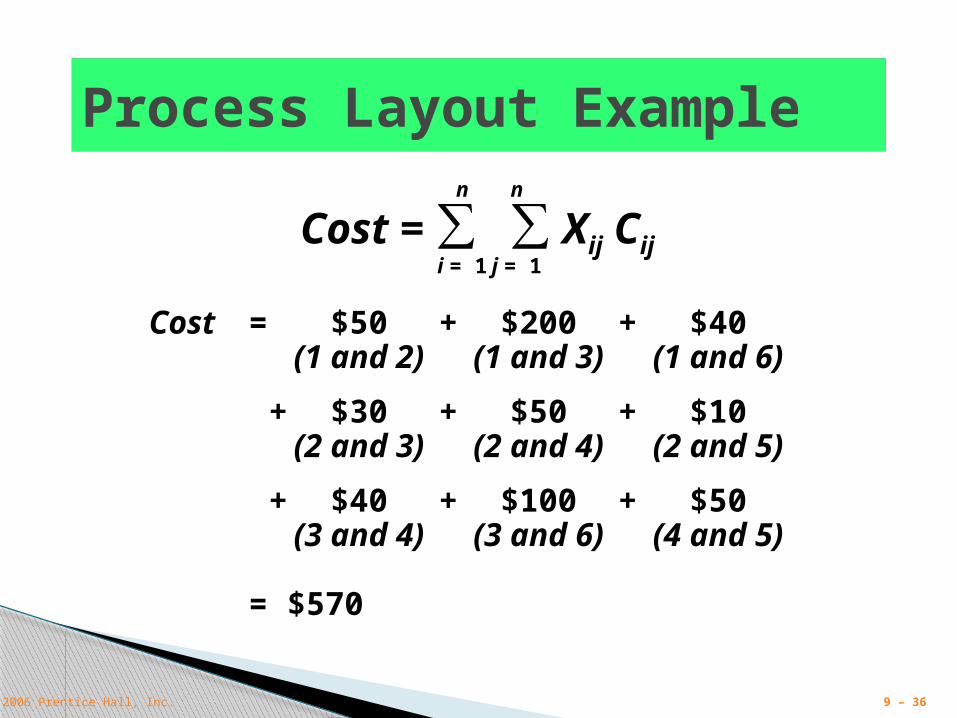
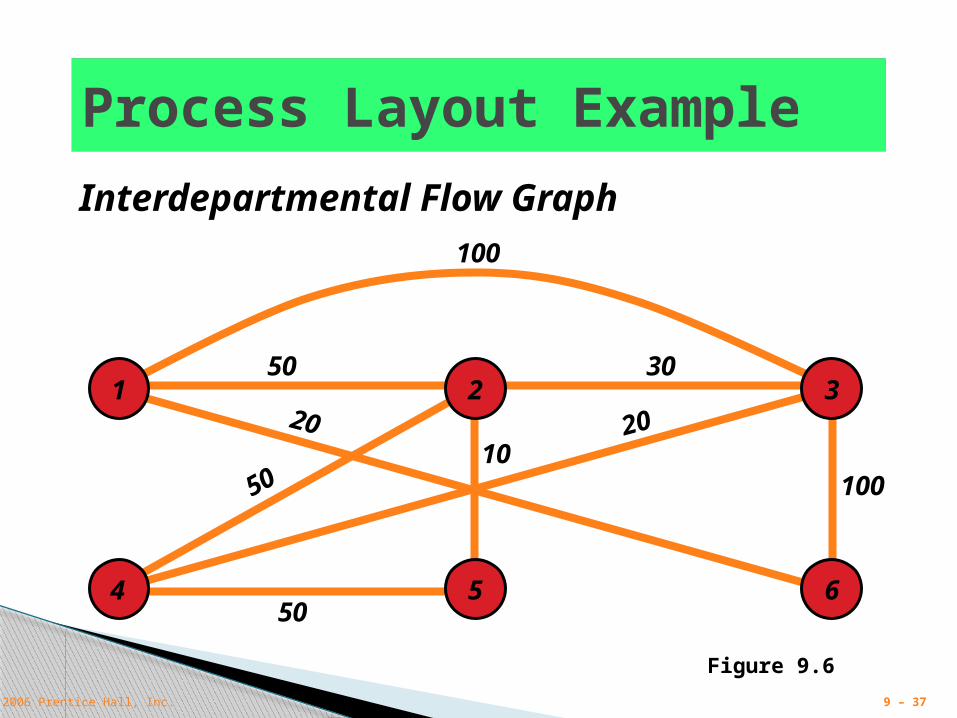
Process Layout Example
Cost = $50 + $200 + $40(1 and 2) (1 and 3) (1 and 6)
+ $30 + $50 + $10(2 and 3) (2 and 4) (2 and 5)
+ $40 + $100 + $50(3 and 4) (3 and 6) (4 and 5)
= $570
Cost = ∑ ∑ Xij Cij
n
i = 1
n
j = 1
© 2006 Prentice Hall, Inc. 9 – 37
100
50
20
50
50
2010
100
30
Process Layout Example
Interdepartmental Flow Graph
1 2 3
4 5 6
Figure 9.6

© 2006 Prentice Hall, Inc. 9 – 38
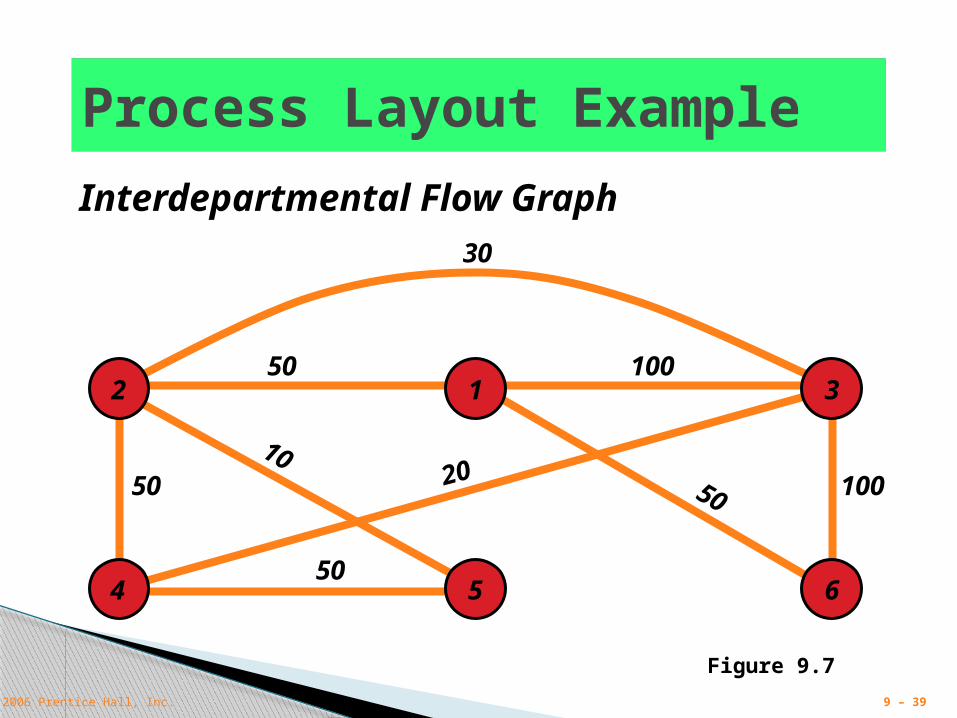
Process Layout Example
Cost = $50 + $100 + $20(1 and 2) (1 and 3) (1 and 6)
+ $60 + $50 + $10(2 and 3) (2 and 4) (2 and 5)
+ $40 + $100 + $50(3 and 4) (3 and 6) (4 and 5)
= $480
Cost = ∑ ∑ Xij Cij
n
i = 1
n
j = 1
© 2006 Prentice Hall, Inc. 9 – 39
Process Layout Example
30
50
10
50
502050 100
100
Interdepartmental Flow Graph
2 1 3
4 5 6
Figure 9.7
© 2006 Prentice Hall, Inc. 9 – 40
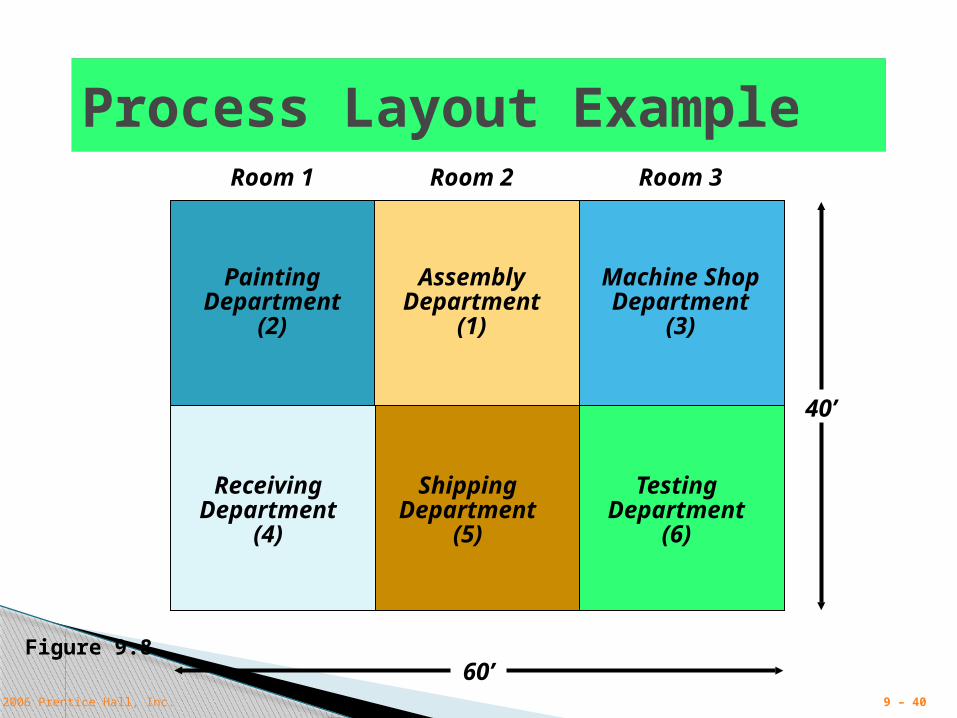
Room 1 Room 2 Room 3
Room 4 Room 5 Room 6
60’
40’
Process Layout Example
Receiving Shipping TestingDepartment Department Department
(4) (5) (6)
Figure 9.8
Painting Assembly Machine ShopDepartment Department Department
(2) (1) (3)
© 2006 Prentice Hall, Inc. 9 – 41
Computer Software
Graphical approach only works for small problems
Computer programs are available to solve bigger problems CRAFT ALDEP CORELAP
Factory Flow
© 2006 Prentice Hall, Inc. 9 – 42
Work Cells
Reorganizes people and machines into groups to focus on single products or product groups
Group technology identifies products that have similar characteristics for particular cells
Volume must justify cells Cells can be reconfigured as
designs or volume changes
© 2006 Prentice Hall, Inc. 9 – 43
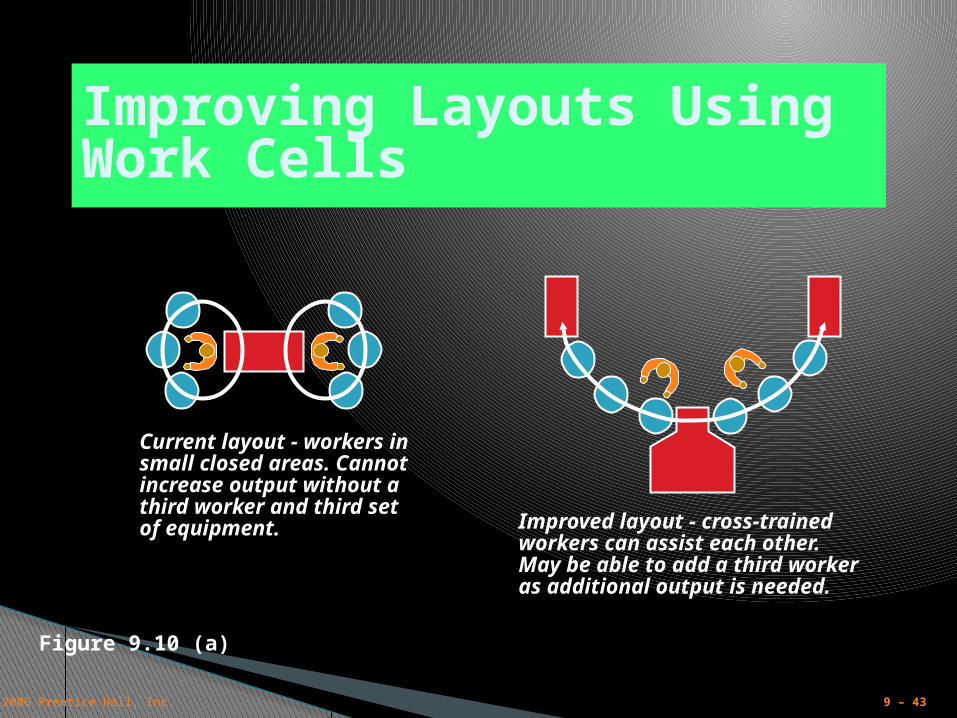
Improving Layouts Using Work Cells
Current layout - workers in small closed areas. Cannot increase output without a third worker and third set of equipment. Improved layout - cross-trained
workers can assist each other. May be able to add a third worker as additional output is needed.
Figure 9.10 (a)
© 2006 Prentice Hall, Inc. 9 – 44
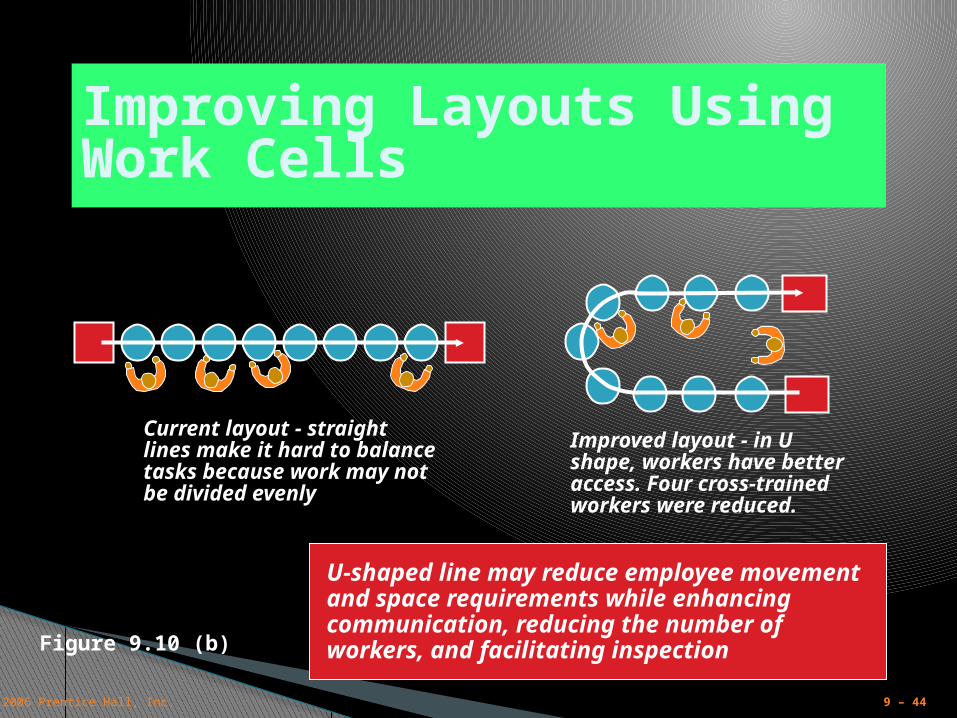
Improving Layouts Using Work Cells
Current layout - straight lines make it hard to balance tasks because work may not be divided evenly
Improved layout - in U shape, workers have better access. Four cross-trained workers were reduced.
Figure 9.10 (b)
U-shaped line may reduce employee movement and space requirements while enhancing communication, reducing the number of workers, and facilitating inspection
© 2006 Prentice Hall, Inc. 9 – 45
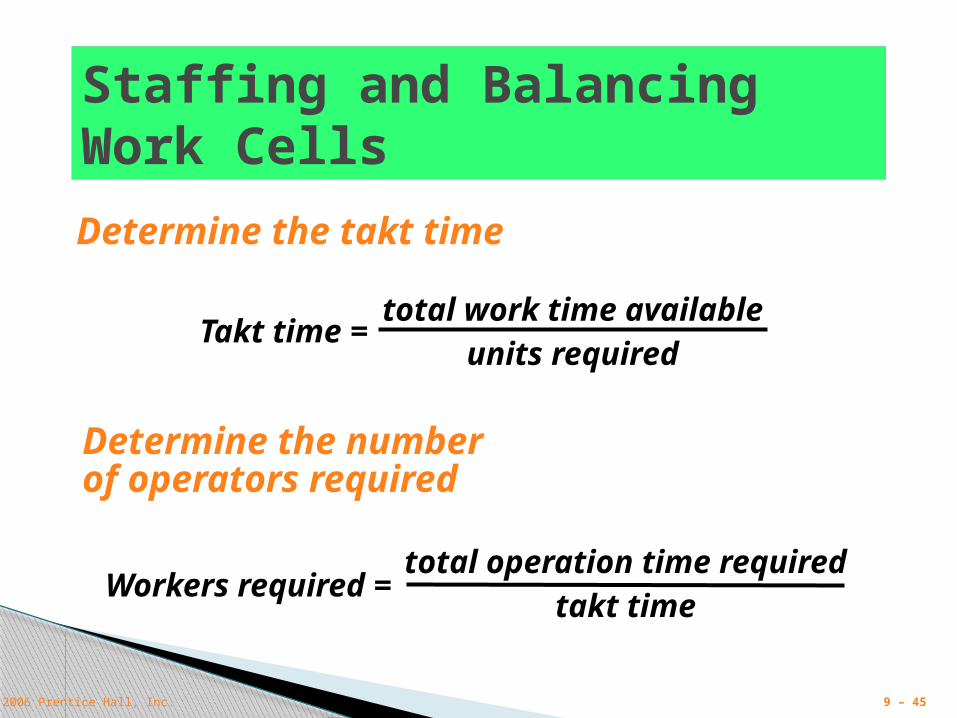
Staffing and Balancing Work CellsDetermine the takt time
Takt time =total work time available
units required
Determine the number of operators required
Workers required =total operation time required
takt time
© 2006 Prentice Hall, Inc. 9 – 46
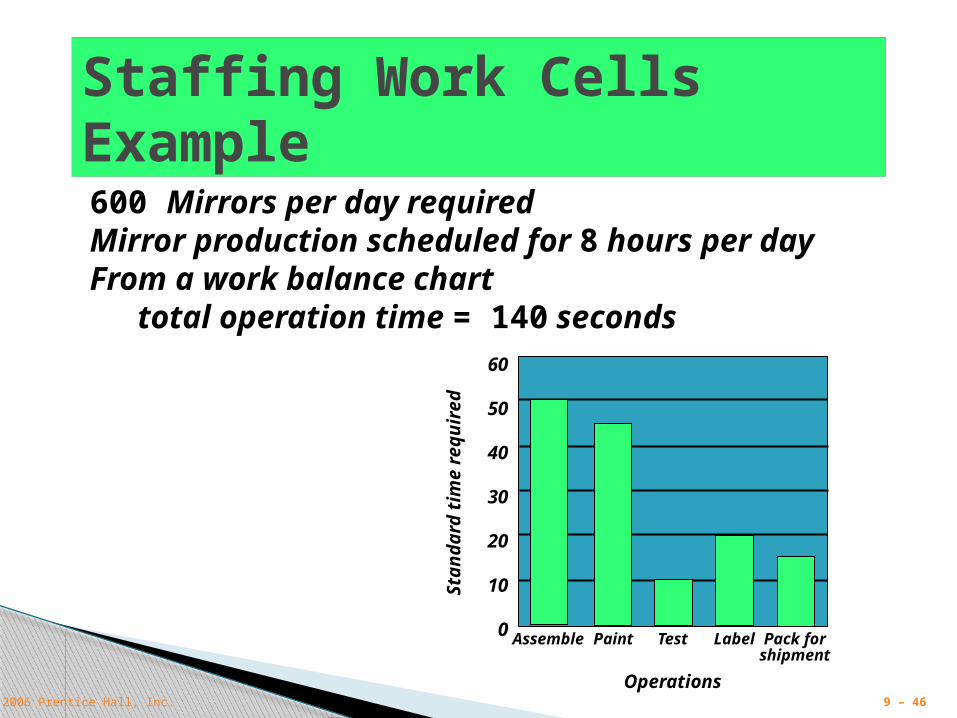
Staffing Work Cells Example600 Mirrors per day requiredMirror production scheduled for 8 hours per dayFrom a work balance chart
total operation time = 140 seconds
Sta
nd
ard
tim
e re
qu
ired
Operations
Assemble Paint Test Label Pack forshipment
60
50
40
30
20
10
0
© 2006 Prentice Hall, Inc. 9 – 47
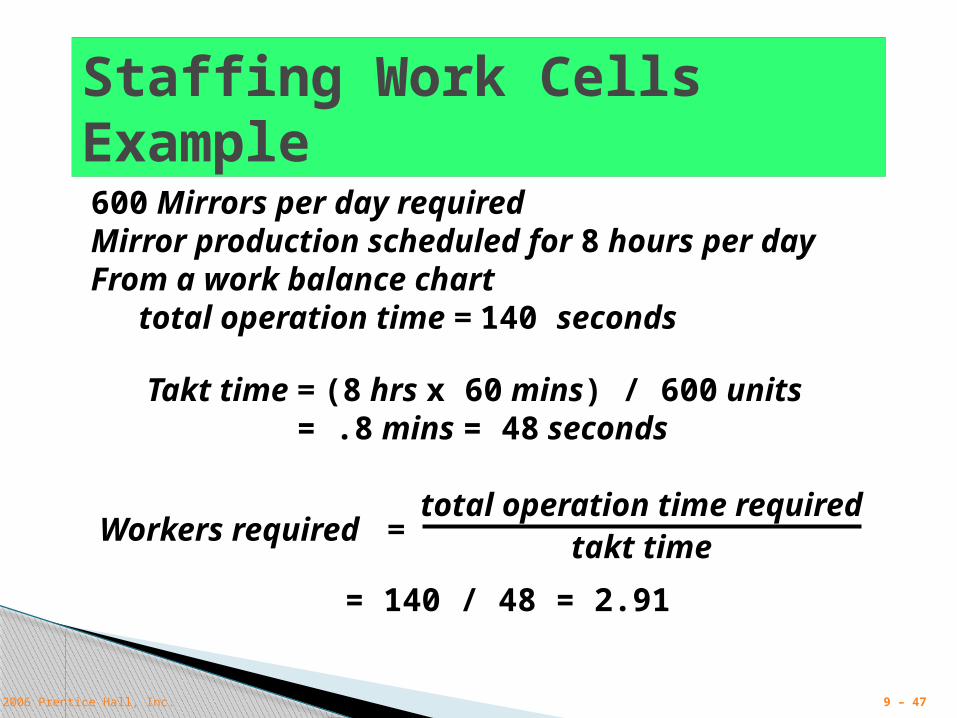
600 Mirrors per day requiredMirror production scheduled for 8 hours per dayFrom a work balance chart
total operation time = 140 seconds
Staffing Work Cells Example
Takt time = (8 hrs x 60 mins) / 600 units = .8 mins = 48 seconds
Workers required =total operation time required
takt time
= 140 / 48 = 2.91