© 2006 pearson prentice hall lecture outlines powerpoint chapter 7 earth science 11e...
TRANSCRIPT

© 2006 Pearson Prentice Hall
Lecture Outlines PowerPoint
Chapter 7
Earth Science 11e
Tarbuck/Lutgens
Earthquakes and Earth’s InteriorChapter 7
General features • Vibration of Earth produced by the rapid
release of energy • Associated with movements along faults
Explained by the plate tectonics theory Mechanism for earthquakes was first
explained by H. Reid • Rocks "spring back" – a phenomena called
elastic rebound• Vibrations (earthquakes) occur as rock
elastically returns to its original shape
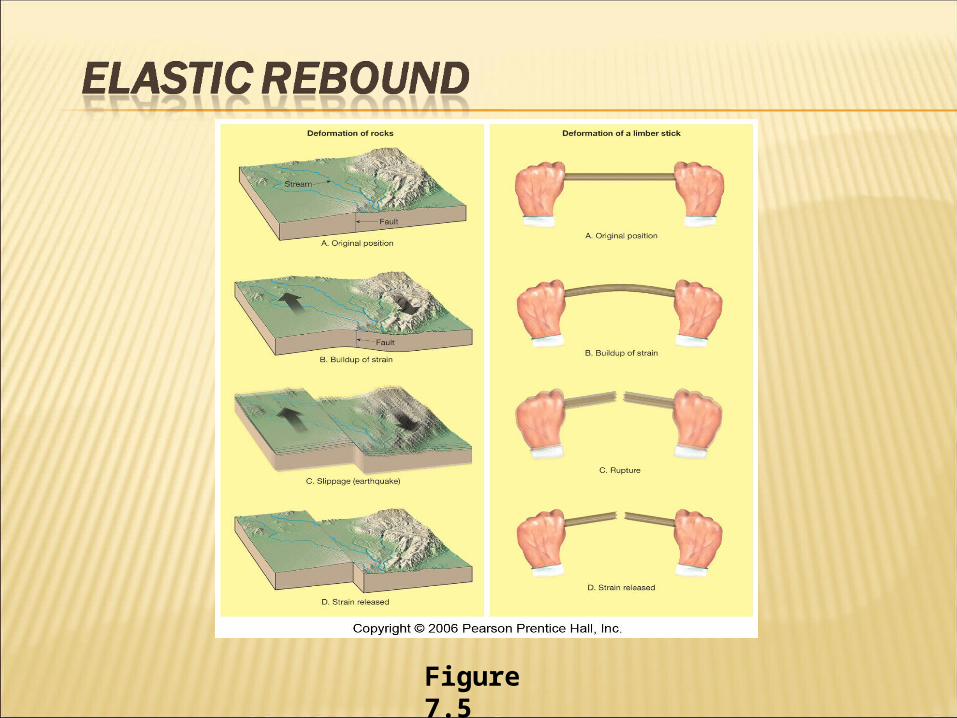
Figure 7.5

General features • Earthquakes are often preceded by
foreshocks and followed by aftershocks

Earthquake waves • Study of earthquake waves is called
seismology • Earthquake recording instrument
(seismograph) Records movement of Earth Record is called a seismogram
• Types of earthquake waves Surface waves
• Complex motion • Slowest velocity of all waves

Figure 7.6

Figure 7.7


Earthquake waves• Types of earthquake waves
Body waves • Primary (P) waves
• Push-pull (compressional) motion • Travel through solids, liquids, and
gases• Greatest velocity of all earthquake
waves

Figure 7.8 B

Earthquake waves• Types of earthquake waves
Body waves • Secondary (S) waves
• "Shake" motion • Travel only through solids • Slower velocity than P waves

Figure 7.8 D

Locating an earthquake • Focus – the place within Earth where
earthquake waves originate• Epicenter
Point on the surface, directly above the focus
Located using the difference in the arrival times between P and S wave recordings, which are related to distance

Figure 7.2
The fault is the fracture along which the blocks of crust on either side have moved relative to one another parallel to the fracture.

Locating an earthquake • Epicenter
Three station recordings are needed to locate an epicenter
• Circle equal to the epicenter distance is drawn around each station
• Point where three circles intersect is the epicenter
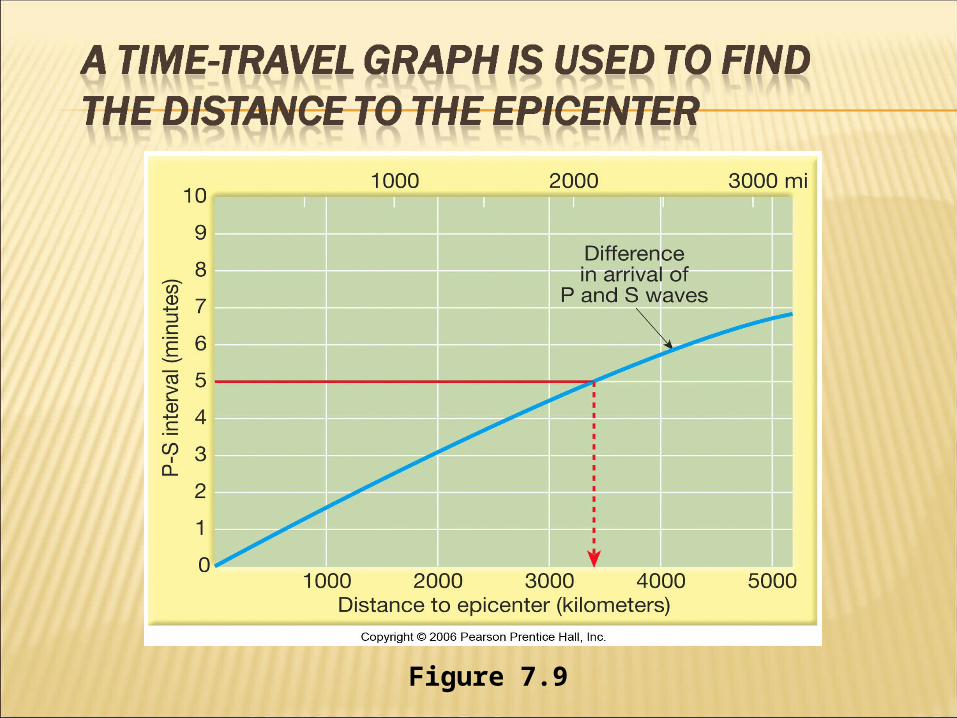
Figure 7.9
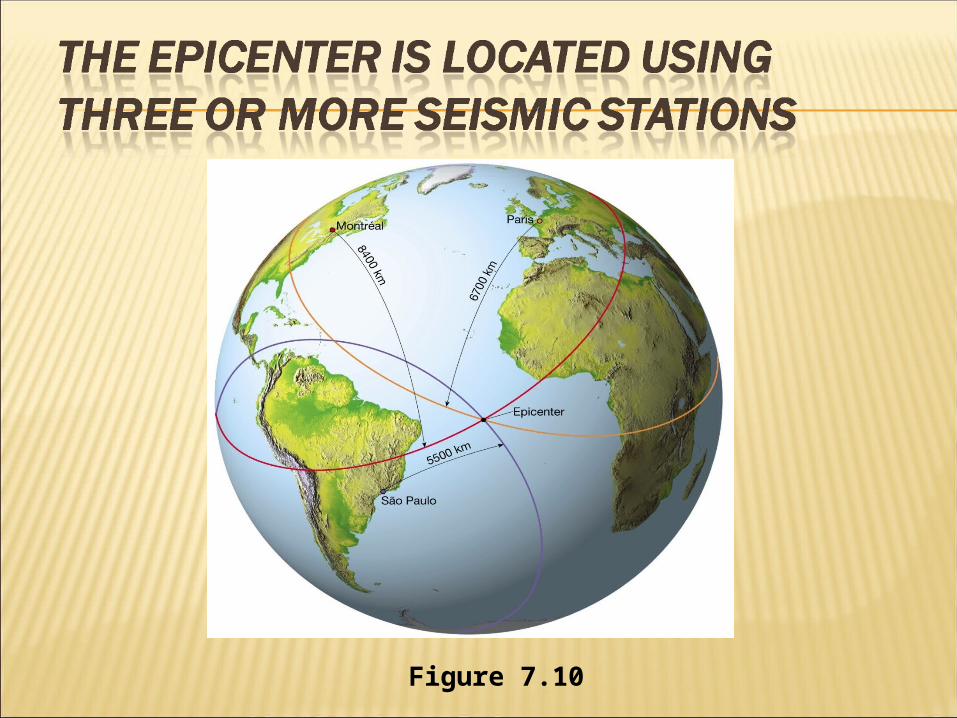
Figure 7.10

Annually• An estimated 30,000 earthquakes
that are strong enough to be felt occur.
Locating an earthquake • Earthquake zones are closely
correlated with plate boundaries Circum-Pacific belt Oceanic ridge system

Figure 7.11

Earthquake intensity and magnitude • Intensity
A measure of the degree of earthquake shaking at a given locale based on the amount of damage
Most often measured by the Modified Mercalli Intensity Scale
• Magnitude Concept introduced by Charles Richter in
1935
Earthquake intensity and magnitude• Magnitude
Often measured using the Richter scale • Based on the amplitude of the largest
seismic wave • Each unit of Richter magnitude equates
to roughly a 32-fold energy increase • Does not estimate adequately the size
of very large earthquakes

Earthquake intensity and magnitude• Magnitude
Moment magnitude scale • Measures very large earthquakes • Derived from the amount of
displacement that occurs along a fault zone

Earthquake destruction • Factors that determine structural
damage Intensity of the earthquake Duration of the vibrations Nature of the material upon which the
structure rests The design of the structure

Earthquake destruction • Destruction results from
Ground shaking Liquefaction of the ground
• Saturated material turns fluid • Underground objects may float to
surface Tsunami, or seismic sea waves
Occur due to vertical crust displacement Landslides and ground subsidence Fires

Figure 7.14
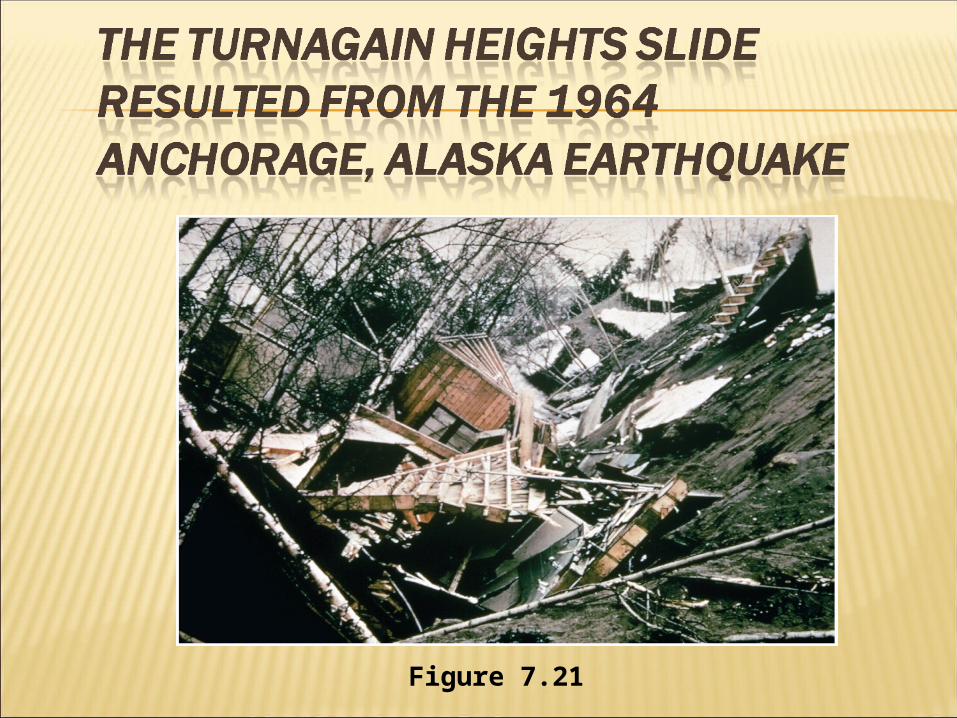
Figure 7.21
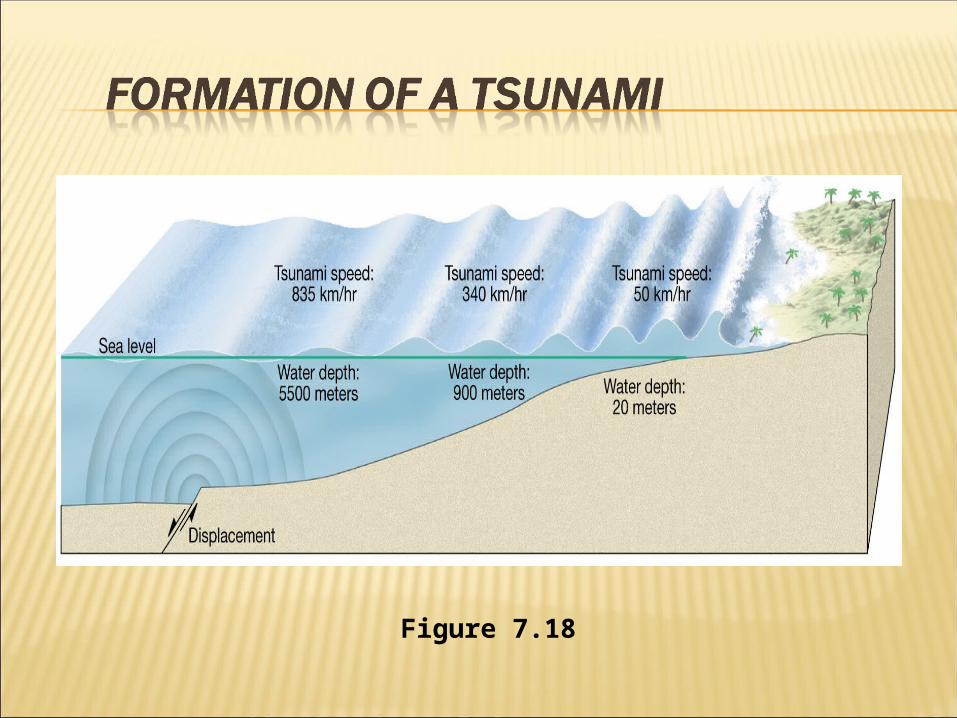
Figure 7.18

Figure 7.20


Earthquake prediction • Short-range – no reliable method yet
devised for short-range prediction• Long-range forecasts
Premise is that earthquakes are repetitive Region is given a probability of a quake
Most of our knowledge of Earth’s interior comes from the study of P and S earthquake waves • Travel times of P and S waves through
Earth vary depending on the properties of the materials
• S waves travel only through solids

Figure 7.24

Layers defined by composition • Crust
Thin, rocky outer layer Varies in thickness
• Roughly 7 km (5 miles) in oceanic regions • Continental crust averages 35-40 km (25
miles) • Exceeds 70 km (40 miles) in some
mountainous regions

Layers defined by composition • Crust
Continental crust • Upper crust composed of granitic (felsic
composition) rocks • Lower crust is more akin to basalt• Average density is about 2.7 g/cm3 • Up to 4 billion years old

Layers defined by composition • Crust
Oceanic Crust • Basaltic composition • Density about 3.0 g/cm3 • Younger (180 million years or less) than the
continental crust

Layers defined by composition • Mantle
Below crust to a depth of 2900 kilometers (1800 miles)
Composition of the uppermost mantle is the igneous rock peridotite (changes at greater depths)
Layers defined by composition • Outer Core
Below mantle A sphere having a radius of 3486 km (2161
miles) Composed of an iron-nickel alloy Average density of nearly 11 g/cm3
Layers defined by physical properties • Lithosphere
Crust and uppermost mantle (about 100 km thick)
Cool, rigid, solid • Asthenosphere
Beneath the lithosphere Upper mantle To a depth of about 660 kilometers Soft, weak layer that is easily deformed

Layers defined by physical properties • Mesosphere (or lower mantle)
660-2900 km More rigid layer Rocks are very hot and capable of gradual
flow
• Outer core Liquid layer 2270 km (1410 miles) thick Convective flow of metallic iron within
generates Earth’s magnetic field

Layers defined by physical properties • Inner Core
Sphere with a radius of 1216 km (754 miles)
Behaves like a solid
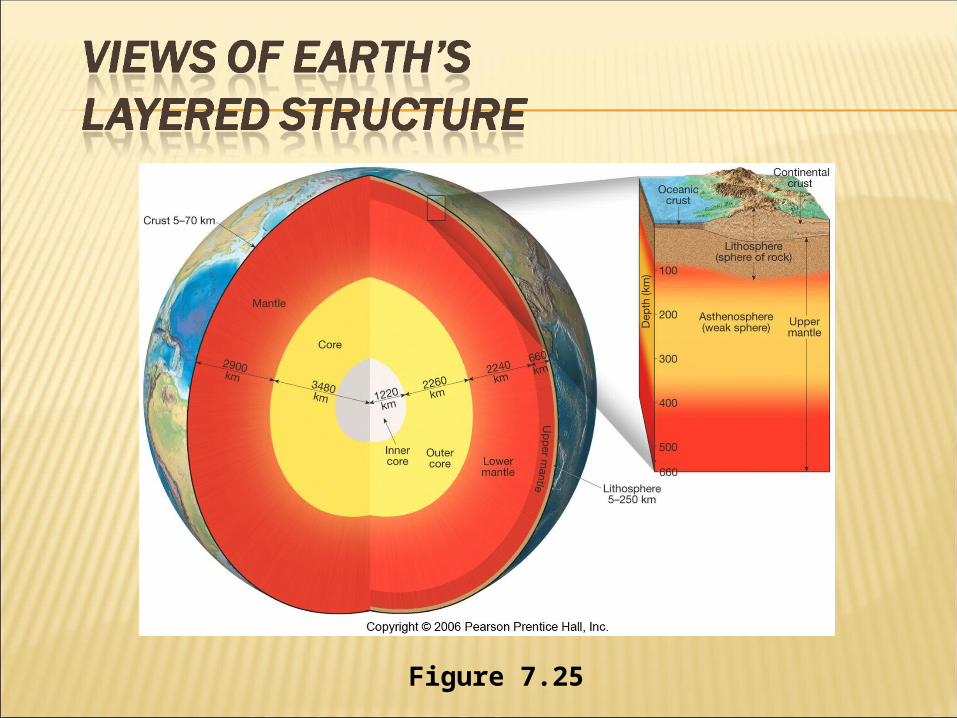
Figure 7.25

Discovering Earth’s major layers • Discovered using changes in seismic
wave velocity • Mohorovicic discontinuity
Velocity of seismic waves increases abruptly below 50 km of depth
Separates crust from underlying mantle
Discovering Earth’s major layers • Shadow zone
Absence of P waves from about 105 degrees to 140 degrees around the globe from an earthquake
Explained if Earth contained a core composed of materials unlike the overlying mantle
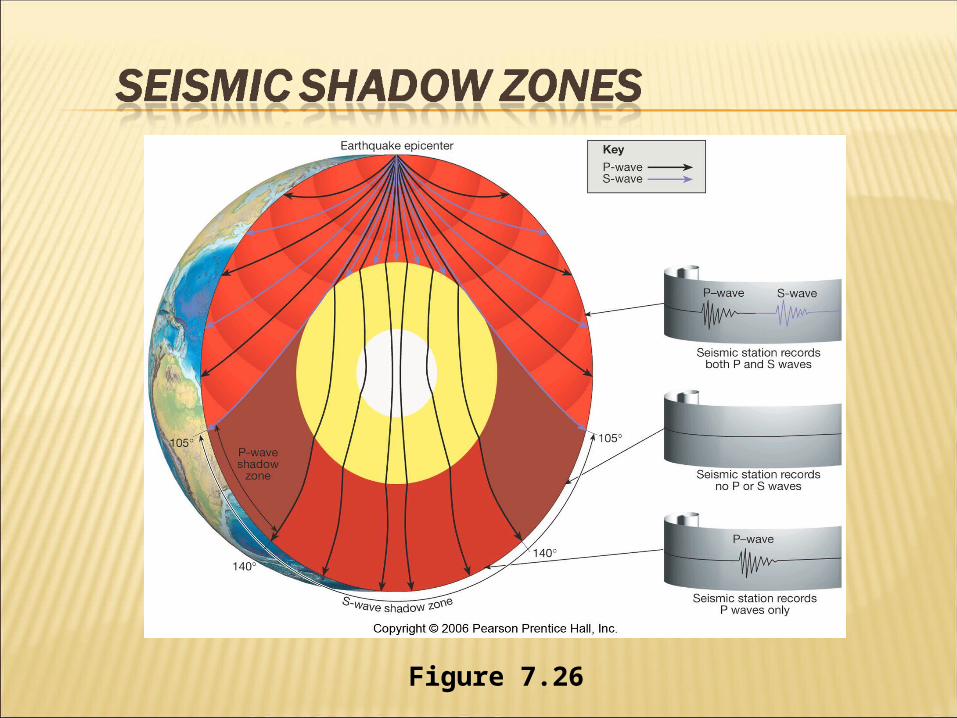
Figure 7.26

Discovering Earth’s major layers • Inner core
Discovered in 1936 by noting a new region of seismic reflection within the core
Size was calculated in the 1960s using echoes from seismic waves generated during underground nuclear tests
Discovering Earth’s composition • Oceanic crust
Prior to the 1960s scientists had only seismic evidence from which to determine the composition of oceanic crust
Development of deep-sea drilling technology made the recovery of ocean floor samples possible
Discovering Earth’s composition • Mantle
Composition is more speculative Lava from the asthenosphere has a
composition similar to that which results from the partial melting of a rock called peridotite
• Core Evidence comes from meteorites
• Composition ranges from metallic meteorites made of iron and nickel to stony varieties composed of dense rock similar to peridotite

Discovering Earth’s composition• Core
Evidence comes from meteorites • Iron, and other dense metals, sank to
Earth’s interior during the planet’s early history
Earth’s magnetic field supports the concept of a molten outer core
• Earth’s overall density is also best explained by an iron core