zyman institute of brand science - zibs.com marketing metrics to financial... · zyman institute of...
TRANSCRIPT

Zyman Institute of Brand Science
“Brand-Driven Business Performance”
ZIBS Technical Report
Linking Marketing Metrics to Financial Performance
Rajendra Srivastava, David J. Reibstein and Yogesh V. Joshi

Technical Report Series The Zyman Institute of Brand Science (ZIBS) is an innovation research group based at Emory University's Goizueta Business School. ZIBS fosters rich collaborations between business managers and leading scholars worldwide. The institute supports advanced research in brand management with the ultimate goal of developing positively useful knowledge that drives superior business performance. Relevancy in research is core to ZIBS. Research topics are elected by a steering committee consisting of executive managers and leading scholars. ZIBS supports research in next practices (vs. best practices) with resources and funding. ZIBS insures the application of this research through knowledge sharing activities like executive briefings, consultative interventions, roundtables, and conferences. Stay Informed. Visit zibs.com to signup for our mailing list. Report Access Corporate Membership: ZIBS member companies receive all ZIBS reports free of charge. To learn more about corporate membership visit zibs.com. Purchasing Single Reports: ZIBS makes some reports available for individual purchase. To purchase these reports please visit zibs.com Report Archive: ZIBS reports for all years are accessible on zibs.com for member firms. Member Services Change of Address: Send both old and new address to [email protected]. For Academics Classroom Use: Upon written request working papers may be copied for one-time classroom use free of charge. Contact [email protected] to obtain permission.
Special Memberships: ZIBS can arrange special memberships for Academic Members and Market Research Members. Please visit Working Paper Submissions: Faculty researchers in branding are encouraged to submit working papers to ZIBS, regardless of where the research funding originated. The research must represent an advancement over existing literature and not be widely disseminated elsewhere. Funding is available to interpret the working papers into a format that best conveys managerial insights. Research Proposals: ZIBS supports researchers worldwide with research resources (funding, data, analysis, etc). We encourage researchers to submit proposals for consideration. Visit zibs.com/research for more information and to download the research proposal template.
Working Paper Status Articles that appear in ZIBS Technical Research Reports have not undergone a formal academic peer review. They are released as working papers, which means they are a document released for discussion and represent cutting edge knowledge but are not considered an authoritative text until they pass peer review.
Intellectual Property ZIBS Research Reports are not to be reproduced or published, in any form or any means, electronic or mechanical, without written permission. The views expressed are those of the authors. ZIBS Research Reports 2006 © Emory University. All rights reserved.
Linking Marketing Metrics to Financial Performance
Rajendra K. Srivastava holds the Roberto Goizueta Chair of Marketing at Goizueta Business School, Emory University David J. Reibstein is the William Stewart Woodside Professor, Professor of Marketing at The Wharton School, University of Pennsylvania Yogesh V. Joshi is a doctoral candidate at The Wharton School, University of Pennsylvania Summary
1. Introduction While a lot has been said about the need for marketing metrics, not much has been said about its connections with financial consequences, especially, elements of firm value. In this paper, we propose a framework that extends the current ones in linking individual marketing actions via marketing metrics to financial metrics and the intangible assets composing a firm’s value. In doing so, we focus our attention on (i) the impact that marketing has on value creation in the short term and over the long term, and (ii) the reduction in variability or risk of cash flows enabled by a well planned marketing strategy. Within this framework, we discuss the development of individual marketing metrics, and identify areas where (i) metrics, (ii) their links to financial consequences, or (iii) links to firm value; are lacking. We present an analysis of how marketing science research would enable us to address some of these gaps.
For a long time now (1997-2006), the Marketing Science Institute (MSI) has identified marketing metrics and marketing productivity as one of its top research priorities. This problem domain has included various aspects such as assessing marketing ROI, linking internal marketing program metrics (e.g., awareness) to external financial metrics (e.g., ROI), the valuation of customers, the valuation of brands, the valuation of innovation, measuring short- and long-term effects of marketing spend, and global/international metrics and measures. The need for demonstrating the financial consequences of marketing expenditures has also been echoed widely at the Chief Marketing Officers (CMO) Summit jointly hosted by MSI, Wharton and McKinsey in 2002 and 2003. This has predominantly been due to the immense pressure put on companies during the recent economic slowdown at the turn of the century, to cut costs and operate efficiently. Since then, awareness about this
Linking Marketing Metrics to Financial Performance
Zyman Institute of Brand Science
3

topic and research on specific subtopics in this area has already commenced among marketing academics (Reinartz and Kumar 2000, 2003; Rust, Zeithaml, and Lemon 2000; Rust, Moorman, and Dickson 2002) and industry practitioners, albeit most of it is in an early stage. 1.1 Our objectives Given this back drop, this paper has multiple objectives. We first seek to place the existing research in this area in the proper context with respect to the need for linking marketing metrics to financial consequences. Existing research falls into two categories: one is the relevant frameworks proposed to link marketing to overall firm performance (e.g., Srivastava, et. al. 1998, 1999, 2001; Rust, et. al. 2004), and the second is the development of individual marketing metrics for measuring the effectiveness of marketing activities. The latter literature is immense, with developments contributing to it over the past several decades – starting with metrics as basic as advertising elasticity, to recent advances in customer life-time values. Given this challenge, we focus first on the research seeking to relate marketing to firm performance. This enables us to identify whether the marketing function is able to seek the appropriate audience that it needs within the firm. Having identified the limitations of this existing research, we then propose a conceptual framework that expand the links between marketing metrics and operational financial metrics (e.g., ROI, ROA) to incorporate a links between marketing metrics and the long term
value of the firm (i.e., intangible assets). While this ensures that marketing’s impact is emphasized at all levels in the organization, from a research perspective it opens up gaps where appropriate metrics as well as appropriate links might not be developed, and strategic questions might have remain unanswered. We illustrate these gaps and the need for theoretical contributions from marketing science with the help of a specific example. While establishing the links between marketing and firm value, we focus our attention on (i) the impact that marketing has on value creation in the short term and over the long term, and (ii) the reduction in variability or risk of cash flows enabled by a well planned marketing strategy. Having established our conceptual framework, we then turn our attention to the existing research on metrics for individual marketing activities, and place those within the proposed structure. While doing so, our focus shall remain on evaluating whether adequate marketing metrics have been established for a particular marketing activity (e.g., to understand the outcomes of advertising campaigns), whether links have been established between these marketing metrics and the financial metrics (e.g., ROI), and whether these metrics have been tied to the intangible assets that are increasingly dictating the firm value. We close with suggestions for future research. 1.3 No dearth of marketing metrics The fundamental issue with evaluating marketing performance has not been that there is a dearth of marketing measures. To the
Zyman Institute of Brand Science
4

contrary, over the past few decades, marketers have developed a myriad metrics for evaluating marketing performance (a good review is presented by Farris, et. al. 2006). Some of these include awareness, preference, purchase intent, share of wallet, customer satisfaction, loyalty, repeat purchase rate, just to name a few. Recent work by Ambler (2000) examines a number of commonly used marketing measures. One of the fundamental issues is that the measures used within the marketing function (e.g., loyalty) differ from those used within the finance function (e.g., ROA), which in turn may differ from those used by the corporate board (e.g., shareholder value). A dominant reason why this is the case is that marketing measures do not fit with the normal language of the firm – an accounting-financial language, and thus marketing performance measures typically fall shy of management needs (Clark 1999; Ambler 2000; Brodie, Glynn and VanDurme 2002). This lack of conformity with the corporate language makes it difficult to compare marketing expenditures with alternative expenditures elsewhere in the organization. In order to communicate well with other functional groups, marketers must learn how to take the next step—converting measures such as price/share premiums and brand loyalty into cash flows and business risk. That poses the challenge of providing a translation of marketing outcomes to financial measures. The interest in finding this link is now greater than ever.
The last several decades has seen a steady shift from firm valuation being based primarily on physical assets to being based on intangible assets (Lusch and Harvey 1984). Where once the value of a firm was predominantly (nearly 80%) determined by tangible assets, today, nearly half of the value of the firm is now based on intangible assets (Ip 2004). Three of the most highly valued intangible assets are intellectual property, brand, and the firm’s customers. Two of the three are clearly assets developed by marketing, and the third, intellectual property (IP), may be potentially connected depending on a firm’s market context, and the extent of a role played by marketing role in developing new products and influencing the innovation process. For example, in a pharmaceutical company, marketing might not contribute much towards the creation of intellectual property, but for a consumer products company it might certainly directly influence the direction IP would take. On limited occasions in the past, researchers have been able to establish a link between everyday marketing metrics and its financial consequence to the firm. The development of marketing mix models has allowed marketers to connect spending to incremental sales and market share (ref). With a direct connection to sales, it was possible to show the financial implications to the firm. Most marketing mix models focus on the impact on sales over the baseline, but few show the impact on the baseline as well, and few questions about the baseline are asked. Also, most of these studies have been criticized because of their poor diagnostic capabilities and their
1.4 Changes in understanding firm value over the longer term
Zyman Institute of Brand Science
5

focus on the short-term outcomes (Anderson 1982; Dekimpe and Hanssens 1995). While companies such as Kraft and General Mills are selling at two to three times book value, P&G’s valuation is a lofty 8.7 times book value, almost equally divided in current value and future expected performance. In other words, while senior managers complain that investors put far too much on short-term quarterly earnings, the market actually puts the majority of value on the ability to manage growth and risk in the future. A fundamental question still remains unanswered – as to what is the long-term impact of many marketing activities? Research on this question is sparse (only recent exceptions are Dekimpe and Hanssens 1999, and Mela, Gupta and Lehmann 1997). The long-term impact could manifest in a variety of ways – it could reduce risks associated with cash flow streams generated by marketing, and create a more sustainable source of revenues for the firm. This might play a more vital role from the perspective of developing a healthy organization that excels both over the short term and the long term. But this accounting standards debate is not likely to be resolved without collaborative research between accountants and marketers. Nonetheless, it is important that top management be willing to pay for certain marketing activities over multiple periods, and not expect every marketing undertaking to have positive short-term results. In particular, it is important to recognize that some marketing activities are focused on building market-based assets where the outcomes have strategic value (e.g.,
building a new channel, investing in brand development, or customer acquisition). Other activities are focused on “maintenance marketing” or where one might leverage market-based assets to enhance short-term performance (e.g., price-promotions that leverage brand equity to extract value for the company). To accomplish this, it is essential we have measures not just of short–term consequences as derived from marketing mix models but also the long-term effects. Analogous to when a company invests in a plant, there is a tangible asset which appears on the books for which there is a known depreciation schedule. While current accounting practices neither permit us to show the long-term effects nor depreciate marketing expenditures, there is no reason why we should not have such long-term measures and recognize these metrics as fundamental assets of the firm. Thus, in order to highlight marketing’s invaluable contribution towards the long term health of a company, it is imperative that we clearly understand how marketing activities at an individual campaign level link to (i) the financial consequences that are the concern of accounting and finance departments, and (ii) the intangible assets that are the concern of the CEO and board of directors managing the ultimate strategic direction for the organization. 2. Existing frameworks that link marketing to firm performance 2.1 A traditional industry perspective – the DuPont Model Since its humble beginnings in 1919, the DuPont model has come a long
Zyman Institute of Brand Science
6

way in being accepted as a standard technique in the industry for defining return on investments, and the definitional components leading up to it (CFO 1998). The role of
marketing activities in enhancing short-term profitability and cash flows can be mapped into the framework of the DuPont model (Figure 1).
Figure 1: Managing Current Profitability Using Traditional Performance Management Tools: The DuPont Model
%Equity
Fin.Lever.
XROE Asset
Turnover
CurrentAssets
Fixed Assets
+TotalAssets
%Inventory
Acct Rec.
Oth. CA’s
+
+
X
Net Margin
GrossMargin
FixedExpenses
Taxes &Interest
OperatingMargin
Sales
%
Sales
COGS
SMA Exp
Other Exp
+ROAX
The DuPont model integrates elements of the income statement with those of the balance sheet. By managing net margins (margins/sales) and asset turnover (sales/assets), companies can “engineer” return on assets (ROA). Marketers have long argued that, in the aggregate, strong marketing investments and performance will result in higher margins as well as turnover as expressed in a “revenue premium” measure of brand equity (Ailawadi, Lehmann, and Neslin
2003). Brand equity and customer loyalty help companies avoid slipping into the commodity trap so prevalent in firms’ approaches to managing customer solutions. In both cases, margins, turnovers, and cash flows are enhanced. While marketers are familiar with the DuPont model, more often than not, they choose to ignore its consequences. Because most salespersons are rewarded on volume and revenue metrics, it not
Zyman Institute of Brand Science
7
surprising that they deliver revenue, not cash flow. If the objective is to maximize volume, sales people are likely to reduce prices whenever possible, promise faster delivery, and figure receivables are someone else’s problem. However, each of these objectives undercuts margins and reduces asset turnover. Customers with less predictable demand who want faster deliveries result in inventory levels. Customers who do not pay in time result in receivables. By decreasing the numerator (margins) and increasing the denominator (assets), these sales tactics ultimately reduce ROA. Marketers’ failure to recognize the importance of margins can lead to results that are quite suboptimal. For example, if a price elasticity estimate of -2 (say a 1 percent decrease in price leads to a 2 percent increase in volume) would support a price-cut decision, such a decision would decimate profits if the net margin were 10 percent. This is because a 1 percent price decrease would lead to a 10 percent margin decrease and the 2 percent increase in volume would lead to a shortfall of 8 percent in contributions to profit. Because marketers (including researchers and academics) often deal with volume and share information alone, their actions are more prone to produce sales than economic profits—the key objective of the enterprise. Some marketers focus on metrics such as growth in sales and market share to report the impact of their actions. This should be extended to include a discussion of the impact on margins, working capital, and cash flow. While simplicity, structure, and definitional clarity helped the DuPont
model come a long way, unfortunately, it also raises many concerns from a marketer’s perspective. First, marketing expenditures are listed as expenses rather than investments. This implies they generate only a short term impact and do not contribute to even semi-durable assets. Thus, all marketing activities must typically “pay” for themselves within a short timeframe. To the contrary, it has been argued that market-based assets such as customers and brands are the only assets that appreciate, and not depreciate (Lusch and Harvey 1984; Srivastava et al 1998). Second, managers often focus much-too-much attention on managing ROI (or, in the case of marketing managers, ROMI) rather than managing the firm value. Strong brands leveraged in down markets can wrest market share from beleaguered competitors (Buzzell and Gale 1987). Adverse economic conditions that may lead to lower ROMIs often result in reductions in marketing investments. Ironically, for strong companies, this may be the best time to go on an offensive because less robust competitors may be weaker still (Srinivasan, Rangaswamy and Lilien 2005) . It is also the case that much of the impact of marketing is on spending relative to competition. During weak economic times, competitive spending using the same logic would be down. Thus, high levels of relative spending are easier to achieve. This reasoning, among others, has resulted in a debate on the relative value and usefulness of “R over I” versus “R minus I” with strong advocacy for the latter (Doyle 2000; Ehrbar 1998). The latter is often measured via the economic value added (EVA) and represents
Zyman Institute of Brand Science
8

cash flow from an opportunity adjusted for the cost of resources used to generate the cash flow. Third, all accounting-based measures (including the DuPont model) are retrospective. This may not pose a problem in mature, stable markets where the future is expected to be similar to the past. However, in dynamic markets subject to product and marketplace changes, looking at what is happening may not be the best for planning forward. By its nature, the tendency to look at what has happened, not what will happen, places too much weight on short-term results, and does not recognize the assets that have been created which might lead to future sales, or recurring customers. Fourth, accounting metrics such as margins and turnover favor mature products over new-to-market innovations that tend to have lower turnover, lower net margins—and higher marketing investment requirements (e.g., for customer acquisition). Invariably, use of metrics such as ROA or ROI swings the pendulum in favor of incumbent products thus starving innovations of badly need growth funds. Finally, performance metrics such as ROA and EVA ignore risks and sacrifice future opportunities for short-term earnings. Because risk is a principal determinant of a firm’s equity, this omission is critical (Martin and Petty 2000). Thus, new products or emerging markets, which typically have lower net margins and turns and higher marketing investments, tend to lose the battle of resources to mature and established products and markets. In effect, companies are
more likely to invest in incumbent products and markets, starving future opportunities if they focus on short-term tools like the DuPont model or EVA. Prospects with longer-term payoffs must be evaluated by measures that give credit to such payoffs – such as net present value. Despite the reservations associated with short-term performance measures, they represent the most frequently used metrics. Thus, marketers must learn to use them to justify request for resources, or at least show other metrics that demonstrate the long-term value of the created marketing assets. We must note that, increasingly, finance and accounting professionals are moving towards cash flows rather than earnings-based metrics (e.g., CFROI rather than ROI), as earnings-based measures are subject to manipulations related to depreciation (Martin and Petty 2000). Additionally, as marketing has long-term effects, we need to learn how to better capture and express forward-looking benefits, such as through NPV measures and projected cash flows. 2.2 Linking Market-Based Assets to Shareholder Value Companies must allocate resources to invest in market-based assets and capabilities (Day 1994). These investments must be justified in much the same terms as other business assets. For example, investments in information technology can be leveraged to enhance efficiency of supply-chain processes (reduce costs as a consequence of lower inventories), drive sales (e.g., via better prospecting based on data-mining), and lead to more satisfied customers
Zyman Institute of Brand Science
9
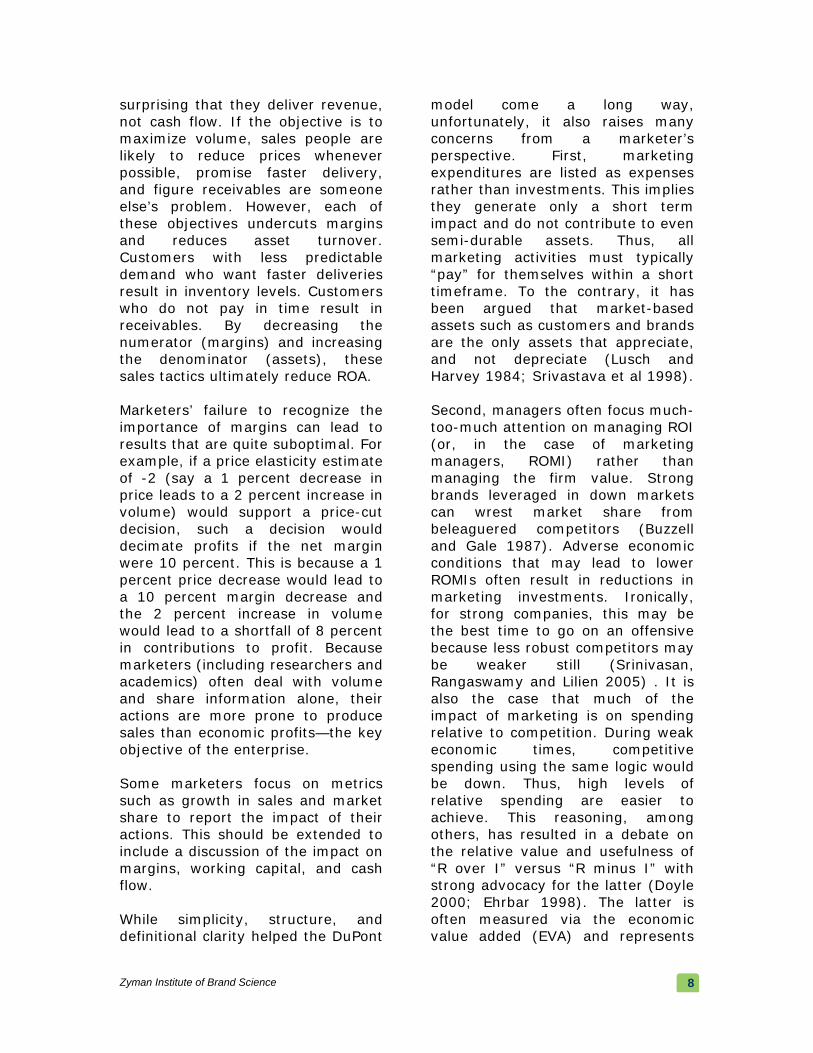
(e.g., by reducing response time in providing customer solutions). In a similar fashion, investments in market-based assets can be leveraged to support superior customer value delivery processes. The resulting customer value can be “extracted” by vendors in terms of financial benefits such as higher market share and price premium and lower distribution costs (stronger brands provide higher traffic levels that can be used by manufacturers to negotiate lower retail margins). These in turn should lead to outcomes desired by shareholders—profitability, growth, and sustainable competitive advantages (hence, lower risk or vulnerability). For example, pharmaceutical companies traditionally made investments in
marketing support for new drugs via communications and branding when patents were about to expire in order to extend the life of the drug by sustaining higher margins and revenue beyond patent expiration. However, with substantially shorter life cycles (competitors might develop drugs with equal or better performance characteristics before the patent expired), it is becoming important to invest in marketing and branding activities at the launch stage for two reasons—first, to accelerate penetration in order to recoup cash flow at higher margins as soon as possible and second, to provide protection against ever-faster competitive entries. The current battle between Viagra, Cialis and Levitra provide an interesting case in point.
Figure 2: Linking Market-Based Assets to Shareholder Value (Srivastava, Shervani and Fahey 1998)
In an effort to understanding the link between marketing activities that
result in customer satisfaction and financial performance and market
Zyman Institute of Brand Science
10
value, the first step might be to better understand how marketing actions influence marketplace performance, as suggested by Srivastava, Shervani, and Fahey (1998). This framework is outlined in Figure 2. First, marketing investments should result in brands and customer-installed bases and other market-based assets such as channel and other partnerships. The relevant metrics at this level of measurement would be measures of the strength of these relationships (e.g., brand awareness, preferences, risk perceptions, trust, loyalty). These relationships will typically lead to favorable marketplace consequences that serve to augment cash flows via a combination of price and share premiums, faster market penetration, reduced distribution, sales and service costs, and increased loyalty and retention. While this was a good start and several of these links have been established, one must yet convert these measures to the language and metrics used by both financial and senior managers.
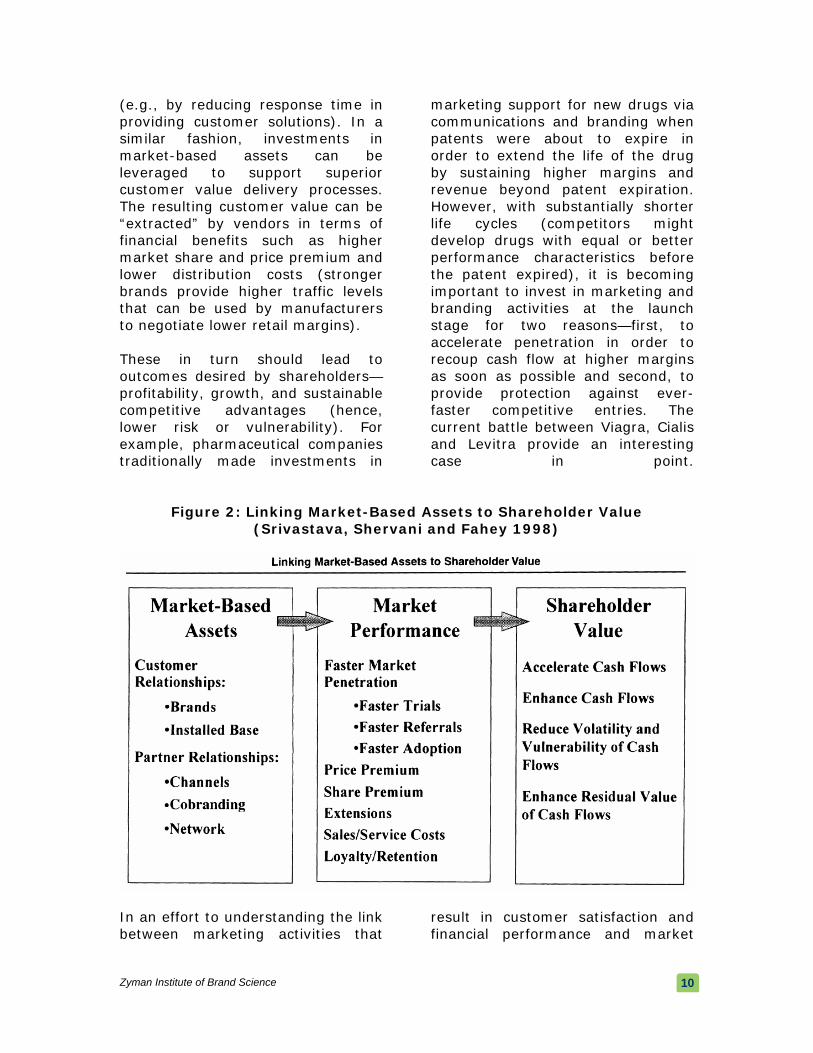
2.3 The Chain of Marketing Productivity Rust et. al. (2004) have proposed a chain-of-effects framework to understand how marketing activities link to the overall condition and standing of the firm (Figure 3, next page). This chain begins with formulation of a specific marketing strategy (e.g., an advertising campaign) that results in a set of tactical marketing actions (e.g., creating TV spots for the campaign). Specific tactical actions then influence individual customer centered elements (e.g., satisfaction), which in aggregate impact marketing assets (e.g., customer equity). Customer centered elements further impact the market (e.g., via market share), and along with marketing assets, influence a firm’s relative position in the market. This is posited to impact financial measures (e.g., ROI) as well as financial positions (e.g., profits). The final culmination of these effects is on the firm value, primarily in terms of market capitalization. The fundamental notion behind this framework is that effects are proposed to be sequential, and that financial measures such as ROI are driving overall firm value.
Naturally, companies must balance investments that nurture both short-term performance and long-term growth and risk. These dimensions correspond to the components of shareholder value proposed by Srivastava, Shervani, and Fahey (1998) that have shaped much of marketing thinking on shareholder value creation: enhancing cash flows (managing profitability), accelerating cash flows (managing growth) and reducing vulnerability and volatility of cash flows (managing risk). We recognize these components as essential blocks in developing our framework in the next section.
3. Linking Marketing Metrics to Financial Measures and Firm Value Based on the foundations laid by Srivastava et. al. (1998, 2001) and Rust et. al. (2004), we now turn towards developing a conceptual framework that extends the existing frameworks with a sharper focus on the intangible assets driving a firm’s long term value and more specific linkages between marketing metrics, financial measures, and these
Zyman Institute of Brand Science
11
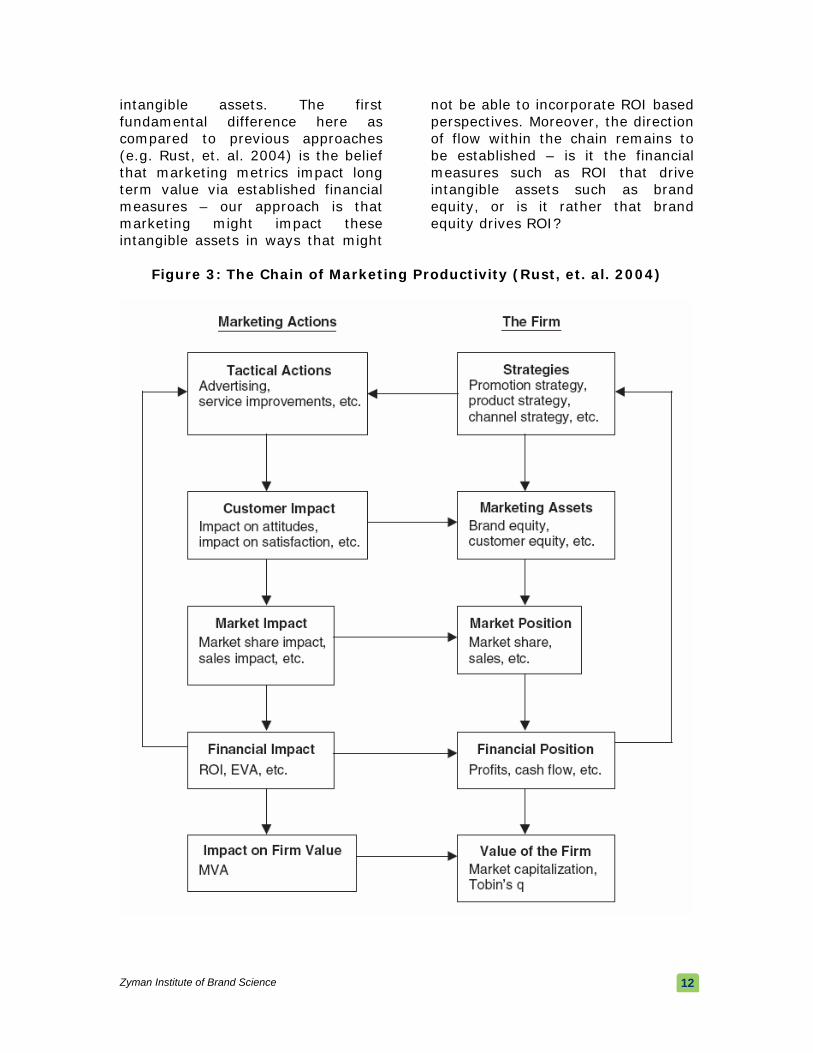
intangible assets. The first fundamental difference here as compared to previous approaches (e.g. Rust, et. al. 2004) is the belief that marketing metrics impact long term value via established financial measures – our approach is that marketing might impact these intangible assets in ways that might
not be able to incorporate ROI based perspectives. Moreover, the direction of flow within the chain remains to be established – is it the financial measures such as ROI that drive intangible assets such as brand equity, or is it rather that brand equity drives ROI?
Figure 3: The Chain of Marketing Productivity (Rust, et. al. 2004)
Zyman Institute of Brand Science
12

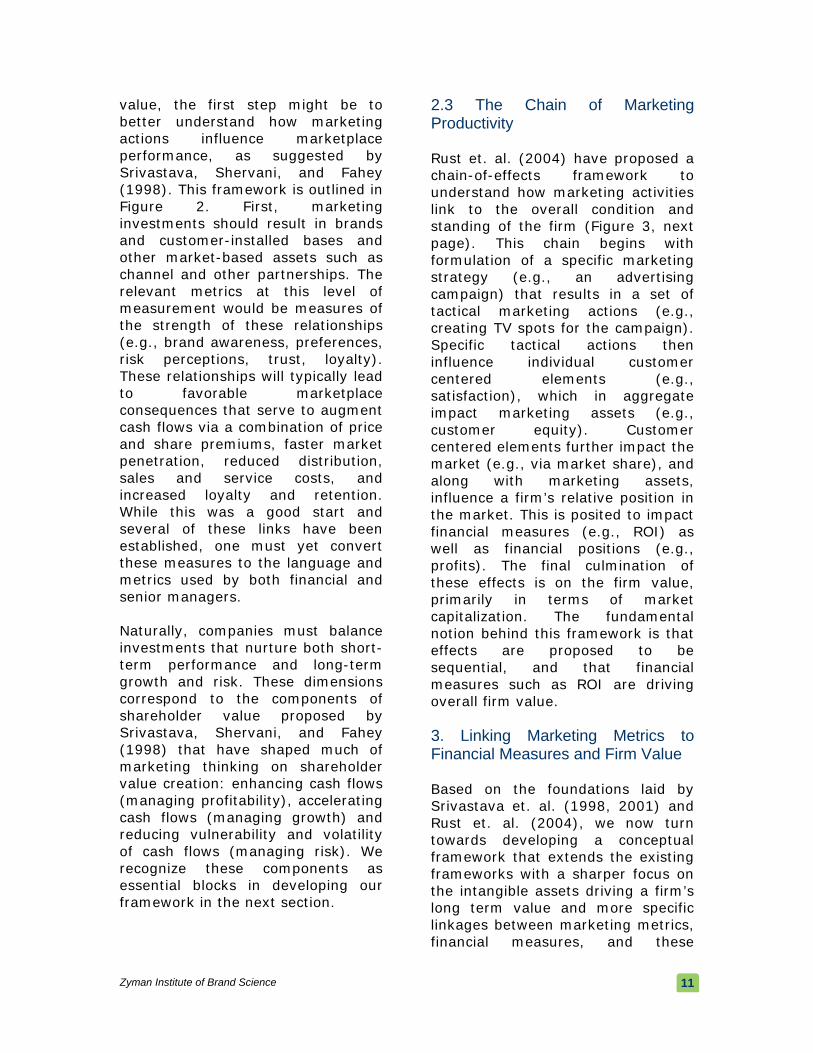
3.1 Our conceptual framework To outline these concepts, we adopt a top-down perspective on establishing the linkages between marketing metrics and financial consequences. As depicted in Figure 4, at the broadest level, the value of a company could be decomposed into that driven by tangible assets and that driven by intangible assets. Standard corporate finance valuation techniques do an excellent job of incorporating these tangible assets into the valuation. As discussed earlier, what is more challenging is incorporating the intangibles. Within the intangibles, we further restrict our attention to those intangibles that are impacted by marketing’s actions. The four specific intangible assets that we will focus on are brand equity, customer equity, channel relationships, and intellectual property. Of these, brand equity and customer equity are widely accepted as being within marketing’s domain (Rust, et. al. 2004). While operations might share
some role in managing channel relationships, few would deny that marketing plays a big role in cultivating this intangible asset. Where some might object to is the link between marketing and intellectual property. Marketing’s role in developing IP based assets is rather unexplored. At the very least, marketing plays a role in both helping guide product development as well as facilitating the commercialization process (i.e., launching innovations). Within the realm of corporate strategy, R&D might play the role of “exploration.” But, marketing plays the key role in “exploitation.” The interaction with the industry or product category that the firm operates in would serve as a primary driver in determining the relative importance of marketing in developing IP based assets. Having narrowed down our attention to these four most relevant intangible components, the next step is to start linking the impact that individual marketing activities would have on these assets.

Figure 4: Elements of Firm Value
Value
Tangible Assets Intangible Assets
Cash Inventory Other Other, e.g., R&D talent pool Marketing Driven Assets
Brand Equity Customer Equity Intellectual Property (IP)*
Traditional Focus of Value
Individual Marketing Campaigns
The Marketing Relevant Focus of Value * Not influenced only by Marketing
Channel Relationships
Zyman Institute of Brand Science
14

This next level of linkages is explored in Figure 5. For each relevant intangible asset, we focus on three different measures – its current value, its expected future value, and the variability (a measure of risk) with its expected future value. Understanding each of these three measures is vitally important in making the case for long term health of the company. Within this framework, one can safely say that most of how marketing is evaluated is by measuring its impact only on the short term, whereas most of where marketing really makes a difference is in terms of its impact on the value in the long term, and reduction of variability of the expected value in the long term. Note, for example, that most marketing mix models measure
marketing expenditures’ impact on sales, but not on baseline or variance of sales. Past marketing expenditures (e.g., advertising and channel development) should result in “marketing stock” (e.g., brand equity) that can help raise baseline sales, enhance the productivity of current expenditures (higher equity and better established brands require lower levels of marketing support; Boulding, Lee and Staelin 1994). Further, marketing support for products often results in higher levels of product availability and distribution support, indirectly increasing sales and profitability (Sinha et al 2006). Finally, marketing support for new products will result in multi-period effects—stronger brands enjoy lower rates of value deprecation and sales decay.
Figure 5: Linking Marketing Metrics to Financial Consequences
Marketing Driven Intangible Assets
Variability (risk)
Future Expected Value
Current Value
Variability (risk)
Future Expected Value
Current Value
Advertising Promotions …
Individual Marketing Campaigns
Current Spending
Past Spending
Current Spending
Past Spending
Current Spending
Past Spending
Current Spending
Past Spending
… …
ROI ROA
Financial Measures
Beta
First Purchases Repeat Purchases
Campaign Relevant Marketing Metrics: e.g., for a Promotional Campaign
…
…
Brand Equity Customer Equity Intellectual Property (IP)*
Channel Relationships
Variability (risk)
Future Expected Value
Current Value
Variability (risk)
Future Expected Value
Current Value
Variability (risk)
Future Expected Value
Current Value
Variability (risk)
Future Expected Value
Current Value
Variability (risk)
Future Expected Value
Current Value
Variability (risk)
Future Expected Value
Current Value
Zyman Institute of Brand Science
15
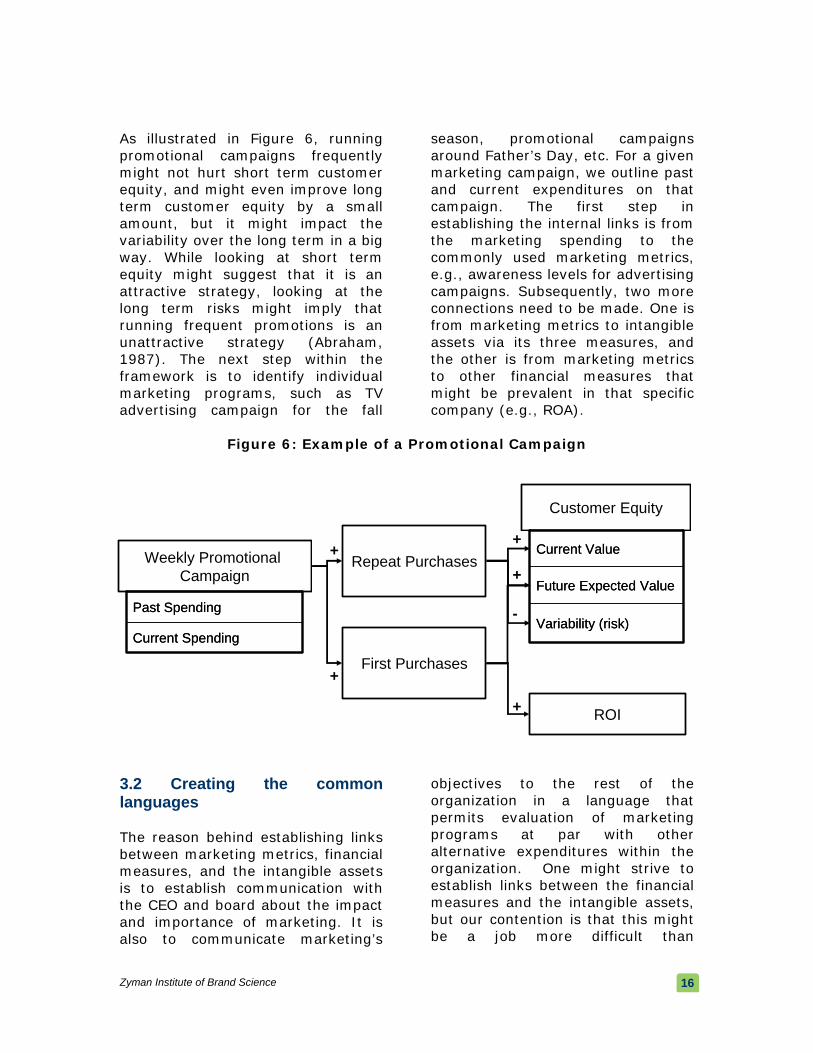
As illustrated in Figure 6, running promotional campaigns frequently might not hurt short term customer equity, and might even improve long term customer equity by a small amount, but it might impact the variability over the long term in a big way. While looking at short term equity might suggest that it is an attractive strategy, looking at the long term risks might imply that running frequent promotions is an unattractive strategy (Abraham, 1987). The next step within the framework is to identify individual marketing programs, such as TV advertising campaign for the fall
season, promotional campaigns around Father’s Day, etc. For a given marketing campaign, we outline past and current expenditures on that campaign. The first step in establishing the internal links is from the marketing spending to the commonly used marketing metrics, e.g., awareness levels for advertising campaigns. Subsequently, two more connections need to be made. One is from marketing metrics to intangible assets via its three measures, and the other is from marketing metrics to other financial measures that might be prevalent in that specific company (e.g., ROA).
Figure 6: Example of a Promotional Campaign
Weekly Promotional Campaign
Current Spending
Past Spending
Current Spending
Past Spending
Repeat Purchases
First Purchases
Customer Equity
Variability (risk)
Future Expected Value
Current Value
Variability (risk)
Future Expected Value
Current Value
ROI
+
+
-
+
+
+
3.2 Creating the common languages The reason behind establishing links between marketing metrics, financial measures, and the intangible assets is to establish communication with the CEO and board about the impact and importance of marketing. It is also to communicate marketing’s
objectives to the rest of the organization in a language that permits evaluation of marketing programs at par with other alternative expenditures within the organization. One might strive to establish links between the financial measures and the intangible assets, but our contention is that this might be a job more difficult than
Zyman Institute of Brand Science
16
imagined, and moreover, not imperative to understanding how marketing impacts intangible assets. Research establishing the positive impact of marketing actions on expected life of customers—and therefore longevity of competitive advantages—is likely to help garner resources for marketing investments 3.3 Focus on short term and long term The development of such a framework where individual marketing activities drive intangibles via three critical measures enables one to conduct critical analysis for individual campaigns as outlined in Figure 6. Which campaign gets allotted its entire budget should be dictated by how much weight is put on short term returns versus long term returns versus long term risks. This structure alleviates some of the myopia surrounding the allocation of resources to programs such as price-promotions that thrive only in the short term and may destroy value in the long term. The ability to understand the impact of marketing’s actions in such a fashion, paired with the right incentive structure that focuses on developing the organization for its long term health would ex-ante prevent managers from entering into future prisoner’s-dilemma-like-situations. We return to a detailed discussion of the example in Figure 6 later in this section. 3.4 Reducing variability and risk Although it is all-too-often overlooked in both the theory and practice of marketing, marketing activities and market-based assets play a pivotal role in reducing both the vulnerability and volatility of
cash flows (Srivastava, Shervani and Fahey 1997). This ability to leverage brands, channels, and customer alignment to reduce risk has been used effectively by companies such as General Electric. GE very deliberately emphasized growth and reliance on its customer service and support business in order to both enhance profitability (by cross-selling parts and maintenance services) and reduce vulnerability and risks by (typing customers down with multiyear contracts) to their own and their competitor’s installed base. This strategy has led to a steady increase in the proportion of cash flows from recurring business – a metric that signals safety and is much valued by Wall Street analysts. An added benefit is that lower vulnerability and volatility reduce the risks of cash flows, which in turn results in a lower cost of capital or discount rate thereby further enhancing shareholder value. In the aggregate, brand equity (in all its aspects) provides the ultimate bulwark against customers succumbing to the competitive maneuvers (e.g., new product introductions, price changes) of old and new rivals alike (that is, vulnerability) and fluctuations in demand such as sudden surges or falloffs in customers’ purchases due to market cyclicality (that is, volatility). While the potential impact of marketing on reducing the vulnerability and volatility of cash flows is huge, there has been very limited attention paid to this dimension. While several scholars such as Aaker and Jacobsen (1990), Bharadwaj and Menon (1993), Hogan et al. (2002), and Srivastava, Shervani, and Fahey (1997, 1998,
Zyman Institute of Brand Science
17
1999) examine the impact of marketing activities on reducing risk, their treatise is conceptual, though supported by evidence from the financial management literature. Their contention that marketing activities such as GE’s shift to services and consumables reduces volatility in cash flows, and therefore risk, is supported by the fact that companies with more variable internal cash flow tend to forgo investment opportunities as they allocate cash reserves to ride out tougher times (Minton and Schrand 1999). While only a few marketing scholars such as Aaker and Jacobsen (2001),Mizik and Jacobsen (2003) and McAlister (2004) have linked brands and customers, respectively, to reduced risk and financial performance there is ample evidence to suggest that similar lines of inquiry are likely to be fruitful. Brands provide intangible benefits and bonding that insulates them from competitive moves (Fournier 1998). Typically, weaker brands are more susceptible to competitive price promotions as documented by asymmetry in cross-price elasticities (Blattberg, Briesch, and Fox 1995). Amit and Wernerfelt (1990) find that increases in risk associated with income stream variability negatively impacts shareholder value. Extant research documents that marketing strategies, such as focus on customer retention (Reinartz and Kumar 2003), innovation propensity (Roberts 2001), strategic differentiation (Veliyath and Farris 1997), and diversification into related businesses and geographical markets mitigate risk by reducing earnings volatility. Interbrand’s focus on linking brand strength to lower
cost of capital is more normative than descriptive (Interbrand 2004). A recent study (Merino, Srinivasan and Srivastava 2006) demonstrates the impact of long-term advertising on both short term performance (ROA), risk (volatility of ROA) and long-term intangible value (Tobin’s Q). To summarize, marketers must communicate the impact of their actions, such as branding, developing integrated customer solutions or unique bundles, on reducing volatility and vulnerability of cash flows. There is much work to be done in this area, and it is possible to both use existing measures (e.g., percentage of cash flow based on recurring business, customer retention rates, and the like) as well as new measures, such as expected life of customers. In theory, the expected life of customers might be useful as the depreciation schedule for customer acquisition costs (investments, not expenses!). The indirect value of reduced volatility of sales and ultimately cash flows might be reflected in reduced liquidity requirements and therefore working capital requirements—just as reduction in uncertainty in demands reduces inventory requirements and carrying costs. Thus, marketers must argue for resources in financial terms. However, when it comes to the impact of marketing on risk reduction, we have many more questions than answers. 3.5 Theoretical Challenges and the Role of Marketing Science The most pertinent question from the perspective of academic research is: how do we start to develop findings within the framework
Zyman Institute of Brand Science
18
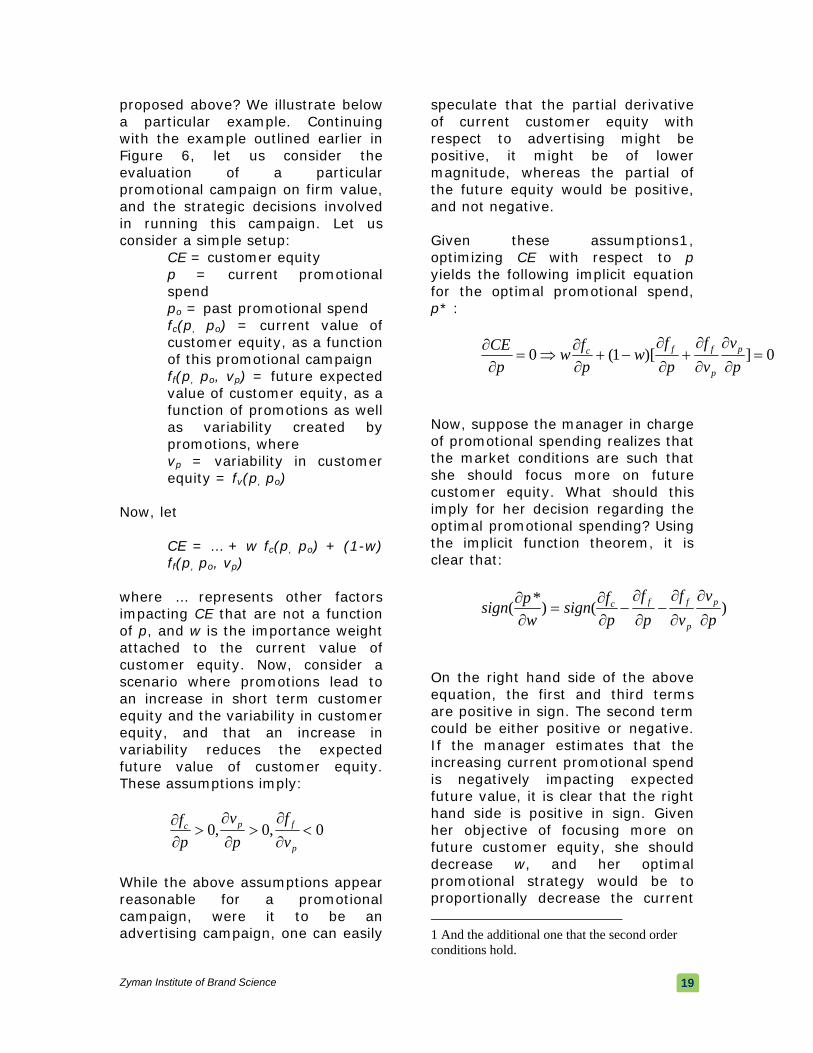
proposed above? We illustrate below a particular example. Continuing with the example outlined earlier in Figure 6, let us consider the evaluation of a particular promotional campaign on firm value, and the strategic decisions involved in running this campaign. Let us consider a simple setup:
CE = customer equity p = current promotional spend po = past promotional spend fc(p, po) = current value of customer equity, as a function of this promotional campaign ff(p, po, vp) = future expected value of customer equity, as a function of promotions as well as variability created by promotions, where vp = variability in customer equity = fv(p, po)
Now, let
CE = … + w fc(p, po) + (1-w) ff(p, po, vp)
where … represents other factors impacting CE that are not a function of p, and w is the importance weight attached to the current value of customer equity. Now, consider a scenario where promotions lead to an increase in short term customer equity and the variability in customer equity, and that an increase in variability reduces the expected future value of customer equity. These assumptions imply:
0,0,0 <∂∂
>∂∂
>∂∂
p
fpc
vf
pv
pf
While the above assumptions appear reasonable for a promotional campaign, were it to be an advertising campaign, one can easily
speculate that the partial derivative of current customer equity with respect to advertising might be positive, it might be of lower magnitude, whereas the partial of the future equity would be positive, and not negative. Given these assumptions1, optimizing CE with respect to p yields the following implicit equation for the optimal promotional spend, p* :
0])[1(0 =∂∂
∂∂
+∂∂
−+∂∂
⇒=∂∂
pv
vf
pf
wpfw
pCE p
p
ffc
Now, suppose the manager in charge of promotional spending realizes that the market conditions are such that she should focus more on future customer equity. What should this imply for her decision regarding the optimal promotional spending? Using the implicit function theorem, it is clear that:
)()*(pv
vf
pf
pfsign
wpsign p
p
ffc
∂∂
∂∂
−∂∂
−∂∂
=∂∂
On the right hand side of the above equation, the first and third terms are positive in sign. The second term could be either positive or negative. If the manager estimates that the increasing current promotional spend is negatively impacting expected future value, it is clear that the right hand side is positive in sign. Given her objective of focusing more on future customer equity, she should decrease w, and her optimal promotional strategy would be to proportionally decrease the current 1 And the additional one that the second order conditions hold.
Zyman Institute of Brand Science
19

spending. This would continue to be her optimal promotional strategy
even if pf f
∂
∂ is positive but small in
magnitude. Only if it is positive and high in magnitude, then would it be optimal for her to increase promotional spending level given her current objectives. The above example is a very simple depiction of the strategic choices that could be made by managers thinking within a framework that connects daily marketing activities to long term value for the company. Obviously, many challenges remain, and we now move towards taking stock of areas in which the challenges have begun to be overcome, and others where work needs to be done. 4. Linking Marketing Activities to Value Most marketing campaigns get measured in terms of their appropriate marketing metrics and stop at that. In this section, we review where they have been connected further to financial consequences, and outline gaps that need to be filled. We turn our attention to individual marketing activities in detail in this section. 4.1 Advertising Perhaps no marketing activity has been under greater pressure to demonstrate its contribution to firm value than advertising. While advertisers focus heavily measures such as awareness, the finance manager might be concerned with what a point of awareness means in terms of financial consequences. Mainstream advertising effectiveness
research and sales response analysis has resulted in, at best, questionable findings. Many studies that assess the value of advertising have shown a negative return (Lodish, et. al. 1995). In retrospect, this is not very surprising. While the effects of advertising are typically long term (Dekimpe, et al. 2004), many studies focus on the short-run sales response. Short-term advertising effects are often drowned by other marketing activities such as price promotions, and examining the impact primarily in terms of short-term (weekly, quarterly) sales response is destined to understate the impact of advertising. This temporal separation of the returns as illustrated by the case of advertising becomes a cause for concern when the returns do not get accounted in the appropriate fashion. Advertising may be used initially to build awareness and encourage usage, ultimately building a meaningful customer relationship. This relationship could later be leveraged to make future advertising allocations more productive (Boulding, Lee, and Staelin 1994; Srivastava, Shervani, and Fahey 1998). This multi-period impact implies that while the costs are expensed in the period they are incurred, the longer-term benefits logically suggest that they should be treated as investments and amortized over time. That is, some proportion of advertising might be considered as `investment advertising,’ while the rest might be considered as ‘maintenance advertising,’ a recurring expense. It is imperative to establish this link to meaningfully justify large advertising budgets.
Zyman Institute of Brand Science
20
One interesting example in this context is Joshi and Hanseens (2004) who link advertising spending to stock performance, echoing the work of Hirschey (1982), Cheng and Chen (1997), and Chauvin and Hirschey (1993). While there are several sales-response studies that examine the short-term impact of advertising, research examining the long-term impact of advertising is more limited. It is worth examining longer-term direct effects of advertising (e.g., advertising decay rates) as well as indirect long term effects (e.g., impact of advertising on sales and profitability via its impact on distribution and availability) 4.2 Branding Early work by Aaker (1991), Keller and Aaker (1993), Simon and Sullivan (1993) and Farquhar (1989) shed considerable light on the topic of the creation of a brand and its overall valuation. Additional work continues to cover the topic and is well summarized by Keller (2002) and Keller and Lehman (2003). Rao, Agrawal, and Dahlhoff (2004) found that firms that employed an umbrella (corporate) brand were valued by the stock market more highly than firms with multiple brands, perhaps to compensate for their lower risk. An industry perspective has been brought to this topic by Business Week’s annual publishing of the Interbrand brand valuation results. The Interbrand approach (discussed in Interbrand Group 1992), focused on exploiting the relationship between brand strength and on incremental earnings as well as on valuation metrics such as the price-earnings (PE) multiple. More recently, the
Interbrand Group has modified its approach to examine the impact of brands on customer loyalty (therefore longevity), and ultimately risk and cost of capital that can then be used to discount incremental cash flows associated with brands. Other approaches such as the Brand Asset Valuator (from Young and Rubicam) focus on the relationship between brand strength, stature and profitability. In general most brand valuation approaches examine the linkage between brand equity (reflected in brand strength metrics such as brand perceptions and loyalty), marketplace performance (marketing metrics such as price and share premiums, price elasticity, distribution efficiencies) and brand value (as measured via incremental shareholder value based on present value of both short-term and long-term brand-specific incremental cash flows and discount/risk rates). While debates regarding which approach is better under what conditions are likely to continue due to the intangible nature of market-based assets, what is clear from these analyses is how important the investment in brand is in contributing to an important asset for the firm. It is also the case that much of marketing expenditure that goes to building the brand is most significant on a long-term basis, while much of what we measure for marketing expenditures only captures the short-term effect. Thus, while there has been considerable work to understand the value of a brand and how to measure a brand’s equity, there remains a dearth of research on how market expenditures, and which
Zyman Institute of Brand Science
21
marketing expenditures, contribute to a brand’s value. Most of the time we assume it is advertising that is the prime driver of a brand’s equity. It is rarely if ever measured and undoubtedly there are numerous other factors, such as consistent product experience, that contribute as well. Nonetheless, assessing advertising based solely on its short-term impact is a biased estimate of its true effects. 4.3 Customer value At its simplest level, the value of customers is the expected discounted cash flow from customers in the future. It depends on three components; acquisition (rate and cost), retention (rate and cost), and expansion/growth in same customer margin (amount and cost). Obviously, aside from cost, the larger the three, the more revenue a firm gets from customers. While all three matter, the leverage a firm gets from increasing retention appears to be the greatest (Gupta and Lehmann, 2005). The idea was developed by Dwyer (1997) and Berger and Nasr (1998). Jain and Singh (2002) extend the definition of the lifetime value by including in the definition the acquisition costs. Reinartz and Kumar (2000, 2003) and Reinartz, Krafft and Hoyer (2004) and Rust et al. (2000) have been instrumental in thinking about how to incorporate the value of the customer base into a concept of customer equity. One of the nice aspects of CLV is that it is a measure of the short-term as well as the long-term value of the acquisition and retention marketing expenditures. Again, CLV is not a measure that appears on a balance sheet, but rather is a significant
intangible asset clearly being valued by investors. There is considerable overlap between the definition and measurement of brand and customer equity. Clearly the two overlap. In a simplistic setting, aggregation of benefits for a brand across customers and over time can be classified as brand value, while aggregation of benefits across products/brands and over time can be used to measure customer value. While recent methods developed by researchers such as Blattberg, Kumar, Lemon, Reinartz and Rust to name a few have clearly demonstrated the ability to measure value created by marketing, this line of inquiry is less adept in demonstrating how value is created. Indeed, it is hard to separate the value of (say) the Marriott brand from the value of Marriott’s customers. Is it brand management that creates customer value? Or, is it customer management that creates brand value? 4.4 Customer satisfaction Many authors have written about the relationship between customer satisfaction and retention. Most recently, Reichheld (2001) has found there is a strong relationship between customer satisfaction and retention, but it is certainly not linear. Interestingly, this relationship is not always found (Fornell 1995). There are many possible explanations for this phenomenon. One simple explanation is found in the definition of satisfaction. Given it is generally defined as meeting or exceeding expectations, an easy way to increase customer satisfaction is to reduce expectations. As such,
Zyman Institute of Brand Science
22

satisfaction levels may go up, but customer interest and willingness to buy will plummet. A second explanation can also come in the way satisfaction is often measured, that is, within existing customers. A firm that loses its dis-satisfied customers will find satisfaction levels rise at the same time as market share drops. Farris and Reibstein (1995) provided a third possible explanation. Leading market share brands gain the greatest distribution. This results in many cases where the shopper cannot find their preferred brand, and have to settle for buying something other than what they wanted. It would not be surprising to find their satisfaction levels being lower than if they had found their preferred brand. The burden of this is felt for the brands with the largest market share and the greatest resulting distribution. This results in market share and customer satisfaction being negatively correlated. There have been a number of other studies, which have found that customer satisfaction is certainly not linear with sales. Looking across several industries Ittner and Larcker (1998) have found there is an asymptote that is achieved and raising satisfaction behind that point yields very little. While progress has been made in examining the underpinnings of brand and customer equity, much remains to be done. Today, many, if not most, companies measure their levels of customer satisfaction. However, little has been developed which informs us about which marketing instruments contribute to customer satisfaction and how much. More of the research, as mentioned above,
takes us to understanding how customer satisfaction lends to retention and hence, back through CLV, or directly to shareholder value. Further, to the extent that brand and customer value and customer satisfaction are outcomes of a company’s effort to create and communicate better value propositions for its buyers, more research is needed to discriminate amongst these constructs. 4.5 Promotions The promotion area has been at least as widely studied (Neslin, 2002). Here the evidence generally suggests that promotions have a positive short run and negative long run impact with the total effect positive, at least in the absence of (likely) competitive reactions (e.g., Mela, Gupta, and Lehmann, 1997). This is consistent with the noticeable drop in share P&G suffered when it cut promotions and competition failed to follow (Ailawadi, Lehmann, and Neslin, 2001). In addition, several researchers have investigated the impact of promotions in the pharmaceutical industry (e.g., Narayanan, Desiraju, and Chintagunta, 2004). Once again, the focus of this research has been on sales not profits, and not on the impact on perceptions of the brand. Importantly, there is some evidence that if a firm frequently promotes the brand, the customer’s perceptions and the brand’s equity can be reduced as customers start to infer the brand is of lower quality. Moreover, some customers having become accustomed to seeing the brand on promotion only buy it when it is on promotion. 4.6 Distribution Channels
Zyman Institute of Brand Science
23
In terms of channels, there is less available evidence. Much of the channels literature has focused on information use and relationship quality (trust, satisfaction) and linked these to self-rated performance scales (e.g., Moorman, Zaltman and Desphande 1992; Moorman, Desphande and Zaltman 1993). Reibstein and Farris (1995) found the relationship between distribution and market share to be positive, although non-linear, an assumption that is commonplace in most new product forecasting models. Geyskens, Gielens, and DeKimpe (2002) demonstrated a positive impact of adding internet channels, especially for strong companies and early followers. Perhaps the most interesting development beyond the impact of distribution strategies on brand performance and the advertising pull versus distributor push, is the emergence of private labels that both undermine the value of manufacturer brands and transfer customer equity from manufacturers to retailers, as both struggle to “own” customers. Because retail margins on private label products are often higher than those for national brands, manufacturers must not only contend with direct competitors, they must also position themselves against store-brands in managing manufacturer-retailer profitability (Ailawadi and Harlam 2004; Srinivasan et al 2004). 4.7 New Products There is a vast literature on new products (Hauser and Tellis, 2004), much of it focused on development. There has been considerable effort addressing the pattern of product diffusion, much of it using the Bass
(1969) model (Gatignan, Eliashberg, and Robertson, 1989; Sultan, Farley, and Lehmann, 1990; Golder and Tellis, 1997). In the new product area, both Chaney, Devinicy and Winer (1991) and Lane and Jacobson (1995) demonstrate a positive impact of new product announcements on stock price. In fact, the impact of new product announcements and introductions has been studied fairly extensively both inside marketing (Koku, Jagpal, and Viswanath 1997), and outside Cooper 1984; Eddy and Saunders 1980; Pardue, Higgins and Biggart 2000). Recently Pauwels, Silva-Rosa, Srinivasan and Hanssens (2004) found that new product introductions, especially in a new market, increase long term financial performance, but promotions do not. 4.8 Product lines and portfolios There has been some investigation on the impact of increasing the firm’s product line. Randall, Ulrich, and Reibstein (1998), found that as a firm extends its product line up upward, its brand’s equity increases. However, extending the brand upward may make it difficult to sell the product. Volkswagen tried to introduce a luxury end automobile under the Volkswagen name and failed. Conversely, when a firm extends its brand downward, it makes it easier to sell the lowered offering, but also has a negative impact on the brand’s equity. An example of this is Marriott which chose to associate its brand with the lower end brands in its portfolio. 5. Future directions for research Brand equity, customer equity, channel relationships, and intellectual property are strategic
Zyman Institute of Brand Science
24

assets. They represent investments with long-term payoffs that include enhanced cash flow (due to both cost containment and revenue growth). They also provide additional growth opportunities in adjacent product-market spaces. They can help their owners “buy time” and therefore increase the likelihood of success of new product ventures and better opportunities to protect against competitive inroads. Building and nurturing these assets demands long-term investments. Marketers must respond to organizational pressures by linking marketing metrics to financial/accounting measures. As we argued earlier, what is necessary is to build links wherein the marketing expenditures can have short-term effects on intervening constructs, such as awareness,
preference, distribution, loyalty, brand value, etc., as well long-term effects on the intangible elements of firm value. This way, we can understand the “flow” of marketing throughout the system and its impact. As discussed in the previous section, many marketing activities, such as advertising, customer value, have made sufficient progress in the development of relevant marketing metrics. Some have also begun to take steps in establishing links to financial consequences. But there are others, such as distribution channels, where the links are not as clear. In Table 1 below, we summarize what we think is the current state of our discipline, and where most efforts would be necessary.
Table 1: Current state of linking marketing metrics to financial consequences
Links to
Financial Metrics Marketing
Activity Development of
Marketing Metrics
Links to Intangible
Assets Advertising 1 2 3 Branding 2 2 2 Customer Value 1 2 2 Customer Satisfaction
1 2 3
Promotions 2 2 3 Distribution 2 3 3 New Products 3 3 3 Product Lines 3 3 3
3 3 3 Interactions of marketing variables Key: 1: In advanced stages of development. 2: Some developments, more necessary. 3: Few developments so far.
Zyman Institute of Brand Science
25
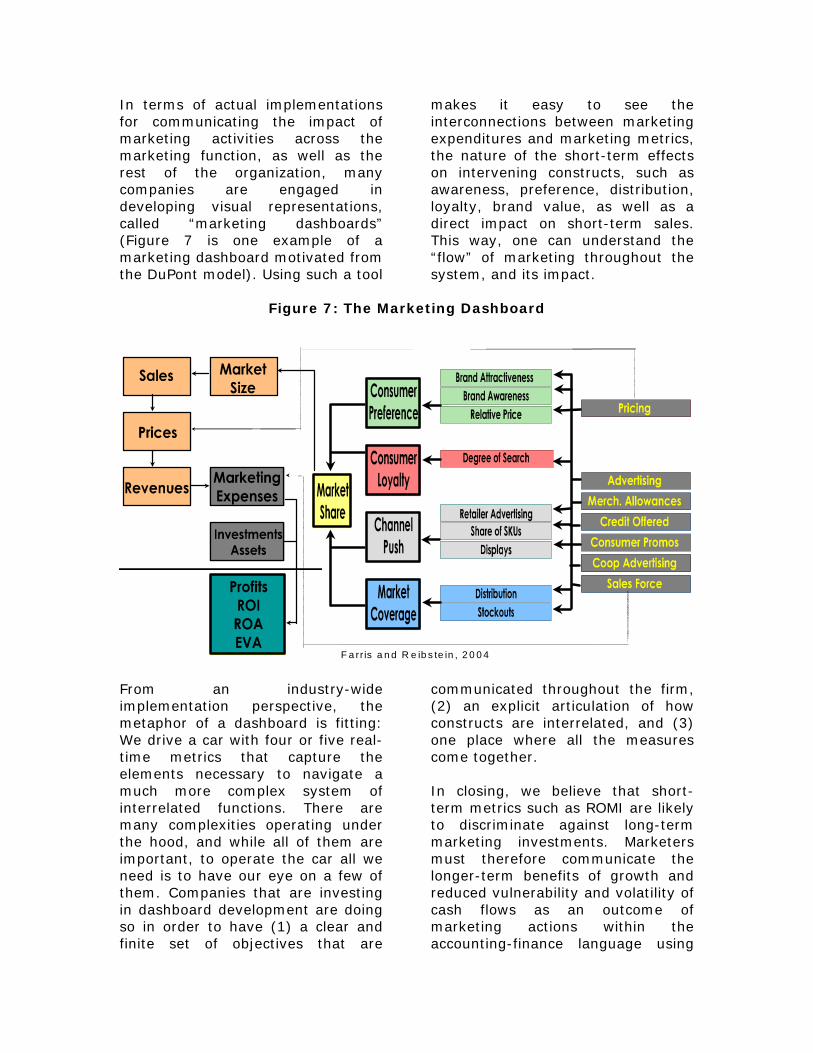
In terms of actual implementations for communicating the impact of marketing activities across the marketing function, as well as the rest of the organization, many companies are engaged in developing visual representations, called “marketing dashboards” (Figure 7 is one example of a marketing dashboard motivated from the DuPont model). Using such a tool
makes it easy to see the interconnections between marketing expenditures and marketing metrics, the nature of the short-term effects on intervening constructs, such as awareness, preference, distribution, loyalty, brand value, as well as a direct impact on short-term sales. This way, one can understand the “flow” of marketing throughout the system, and its impact.
Figure 7: The Marketing Dashboard
F a rr is a n d R e ib s te in , 2 0 0 4
From an industry-wide implementation perspective, the metaphor of a dashboard is fitting: We drive a car with four or five real-time metrics that capture the elements necessary to navigate a much more complex system of interrelated functions. There are many complexities operating under the hood, and while all of them are important, to operate the car all we need is to have our eye on a few of them. Companies that are investing in dashboard development are doing so in order to have (1) a clear and finite set of objectives that are
communicated throughout the firm, (2) an explicit articulation of how constructs are interrelated, and (3) one place where all the measures come together. In closing, we believe that short-term metrics such as ROMI are likely to discriminate against long-term marketing investments. Marketers must therefore communicate the longer-term benefits of growth and reduced vulnerability and volatility of cash flows as an outcome of marketing actions within the accounting-finance language using

discounted cash flow analyses. To be effectively heard, they should link their actions to interim financial measures, as well as to the elements of long term value drivers (e.g., risk as measured by Beta; McAlister 2004) for the firm. Failure to do so will undermine the very future of our discipline.
Zyman Institute of Brand Science
27
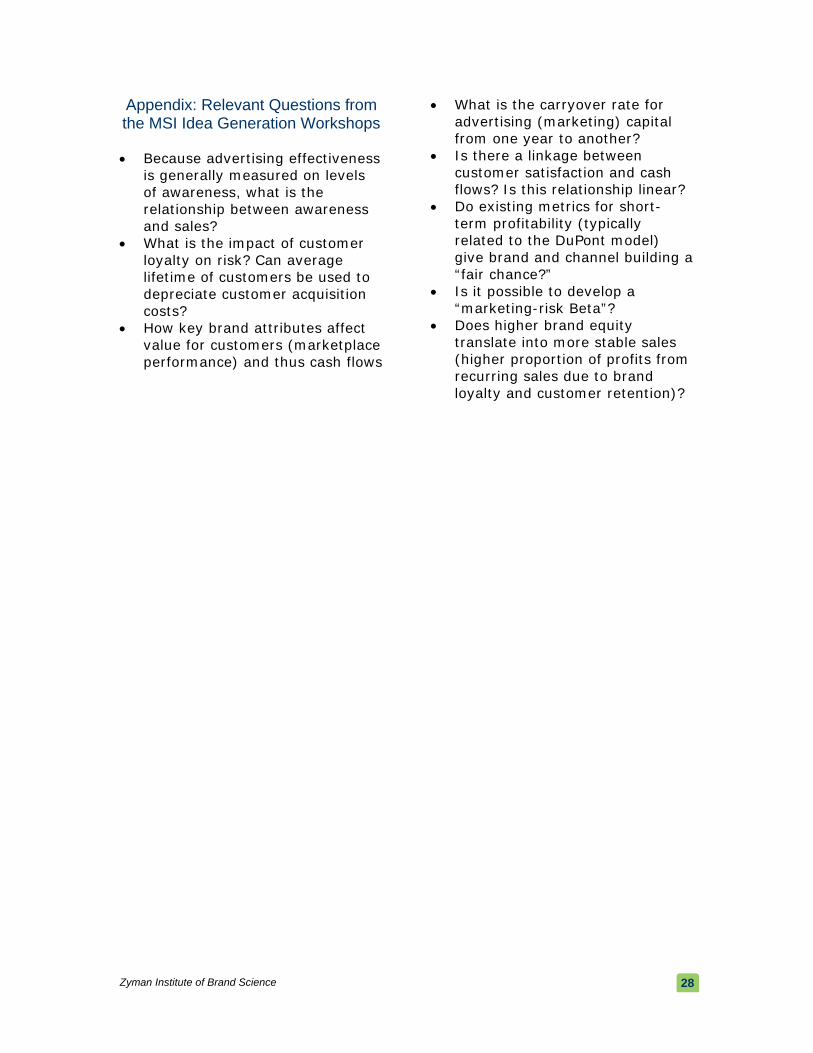
Appendix: Relevant Questions from the MSI Idea Generation Workshops
• What is the carryover rate for advertising (marketing) capital from one year to another?
• Is there a linkage between customer satisfaction and cash flows? Is this relationship linear?
• Because advertising effectiveness is generally measured on levels of awareness, what is the relationship between awareness and sales?
• Do existing metrics for short-term profitability (typically related to the DuPont model) give brand and channel building a “fair chance?”
• What is the impact of customer loyalty on risk? Can average lifetime of customers be used to depreciate customer acquisition costs?
• Is it possible to develop a “marketing-risk Beta”?
• Does higher brand equity translate into more stable sales (higher proportion of profits from recurring sales due to brand loyalty and customer retention)?
• How key brand attributes affect value for customers (marketplace performance) and thus cash flows
Zyman Institute of Brand Science
28
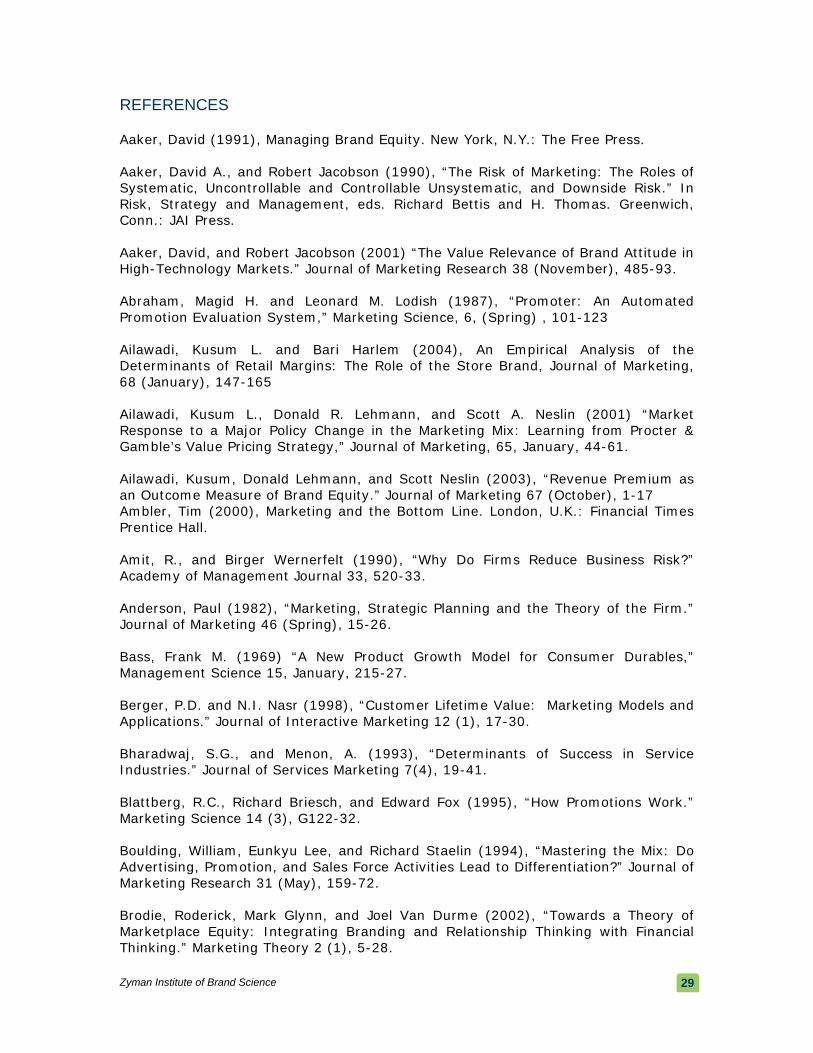
REFERENCES Aaker, David (1991), Managing Brand Equity. New York, N.Y.: The Free Press. Aaker, David A., and Robert Jacobson (1990), “The Risk of Marketing: The Roles of Systematic, Uncontrollable and Controllable Unsystematic, and Downside Risk.” In Risk, Strategy and Management, eds. Richard Bettis and H. Thomas. Greenwich, Conn.: JAI Press. Aaker, David, and Robert Jacobson (2001) “The Value Relevance of Brand Attitude in High-Technology Markets.” Journal of Marketing Research 38 (November), 485-93. Abraham, Magid H. and Leonard M. Lodish (1987), “Promoter: An Automated Promotion Evaluation System,” Marketing Science, 6, (Spring) , 101-123 Ailawadi, Kusum L. and Bari Harlem (2004), An Empirical Analysis of the Determinants of Retail Margins: The Role of the Store Brand, Journal of Marketing, 68 (January), 147-165 Ailawadi, Kusum L., Donald R. Lehmann, and Scott A. Neslin (2001) “Market Response to a Major Policy Change in the Marketing Mix: Learning from Procter & Gamble’s Value Pricing Strategy,” Journal of Marketing, 65, January, 44-61. Ailawadi, Kusum, Donald Lehmann, and Scott Neslin (2003), “Revenue Premium as an Outcome Measure of Brand Equity.” Journal of Marketing 67 (October), 1-17 Ambler, Tim (2000), Marketing and the Bottom Line. London, U.K.: Financial Times Prentice Hall. Amit, R., and Birger Wernerfelt (1990), “Why Do Firms Reduce Business Risk?” Academy of Management Journal 33, 520-33. Anderson, Paul (1982), “Marketing, Strategic Planning and the Theory of the Firm.” Journal of Marketing 46 (Spring), 15-26. Bass, Frank M. (1969) “A New Product Growth Model for Consumer Durables,” Management Science 15, January, 215-27. Berger, P.D. and N.I. Nasr (1998), “Customer Lifetime Value: Marketing Models and Applications.” Journal of Interactive Marketing 12 (1), 17-30. Bharadwaj, S.G., and Menon, A. (1993), “Determinants of Success in Service Industries.” Journal of Services Marketing 7(4), 19-41. Blattberg, R.C., Richard Briesch, and Edward Fox (1995), “How Promotions Work.” Marketing Science 14 (3), G122-32. Boulding, William, Eunkyu Lee, and Richard Staelin (1994), “Mastering the Mix: Do Advertising, Promotion, and Sales Force Activities Lead to Differentiation?” Journal of Marketing Research 31 (May), 159-72. Brodie, Roderick, Mark Glynn, and Joel Van Durme (2002), “Towards a Theory of Marketplace Equity: Integrating Branding and Relationship Thinking with Financial Thinking.” Marketing Theory 2 (1), 5-28.
Zyman Institute of Brand Science
29
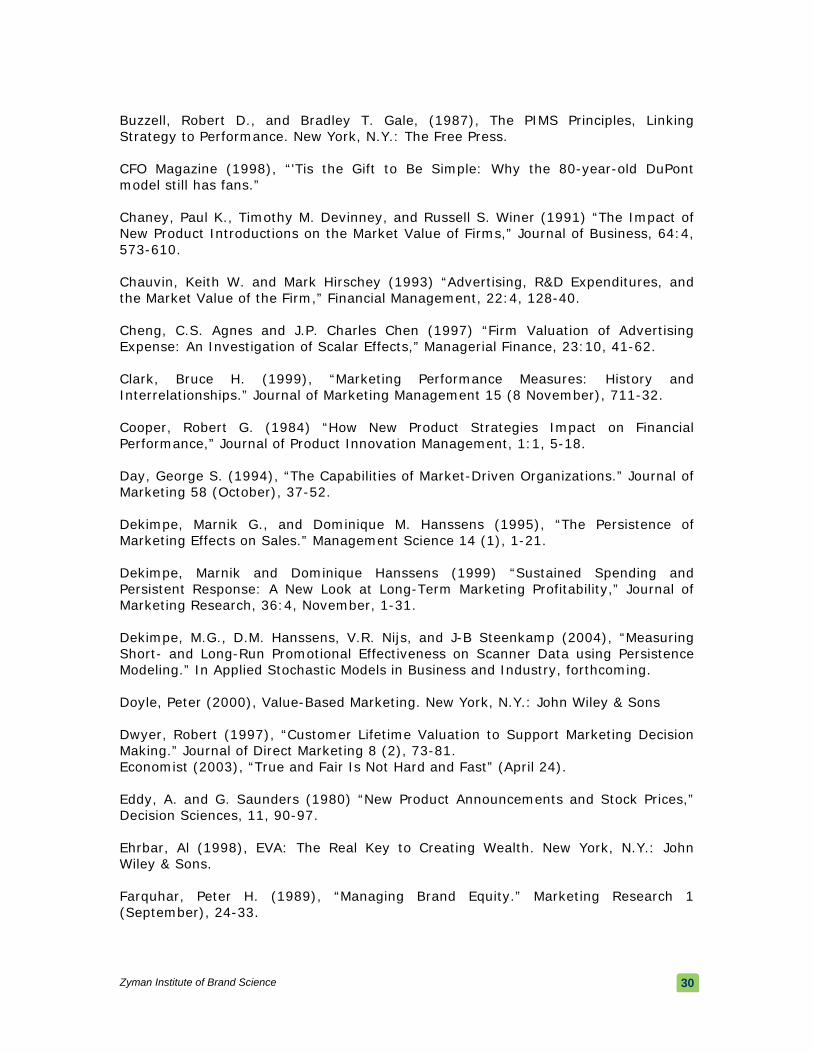
Buzzell, Robert D., and Bradley T. Gale, (1987), The PIMS Principles, Linking Strategy to Performance. New York, N.Y.: The Free Press. CFO Magazine (1998), “'Tis the Gift to Be Simple: Why the 80-year-old DuPont model still has fans.” Chaney, Paul K., Timothy M. Devinney, and Russell S. Winer (1991) “The Impact of New Product Introductions on the Market Value of Firms,” Journal of Business, 64:4, 573-610. Chauvin, Keith W. and Mark Hirschey (1993) “Advertising, R&D Expenditures, and the Market Value of the Firm,” Financial Management, 22:4, 128-40. Cheng, C.S. Agnes and J.P. Charles Chen (1997) “Firm Valuation of Advertising Expense: An Investigation of Scalar Effects,” Managerial Finance, 23:10, 41-62. Clark, Bruce H. (1999), “Marketing Performance Measures: History and Interrelationships.” Journal of Marketing Management 15 (8 November), 711-32. Cooper, Robert G. (1984) “How New Product Strategies Impact on Financial Performance,” Journal of Product Innovation Management, 1:1, 5-18. Day, George S. (1994), “The Capabilities of Market-Driven Organizations.” Journal of Marketing 58 (October), 37-52. Dekimpe, Marnik G., and Dominique M. Hanssens (1995), “The Persistence of Marketing Effects on Sales.” Management Science 14 (1), 1-21. Dekimpe, Marnik and Dominique Hanssens (1999) “Sustained Spending and Persistent Response: A New Look at Long-Term Marketing Profitability,” Journal of Marketing Research, 36:4, November, 1-31. Dekimpe, M.G., D.M. Hanssens, V.R. Nijs, and J-B Steenkamp (2004), “Measuring Short- and Long-Run Promotional Effectiveness on Scanner Data using Persistence Modeling.” In Applied Stochastic Models in Business and Industry, forthcoming. Doyle, Peter (2000), Value-Based Marketing. New York, N.Y.: John Wiley & Sons Dwyer, Robert (1997), “Customer Lifetime Valuation to Support Marketing Decision Making.” Journal of Direct Marketing 8 (2), 73-81. Economist (2003), “True and Fair Is Not Hard and Fast” (April 24). Eddy, A. and G. Saunders (1980) “New Product Announcements and Stock Prices,” Decision Sciences, 11, 90-97. Ehrbar, Al (1998), EVA: The Real Key to Creating Wealth. New York, N.Y.: John Wiley & Sons. Farquhar, Peter H. (1989), “Managing Brand Equity.” Marketing Research 1 (September), 24-33.
Zyman Institute of Brand Science
30

Farris, Paul, and David Reibstein (1995), “Market Share and Distribution: A Generalization, a Speculation, and Some Implications.” Marketing Science 14 (3) (part 2 of 2). Farris, Paul and David Reibstein (2004) “Marketing Dashboards” Wharton Working Paper. Farris, P. W., N. Bendle, P. Pfeifer, and D. J. Reibstein (2006), “Marketing Metrics”, Book being revised for publication. Fornell, Claes (1995), "The Quality of Economic Output: Empirical Generalizations about its Distribution and Relationship to Market Share," Marketing Science, 13(3), 203-211. Fournier, S. (1998), “Consumers and Their Brands: Developing Relationship Theory in Consumer Research.” Journal of Consumer Research 24(4), 343-74. Gatignon, Hubert, Jehoshua Eliashberg, and Thomas S. Robertson (1989) “Modeling Multinational Diffusion Patterns: An Efficient Methodology,” Marketing Science, 8:3, 231-47. Geyskens, Inge, Katrijn Gielens, and Marnik G. Dekimpe (2002) “The Market Valuation of Internet Channel Additions,” Journal of Marketing, 66:2, 102-19. Golder, Peter N. and Gerard J. Tellis (1997) “Will It Ever Fly? Modeling the takeoff of Really New Consumer Durables,” Marketing Science, 16:3, 256-70. Gupta, Sunil, Donald R. Lehmann and Jennifer Ames Stuart (2004), Valuing Customers, Journal of Marketing Research, XLI (February), 7-18 Gupta, Sunil and Donald R. Lehmann (2005), Managing Customers as Investments, Wharton Publishing/Pearson-Financial Times. Hauser, John and Gerard J. Tellis (2004) “Research on Innovation: A Review and Agenda for Marketing,” working paper. Hirschey, Mark (1982) “Intangible Capital Aspects of Advertising and R&D Expenditures,” Journal of Industrial Economics, 30, June, 375-90. Hogan, John E., Donald R. Lehmann, Maria Merino, Rajendra K. Srivastava, Jacquelyn S. Thomas, and Peter C. Verhoef (2002), “Linking Customer Assets to Financial Performance.” Journal of Service Research 5 (1), 26-38. Interbrand Group (1992), World’s Greatest Brands: An International Review. New York, N.Y.: John Wiley. Interbrand Group (2004). About the Value of Valuation. Amsterdam, The Netherlands: Interbrand Zintzmeyer & Lux. Ip, Greg. (2004), “The Rise and Fall of Intangible Assets Leads to Shorter Company Life Spans.” The Wall Street Journal (April 4)
Zyman Institute of Brand Science
31
Ittner, Christopher and David Larcker (1998) “Are Non-financial Measures Leading Indicators of Financial Performance? An Analysis of Customer Satisfaction,” Journal of Accounting Research, 36, Supplement, 1-35. Jain, D., and S. S. Singh (2002), “Customer Lifetime Value Research in Marketing: A Review and Future Directions,” Journal of Interactive Research16 (4), 34-46. Joshi, Amit and Dominique M. Hanssens (2004) “Advertising Spending and Market Capitalization,” February, UCLA Marketing Studies Center, working paper. Keller, Kevin L., and David A. Aaker (1993), “The Effects of Sequential Introductions of Brand Extensions.” Journal of Marketing Research 29 (February), 35-50. Keller, Kevin Lane (2002), Branding and Brand Equity. Cambridge, Mass.: Marketing Science Institute. Keller, Kevin Lane, and Donald Lehmann (2003), “The Brand Value Chain: Optimizing Strategic and Financial Brand Performance.” Marketing Management, (May/June). Koku, Paul S., Harsharanjeet S. Jagpal, and P.V. Viswanath (1997) “The Effect of New Product Announcements and Preannouncements on Stock Price,” Journal of Market-Focused Management, 2, November, 183-99. Lane, Vicki, and Robert Jacobsen (1995), “Stock Market Reactions to Brand Extension Announcements: The Effects of Brand Attitude and Familiarity.” Journal of Marketing 59 (1) (January), 63-77. Lodish, Leonard M., Magid Abraham, S. Kalmenson, J. Livelsberger, Beth Lubetkin, B. Richardson, and M.E. Stevens (1995) “How TV Advertising Works: A Meta-Analysis of 389 Real World Split Cable TV Advertising Experiments,” Journal of Marketing Research, 32, May, 125-39. Lusch, Robert F., and Michael G. Harvey (1984), “Opinion: The Case for an Off-Balance-Sheet Controller.” Sloan Management Review (Winter), 101-5. Martin, John, and William Petty (2000), Value Based Management: The Corporate Response to the Shareholder Revolution. Boston, Mass.: Harvard Business School Press. Mela, Carl F., Sunil Gupta, and Donald R. Lehmann (1997) “The Long-Term Impact of Promotion and Advertising on Consumer Brand Choice,” Journal of Marketing Research, 34:2, 248-61. McAlister, Leigh (2004), Practical Communication of Marketing’s Promise, Working Paper, University of Texas at Austin, November Merino, Maria, Raji Srinivasan and Rajendra Srivastava (2006), Advertising, Research and Development and Variability of Cash Flow and Shareholder Value, Working Paper, Emory University Minton, B., and C Schrand (1999), “The Impact of Cash Flow Volatility on Discretiianry Investment and the Costs of Debt and Equity Financing.” Journal of Financial Economics 54, 423-60.
Zyman Institute of Brand Science
32
Mizik, Natalie, and Robert Jacobson (2003), “Trading Off between Value Creation and Value Appropriation: The Financial Implications of Shifts in Strategic Emphasis.” Journal of Marketing 67 (1), 63-76. Moorman, Christine, Rohit Deshpande, and Gerald Zaltman (1993) “Factors Affecting Trust in Market Relationships,” Journal of Marketing, 57, January, 81-101. Moorman, Christine, Gerald Zaltman, and Rohit Deshpande (1992) “Relationships Between Providers and Users of Market Research: The Dynamics of Trust Within and Between Organizations,” Journal of Marketing Research, 29, August, 314-29. Narayanan, Sridhar, Ramarao Desiraju, and Pradeep K. Chintagunta (2004) “Return on Investment Implications for Pharmaceutical Promotional Expenditures: The Role of Marketing Mix Interactions,” Journal of Marketing, 68, October, 90-105. Neslin, Scott A. (2002) Sales Promotion. Cambridge, MA: Marketing Science Institute. Pardue, J. Harold, Eric Higgins, and Tim Biggart (2000) “The Impact of New Product Announcements on Firm Value in Information Technology Producing Industries: An Examination of Industry-Level Evolutionary Eras,” The Engineering Economist, 45:2, 144-57. Pauwels, Koen, Jorge Silva-Risso, Shuba Srinivasan, and Dominique M. Hanssens (2004) “New Products, Sales Promotions, and Firm Value: The Case of the Automobile Industry,” Journal of Marketing, 68, October, 142-56. Randall, Taylor, Karl Ulrich, and David Reibstein (1998), “Brand Equity and Vertical Product. Line Extent,” Marketing Science, 17 (4), 356–379. Rao, Vithala R., Manoj K. Agrawal, and Denise Dahlhoff (2004) “How is Manifest Branding Strategy Related to the Intangible Value of a Corporation?” Journal of Marketing, 68, October, 126-41. Reichheld, Frederich (2001), The Loyalty Effect: The Hidden Force Behind Growth, Profits, & Lasting Value, Harvard Business School Press. Reinartz, Werner, and V. Kumar (2000), “On the Profitability of Long Lifetime Customers: An Empirical Investigation and Implications for Marketing.” Journal of Marketing 64 (4), 17-35. Reinartz, Werner, and V. Kumar (2003), “The Impact of Customer Relationship Characteristics on Profitable Lifetime Duration.” Journal of Marketing 67 (1), 77-99. Roberts, Peter W. (2001), “Innovation and Firm-Level Persistent Profitability: A Schumpeterian Framework.” Managerial and Decision Economics 22, 239-50. Reinartz, Werner, Manfred Krafft and Wayne Hoyer (2004), The Customer Relationship Management Process: Its Measurement and Impact on Performance, Journal of Marketing Research, XLI (August), 293-305
Zyman Institute of Brand Science
33

Rust, Roland T., Valarie A. Zeithaml, and Katherine N. Lemon (2000), Driving Customer Equity: How Customer Lifetime Value is Reshaping Corporate Strategy. New York, N.Y.: Free Press. Rust, Roland T., Katherine N. Lemon and Valerie A. Ziethaml (2004), Return on Marketing: Using Customer Equity to Focus Marketing Strategy, Journal of Marketing, 68 (January), 109-127 Rust, Roland T., Christine Moorman, and Peter R. Dickson (2002), “Getting Return on Quality: Cost Reduction, Revenue Expansion, or Both?” Journal of Marketing 66 (October), 7-24. Rust, Roland T., Tim Ambler, Gregory S. Carpenter, V. Kumar, and Rajendra K. Srivastava (2004) “Measuring Marketing Productivity: Current Knowledge and Future Directions,” Journal of Marketing, 68, October, 76-89. Simon, Carol J., and Mary W. Sullivan (1993), “The Measurement and Determination of Brand Equity.” Marketing Science 12 (1), 28-52. Sinha, Ashish, Mukesh Bhargava and Rajendra Srivastava (2006), Return on Marketing Investment: Integrating Tactical and Strategic Actions, Working Paper, Emory University, March Srinivasan, Shuba, Koen Pauwels, Dominique M. Hanssens and Marnik G. Dekimpe (2004), Do Promotions Benefit Manufacturers, Retailer or Both?, Management Science, 50, 4 (May), 617-629 Srinivasan, Raji, Arvind Rangaswamy and Gary L. Lilien (2005), “Turning Adversity Into Advantage: Does Proactive Marketing During a Recession Pay Off?”, International Journal of Research in Marketing, 22, 109-125 Srivastava, R., Tasadduq Shervani, and Liam Fahey (1997), “Driving Shareholder Value: The Role of Marketing in Reducing Vulnerability and Volatility of Cash Flows.” Journal of Market Focused Management 2, 49-64. Srivastava, Rajendra, Tasadduq Shervani, and Liam Fahey (1998). “Market-based Assets and Shareholder Value: A Framework for Analysis.” Journal of Marketing 62 (1), 2-18. Srivastava, Rajendra, Tasadduq Shervani, and Liam Fahey (1999), “Marketing, Business Processes, and Shareholder Value: An Organizationally Embedded View of Marketing Activities and the Discipline of Marketing.” Journal of Marketing 63 (Special Issue): 168-79. Srivastava, Rajendra, Liam Fahey, and Kurt Christiansen (2001) “Resource-Based View and Marketing” Journal of Management,27, 777-802. Sultan, Fareena, John U. Farley, and Donald R. Lehmann (1990) “A Meta-Analysis of Applications of Diffusion Models,” Journal of Marketing Research, 27, February, 70-77.
Zyman Institute of Brand Science
34

Veliyath, Rajaram, and Stephen Ferris (1997), “Agency Influences on Risk Reduction and Operating Performance: An Empirical Investigation Among Strategic Groups.” Journal of Business Research 39, 219-30.
Zyman Institute of Brand Science
35

Our Mission The Zyman Institute of Brand Science pursues the advancement of brand-driven business performance. Founded in 2004, the Zyman Institute of Brand Science is the definitive source for cutting-edge knowledge and thinking about brands. The Institute is an independently managed organization within the Goizueta Business School at Emory University. Who we work with The Institute works with top management teams to solve pressing issues in brand strategy. What we do The Institute’s lauded scholars lead the development of new knowledge and insights for building, maintaining, enhancing, and revitalizing persistently profitable brands. We help companies link brand equity to business and shareholder value. We help management make decisions in managing brands to accelerate cash flows, enhance cash flows, and reduce vulnerability and volatility of cash flows, and optimize the long-term value of the organization. How we do it The Institute works collaboratively with its sponsors, other universities, research organizations, and its members to devise cross-disciplinary solutions for managing real world problems in brand strategy. We play an integrative role in problem solving, and capability building. We focus on viable actions Web: zibs.com About Emory University Emory University is an internationally recognized institution based in Atlanta that was founded over 150 years ago. Emory sustains top ranked programs in medicine, law, business, theology, nursing, public health, arts & sciences. It supports world-class research across its disciplines. Web: emory.edu About Goizueta Business School The Goizueta Business School was established in 1919 and is named for Roberto Goizueta, former president of The Coca-Cola Company. The school is considered a top-tier school and is consistently ranked in the top 20. It offers degrees in business including Bachelor, Master and PhD. Its Executive MBA is ranked 10 globally by both BusinessWeek and U.S. News. Web: goizueta.emory.edu
Contacts: For further information, please visit www.zibs.com or contact:
Zyman Institute of Brand Science Raj Srivastava
Executive Director Goizueta Business School Professor of Marketing
Phone: +1 (404) 727-4858 Emory University Email: [email protected] 1300 Clifton Road
Atlanta, Georgia 30322 USA Main: +1 (404) 727-9172 Fax: +1 (404) 727-1082 www.zibs.comWeb:
Business Facing Contacts Academic Facing Contacts
Greg Thomas Director of Research and Programs Sundar Bharadwaj Phone : +1 (404) 727-4613 Director of Academic Programs
Professor of Marketing Email: [email protected] Phone: 404-727-2646 Dana Page Email: [email protected] Program Manager Phone: +1 (404) 727-1078 Doug Bowman Email: [email protected] Director of Academic Programs
Professor of Marketing Phone: 404-727-4613 Reshma Shah
Director of Business Relations Email: [email protected] Assistant Professor of Marketing Phone: +1 (404) 727-6302 Sriram Venkataraman Email: [email protected] Director, Analytics Assistant Professor of Marketing Susan Hogan Phone: +1 (404) 727-5275
Email: [email protected] Director of Business Relations Assistant Professor of Marketing Phone: +1 (404) 727-5516 Ashish Sood Email: [email protected] Director, Analytics Assistant Professor of Marketing Leanne Fesenmeyer Phone: +1 (404) 727-4226
Email: [email protected] Director of Alliances Phone: +1 (770) 817-4141 Email: [email protected]
Zyman Institute of Brand Science
37